Embed Size (px)
Citation preview
Supplementary Information
Supplementary Table 1 Uranium-series data for calcite speleothems, Thylacoleo Caves
Supplementary Table 2 Dose rate data, palaeodoses and optical ages for sediment samples
from the Thylacoleo Caves
Supplementary Table 3 Palaeomagnetic data for sediments in Leaena’s Breath Cave
Supplementary Table 4 Modern species in the Thylacoleo Caves fauna and mean annual
rainfall bounds20 for reptiles and mammals
Supplementary Table 5 Occurrence data used for establishment of differences in Pleistocene
herbivore dietary guilds
Supplementary Table 6 Raw stable carbon and oxygen isotope data (δ13C, δ18O) from the
tooth enamel of modern kangaroos and wombats from southern Australia
Supplementary Table 7 Raw stable carbon and oxygen isotope data (δ13C, δ18O) from the
tooth enamel of Pleistocene kangaroos and a wombat from the Thylacoleo Caves
Supplementary Table 8 Examples of extant plants encountered in the peripheral regions of
the Nullarbor Plain that are selectively foraged by brushtail possums, emus, volant birds and
introduced placental herbivores, and their fire sensitivity
Supplementary Figure 1 238U-234Th isotope activity ratio plot for all measurements on
coralline bone coatings from Leaena’s Breath Cave
Supplementary Figure 2 Palaeomagnetism results from the test excavation in Leaena’s
Breath Cave, plotted as latitude of Virtual Geomagnetic Pole against sediment depth
Supplementary Figure 3 Histogram of middle Pleistocene fossil herbivore guilds, and map
of southern Australia
Supplementary Figure 4 Thylacoleo Caves and fossils
Supplementary Figure 5 Opening of Leaena’s Breath Cave entrance solution pipe
Supplementary Figure 6 View up the Leaena’s Breath Cave entrance solution pipe
SUPPLEMENTARY INFORMATION
doi: 10.1038/nature05471
1www.nature.com/naturewww.nature.com/nature 1
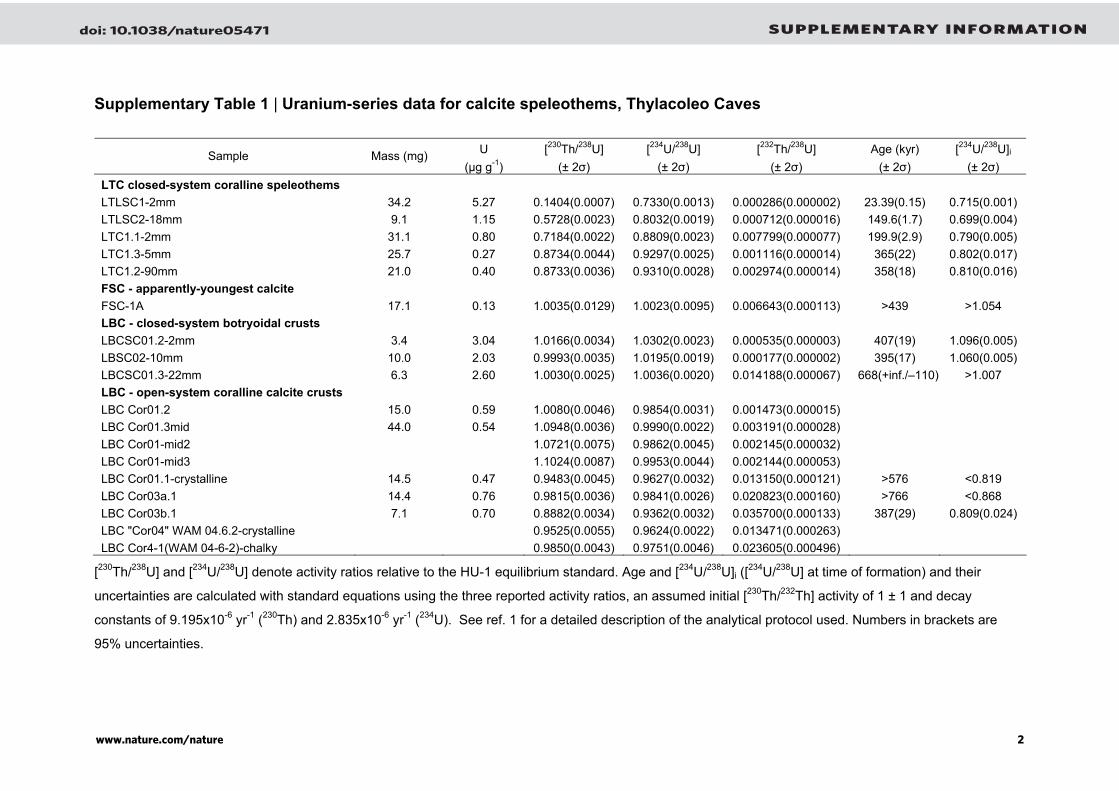
Supplementary Table 1 | Uranium-series data for calcite speleothems, Thylacoleo Caves
U [230Th/238U] [234U/238U] [232Th/238U] Age (kyr) [234U/238U]i Sample Mass (mg) (µg g-1) (± 2σ) (± 2σ) (± 2σ) (± 2σ) (± 2σ)
LTC closed-system coralline speleothems LTLSC1-2mm 34.2 5.27 0.1404(0.0007) 0.7330(0.0013) 0.000286(0.000002) 23.39(0.15) 0.715(0.001) LTLSC2-18mm 9.1 1.15 0.5728(0.0023) 0.8032(0.0019) 0.000712(0.000016) 149.6(1.7) 0.699(0.004) LTC1.1-2mm 31.1 0.80 0.7184(0.0022) 0.8809(0.0023) 0.007799(0.000077) 199.9(2.9) 0.790(0.005) LTC1.3-5mm 25.7 0.27 0.8734(0.0044) 0.9297(0.0025) 0.001116(0.000014) 365(22) 0.802(0.017) LTC1.2-90mm 21.0 0.40 0.8733(0.0036) 0.9310(0.0028) 0.002974(0.000014) 358(18) 0.810(0.016) FSC - apparently-youngest calcite FSC-1A 17.1 0.13 1.0035(0.0129) 1.0023(0.0095) 0.006643(0.000113) >439 >1.054 LBC - closed-system botryoidal crusts LBCSC01.2-2mm 3.4 3.04 1.0166(0.0034) 1.0302(0.0023) 0.000535(0.000003) 407(19) 1.096(0.005) LBSC02-10mm 10.0 2.03 0.9993(0.0035) 1.0195(0.0019) 0.000177(0.000002) 395(17) 1.060(0.005) LBCSC01.3-22mm 6.3 2.60 1.0030(0.0025) 1.0036(0.0020) 0.014188(0.000067) 668(+inf./–110) >1.007 LBC - open-system coralline calcite crusts LBC Cor01.2 15.0 0.59 1.0080(0.0046) 0.9854(0.0031) 0.001473(0.000015) LBC Cor01.3mid 44.0 0.54 1.0948(0.0036) 0.9990(0.0022) 0.003191(0.000028) LBC Cor01-mid2 1.0721(0.0075) 0.9862(0.0045) 0.002145(0.000032) LBC Cor01-mid3 1.1024(0.0087) 0.9953(0.0044) 0.002144(0.000053) LBC Cor01.1-crystalline 14.5 0.47 0.9483(0.0045) 0.9627(0.0032) 0.013150(0.000121) >576 <0.819 LBC Cor03a.1 14.4 0.76 0.9815(0.0036) 0.9841(0.0026) 0.020823(0.000160) >766 <0.868 LBC Cor03b.1 7.1 0.70 0.8882(0.0034) 0.9362(0.0032) 0.035700(0.000133) 387(29) 0.809(0.024) LBC "Cor04" WAM 04.6.2-crystalline 0.9525(0.0055) 0.9624(0.0022) 0.013471(0.000263) LBC Cor4-1(WAM 04-6-2)-chalky 0.9850(0.0043) 0.9751(0.0046) 0.023605(0.000496)
[230Th/238U] and [234U/238U] denote activity ratios relative to the HU-1 equilibrium standard. Age and [234U/238U]i ([234U/238U] at time of formation) and their
uncertainties are calculated with standard equations using the three reported activity ratios, an assumed initial [230Th/232Th] activity of 1 ± 1 and decay
constants of 9.195x10⁻⁶ yr-1 (230Th) and 2.835x10⁻⁶ yr-1 (234U). See ref. 1 for a detailed description of the analytical protocol used. Numbers in brackets are
95% uncertainties.
2www.nature.com/nature
doi: 10.1038/nature05471 SUPPLEMENTARY INFORMATION
www.nature.com/nature 2
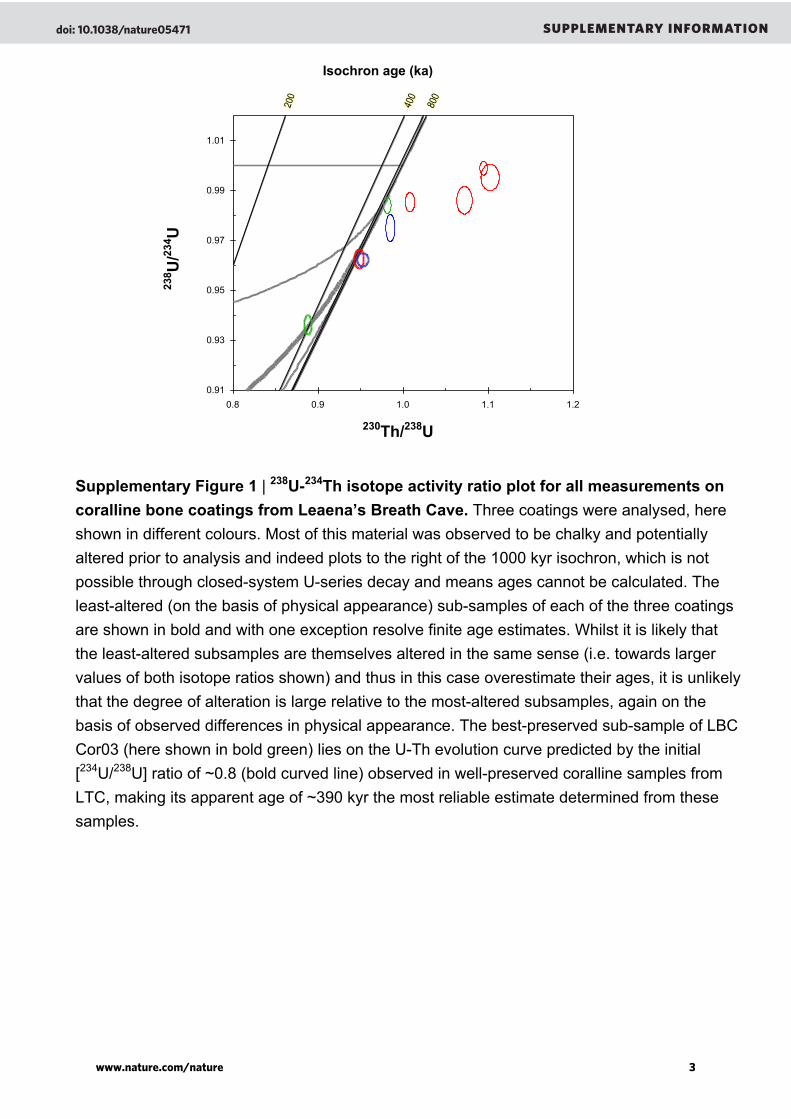
Supplementary Figure 1 | 238U-234Th isotope activity ratio plot for all measurements on coralline bone coatings from Leaena’s Breath Cave. Three coatings were analysed, here shown in different colours. Most of this material was observed to be chalky and potentially altered prior to analysis and indeed plots to the right of the 1000 kyr isochron, which is not possible through closed-system U-series decay and means ages cannot be calculated. The least-altered (on the basis of physical appearance) sub-samples of each of the three coatings are shown in bold and with one exception resolve finite age estimates. Whilst it is likely that the least-altered subsamples are themselves altered in the same sense (i.e. towards larger values of both isotope ratios shown) and thus in this case overestimate their ages, it is unlikely that the degree of alteration is large relative to the most-altered subsamples, again on the basis of observed differences in physical appearance. The best-preserved sub-sample of LBC Cor03 (here shown in bold green) lies on the U-Th evolution curve predicted by the initial [234U/238U] ratio of ~0.8 (bold curved line) observed in well-preserved coralline samples from LTC, making its apparent age of ~390 kyr the most reliable estimate determined from these samples.
0.91
0.93
0.95
0.97
0.99
1.01
0.8 0.9 1.0 1.1 1.2
230Th/238U
238 U
/234 U
Isochron age (ka)
2www.nature.com/nature
doi: 10.1038/nature05471 SUPPLEMENTARY INFORMATION
www.nature.com/nature 3
Optical dating
Optical dating provides an estimate of the time elapsed since luminescent minerals, such as
quartz, were last exposed to sunlight2–4. In this study, therefore, the event being dated is the time of
entry of the sediment grains into the Thylacoleo Caves. Buried grains will accumulate the effects of the
nuclear radiation flux to which they are exposed, and the burial dose (palaeodose) can be estimated
using the optically stimulated luminescence (OSL) signal. Optical ages were calculated from the
palaeodose divided by the dose rate due to ionising radiation (Supp. Table 2).
We extracted quartz grains of 90–125 µm diameter from the sediment samples under dim red
illumination using standard procedures, including etching by hydrofluoric acid to remove the external
alpha-dosed layer2. Palaeodoses were obtained from aliquots composed of between ~8 and ~800 grains
(to check for insufficient bleaching of the quartz grains at deposition), using the single-aliquot
regenerative-dose protocol, statistical models and experimental apparatus described elsewhere5,6.
Aliquots were stimulated using either blue (470 nm) or green-plus-blue (420–550 nm) light for
100 s at 125 °C, after a preheat of 160–300 °C for 10 s (or a cut-heat to 160 °C for test doses). The
ultraviolet emissions were detected by an Electron Tubes Ltd 9635QA or 9235QA photomultiplier tube
fitted with 7.5 mm of Hoya U-340 filter, and laboratory doses were given using a calibrated 90Sr/90Y
beta source. Palaeodoses were determined from the first 3 s of OSL, using the final 30 s as background.
Standards tests of protocol performance were made (e.g., preheat plateau and dose recovery tests,
and checks on thermal transfer and test-dose sensitivity correction), which revealed no significant
problems for any samples. In addition, samples were analysed at two OSL laboratories using different
instruments, and the resulting palaeodoses were in agreement.
For four of the samples (FS02, LT02, LB01 and LB02), the natural OSL signals from most
aliquots were saturated with respect to dose, so only minimum (infinite) palaeodoses and ages could be
obtained. By contrast, some aliquots of samples FS04 and LT01 gave palaeodoses well below the
saturation limit (~200 Gy). A minimum age model5 was used to estimate the smallest finite palaeodose
for each sample. This conservative approach takes into account any bias due to small palaeodoses for
aliquots composed of grains that experienced below-average beta dose rates, as can occur in limestone
cave deposits7.
A pulsed-irradiation regeneration technique8 was applied to sample LB02 to ensure that the
palaeodoses had not been overestimated; no reduction in palaeodose was achieved. Additional tests
were made on sample LB02 in an attempt to measure larger finite palaeodoses. A search was made for
individual ‘supergrains’ of quartz9, and other proposed methods for extending the age range of
luminescence dating were also explored10–12, but without success.
The total dose rate for each sample was calculated as the sum of the beta and gamma dose rates
due to 238U, 235U, 232Th (and their decay products) and 40K (making allowance for beta-dose
2www.nature.com/nature
doi: 10.1038/nature05471 SUPPLEMENTARY INFORMATION
www.nature.com/nature 4
attenuation13 and sample water content14), which were deduced from the radionuclide activities
measured by high-resolution gamma-ray spectrometry15. Account was also taken of the cosmic-ray
contribution (adjusted for site altitude, geomagnetic latitude, and thickness of rock and sediment
overburden)16 and the effective internal alpha dose rate (estimated from measurements made previously
on quartz grains from southeastern Australia17). Gamma rays can penetrate up to 30 cm through most
soils and sediment, but none of the samples was buried this deeply. Accordingly, the gamma dose rate
for each sample was adjusted using Table H.1 of ref. 14.
For all samples, a condition of secular equilibrium currently exists in the 232Th decay series, as is
commonly the case for Australian terrestrial sediments7,15, but the 238U decay series is in disequilibrium.
The 210Pb/226Ra ratios are consistent with 11–35% loss of radon (222Rn) gas to atmosphere, as observed
previously for cave sediments on the Nullarbor Plain7; we assume that the measured ratios prevailed
throughout the period of sample burial. Samples FS02, LT01, LT02 and LB02 also exhibit 13–35%
excess of 238U with respect to 226Ra, which we attribute to the incorporation of bone in the sediment
samples and the absorption of uranium by bone after burial. But the presence of excess uranium of this
magnitude has a negligible effect on the total dose rate7,15 and would, in any case, make the optical ages
appear younger. Hence, use of the minimum age model is appropriate in this context also.
2www.nature.com/nature
doi: 10.1038/nature05471 SUPPLEMENTARY INFORMATION
www.nature.com/nature 5
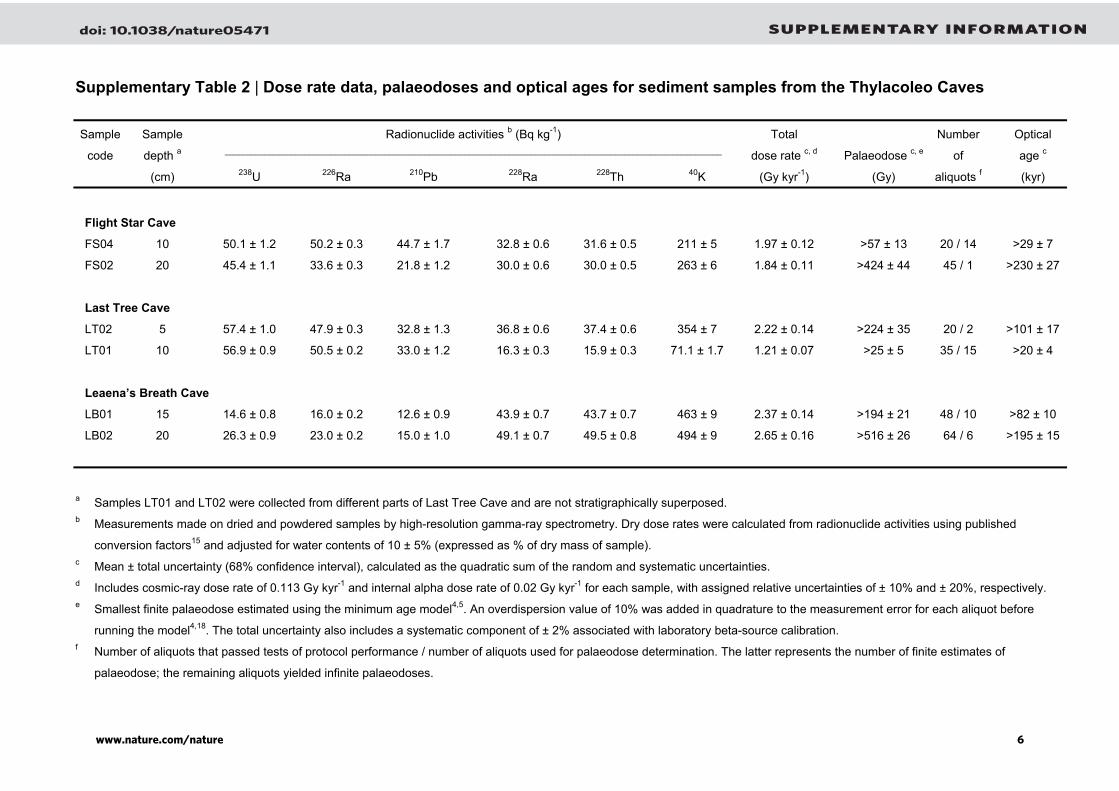
Supplementary Table 2 | Dose rate data, palaeodoses and optical ages for sediment samples from the Thylacoleo Caves
Sample Sample Radionuclide activities b (Bq kg-1) Total Number Optical
code depth a ________________________________________________________________________________________________________________ dose rate c, d Palaeodose c, e of age c
(cm) 238U 226Ra 210Pb 228Ra 228Th 40K (Gy kyr-1) (Gy) aliquots f (kyr)
Flight Star Cave
FS04 10 50.1 ± 1.2 50.2 ± 0.3 44.7 ± 1.7 32.8 ± 0.6 31.6 ± 0.5 211 ± 5 1.97 ± 0.12 >57 ± 13 20 / 14 >29 ± 7
FS02 20 45.4 ± 1.1 33.6 ± 0.3 21.8 ± 1.2 30.0 ± 0.6 30.0 ± 0.5 263 ± 6 1.84 ± 0.11 >424 ± 44 45 / 1 >230 ± 27
Last Tree Cave
LT02 5 57.4 ± 1.0 47.9 ± 0.3 32.8 ± 1.3 36.8 ± 0.6 37.4 ± 0.6 354 ± 7 2.22 ± 0.14 >224 ± 35 20 / 2 >101 ± 17
LT01 10 56.9 ± 0.9 50.5 ± 0.2 33.0 ± 1.2 16.3 ± 0.3 15.9 ± 0.3 71.1 ± 1.7 1.21 ± 0.07 >25 ± 5 35 / 15 >20 ± 4
Leaena’s Breath Cave
LB01 15 14.6 ± 0.8 16.0 ± 0.2 12.6 ± 0.9 43.9 ± 0.7 43.7 ± 0.7 463 ± 9 2.37 ± 0.14 >194 ± 21 48 / 10 >82 ± 10
LB02 20 26.3 ± 0.9 23.0 ± 0.2 15.0 ± 1.0 49.1 ± 0.7 49.5 ± 0.8 494 ± 9 2.65 ± 0.16 >516 ± 26 64 / 6 >195 ± 15
a Samples LT01 and LT02 were collected from different parts of Last Tree Cave and are not stratigraphically superposed. b Measurements made on dried and powdered samples by high-resolution gamma-ray spectrometry. Dry dose rates were calculated from radionuclide activities using published
conversion factors15 and adjusted for water contents of 10 ± 5% (expressed as % of dry mass of sample). c Mean ± total uncertainty (68% confidence interval), calculated as the quadratic sum of the random and systematic uncertainties. d Includes cosmic-ray dose rate of 0.113 Gy kyr-1 and internal alpha dose rate of 0.02 Gy kyr-1 for each sample, with assigned relative uncertainties of ± 10% and ± 20%, respectively. e Smallest finite palaeodose estimated using the minimum age model4,5. An overdispersion value of 10% was added in quadrature to the measurement error for each aliquot before
running the model4,18. The total uncertainty also includes a systematic component of ± 2% associated with laboratory beta-source calibration. f Number of aliquots that passed tests of protocol performance / number of aliquots used for palaeodose determination. The latter represents the number of finite estimates of
palaeodose; the remaining aliquots yielded infinite palaeodoses.
2www.nature.com/nature
doi: 10.1038/nature05471 SUPPLEMENTARY INFORMATION
www.nature.com/nature 6
0
20
40
60
80
100
120
-90 0 90
Latitude of VGP (deg)D
epth
(cm
)
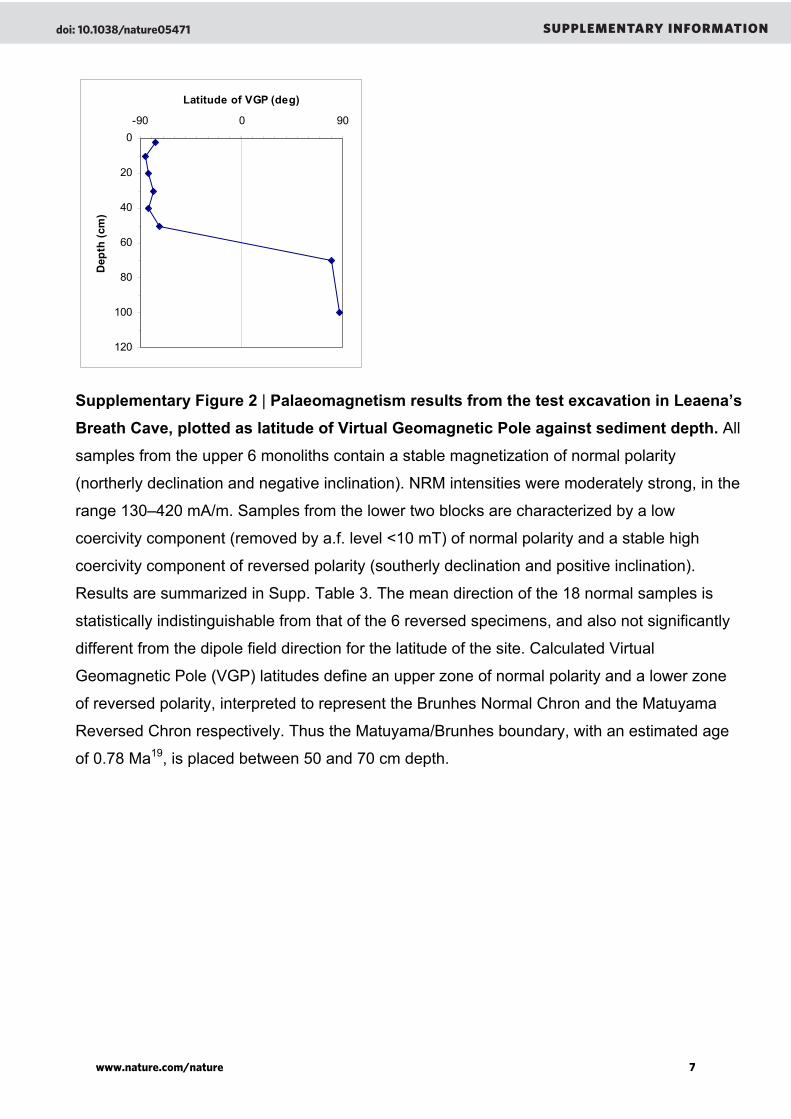
Supplementary Figure 2 | Palaeomagnetism results from the test excavation in Leaena’s Breath Cave, plotted as latitude of Virtual Geomagnetic Pole against sediment depth. All
samples from the upper 6 monoliths contain a stable magnetization of normal polarity
(northerly declination and negative inclination). NRM intensities were moderately strong, in the
range 130–420 mA/m. Samples from the lower two blocks are characterized by a low
coercivity component (removed by a.f. level <10 mT) of normal polarity and a stable high
coercivity component of reversed polarity (southerly declination and positive inclination).
Results are summarized in Supp. Table 3. The mean direction of the 18 normal samples is
statistically indistinguishable from that of the 6 reversed specimens, and also not significantly
different from the dipole field direction for the latitude of the site. Calculated Virtual
Geomagnetic Pole (VGP) latitudes define an upper zone of normal polarity and a lower zone
of reversed polarity, interpreted to represent the Brunhes Normal Chron and the Matuyama
Reversed Chron respectively. Thus the Matuyama/Brunhes boundary, with an estimated age
of 0.78 Ma19, is placed between 50 and 70 cm depth.
2www.nature.com/nature
doi: 10.1038/nature05471 SUPPLEMENTARY INFORMATION
www.nature.com/nature 7
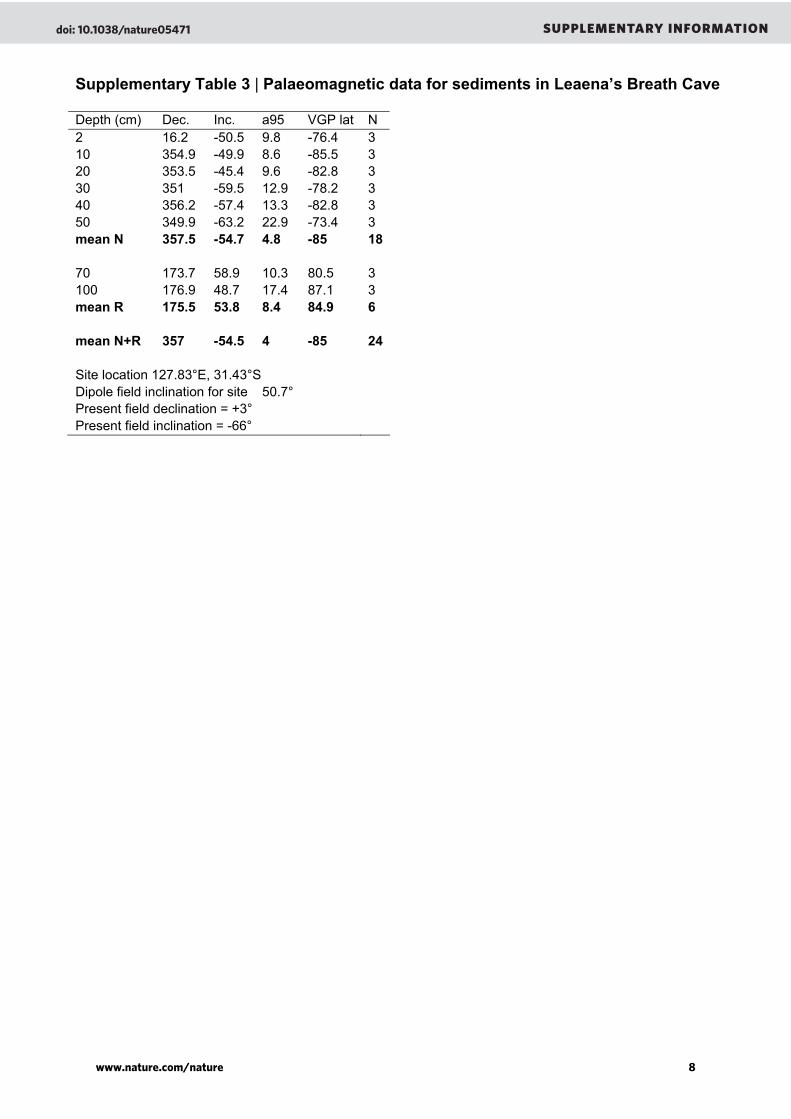
Supplementary Table 3 | Palaeomagnetic data for sediments in Leaena’s Breath Cave Depth (cm) Dec. Inc. a95 VGP lat N 2 16.2 -50.5 9.8 -76.4 3 10 354.9 -49.9 8.6 -85.5 3 20 353.5 -45.4 9.6 -82.8 3 30 351 -59.5 12.9 -78.2 3 40 356.2 -57.4 13.3 -82.8 3 50 349.9 -63.2 22.9 -73.4 3 mean N 357.5 -54.7 4.8 -85 18 70 173.7 58.9 10.3 80.5 3 100 176.9 48.7 17.4 87.1 3 mean R 175.5 53.8 8.4 84.9 6 mean N+R 357 -54.5 4 -85 24 Site location 127.83°E, 31.43°S Dipole field inclination for site 50.7° Present field declination = +3° Present field inclination = -66°
2www.nature.com/nature
doi: 10.1038/nature05471 SUPPLEMENTARY INFORMATION
www.nature.com/nature 8
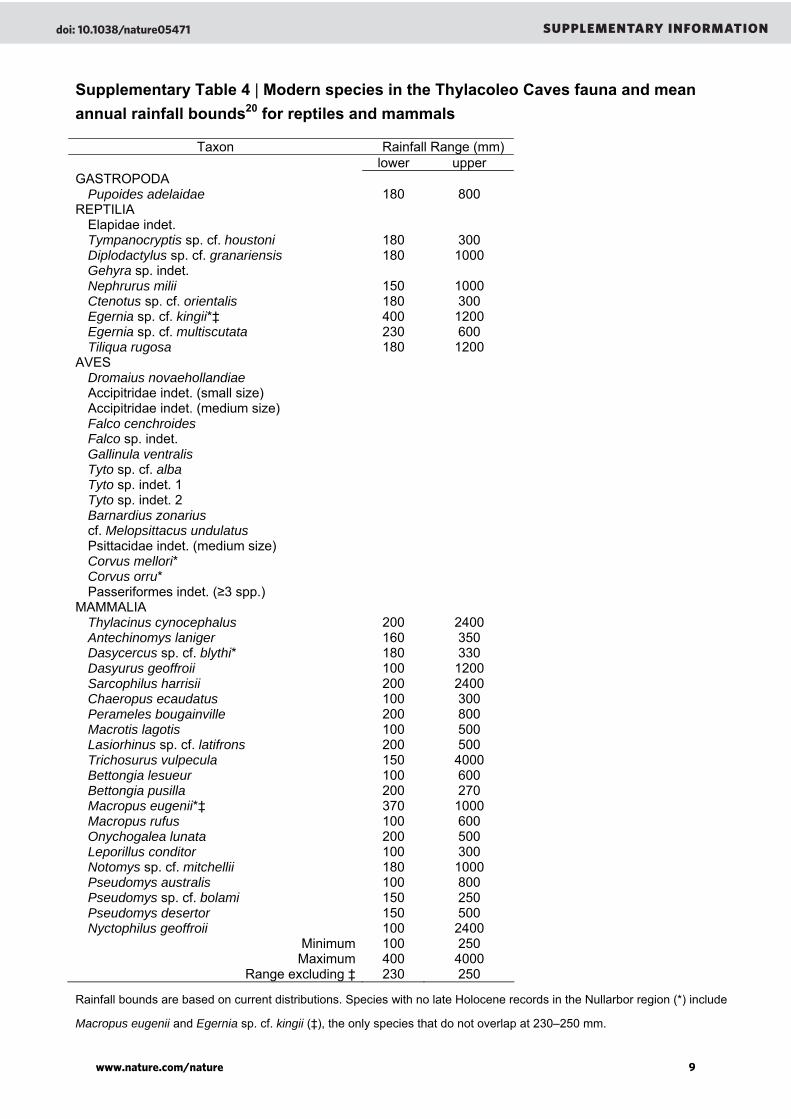
Supplementary Table 4 | Modern species in the Thylacoleo Caves fauna and mean annual rainfall bounds20 for reptiles and mammals
Taxon Rainfall Range (mm) lower upper GASTROPODA
Pupoides adelaidae 180 800 REPTILIA
Elapidae indet. Tympanocryptis sp. cf. houstoni 180 300 Diplodactylus sp. cf. granariensis 180 1000 Gehyra sp. indet. Nephrurus milii 150 1000 Ctenotus sp. cf. orientalis 180 300 Egernia sp. cf. kingii*‡ 400 1200 Egernia sp. cf. multiscutata 230 600 Tiliqua rugosa 180 1200
AVES Dromaius novaehollandiae Accipitridae indet. (small size) Accipitridae indet. (medium size) Falco cenchroides Falco sp. indet. Gallinula ventralis Tyto sp. cf. alba Tyto sp. indet. 1 Tyto sp. indet. 2 Barnardius zonarius cf. Melopsittacus undulatus Psittacidae indet. (medium size) Corvus mellori* Corvus orru* Passeriformes indet. (≥3 spp.)
MAMMALIA Thylacinus cynocephalus 200 2400 Antechinomys laniger 160 350 Dasycercus sp. cf. blythi* 180 330 Dasyurus geoffroii 100 1200 Sarcophilus harrisii 200 2400 Chaeropus ecaudatus 100 300 Perameles bougainville 200 800 Macrotis lagotis 100 500 Lasiorhinus sp. cf. latifrons 200 500 Trichosurus vulpecula 150 4000 Bettongia lesueur 100 600 Bettongia pusilla 200 270 Macropus eugenii*‡ 370 1000 Macropus rufus 100 600 Onychogalea lunata 200 500 Leporillus conditor 100 300 Notomys sp. cf. mitchellii 180 1000 Pseudomys australis 100 800 Pseudomys sp. cf. bolami 150 250 Pseudomys desertor 150 500 Nyctophilus geoffroii 100 2400
Minimum 100 250 Maximum 400 4000
Range excluding ‡ 230 250
Rainfall bounds are based on current distributions. Species with no late Holocene records in the Nullarbor region (*) include
Macropus eugenii and Egernia sp. cf. kingii (‡), the only species that do not overlap at 230–250 mm.
2www.nature.com/nature
doi: 10.1038/nature05471 SUPPLEMENTARY INFORMATION
www.nature.com/nature 9
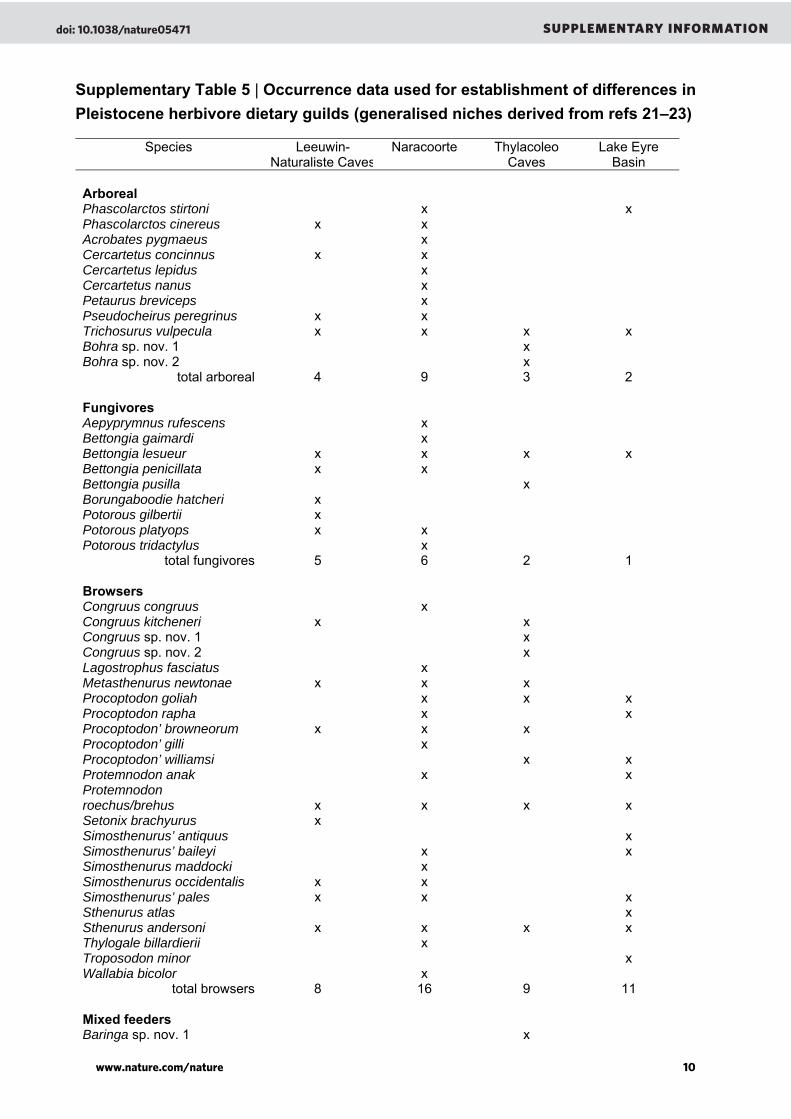
Supplementary Table 5 | Occurrence data used for establishment of differences in Pleistocene herbivore dietary guilds (generalised niches derived from refs 21–23)
Species
Leeuwin-Naturaliste Caves
Naracoorte
Thylacoleo Caves
Lake Eyre Basin
Arboreal Phascolarctos stirtoni x x Phascolarctos cinereus x x Acrobates pygmaeus x Cercartetus concinnus x x Cercartetus lepidus x Cercartetus nanus x Petaurus breviceps x Pseudocheirus peregrinus x x Trichosurus vulpecula x x x x Bohra sp. nov. 1 x Bohra sp. nov. 2 x
total arboreal 4 9 3 2 Fungivores Aepyprymnus rufescens x Bettongia gaimardi x Bettongia lesueur x x x x Bettongia penicillata x x Bettongia pusilla x Borungaboodie hatcheri x Potorous gilbertii x Potorous platyops x x Potorous tridactylus x
total fungivores 5 6 2 1 Browsers Congruus congruus x Congruus kitcheneri x x Congruus sp. nov. 1 x Congruus sp. nov. 2 x Lagostrophus fasciatus x Metasthenurus newtonae x x x Procoptodon goliah x x x Procoptodon rapha x x Procoptodon’ browneorum x x x Procoptodon’ gilli x Procoptodon’ williamsi x x Protemnodon anak x x Protemnodon roechus/brehus x x x x Setonix brachyurus x Simosthenurus’ antiquus x Simosthenurus’ baileyi x x Simosthenurus maddocki x Simosthenurus occidentalis x x Simosthenurus’ pales x x x Sthenurus atlas x Sthenurus andersoni x x x x Thylogale billardierii x Troposodon minor x Wallabia bicolor x
total browsers 8 16 9 11 Mixed feeders Baringa sp. nov. 1 x
2www.nature.com/nature
doi: 10.1038/nature05471 SUPPLEMENTARY INFORMATION
www.nature.com/nature 10
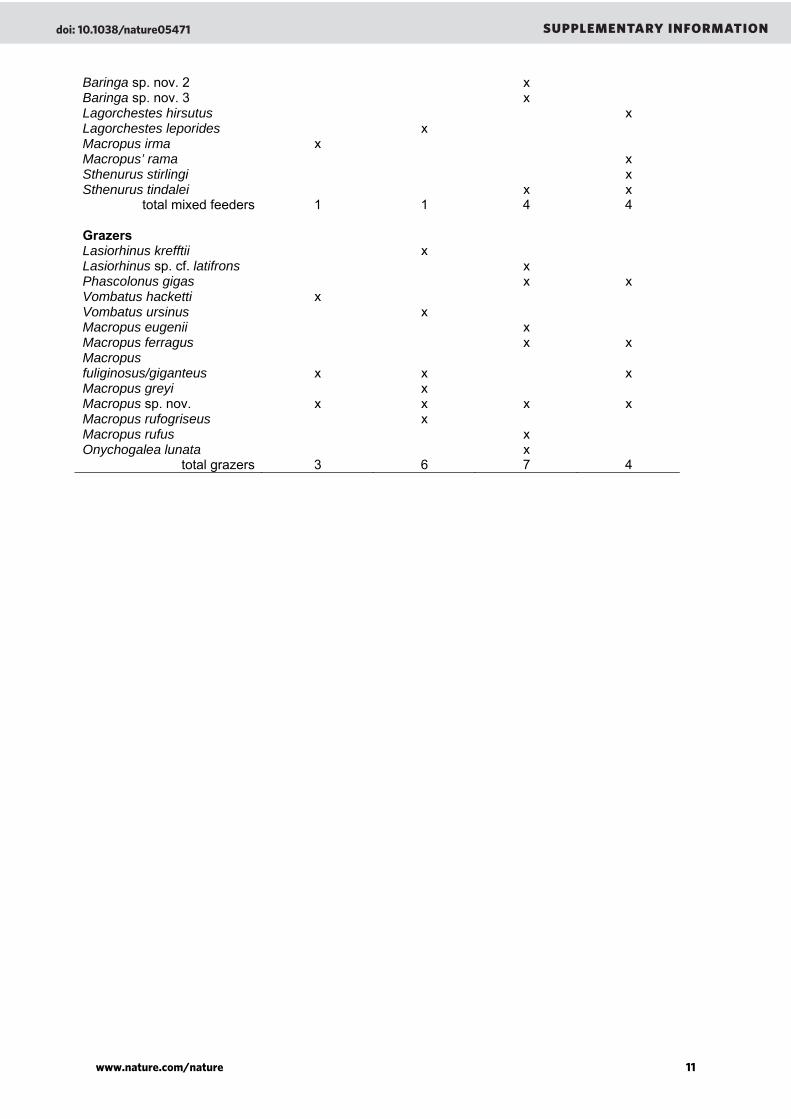
Baringa sp. nov. 2 x Baringa sp. nov. 3 x Lagorchestes hirsutus x Lagorchestes leporides x Macropus irma x Macropus’ rama x Sthenurus stirlingi x Sthenurus tindalei x x
total mixed feeders 1 1 4 4 Grazers Lasiorhinus krefftii x Lasiorhinus sp. cf. latifrons x Phascolonus gigas x x Vombatus hacketti x Vombatus ursinus x Macropus eugenii x Macropus ferragus x x Macropus fuliginosus/giganteus x x x Macropus greyi x Macropus sp. nov. x x x x Macropus rufogriseus x Macropus rufus x Onychogalea lunata x
total grazers 3 6 7 4
2www.nature.com/nature
doi: 10.1038/nature05471 SUPPLEMENTARY INFORMATION
www.nature.com/nature 11
0
10
20
30
40
50
60
Leeuwin-Naturaliste
NaracoorteCaves
ThylacoleoCaves
Lake EyreBasin
Prop
ortio
n (%
)Arboreal Fungi Brow ser Mixed Grazer
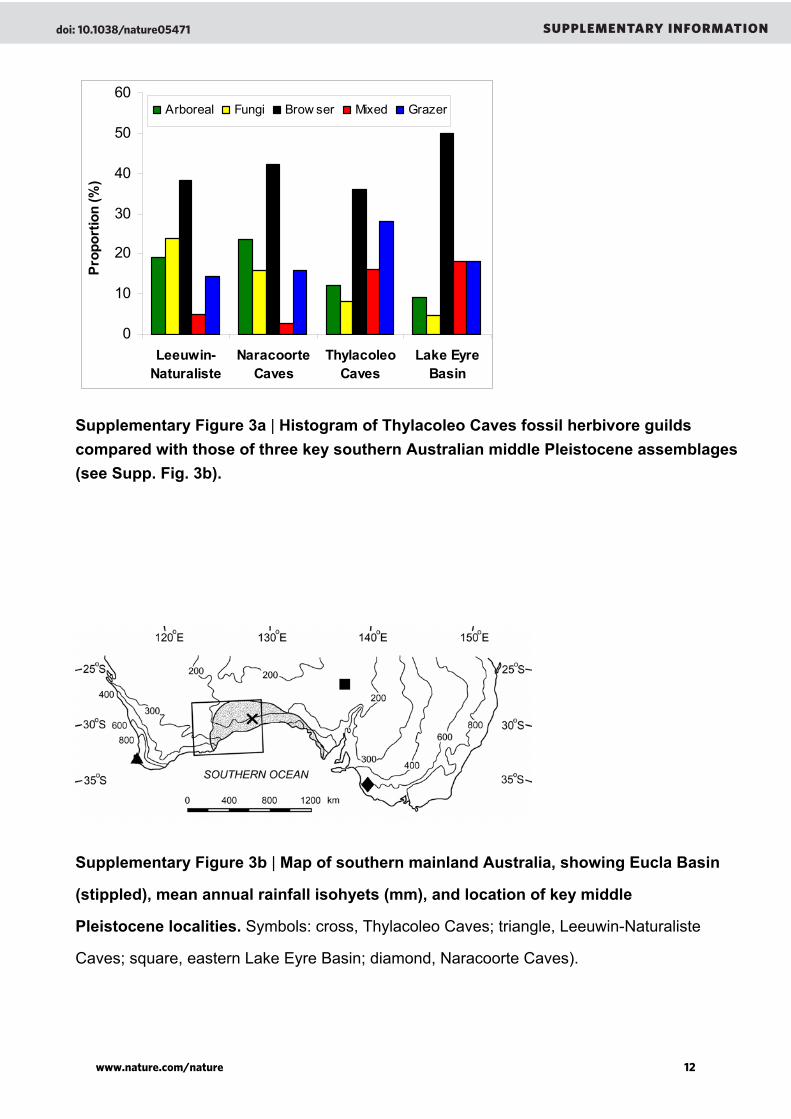
Supplementary Figure 3a | Histogram of Thylacoleo Caves fossil herbivore guilds compared with those of three key southern Australian middle Pleistocene assemblages (see Supp. Fig. 3b).
Supplementary Figure 3b | Map of southern mainland Australia, showing Eucla Basin
(stippled), mean annual rainfall isohyets (mm), and location of key middle
Pleistocene localities. Symbols: cross, Thylacoleo Caves; triangle, Leeuwin-Naturaliste
Caves; square, eastern Lake Eyre Basin; diamond, Naracoorte Caves).
2www.nature.com/nature
doi: 10.1038/nature05471 SUPPLEMENTARY INFORMATION
www.nature.com/nature 12
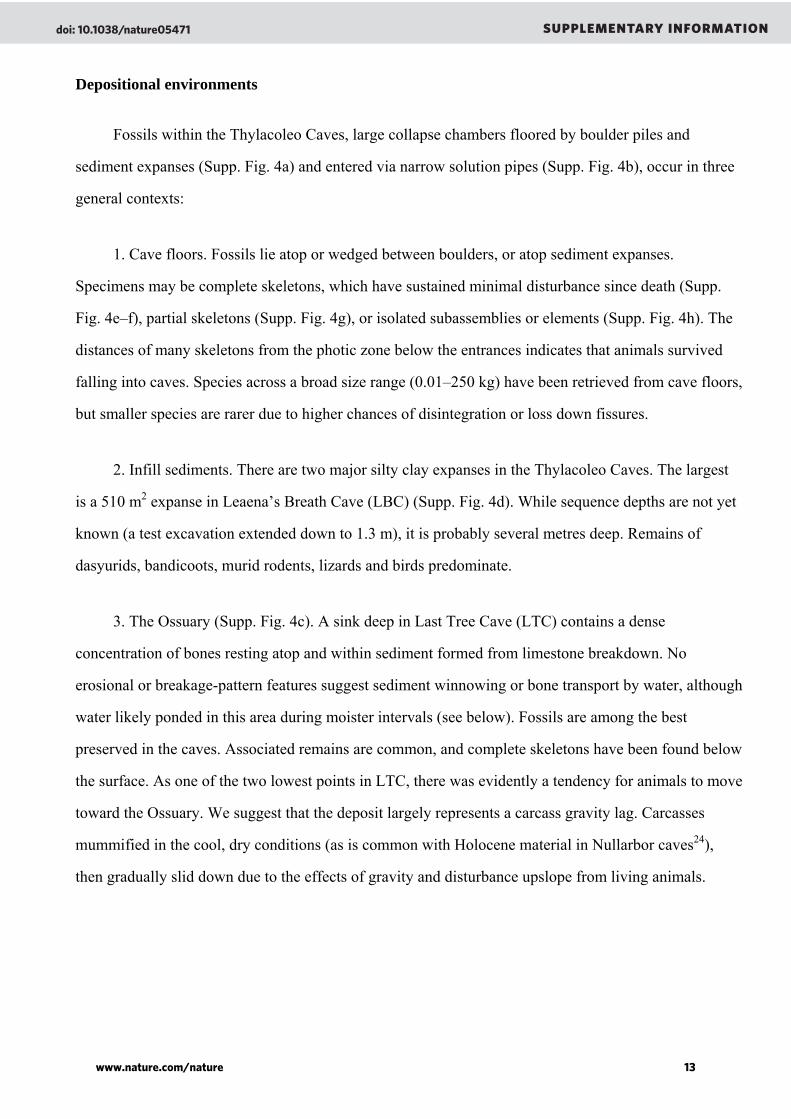
Depositional environments
Fossils within the Thylacoleo Caves, large collapse chambers floored by boulder piles and
sediment expanses (Supp. Fig. 4a) and entered via narrow solution pipes (Supp. Fig. 4b), occur in three
general contexts:
1. Cave floors. Fossils lie atop or wedged between boulders, or atop sediment expanses.
Specimens may be complete skeletons, which have sustained minimal disturbance since death (Supp.
Fig. 4e–f), partial skeletons (Supp. Fig. 4g), or isolated subassemblies or elements (Supp. Fig. 4h). The
distances of many skeletons from the photic zone below the entrances indicates that animals survived
falling into caves. Species across a broad size range (0.01–250 kg) have been retrieved from cave floors,
but smaller species are rarer due to higher chances of disintegration or loss down fissures.
2. Infill sediments. There are two major silty clay expanses in the Thylacoleo Caves. The largest
is a 510 m2 expanse in Leaena’s Breath Cave (LBC) (Supp. Fig. 4d). While sequence depths are not yet
known (a test excavation extended down to 1.3 m), it is probably several metres deep. Remains of
dasyurids, bandicoots, murid rodents, lizards and birds predominate.
3. The Ossuary (Supp. Fig. 4c). A sink deep in Last Tree Cave (LTC) contains a dense
concentration of bones resting atop and within sediment formed from limestone breakdown. No
erosional or breakage-pattern features suggest sediment winnowing or bone transport by water, although
water likely ponded in this area during moister intervals (see below). Fossils are among the best
preserved in the caves. Associated remains are common, and complete skeletons have been found below
the surface. As one of the two lowest points in LTC, there was evidently a tendency for animals to move
toward the Ossuary. We suggest that the deposit largely represents a carcass gravity lag. Carcasses
mummified in the cool, dry conditions (as is common with Holocene material in Nullarbor caves24),
then gradually slid down due to the effects of gravity and disturbance upslope from living animals.
2www.nature.com/nature
doi: 10.1038/nature05471 SUPPLEMENTARY INFORMATION
www.nature.com/nature 13
Supplementary Figure 4 | Thylacoleo Caves and fossils. a, Main chamber, FSC, showing
nature of boulder floor formed by roof collapse. Vertebrate remains are scattered throughout.
b, Base of the recently reopened LBC entrance solution pipe. c, Ossuary deposit, LTC, with
partial Procoptodon goliah skeleton (WAM 02.7.9) in foreground. d, Sediment expanse in LBC,
showing part of the palaeochannel formed during the final depositional episode. e, Complete
skeleton of Baringa sp. nov. 1 (WAM 02.7.17), LTC. This unusual kangaroo is the most
common marsupial in the fauna, and bore high-crowned incisors and enlarged tuberosities
above its eye orbits. f, Complete skeleton of Thylacoleo carnifex (WAM 02.7.1), FSC. g,
Thylacoleo carnifex skeleton (WAM 02.7.3) in fissure, LTC. h, Cranium of Sthenurus
andersoni (WAM 03.5.5), LTC.
2www.nature.com/nature
doi: 10.1038/nature05471 SUPPLEMENTARY INFORMATION
www.nature.com/nature 14
Notes on cavern formation and deposition
Leaena’s Breath Cave (LBC). Cavern formation via large-scale collapse development ceased prior
to the widespread deposition of early-stage dark calcite (4.1–3.8 million years ago25) in LBC.
Subsequently, it has undergone only minor cavern enlargement through limited dome rifting and
boulder pile settling, as indicated by fracturing and alignment of speleothems. In the same period, LBC
has undergone some modification through collapse in approximately 25% of the total cavern area. This
includes a 620 m2 collapse that occurred prior to the deposition of the upper sediment layer, which was
deposited between 400 and 200 kyr ago. Limited collapse of ~140 m2 occurred after upper sediment
layer accumulated. Late-stage coralline calcite speleothems (~400 kyr, see main text) was deposited
over early-stage speleothems in an area concentrated but not confined to the northwest of the erosional
pit underlying the solution pipe entrance. Coralline calcite is deposited in relatively humid cave
environments when entrances are largely blocked, but sufficiently open to facilitate some air
interchange. A further 30% of the LBC cavern area, consisting of the more elevated section of cave, has
been covered in a fine powder up to 30 cm deep. This powder is formed as a result of roof exudation
and overlies areas with dark calcite, also to lesser extent areas of late-stage coralline calcite. Around
20% of the cavern area located in the lower lying section to the south of the entrance pit has been
covered with silty clay infill sediments. Present-day water flow within the cave is drained into the rock
pile within the confines of the entrance pit. The volume of water flow necessary to overflow the pit and
flood the 510 m2 expanse is prevented by the present entrance size and current surface topography.
The single solution pipe entrance to the cave penetrates 11 m of limestone along a near-vertical
joint. The upper 3 m of the pipe changes from a more irregular narrow form to a more rounded wider
form, reflecting greater limestone exudation. The current opening is a small ~0.36 m2 hole in a fragile
~4 cm thick layer of calcrete (kankar), which is formed at the base of the overlying clay soil horizon
during a period when the upper portion of the entrance pipe was last blocked. The soil layer remaining
above the calcrete cap is up to 1.2 m thick (Supp. Fig. 5). Dimensions of the pipe immediately below
the calcrete are 1.7 x 1.4 m. When open during the Pleistocene, the entrance had minimum dimensions
of 1.4 x 1.2 m (Supp. Fig. 6).
2www.nature.com/nature
doi: 10.1038/nature05471 SUPPLEMENTARY INFORMATION
www.nature.com/nature 15
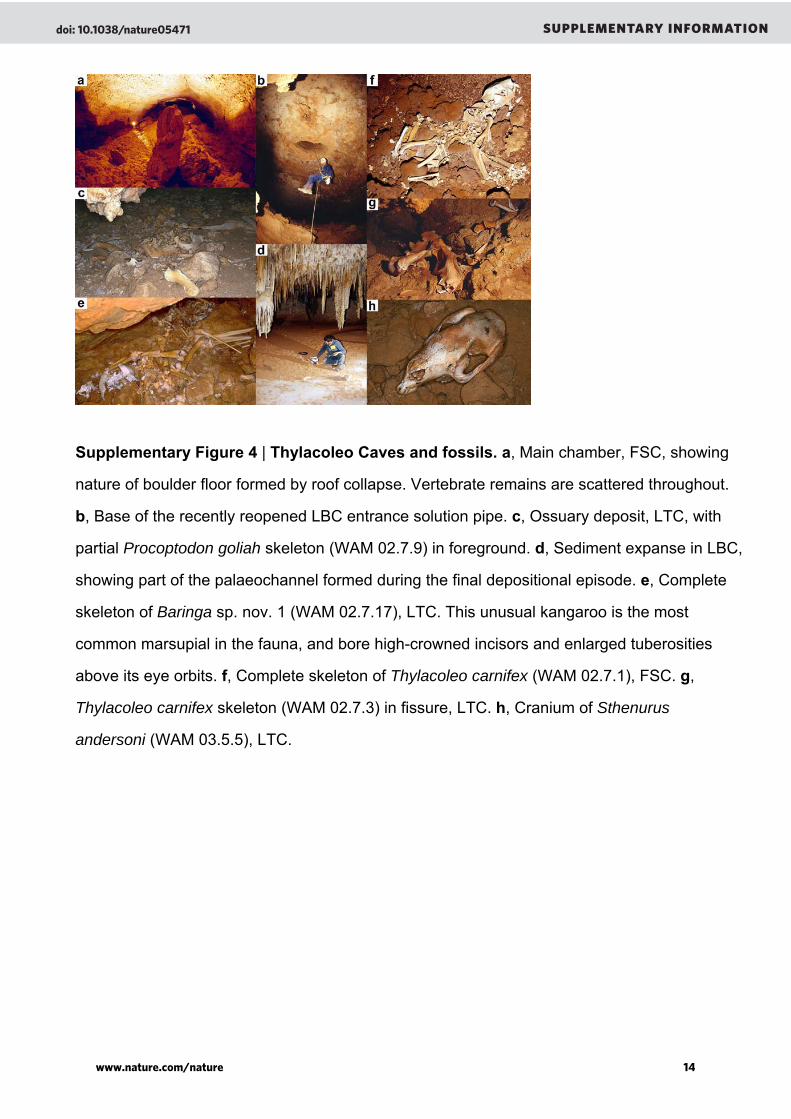
Supplementary Figure 5 | Opening of Leaena’s Breath Cave entrance solution pipe (~0.36 m2), showing thin calcrete cap, which indicates very recent reopening. Pleistocene animals and sediments entered the cave via the same pipe.
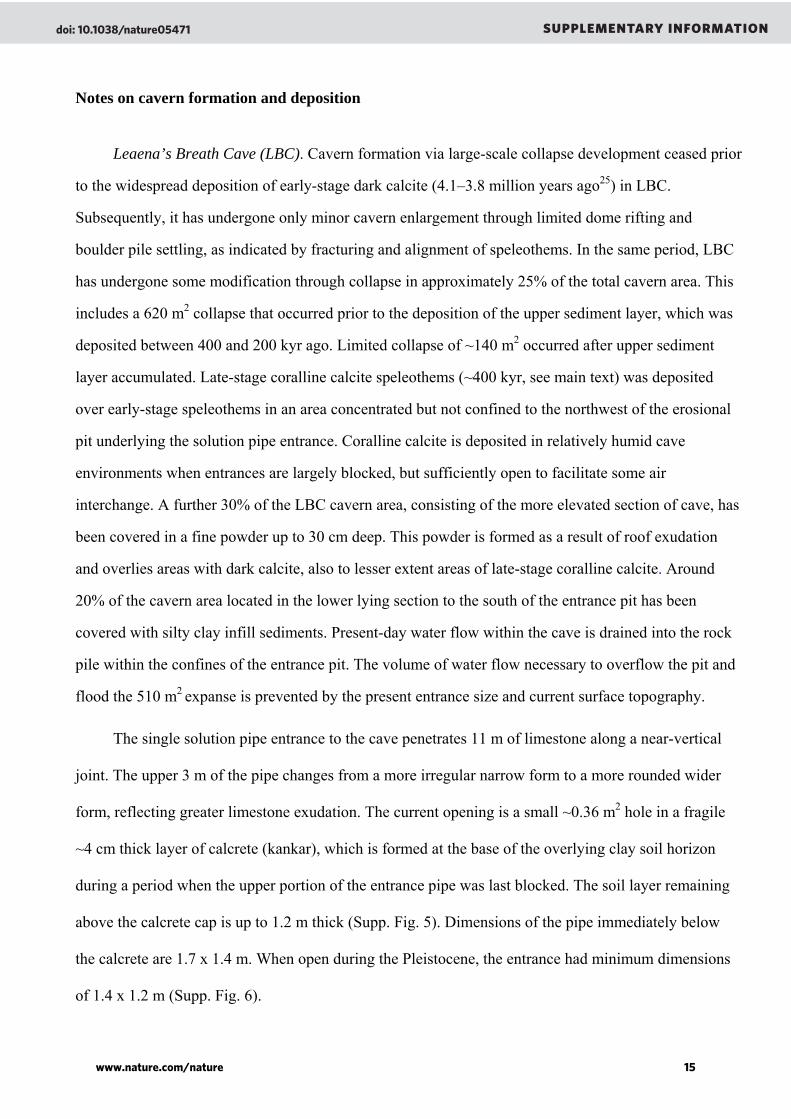
Supplementary Figure 6 | View up the Leaena’s Breath Cave entrance solution pipe, showing widening of pipe cause by exudation. Many of the Pleistocene animals survived
the 20 m fall to the cave floor, before dying of thirst or injuries.
2www.nature.com/nature
doi: 10.1038/nature05471 SUPPLEMENTARY INFORMATION
www.nature.com/nature 16
Pleistocene faunal remains were found on all surfaces in LBC, except for the base of the entrance
pit and area of last-stage collapse. They were found embedded in exudation sediments formed from
limestone breakdown, and atop coralline speleothems. The fossil-bearing, upper infill sediment layer
also overlies coralline speleothems. Three fossil specimens (WAM 04.6.02, WAM 04.6.3, WAM
03.5.9) were located under coralline calcite crusts.
Flight Star Cave (FSC) and Last Tree Cave (LTC). Large-scale collapse modification of FSC has
continued subsequent to the early Pliocene, as evidenced by voids in fallen roof blocks in-filled by dark
calcite of early Pliocene age25. The single solution pipe entrance of FSC is no longer a focus for
floodwater drainage, in contrast to the interval during which Pleistocene faunal remains and sediments
were accumulating in the cave. While the doline surrounding the FSC entrance retains some residual
soil, the doline surface is composed primarily of highly weathered calcrete and exposed limestone,
indicating that it has been open for a longer period than either LTC or LBC. Here the dolines show
limited clay erosion and the entrances occur in freshly fractured calcrete. LTC shows little evidence as
to the timing of the main collapse, apart from limited speleothem growth in the upper chamber along
with limited sections of collapse subsequent to Pleistocene faunal accumulation. Other blocked
entrances northeast of the present entrance are revealed by extensive floodwater scours in the accessible
lower levels within the corresponding section of this cave. Development in this area indicates a standing
water level that is tentatively suggested to have influenced the deposition of the Ossuary deposit (see
above).
2www.nature.com/nature
doi: 10.1038/nature05471 SUPPLEMENTARY INFORMATION
www.nature.com/nature 17
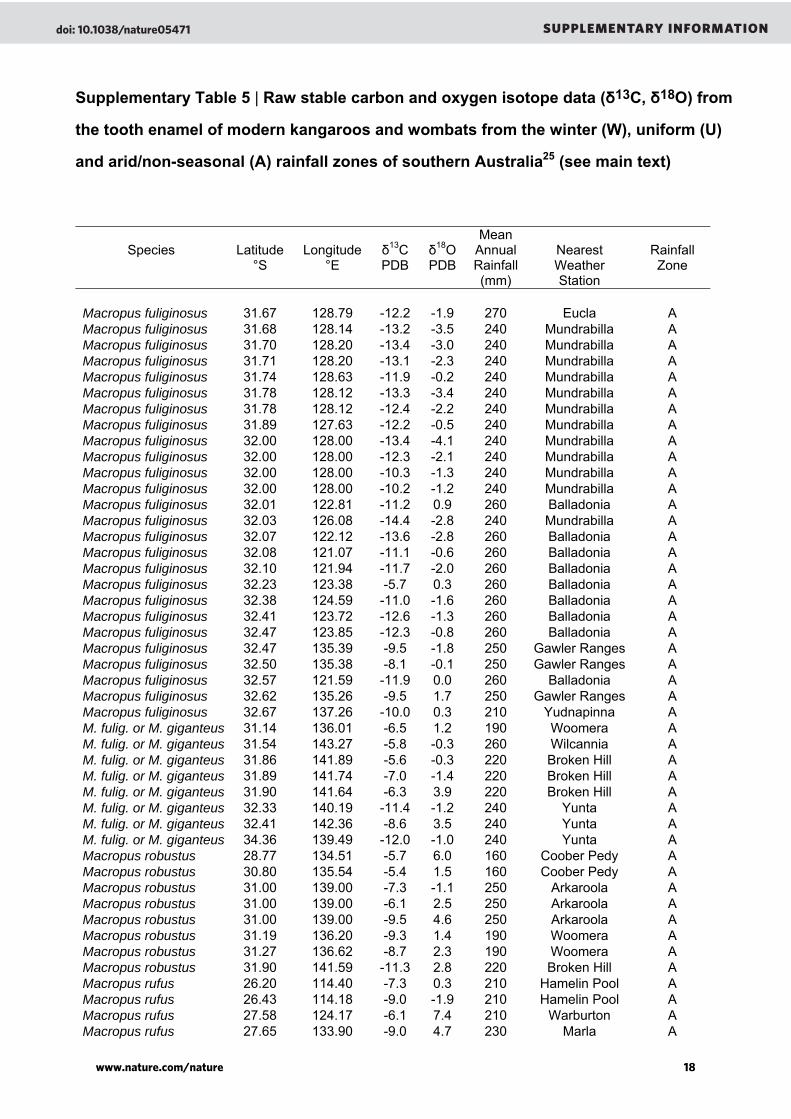
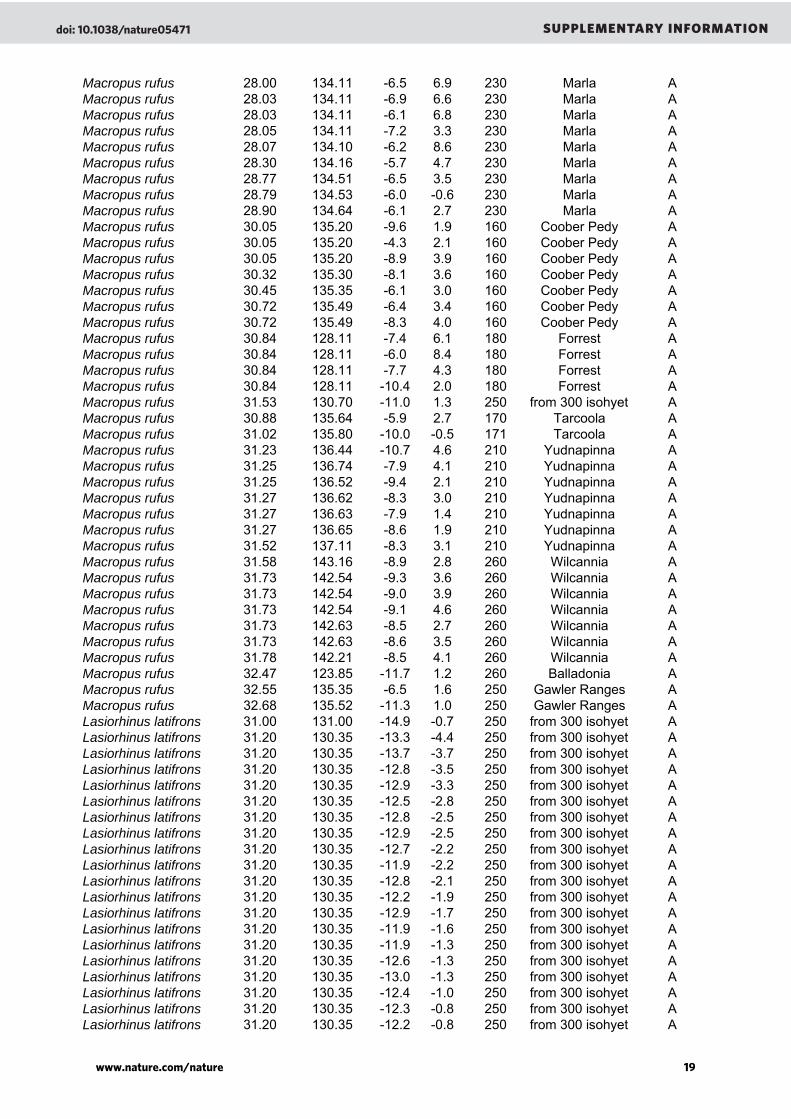
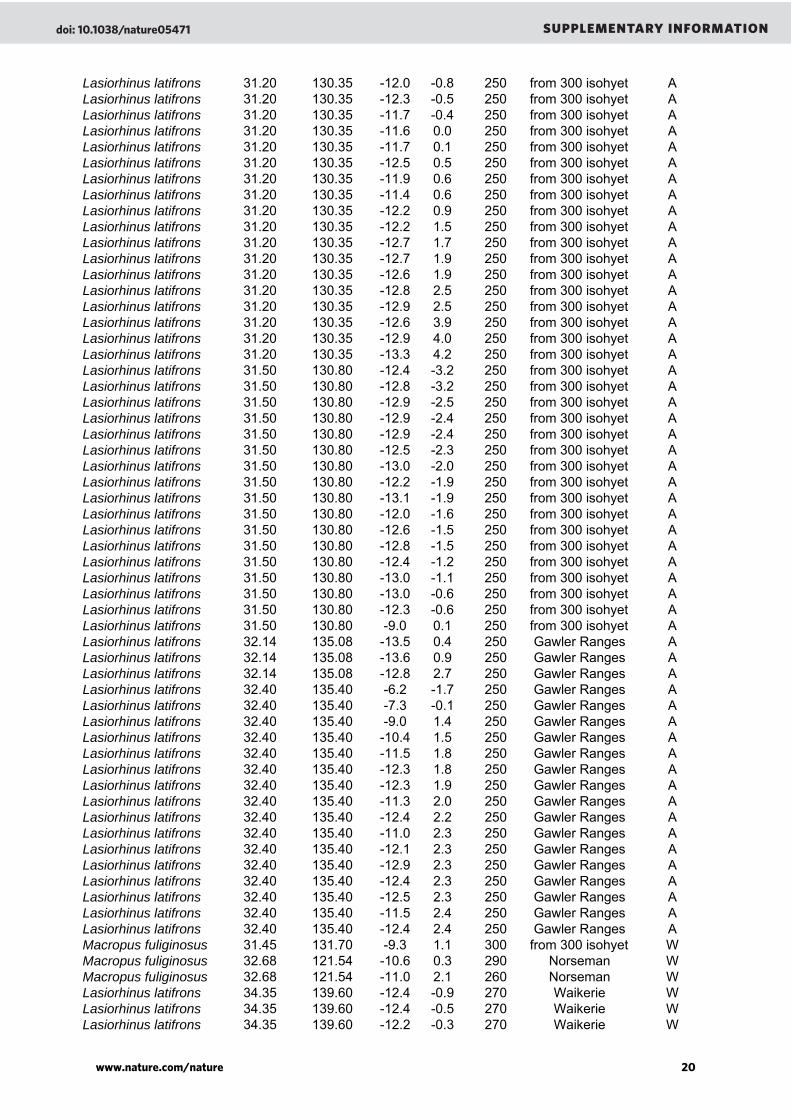
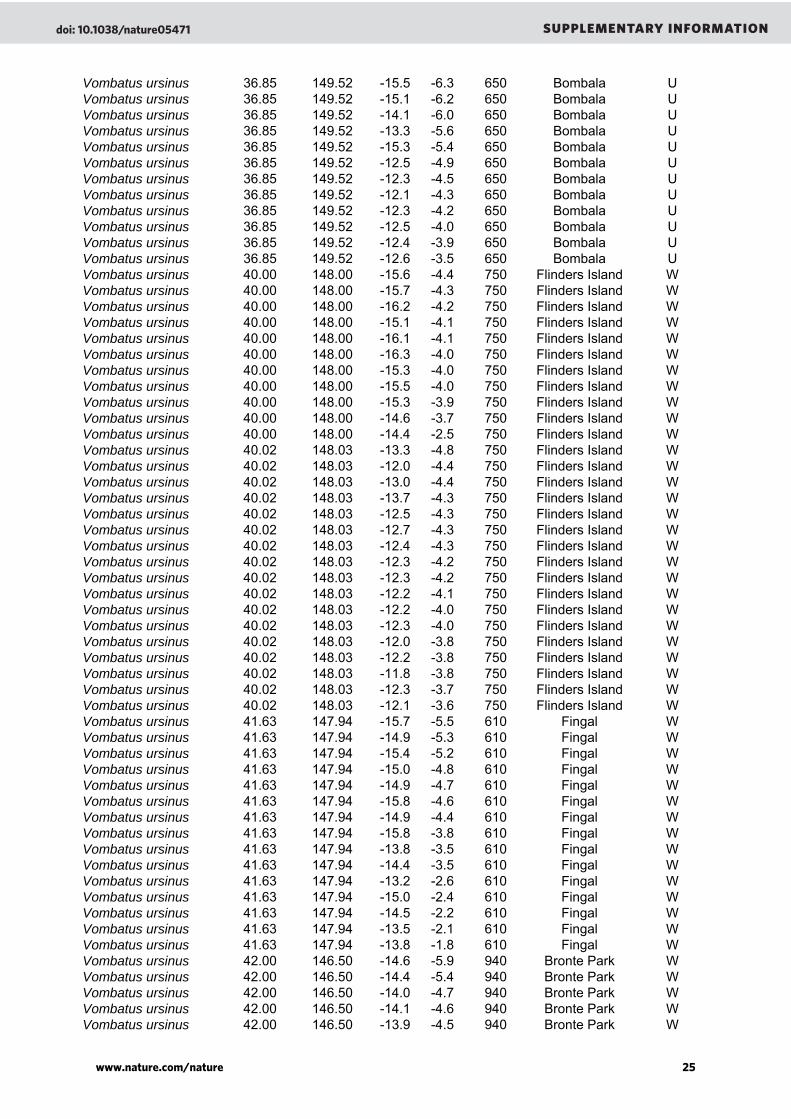
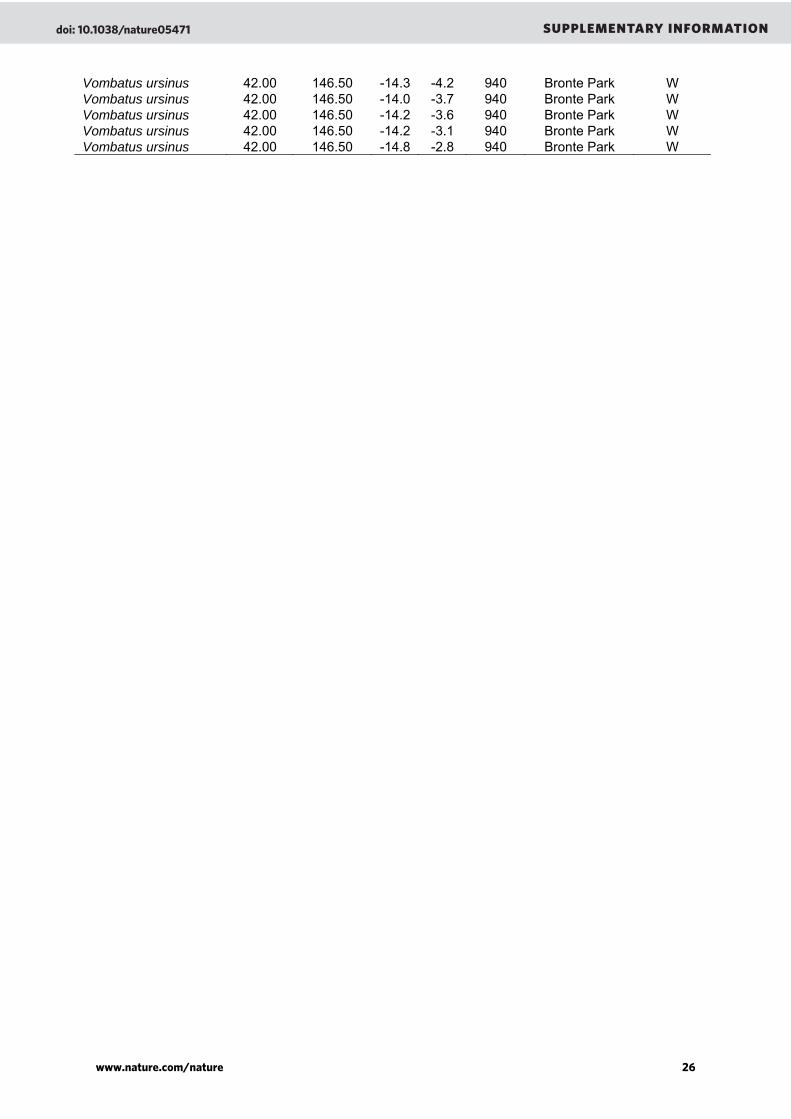
Supplementary Table 5 | Raw stable carbon and oxygen isotope data (δ13C, δ18O) from
the tooth enamel of modern kangaroos and wombats from the winter (W), uniform (U)
and arid/non-seasonal (A) rainfall zones of southern Australia25 (see main text)
Species
Latitude °S
Longitude °E
δ13C PDB
δ18O PDB
Mean Annual Rainfall (mm)
Nearest Weather Station
Rainfall Zone
Macropus fuliginosus 31.67 128.79 -12.2 -1.9 270 Eucla A Macropus fuliginosus 31.68 128.14 -13.2 -3.5 240 Mundrabilla A Macropus fuliginosus 31.70 128.20 -13.4 -3.0 240 Mundrabilla A Macropus fuliginosus 31.71 128.20 -13.1 -2.3 240 Mundrabilla A Macropus fuliginosus 31.74 128.63 -11.9 -0.2 240 Mundrabilla A Macropus fuliginosus 31.78 128.12 -13.3 -3.4 240 Mundrabilla A Macropus fuliginosus 31.78 128.12 -12.4 -2.2 240 Mundrabilla A Macropus fuliginosus 31.89 127.63 -12.2 -0.5 240 Mundrabilla A Macropus fuliginosus 32.00 128.00 -13.4 -4.1 240 Mundrabilla A Macropus fuliginosus 32.00 128.00 -12.3 -2.1 240 Mundrabilla A Macropus fuliginosus 32.00 128.00 -10.3 -1.3 240 Mundrabilla A Macropus fuliginosus 32.00 128.00 -10.2 -1.2 240 Mundrabilla A Macropus fuliginosus 32.01 122.81 -11.2 0.9 260 Balladonia A Macropus fuliginosus 32.03 126.08 -14.4 -2.8 240 Mundrabilla A Macropus fuliginosus 32.07 122.12 -13.6 -2.8 260 Balladonia A Macropus fuliginosus 32.08 121.07 -11.1 -0.6 260 Balladonia A Macropus fuliginosus 32.10 121.94 -11.7 -2.0 260 Balladonia A Macropus fuliginosus 32.23 123.38 -5.7 0.3 260 Balladonia A Macropus fuliginosus 32.38 124.59 -11.0 -1.6 260 Balladonia A Macropus fuliginosus 32.41 123.72 -12.6 -1.3 260 Balladonia A Macropus fuliginosus 32.47 123.85 -12.3 -0.8 260 Balladonia A Macropus fuliginosus 32.47 135.39 -9.5 -1.8 250 Gawler Ranges A Macropus fuliginosus 32.50 135.38 -8.1 -0.1 250 Gawler Ranges A Macropus fuliginosus 32.57 121.59 -11.9 0.0 260 Balladonia A Macropus fuliginosus 32.62 135.26 -9.5 1.7 250 Gawler Ranges A Macropus fuliginosus 32.67 137.26 -10.0 0.3 210 Yudnapinna A M. fulig. or M. giganteus 31.14 136.01 -6.5 1.2 190 Woomera A M. fulig. or M. giganteus 31.54 143.27 -5.8 -0.3 260 Wilcannia A M. fulig. or M. giganteus 31.86 141.89 -5.6 -0.3 220 Broken Hill A M. fulig. or M. giganteus 31.89 141.74 -7.0 -1.4 220 Broken Hill A M. fulig. or M. giganteus 31.90 141.64 -6.3 3.9 220 Broken Hill A M. fulig. or M. giganteus 32.33 140.19 -11.4 -1.2 240 Yunta A M. fulig. or M. giganteus 32.41 142.36 -8.6 3.5 240 Yunta A M. fulig. or M. giganteus 34.36 139.49 -12.0 -1.0 240 Yunta A Macropus robustus 28.77 134.51 -5.7 6.0 160 Coober Pedy A Macropus robustus 30.80 135.54 -5.4 1.5 160 Coober Pedy A Macropus robustus 31.00 139.00 -7.3 -1.1 250 Arkaroola A Macropus robustus 31.00 139.00 -6.1 2.5 250 Arkaroola A Macropus robustus 31.00 139.00 -9.5 4.6 250 Arkaroola A Macropus robustus 31.19 136.20 -9.3 1.4 190 Woomera A Macropus robustus 31.27 136.62 -8.7 2.3 190 Woomera A Macropus robustus 31.90 141.59 -11.3 2.8 220 Broken Hill A Macropus rufus 26.20 114.40 -7.3 0.3 210 Hamelin Pool A Macropus rufus 26.43 114.18 -9.0 -1.9 210 Hamelin Pool A Macropus rufus 27.58 124.17 -6.1 7.4 210 Warburton A Macropus rufus 27.65 133.90 -9.0 4.7 230 Marla A
2www.nature.com/nature
doi: 10.1038/nature05471 SUPPLEMENTARY INFORMATION
www.nature.com/nature 18
Macropus rufus 28.00 134.11 -6.5 6.9 230 Marla A Macropus rufus 28.03 134.11 -6.9 6.6 230 Marla A Macropus rufus 28.03 134.11 -6.1 6.8 230 Marla A Macropus rufus 28.05 134.11 -7.2 3.3 230 Marla A Macropus rufus 28.07 134.10 -6.2 8.6 230 Marla A Macropus rufus 28.30 134.16 -5.7 4.7 230 Marla A Macropus rufus 28.77 134.51 -6.5 3.5 230 Marla A Macropus rufus 28.79 134.53 -6.0 -0.6 230 Marla A Macropus rufus 28.90 134.64 -6.1 2.7 230 Marla A Macropus rufus 30.05 135.20 -9.6 1.9 160 Coober Pedy A Macropus rufus 30.05 135.20 -4.3 2.1 160 Coober Pedy A Macropus rufus 30.05 135.20 -8.9 3.9 160 Coober Pedy A Macropus rufus 30.32 135.30 -8.1 3.6 160 Coober Pedy A Macropus rufus 30.45 135.35 -6.1 3.0 160 Coober Pedy A Macropus rufus 30.72 135.49 -6.4 3.4 160 Coober Pedy A Macropus rufus 30.72 135.49 -8.3 4.0 160 Coober Pedy A Macropus rufus 30.84 128.11 -7.4 6.1 180 Forrest A Macropus rufus 30.84 128.11 -6.0 8.4 180 Forrest A Macropus rufus 30.84 128.11 -7.7 4.3 180 Forrest A Macropus rufus 30.84 128.11 -10.4 2.0 180 Forrest A Macropus rufus 31.53 130.70 -11.0 1.3 250 from 300 isohyet A Macropus rufus 30.88 135.64 -5.9 2.7 170 Tarcoola A Macropus rufus 31.02 135.80 -10.0 -0.5 171 Tarcoola A Macropus rufus 31.23 136.44 -10.7 4.6 210 Yudnapinna A Macropus rufus 31.25 136.74 -7.9 4.1 210 Yudnapinna A Macropus rufus 31.25 136.52 -9.4 2.1 210 Yudnapinna A Macropus rufus 31.27 136.62 -8.3 3.0 210 Yudnapinna A Macropus rufus 31.27 136.63 -7.9 1.4 210 Yudnapinna A Macropus rufus 31.27 136.65 -8.6 1.9 210 Yudnapinna A Macropus rufus 31.52 137.11 -8.3 3.1 210 Yudnapinna A Macropus rufus 31.58 143.16 -8.9 2.8 260 Wilcannia A Macropus rufus 31.73 142.54 -9.3 3.6 260 Wilcannia A Macropus rufus 31.73 142.54 -9.0 3.9 260 Wilcannia A Macropus rufus 31.73 142.54 -9.1 4.6 260 Wilcannia A Macropus rufus 31.73 142.63 -8.5 2.7 260 Wilcannia A Macropus rufus 31.73 142.63 -8.6 3.5 260 Wilcannia A Macropus rufus 31.78 142.21 -8.5 4.1 260 Wilcannia A Macropus rufus 32.47 123.85 -11.7 1.2 260 Balladonia A Macropus rufus 32.55 135.35 -6.5 1.6 250 Gawler Ranges A Macropus rufus 32.68 135.52 -11.3 1.0 250 Gawler Ranges A Lasiorhinus latifrons 31.00 131.00 -14.9 -0.7 250 from 300 isohyet A Lasiorhinus latifrons 31.20 130.35 -13.3 -4.4 250 from 300 isohyet A Lasiorhinus latifrons 31.20 130.35 -13.7 -3.7 250 from 300 isohyet A Lasiorhinus latifrons 31.20 130.35 -12.8 -3.5 250 from 300 isohyet A Lasiorhinus latifrons 31.20 130.35 -12.9 -3.3 250 from 300 isohyet A Lasiorhinus latifrons 31.20 130.35 -12.5 -2.8 250 from 300 isohyet A Lasiorhinus latifrons 31.20 130.35 -12.8 -2.5 250 from 300 isohyet A Lasiorhinus latifrons 31.20 130.35 -12.9 -2.5 250 from 300 isohyet A Lasiorhinus latifrons 31.20 130.35 -12.7 -2.2 250 from 300 isohyet A Lasiorhinus latifrons 31.20 130.35 -11.9 -2.2 250 from 300 isohyet A Lasiorhinus latifrons 31.20 130.35 -12.8 -2.1 250 from 300 isohyet A Lasiorhinus latifrons 31.20 130.35 -12.2 -1.9 250 from 300 isohyet A Lasiorhinus latifrons 31.20 130.35 -12.9 -1.7 250 from 300 isohyet A Lasiorhinus latifrons 31.20 130.35 -11.9 -1.6 250 from 300 isohyet A Lasiorhinus latifrons 31.20 130.35 -11.9 -1.3 250 from 300 isohyet A Lasiorhinus latifrons 31.20 130.35 -12.6 -1.3 250 from 300 isohyet A Lasiorhinus latifrons 31.20 130.35 -13.0 -1.3 250 from 300 isohyet A Lasiorhinus latifrons 31.20 130.35 -12.4 -1.0 250 from 300 isohyet A Lasiorhinus latifrons 31.20 130.35 -12.3 -0.8 250 from 300 isohyet A Lasiorhinus latifrons 31.20 130.35 -12.2 -0.8 250 from 300 isohyet A
2www.nature.com/nature
doi: 10.1038/nature05471 SUPPLEMENTARY INFORMATION
www.nature.com/nature 19
Lasiorhinus latifrons 31.20 130.35 -12.0 -0.8 250 from 300 isohyet A Lasiorhinus latifrons 31.20 130.35 -12.3 -0.5 250 from 300 isohyet A Lasiorhinus latifrons 31.20 130.35 -11.7 -0.4 250 from 300 isohyet A Lasiorhinus latifrons 31.20 130.35 -11.6 0.0 250 from 300 isohyet A Lasiorhinus latifrons 31.20 130.35 -11.7 0.1 250 from 300 isohyet A Lasiorhinus latifrons 31.20 130.35 -12.5 0.5 250 from 300 isohyet A Lasiorhinus latifrons 31.20 130.35 -11.9 0.6 250 from 300 isohyet A Lasiorhinus latifrons 31.20 130.35 -11.4 0.6 250 from 300 isohyet A Lasiorhinus latifrons 31.20 130.35 -12.2 0.9 250 from 300 isohyet A Lasiorhinus latifrons 31.20 130.35 -12.2 1.5 250 from 300 isohyet A Lasiorhinus latifrons 31.20 130.35 -12.7 1.7 250 from 300 isohyet A Lasiorhinus latifrons 31.20 130.35 -12.7 1.9 250 from 300 isohyet A Lasiorhinus latifrons 31.20 130.35 -12.6 1.9 250 from 300 isohyet A Lasiorhinus latifrons 31.20 130.35 -12.8 2.5 250 from 300 isohyet A Lasiorhinus latifrons 31.20 130.35 -12.9 2.5 250 from 300 isohyet A Lasiorhinus latifrons 31.20 130.35 -12.6 3.9 250 from 300 isohyet A Lasiorhinus latifrons 31.20 130.35 -12.9 4.0 250 from 300 isohyet A Lasiorhinus latifrons 31.20 130.35 -13.3 4.2 250 from 300 isohyet A Lasiorhinus latifrons 31.50 130.80 -12.4 -3.2 250 from 300 isohyet A Lasiorhinus latifrons 31.50 130.80 -12.8 -3.2 250 from 300 isohyet A Lasiorhinus latifrons 31.50 130.80 -12.9 -2.5 250 from 300 isohyet A Lasiorhinus latifrons 31.50 130.80 -12.9 -2.4 250 from 300 isohyet A Lasiorhinus latifrons 31.50 130.80 -12.9 -2.4 250 from 300 isohyet A Lasiorhinus latifrons 31.50 130.80 -12.5 -2.3 250 from 300 isohyet A Lasiorhinus latifrons 31.50 130.80 -13.0 -2.0 250 from 300 isohyet A Lasiorhinus latifrons 31.50 130.80 -12.2 -1.9 250 from 300 isohyet A Lasiorhinus latifrons 31.50 130.80 -13.1 -1.9 250 from 300 isohyet A Lasiorhinus latifrons 31.50 130.80 -12.0 -1.6 250 from 300 isohyet A Lasiorhinus latifrons 31.50 130.80 -12.6 -1.5 250 from 300 isohyet A Lasiorhinus latifrons 31.50 130.80 -12.8 -1.5 250 from 300 isohyet A Lasiorhinus latifrons 31.50 130.80 -12.4 -1.2 250 from 300 isohyet A Lasiorhinus latifrons 31.50 130.80 -13.0 -1.1 250 from 300 isohyet A Lasiorhinus latifrons 31.50 130.80 -13.0 -0.6 250 from 300 isohyet A Lasiorhinus latifrons 31.50 130.80 -12.3 -0.6 250 from 300 isohyet A Lasiorhinus latifrons 31.50 130.80 -9.0 0.1 250 from 300 isohyet A Lasiorhinus latifrons 32.14 135.08 -13.5 0.4 250 Gawler Ranges A Lasiorhinus latifrons 32.14 135.08 -13.6 0.9 250 Gawler Ranges A Lasiorhinus latifrons 32.14 135.08 -12.8 2.7 250 Gawler Ranges A Lasiorhinus latifrons 32.40 135.40 -6.2 -1.7 250 Gawler Ranges A Lasiorhinus latifrons 32.40 135.40 -7.3 -0.1 250 Gawler Ranges A Lasiorhinus latifrons 32.40 135.40 -9.0 1.4 250 Gawler Ranges A Lasiorhinus latifrons 32.40 135.40 -10.4 1.5 250 Gawler Ranges A Lasiorhinus latifrons 32.40 135.40 -11.5 1.8 250 Gawler Ranges A Lasiorhinus latifrons 32.40 135.40 -12.3 1.8 250 Gawler Ranges A Lasiorhinus latifrons 32.40 135.40 -12.3 1.9 250 Gawler Ranges A Lasiorhinus latifrons 32.40 135.40 -11.3 2.0 250 Gawler Ranges A Lasiorhinus latifrons 32.40 135.40 -12.4 2.2 250 Gawler Ranges A Lasiorhinus latifrons 32.40 135.40 -11.0 2.3 250 Gawler Ranges A Lasiorhinus latifrons 32.40 135.40 -12.1 2.3 250 Gawler Ranges A Lasiorhinus latifrons 32.40 135.40 -12.9 2.3 250 Gawler Ranges A Lasiorhinus latifrons 32.40 135.40 -12.4 2.3 250 Gawler Ranges A Lasiorhinus latifrons 32.40 135.40 -12.5 2.3 250 Gawler Ranges A Lasiorhinus latifrons 32.40 135.40 -11.5 2.4 250 Gawler Ranges A Lasiorhinus latifrons 32.40 135.40 -12.4 2.4 250 Gawler Ranges A Macropus fuliginosus 31.45 131.70 -9.3 1.1 300 from 300 isohyet W Macropus fuliginosus 32.68 121.54 -10.6 0.3 290 Norseman W Macropus fuliginosus 32.68 121.54 -11.0 2.1 260 Norseman W Lasiorhinus latifrons 34.35 139.60 -12.4 -0.9 270 Waikerie W Lasiorhinus latifrons 34.35 139.60 -12.4 -0.5 270 Waikerie W Lasiorhinus latifrons 34.35 139.60 -12.2 -0.3 270 Waikerie W
2www.nature.com/nature
doi: 10.1038/nature05471 SUPPLEMENTARY INFORMATION
www.nature.com/nature 20
Lasiorhinus latifrons 34.35 139.60 -12.1 -0.2 270 Waikerie W Lasiorhinus latifrons 34.35 139.60 -12.0 -0.1 270 Waikerie W Lasiorhinus latifrons 34.35 139.60 -12.1 0.7 270 Waikerie W Lasiorhinus latifrons 34.35 139.60 -12.3 1.0 270 Waikerie W Lasiorhinus latifrons 34.35 139.60 -12.1 1.1 270 Waikerie W Lasiorhinus latifrons 34.35 139.60 -11.9 1.4 270 Waikerie W Lasiorhinus latifrons 34.35 139.60 -11.8 1.5 270 Waikerie W Lasiorhinus latifrons 34.35 139.60 -11.7 1.5 270 Waikerie W Lasiorhinus latifrons 34.35 139.60 -12.0 1.9 270 Waikerie W Lasiorhinus latifrons 34.35 139.60 -12.2 2.0 270 Waikerie W Lasiorhinus latifrons 34.35 139.60 -12.2 2.1 270 Waikerie W Lasiorhinus latifrons 34.35 139.60 -11.6 2.3 270 Waikerie W Lasiorhinus latifrons 34.35 139.60 -12.0 2.7 270 Waikerie W Lasiorhinus latifrons 34.35 139.60 -12.0 2.8 270 Waikerie W Lasiorhinus latifrons 34.35 139.60 -12.4 2.8 270 Waikerie W Lasiorhinus latifrons 34.35 139.60 -12.4 2.8 270 Waikerie W Lasiorhinus latifrons 34.35 139.60 -11.7 3.8 270 Waikerie W Lasiorhinus latifrons 34.35 139.60 -12.0 3.9 270 Waikerie W Lasiorhinus latifrons 34.35 139.60 -11.9 4.0 270 Waikerie W Lasiorhinus latifrons 34.35 139.60 -11.3 4.3 270 Waikerie W Lasiorhinus latifrons 34.35 139.60 -11.7 4.6 270 Waikerie W Lasiorhinus latifrons 34.35 139.60 -12.1 4.7 270 Waikerie W Lasiorhinus latifrons 34.35 139.60 -12.1 4.7 270 Waikerie W Lasiorhinus latifrons 34.36 139.49 -13.1 -2.9 270 Waikerie W Lasiorhinus latifrons 34.36 139.49 -12.7 -2.5 270 Waikerie W Lasiorhinus latifrons 34.36 139.49 -11.6 -2.5 270 Waikerie W Lasiorhinus latifrons 34.36 139.49 -13.1 -2.4 270 Waikerie W Lasiorhinus latifrons 34.36 139.49 -13.4 -2.4 270 Waikerie W Lasiorhinus latifrons 34.36 139.49 -12.7 -2.3 270 Waikerie W Lasiorhinus latifrons 34.36 139.49 -12.1 -2.2 270 Waikerie W Lasiorhinus latifrons 34.36 139.49 -11.7 -2.2 270 Waikerie W Lasiorhinus latifrons 34.36 139.49 -11.8 -2.2 270 Waikerie W Lasiorhinus latifrons 34.36 139.49 -11.5 -2.0 270 Waikerie W Lasiorhinus latifrons 34.36 139.49 -12.7 -2.0 270 Waikerie W Lasiorhinus latifrons 34.36 139.49 -12.9 -1.7 270 Waikerie W Lasiorhinus latifrons 34.36 139.49 -12.6 -1.6 270 Waikerie W Lasiorhinus latifrons 34.36 139.49 -13.4 -1.4 270 Waikerie W Lasiorhinus latifrons 34.36 139.49 -13.2 -1.3 270 Waikerie W Lasiorhinus latifrons 34.36 139.49 -12.7 -1.3 270 Waikerie W Lasiorhinus latifrons 34.36 139.49 -12.9 -1.2 270 Waikerie W Lasiorhinus latifrons 34.36 139.49 -12.8 -1.2 270 Waikerie W Lasiorhinus latifrons 34.36 139.49 -12.6 -1.0 270 Waikerie W Lasiorhinus latifrons 34.36 139.49 -13.0 -0.6 270 Waikerie W Lasiorhinus latifrons 34.36 139.49 -12.5 -0.5 270 Waikerie W Lasiorhinus latifrons 34.36 139.49 -12.9 -0.4 270 Waikerie W Lasiorhinus latifrons 34.36 139.49 -12.9 -0.4 270 Waikerie W Lasiorhinus latifrons 34.36 139.49 -12.8 -0.4 270 Waikerie W Lasiorhinus latifrons 34.36 139.49 -13.1 -0.4 270 Waikerie W Lasiorhinus latifrons 34.36 139.49 -13.5 -0.2 270 Waikerie W Lasiorhinus latifrons 34.36 139.49 -12.5 -0.1 270 Waikerie W Lasiorhinus latifrons 34.36 139.49 -12.8 -0.1 270 Waikerie W Lasiorhinus latifrons 34.36 139.49 -13.4 0.7 270 Waikerie W Lasiorhinus latifrons 34.36 139.49 -13.1 0.8 270 Waikerie W Lasiorhinus latifrons 34.36 139.49 -13.1 1.0 270 Waikerie W Lasiorhinus latifrons 34.36 139.49 -13.2 1.4 270 Waikerie W Lasiorhinus latifrons 34.36 139.49 -13.5 1.6 270 Waikerie W Lasiorhinus latifrons 34.36 139.49 -14.2 2.0 270 Waikerie W Lasiorhinus latifrons 34.36 139.49 -13.9 2.0 270 Waikerie W Lasiorhinus latifrons 34.36 139.49 -13.5 2.0 270 Waikerie W Lasiorhinus latifrons 34.36 139.49 -13.9 2.6 270 Waikerie W
2www.nature.com/nature
doi: 10.1038/nature05471 SUPPLEMENTARY INFORMATION
www.nature.com/nature 21
Lasiorhinus latifrons 34.36 139.50 -12.8 -1.8 270 Waikerie W Lasiorhinus latifrons 34.36 139.50 -12.6 -1.8 270 Waikerie W Lasiorhinus latifrons 34.36 139.50 -12.9 -1.7 270 Waikerie W Lasiorhinus latifrons 34.36 139.50 -13.4 -1.7 270 Waikerie W Lasiorhinus latifrons 34.36 139.50 -12.7 -1.5 270 Waikerie W Lasiorhinus latifrons 34.36 139.50 -13.5 -1.0 270 Waikerie W Lasiorhinus latifrons 34.36 139.50 -12.8 -0.9 270 Waikerie W Lasiorhinus latifrons 34.36 139.50 -13.6 -0.5 270 Waikerie W Lasiorhinus latifrons 34.36 139.50 -14.0 -0.5 270 Waikerie W Lasiorhinus latifrons 34.36 139.50 -13.0 -0.1 270 Waikerie W Lasiorhinus latifrons 34.36 139.50 -13.5 0.4 270 Waikerie W Lasiorhinus latifrons 34.36 139.50 -10.7 2.0 270 Waikerie W Lasiorhinus latifrons 34.36 139.50 -12.2 2.5 270 Waikerie W Lasiorhinus latifrons 34.36 139.50 -11.9 3.6 270 Waikerie W Lasiorhinus latifrons 34.36 139.50 -11.5 3.7 270 Waikerie W Lasiorhinus latifrons 34.43 139.52 -13.3 -1.5 270 Waikerie W Lasiorhinus latifrons 34.43 139.52 -13.6 -1.1 270 Waikerie W Lasiorhinus latifrons 34.43 139.52 -13.4 -1.0 270 Waikerie W Lasiorhinus latifrons 34.43 139.52 -14.0 -1.0 270 Waikerie W Lasiorhinus latifrons 34.43 139.52 -13.3 -0.7 270 Waikerie W Lasiorhinus latifrons 34.43 139.52 -14.3 -0.4 270 Waikerie W Lasiorhinus latifrons 34.43 139.52 -13.3 -0.4 270 Waikerie W Lasiorhinus latifrons 34.43 139.52 -13.3 -0.3 270 Waikerie W Lasiorhinus latifrons 34.43 139.52 -11.9 -0.3 270 Waikerie W Lasiorhinus latifrons 34.43 139.52 -13.4 0.0 270 Waikerie W Lasiorhinus latifrons 34.43 139.52 -14.6 0.2 270 Waikerie W Lasiorhinus latifrons 34.43 139.52 -13.7 0.4 270 Waikerie W Lasiorhinus latifrons 34.43 139.52 -14.7 0.6 270 Waikerie W Lasiorhinus latifrons 34.43 139.52 -14.4 0.6 270 Waikerie W Lasiorhinus latifrons 34.43 139.52 -13.4 0.7 270 Waikerie W Lasiorhinus latifrons 34.43 139.52 -14.0 0.8 270 Waikerie W Lasiorhinus latifrons 34.43 139.52 -12.9 0.9 270 Waikerie W Lasiorhinus latifrons 34.43 139.52 -13.6 1.2 270 Waikerie W Lasiorhinus latifrons 34.43 139.52 -13.7 1.2 270 Waikerie W Lasiorhinus latifrons 34.43 139.52 -14.1 2.0 270 Waikerie W Macropus fuliginosus 33.04 136.78 -8.6 -2.1 350 Kimba W Macropus fuliginosus 33.04 135.78 -13.9 0.6 350 Kimba W Macropus rufus 27.60 114.70 -7.7 0.9 370 Kalbarri W M. fulig. or M. giganteus 31.17 145.91 -13.9 -0.2 410 Cobar U M. fulig. or M. giganteus 31.17 145.91 -8.3 0.2 410 Cobar U M. fulig. or M. giganteus 31.17 145.91 -10.6 0.5 410 Cobar U M. fulig. or M. giganteus 31.58 145.07 -10.6 -2.5 410 Cobar U Macropus giganteus 33.48 145.53 -6.6 -3.7 390 Mount Hope U Macropus rufus 31.19 145.91 -11.5 1.4 390 Mount Hope U Macropus fuliginosus 36.90 144.73 -13.7 -5.1 550 Bendigo U Macropus fuliginosus 36.90 144.73 -9.0 -2.6 550 Bendigo U Macropus fuliginosus 37.40 141.10 -14.1 -4.1 550 Bendigo U Macropus giganteus 32.03 147.98 -9.1 -4.5 500 Trangie U Macropus giganteus 32.03 147.98 -8.5 -2.6 500 Trangie U Vombatus ursinus 34.50 147.50 -15.4 -6.3 530 Temora ARS U Vombatus ursinus 34.50 147.50 -15.8 -6.3 530 Temora ARS U Vombatus ursinus 34.50 147.50 -14.3 -5.6 530 Temora ARS U Vombatus ursinus 34.50 147.50 -14.0 -5.6 530 Temora ARS U Vombatus ursinus 34.50 147.50 -15.2 -5.5 530 Temora ARS U Vombatus ursinus 34.50 147.50 -15.5 -4.2 530 Temora ARS U Vombatus ursinus 34.50 147.50 -15.5 -3.1 530 Temora ARS U Vombatus ursinus 34.50 147.50 -14.5 -2.0 530 Temora ARS U Vombatus ursinus 34.50 147.50 -11.8 -2.0 530 Temora ARS U Vombatus ursinus 34.50 147.50 -13.1 -1.8 530 Temora ARS U Vombatus ursinus 34.50 147.50 -12.0 -1.6 530 Temora ARS U
2www.nature.com/nature
doi: 10.1038/nature05471 SUPPLEMENTARY INFORMATION
www.nature.com/nature 22
Vombatus ursinus 34.50 147.50 -14.5 -1.5 530 Temora ARS U Vombatus ursinus 34.50 147.50 -14.1 -1.4 530 Temora ARS U Vombatus ursinus 34.50 147.50 -11.1 -1.1 530 Temora ARS U Vombatus ursinus 34.50 147.50 -9.8 -0.9 530 Temora ARS U Lasiorhinus krefftii 35.53 144.95 -15.2 -5.1 410 Deniliquin U Lasiorhinus krefftii 35.53 144.95 -15.2 -4.8 410 Deniliquin U Lasiorhinus krefftii 35.53 144.95 -15.6 -4.7 410 Deniliquin U Lasiorhinus krefftii 35.53 144.95 -15.7 -4.4 410 Deniliquin U Lasiorhinus krefftii 35.53 144.95 -15.2 -4.4 410 Deniliquin U Lasiorhinus krefftii 35.53 144.95 -15.4 -4.4 410 Deniliquin U Lasiorhinus krefftii 35.53 144.95 -15.3 -4.1 410 Deniliquin U Lasiorhinus krefftii 35.53 144.95 -15.3 -4.0 410 Deniliquin U Lasiorhinus krefftii 35.53 144.95 -15.0 -3.5 410 Deniliquin U Lasiorhinus krefftii 35.53 144.95 -15.6 -3.5 410 Deniliquin U Lasiorhinus krefftii 35.53 144.95 -14.6 -3.0 410 Deniliquin U Lasiorhinus krefftii 35.53 144.95 -14.3 -2.7 410 Deniliquin U Lasiorhinus krefftii 35.53 144.95 -13.8 -2.3 410 Deniliquin U Lasiorhinus krefftii 35.53 144.95 -13.2 -1.9 410 Deniliquin U Lasiorhinus krefftii 35.53 144.95 -12.9 -1.6 410 Deniliquin U Lasiorhinus krefftii 35.53 144.95 -12.1 -1.4 410 Deniliquin U Lasiorhinus krefftii 35.53 144.95 -12.5 -1.3 410 Deniliquin U Lasiorhinus krefftii 35.53 144.95 -11.6 -0.8 410 Deniliquin U Lasiorhinus krefftii 35.53 144.95 -11.3 -0.5 410 Deniliquin U Lasiorhinus krefftii 35.53 144.95 -11.0 -0.4 410 Deniliquin U Lasiorhinus krefftii 35.53 144.95 -10.9 -0.2 410 Deniliquin U Lasiorhinus krefftii 35.53 144.95 -10.8 0.0 410 Deniliquin U Macropus fuliginosus 34.57 118.70 -11.8 -3.6 600 Mettler W Macropus fuliginosus 34.68 117.91 -12.8 -3.7 600 Mettler W Macropus fuliginosus 34.68 117.91 -14.4 -0.8 600 Mettler W Macropus fuliginosus 34.34 116.32 -14.3 -1.1 1020 Manjimup W Macropus fuliginosus 34.39 116.49 -15.0 -2.2 1020 Manjimup W Macropus fuliginosus 34.39 116.49 -14.9 -1.8 1020 Manjimup W Macropus fuliginosus 34.39 116.52 -15.5 -2.0 1020 Manjimup W Macropus fuliginosus 34.73 116.09 -14.6 -2.1 1020 Manjimup W Macropus fuliginosus 34.80 116.07 -13.6 -1.5 1020 Manjimup W Macropus fuliginosus 34.80 118.26 -13.0 -2.9 600 Mettler W Macropus fuliginosus 34.82 116.06 -14.4 -3.1 1020 Manjimup W Macropus fuliginosus 34.83 116.04 -14.5 -2.5 1020 Manjimup W Macropus fuliginosus 34.91 116.56 -16.7 -3.3 1020 Manjimup W Macropus fuliginosus 34.91 116.56 -14.2 -2.8 1020 Manjimup W Macropus fuliginosus 34.91 116.56 -13.3 -1.7 1020 Manjimup W Macropus fuliginosus 34.97 117.44 -11.0 -2.9 1000 Denmark W Macropus fuliginosus 34.97 117.44 -9.8 -2.0 1000 Denmark W Macropus giganteus 34.12 150.22 -13.5 -4.5 800 Picton U Macropus giganteus 34.12 150.22 -8.3 -4.5 800 Picton U Macropus giganteus 34.12 150.22 -6.5 -3.7 800 Picton U Macropus giganteus 34.17 150.20 -7.5 -4.9 800 Picton U Macropus giganteus 34.17 150.20 -9.9 -4.4 800 Picton U Macropus giganteus 35.15 149.67 -8.7 -6.1 770 Nerriga U Macropus giganteus 35.15 149.67 -8.7 -5.6 770 Nerriga U Macropus giganteus 36.35 148.60 -5.1 -4.9 1290 Mt Kosciusko U Vombatus ursinus 34.45 150.45 -11.8 -3.9 970 Moss Vale U Vombatus ursinus 34.45 150.45 -11.5 -3.7 970 Moss Vale U Vombatus ursinus 34.45 150.45 -10.3 -3.7 970 Moss Vale U Vombatus ursinus 34.45 150.45 -10.5 -3.4 970 Moss Vale U Vombatus ursinus 34.45 150.45 -10.9 -3.4 970 Moss Vale U Vombatus ursinus 34.45 150.45 -9.9 -3.2 970 Moss Vale U Vombatus ursinus 34.45 150.45 -9.6 -3.2 970 Moss Vale U Vombatus ursinus 34.45 150.45 -10.4 -3.1 970 Moss Vale U Vombatus ursinus 34.45 150.45 -9.5 -3.0 970 Moss Vale U
2www.nature.com/nature
doi: 10.1038/nature05471 SUPPLEMENTARY INFORMATION
www.nature.com/nature 23
Vombatus ursinus 34.45 150.45 -9.5 -2.9 970 Moss Vale U Vombatus ursinus 34.45 150.45 -9.6 -2.5 970 Moss Vale U Vombatus ursinus 34.45 150.45 -9.8 -1.6 970 Moss Vale U Vombatus ursinus 34.45 150.45 -10.1 -1.1 970 Moss Vale U Vombatus ursinus 34.45 150.45 -9.5 -0.7 970 Moss Vale U Vombatus ursinus 34.70 150.50 -11.2 -2.3 970 Nowra U Vombatus ursinus 34.70 150.50 -11.7 -1.9 970 Nowra U Vombatus ursinus 34.70 150.50 -11.5 -1.8 970 Nowra U Vombatus ursinus 34.70 150.50 -11.7 -1.7 970 Nowra U Vombatus ursinus 34.70 150.50 -11.5 -1.7 970 Nowra U Vombatus ursinus 34.70 150.50 -10.9 -1.6 970 Nowra U Vombatus ursinus 34.70 150.50 -10.5 -1.6 970 Nowra U Vombatus ursinus 35.53 148.15 -6.7 -7.2 910 Tumut Plains U Vombatus ursinus 35.53 148.15 -8.7 -7.0 910 Tumut Plains U Vombatus ursinus 35.53 148.15 -9.4 -7.0 910 Tumut Plains U Vombatus ursinus 35.53 148.15 -6.3 -6.9 910 Tumut Plains U Vombatus ursinus 35.53 148.15 -7.7 -6.9 910 Tumut Plains U Vombatus ursinus 35.53 148.15 -4.8 -6.9 910 Tumut Plains U Vombatus ursinus 35.53 148.15 -5.4 -6.8 910 Tumut Plains U Vombatus ursinus 35.53 148.15 -6.2 -6.8 910 Tumut Plains U Vombatus ursinus 35.53 148.15 -4.6 -6.7 910 Tumut Plains U Vombatus ursinus 35.53 148.15 -9.7 -6.4 910 Tumut Plains U Vombatus ursinus 35.53 148.15 -4.6 -6.3 910 Tumut Plains U Vombatus ursinus 35.53 148.15 -10.0 -6.3 910 Tumut Plains U Vombatus ursinus 35.53 148.15 -10.3 -6.1 910 Tumut Plains U Vombatus ursinus 35.53 148.15 -4.4 -5.6 910 Tumut Plains U Vombatus ursinus 35.53 148.15 -4.4 -5.4 910 Tumut Plains U Vombatus ursinus 35.53 148.15 -4.6 -5.0 910 Tumut Plains U Vombatus ursinus 35.53 148.15 -4.7 -4.3 910 Tumut Plains U Vombatus ursinus 35.53 148.15 -5.3 -4.3 910 Tumut Plains U Vombatus ursinus 35.53 148.15 -4.9 -4.2 910 Tumut Plains U Vombatus ursinus 35.53 148.15 -6.1 -3.8 910 Tumut Plains U Vombatus ursinus 35.53 148.15 -6.1 -3.1 910 Tumut Plains U Vombatus ursinus 35.53 148.15 -6.3 -3.0 910 Tumut Plains U Vombatus ursinus 35.65 149.82 -11.3 -6.7 960 Moruya Heads U Vombatus ursinus 35.65 149.82 -10.3 -6.6 960 Moruya Heads U Vombatus ursinus 35.65 149.82 -10.9 -6.6 960 Moruya Heads U Vombatus ursinus 35.65 149.82 -10.8 -6.4 960 Moruya Heads U Vombatus ursinus 35.65 149.82 -11.5 -6.4 960 Moruya Heads U Vombatus ursinus 35.65 149.82 -11.1 -6.4 960 Moruya Heads U Vombatus ursinus 35.65 149.82 -9.2 -6.2 960 Moruya Heads U Vombatus ursinus 35.65 149.82 -7.9 -6.1 960 Moruya Heads U Vombatus ursinus 35.65 149.82 -10.5 -5.9 960 Moruya Heads U Vombatus ursinus 35.65 149.82 -11.2 -5.7 960 Moruya Heads U Vombatus ursinus 35.65 149.82 -7.4 -5.5 960 Moruya Heads U Vombatus ursinus 35.65 149.82 -6.8 -5.2 960 Moruya Heads U Vombatus ursinus 35.65 149.82 -6.3 -5.0 960 Moruya Heads U Vombatus ursinus 35.65 149.82 -6.2 -4.9 960 Moruya Heads U Vombatus ursinus 35.65 149.82 -6.1 -4.1 960 Moruya Heads U Vombatus ursinus 35.65 149.82 -7.4 -4.0 960 Moruya Heads U Vombatus ursinus 35.65 149.82 -6.1 -4.0 960 Moruya Heads U Vombatus ursinus 35.65 149.82 -5.9 -3.8 960 Moruya Heads U Vombatus ursinus 35.65 149.82 -6.4 -3.8 960 Moruya Heads U Vombatus ursinus 35.65 149.82 -8.0 -3.7 960 Moruya Heads U Vombatus ursinus 35.65 149.82 -6.2 -3.6 960 Moruya Heads U Vombatus ursinus 35.65 149.82 -8.8 -3.5 960 Moruya Heads U Vombatus ursinus 36.85 149.52 -15.3 -6.9 650 Bombala U Vombatus ursinus 36.85 149.52 -15.6 -6.7 650 Bombala U Vombatus ursinus 36.85 149.52 -15.5 -6.6 650 Bombala U Vombatus ursinus 36.85 149.52 -15.0 -6.6 650 Bombala U
2www.nature.com/nature
doi: 10.1038/nature05471 SUPPLEMENTARY INFORMATION
www.nature.com/nature 24
Vombatus ursinus 36.85 149.52 -15.5 -6.3 650 Bombala U Vombatus ursinus 36.85 149.52 -15.1 -6.2 650 Bombala U Vombatus ursinus 36.85 149.52 -14.1 -6.0 650 Bombala U Vombatus ursinus 36.85 149.52 -13.3 -5.6 650 Bombala U Vombatus ursinus 36.85 149.52 -15.3 -5.4 650 Bombala U Vombatus ursinus 36.85 149.52 -12.5 -4.9 650 Bombala U Vombatus ursinus 36.85 149.52 -12.3 -4.5 650 Bombala U Vombatus ursinus 36.85 149.52 -12.1 -4.3 650 Bombala U Vombatus ursinus 36.85 149.52 -12.3 -4.2 650 Bombala U Vombatus ursinus 36.85 149.52 -12.5 -4.0 650 Bombala U Vombatus ursinus 36.85 149.52 -12.4 -3.9 650 Bombala U Vombatus ursinus 36.85 149.52 -12.6 -3.5 650 Bombala U Vombatus ursinus 40.00 148.00 -15.6 -4.4 750 Flinders Island W Vombatus ursinus 40.00 148.00 -15.7 -4.3 750 Flinders Island W Vombatus ursinus 40.00 148.00 -16.2 -4.2 750 Flinders Island W Vombatus ursinus 40.00 148.00 -15.1 -4.1 750 Flinders Island W Vombatus ursinus 40.00 148.00 -16.1 -4.1 750 Flinders Island W Vombatus ursinus 40.00 148.00 -16.3 -4.0 750 Flinders Island W Vombatus ursinus 40.00 148.00 -15.3 -4.0 750 Flinders Island W Vombatus ursinus 40.00 148.00 -15.5 -4.0 750 Flinders Island W Vombatus ursinus 40.00 148.00 -15.3 -3.9 750 Flinders Island W Vombatus ursinus 40.00 148.00 -14.6 -3.7 750 Flinders Island W Vombatus ursinus 40.00 148.00 -14.4 -2.5 750 Flinders Island W Vombatus ursinus 40.02 148.03 -13.3 -4.8 750 Flinders Island W Vombatus ursinus 40.02 148.03 -12.0 -4.4 750 Flinders Island W Vombatus ursinus 40.02 148.03 -13.0 -4.4 750 Flinders Island W Vombatus ursinus 40.02 148.03 -13.7 -4.3 750 Flinders Island W Vombatus ursinus 40.02 148.03 -12.5 -4.3 750 Flinders Island W Vombatus ursinus 40.02 148.03 -12.7 -4.3 750 Flinders Island W Vombatus ursinus 40.02 148.03 -12.4 -4.3 750 Flinders Island W Vombatus ursinus 40.02 148.03 -12.3 -4.2 750 Flinders Island W Vombatus ursinus 40.02 148.03 -12.3 -4.2 750 Flinders Island W Vombatus ursinus 40.02 148.03 -12.2 -4.1 750 Flinders Island W Vombatus ursinus 40.02 148.03 -12.2 -4.0 750 Flinders Island W Vombatus ursinus 40.02 148.03 -12.3 -4.0 750 Flinders Island W Vombatus ursinus 40.02 148.03 -12.0 -3.8 750 Flinders Island W Vombatus ursinus 40.02 148.03 -12.2 -3.8 750 Flinders Island W Vombatus ursinus 40.02 148.03 -11.8 -3.8 750 Flinders Island W Vombatus ursinus 40.02 148.03 -12.3 -3.7 750 Flinders Island W Vombatus ursinus 40.02 148.03 -12.1 -3.6 750 Flinders Island W Vombatus ursinus 41.63 147.94 -15.7 -5.5 610 Fingal W Vombatus ursinus 41.63 147.94 -14.9 -5.3 610 Fingal W Vombatus ursinus 41.63 147.94 -15.4 -5.2 610 Fingal W Vombatus ursinus 41.63 147.94 -15.0 -4.8 610 Fingal W Vombatus ursinus 41.63 147.94 -14.9 -4.7 610 Fingal W Vombatus ursinus 41.63 147.94 -15.8 -4.6 610 Fingal W Vombatus ursinus 41.63 147.94 -14.9 -4.4 610 Fingal W Vombatus ursinus 41.63 147.94 -15.8 -3.8 610 Fingal W Vombatus ursinus 41.63 147.94 -13.8 -3.5 610 Fingal W Vombatus ursinus 41.63 147.94 -14.4 -3.5 610 Fingal W Vombatus ursinus 41.63 147.94 -13.2 -2.6 610 Fingal W Vombatus ursinus 41.63 147.94 -15.0 -2.4 610 Fingal W Vombatus ursinus 41.63 147.94 -14.5 -2.2 610 Fingal W Vombatus ursinus 41.63 147.94 -13.5 -2.1 610 Fingal W Vombatus ursinus 41.63 147.94 -13.8 -1.8 610 Fingal W Vombatus ursinus 42.00 146.50 -14.6 -5.9 940 Bronte Park W Vombatus ursinus 42.00 146.50 -14.4 -5.4 940 Bronte Park W Vombatus ursinus 42.00 146.50 -14.0 -4.7 940 Bronte Park W Vombatus ursinus 42.00 146.50 -14.1 -4.6 940 Bronte Park W Vombatus ursinus 42.00 146.50 -13.9 -4.5 940 Bronte Park W
2www.nature.com/nature
doi: 10.1038/nature05471 SUPPLEMENTARY INFORMATION
www.nature.com/nature 25
Vombatus ursinus 42.00 146.50 -14.3 -4.2 940 Bronte Park W Vombatus ursinus 42.00 146.50 -14.0 -3.7 940 Bronte Park W Vombatus ursinus 42.00 146.50 -14.2 -3.6 940 Bronte Park W Vombatus ursinus 42.00 146.50 -14.2 -3.1 940 Bronte Park W Vombatus ursinus 42.00 146.50 -14.8 -2.8 940 Bronte Park W
2www.nature.com/nature
doi: 10.1038/nature05471 SUPPLEMENTARY INFORMATION
www.nature.com/nature 26
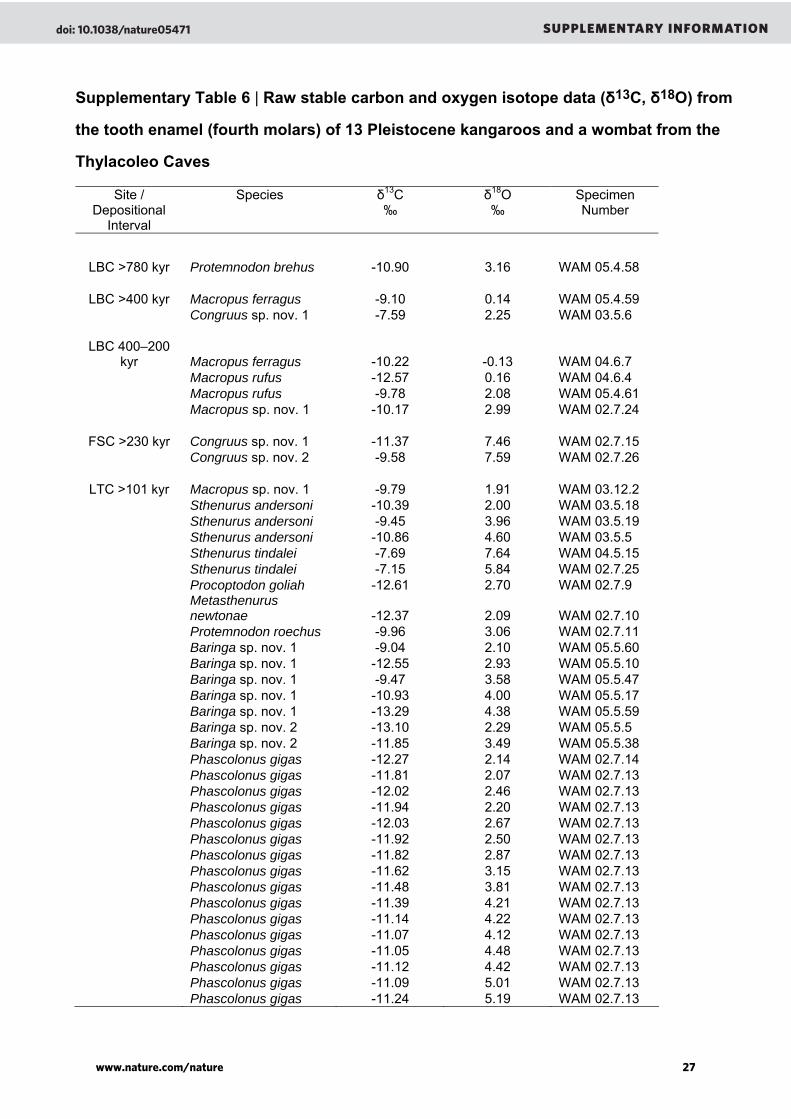
Supplementary Table 6 | Raw stable carbon and oxygen isotope data (δ13C, δ18O) from
the tooth enamel (fourth molars) of 13 Pleistocene kangaroos and a wombat from the
Thylacoleo Caves
Site / Depositional
Interval
Species
δ13C ‰
δ18O ‰
Specimen Number
LBC >780 kyr Protemnodon brehus -10.90 3.16 WAM 05.4.58
LBC >400 kyr Macropus ferragus -9.10 0.14 WAM 05.4.59
Congruus sp. nov. 1 -7.59 2.25 WAM 03.5.6
LBC 400–200 kyr Macropus ferragus -10.22 -0.13 WAM 04.6.7
Macropus rufus -12.57 0.16 WAM 04.6.4 Macropus rufus -9.78 2.08 WAM 05.4.61 Macropus sp. nov. 1 -10.17 2.99 WAM 02.7.24
FSC >230 kyr Congruus sp. nov. 1 -11.37 7.46 WAM 02.7.15 Congruus sp. nov. 2 -9.58 7.59 WAM 02.7.26
LTC >101 kyr Macropus sp. nov. 1 -9.79 1.91 WAM 03.12.2 Sthenurus andersoni -10.39 2.00 WAM 03.5.18 Sthenurus andersoni -9.45 3.96 WAM 03.5.19 Sthenurus andersoni -10.86 4.60 WAM 03.5.5 Sthenurus tindalei -7.69 7.64 WAM 04.5.15 Sthenurus tindalei -7.15 5.84 WAM 02.7.25 Procoptodon goliah -12.61 2.70 WAM 02.7.9
Metasthenurus newtonae -12.37 2.09 WAM 02.7.10
Protemnodon roechus -9.96 3.06 WAM 02.7.11 Baringa sp. nov. 1 -9.04 2.10 WAM 05.5.60 Baringa sp. nov. 1 -12.55 2.93 WAM 05.5.10 Baringa sp. nov. 1 -9.47 3.58 WAM 05.5.47 Baringa sp. nov. 1 -10.93 4.00 WAM 05.5.17 Baringa sp. nov. 1 -13.29 4.38 WAM 05.5.59 Baringa sp. nov. 2 -13.10 2.29 WAM 05.5.5 Baringa sp. nov. 2 -11.85 3.49 WAM 05.5.38 Phascolonus gigas -12.27 2.14 WAM 02.7.14 Phascolonus gigas -11.81 2.07 WAM 02.7.13 Phascolonus gigas -12.02 2.46 WAM 02.7.13 Phascolonus gigas -11.94 2.20 WAM 02.7.13 Phascolonus gigas -12.03 2.67 WAM 02.7.13 Phascolonus gigas -11.92 2.50 WAM 02.7.13 Phascolonus gigas -11.82 2.87 WAM 02.7.13 Phascolonus gigas -11.62 3.15 WAM 02.7.13 Phascolonus gigas -11.48 3.81 WAM 02.7.13 Phascolonus gigas -11.39 4.21 WAM 02.7.13 Phascolonus gigas -11.14 4.22 WAM 02.7.13 Phascolonus gigas -11.07 4.12 WAM 02.7.13 Phascolonus gigas -11.05 4.48 WAM 02.7.13 Phascolonus gigas -11.12 4.42 WAM 02.7.13 Phascolonus gigas -11.09 5.01 WAM 02.7.13 Phascolonus gigas -11.24 5.19 WAM 02.7.13
2www.nature.com/nature
doi: 10.1038/nature05471 SUPPLEMENTARY INFORMATION
www.nature.com/nature 27
28
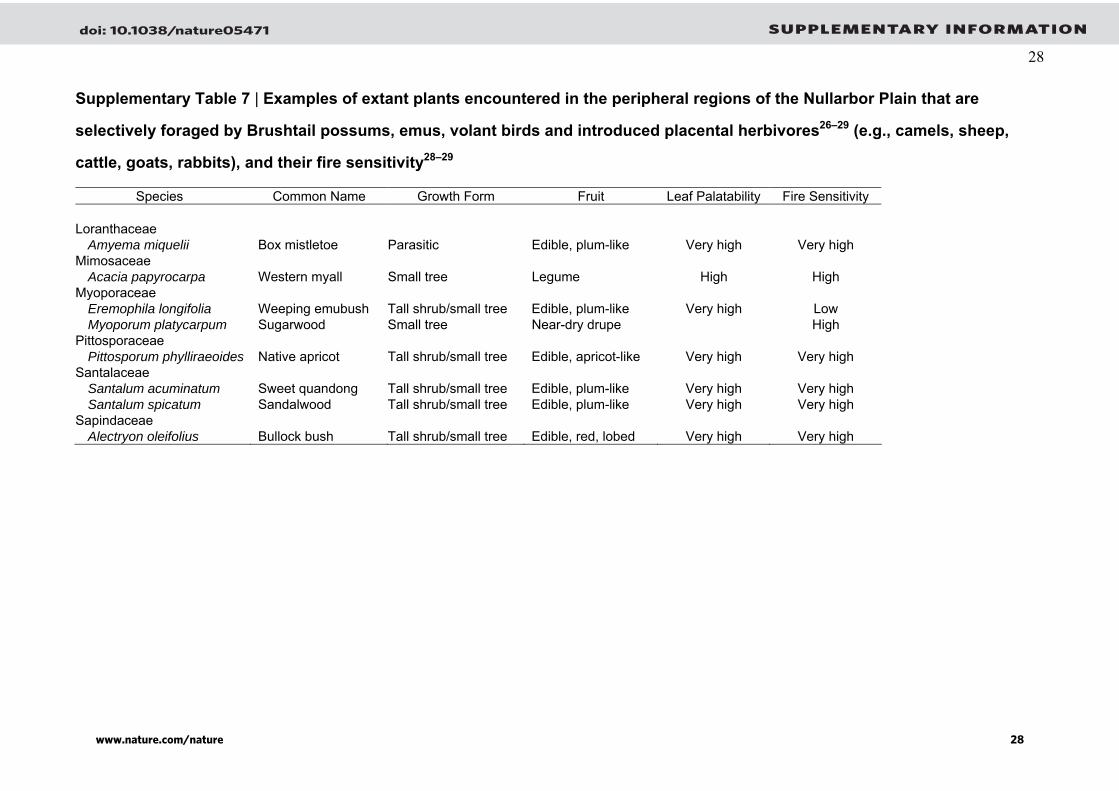
Supplementary Table 7 | Examples of extant plants encountered in the peripheral regions of the Nullarbor Plain that are
selectively foraged by Brushtail possums, emus, volant birds and introduced placental herbivores26–29 (e.g., camels, sheep,
cattle, goats, rabbits), and their fire sensitivity28–29
Species Common Name Growth Form Fruit Leaf Palatability Fire Sensitivity Loranthaceae Amyema miquelii Box mistletoe Parasitic Edible, plum-like Very high Very high Mimosaceae Acacia papyrocarpa Western myall Small tree Legume High High Myoporaceae Eremophila longifolia Weeping emubush Tall shrub/small tree Edible, plum-like Very high Low Myoporum platycarpum Sugarwood Small tree Near-dry drupe High Pittosporaceae Pittosporum phylliraeoides Native apricot Tall shrub/small tree Edible, apricot-like Very high Very high Santalaceae Santalum acuminatum Sweet quandong Tall shrub/small tree Edible, plum-like Very high Very high Santalum spicatum Sandalwood Tall shrub/small tree Edible, plum-like Very high Very high Sapindaceae Alectryon oleifolius Bullock bush Tall shrub/small tree Edible, red, lobed Very high Very high
2www.nature.com/nature
doi: 10.1038/nature05471 SUPPLEMENTARY INFORMATION
www.nature.com/nature 28
29
References
1. Hellstrom, J. C. Rapid and accurate U/Th dating using parallel ion-counting multi-collector
ICP-MS. J. Anal. At. Spectrom. 18, 1346–1351 (2003).
2. Aitken, M. J. An Introduction to Optical Dating (Oxford University Press, Oxford, 1998).
3. Bøtter-Jensen, L., McKeever, S. W. S. & Wintle, A. G. Optically Stimulated Luminescence
Dosimetry (Elsevier Science, Amsterdam, 2003).
4. Lian, O. B. & Roberts, R. G. Dating the Quaternary: progress in luminescence dating of
sediments. Quat. Sci. Rev. 25, 2449–2468 (2006).
5. Galbraith, R. F., Roberts, R. G., Laslett, G. M., Yoshida, H. & Olley, J. M. Optical dating of
single and multiple grains of quartz from Jinmium rock shelter, northern Australia: Part I,
experimental design and statistical models. Archaeometry 41, 339–364 (1999).
6. Olley, J. M., Pietsch, T. & Roberts, R. G. Optical dating of Holocene sediments from a
variety of geomorphic settings using single grains of quartz. Geomorphology 60, 337–358 (2004).
7. Olley, J. M., Roberts, R. G. & Murray, A. S. Disequilibria in the uranium decay series in
sedimentary deposits at Allen’s Cave, Nullarbor Plain, Australia: implications for dose rate
determinations. Radiat. Meas. 27, 433–443 (1997).
8. Bailey, R. M. Paper I—simulation of dose absorption in quartz over geological timescales
and its implications for the precision and accuracy of optical dating. Radiat. Meas. 38, 299–310
(2004).
9. Yoshida, H., Roberts, R. G., Olley, J. M., Laslett, G. M. & Galbraith, R. F. Extending the age
range of optical dating using single ‘supergrains’ of quartz. Radiat. Meas. 32, 439–446 (2000).
10. Huntley, D. J. & Prescott, J. R. Improved methodology and new thermoluminescence ages for
the dune sequence in south-east South Australia. Quat. Sci. Rev. 20, 687–699 (2001).
11. Rhodes, E. J., Singarayer, J. S., Raynal, J.-P., Westaway, K. E. & Sbihi-Alaoui, F. Z. New
age estimates for the Palaeolithic assemblages and Pleistocene succession of Casablanca, Morocco.
Quat. Sci. Rev. 25, 2569–2585 (2006).
2www.nature.com/nature
doi: 10.1038/nature05471 SUPPLEMENTARY INFORMATION
www.nature.com/nature 29
30
12. Wang, X. L., Lu, Y. C. & Wintle, A. G. Recuperated OSL dating of fine-grained quartz in
Chinese loess. Quat. Geochron. 1, 89–100 (2006).
13. Mejdahl, V. Thermoluminescence dating: beta-dose attenuation in quartz grains.
Archaeometry 21, 61–72 (1979).
14. Aitken, M. J. Thermoluminescence Dating (Academic Press, London, 1985).
15. Olley, J. M., Murray, A. & Roberts, R. G. The effects of disequilibria in the uranium and
thorium decay chains on burial dose rates in fluvial sediments. Quat. Sci. Rev. 15, 751–760 (1996).
16. Prescott, J. R. & Hutton, J. T. Cosmic ray contributions to dose rates for luminescence and
ESR dating: large depths and long-term time variations. Radiat. Meas. 23, 497–500 (1994).
17. Bowler, J. M., Johnston, J., Olley, J. M., Prescott, J. R., Roberts, R. G., Shawcross, W. &
Spooner, N. A. New ages for human occupation and climatic change at Lake Mungo, Australia.
Nature 421, 837–840 (2003).
18. Galbraith, R. F., Roberts, R. G. & Yoshida, H. Error variation in OSL palaeodose estimates
from single aliquots of quartz: a factorial experiment. Radiat. Meas. 39, 289–307 (2005).
19. Singer, B. S. & Pringle, M. S. Age and duration of the Matuyama-Brunhes geomagnetic
polarity reversal from 40Ar/39Ar incremental heating analyses of lavas. Earth Planet. Sci. Lett. 139,
47–61 (1996).
20. Bureau of Meteorology. Climate of Australia (Australian Government Publishing Service,
Canberra, 1989).
21. Strahan, R. (ed.) The Mammals of Australia (Reed New Holland, Sydney, 1995).
22. Prideaux, G. J. Systematics and evolution of the sthenurine kangaroos. Univ. Calif. Publ.
Geol. Sci. 146, i–xvii, 1–623 (2004).
23. Prideaux, G. J. in Encyclopedia of Quaternary Science (ed. Elias, S.) (Elsevier, Oxford, in
press).
24. Baynes, A. in A Biological Survey of the Nullarbor Region South and Western Australia in
1984 (eds McKenzie, N. L. & Robinson, A. C.) 139–152 (Dept of Environment and Planning,
Adelaide, 1987).
2www.nature.com/nature
doi: 10.1038/nature05471 SUPPLEMENTARY INFORMATION
www.nature.com/nature 30
31
25. Woodhead, J., Hellstrom, J., Maas, R., Drysdale, R., Zanchetta, G., Devine, P. & Taylor, E.
U–Pb geochronology of speleothems by MC-ICPMS. Quat. Geochron. 1, 208–221 (2006).
26. Mitchell, A. A. & Wilcox, D. G. Arid Shrubland Plants of Western Australia (University of
Western Australia Press, Perth, 1998).
27. Dörges, B. & Heucke, J. Demonstration of ecologically sustainable management of camels
on aboriginal and pastoral land (Unpublished report to Natural Heritage Trust of Australia, 2003).
28. Latz, P. A Land of Fire: Australia, the Burning Continent (in press).
29. Reid, N. Control of mistletoes by possums and fire: a review of the evidence. Vict. Nat. 114,
149–158 (1997).
2www.nature.com/nature
doi: 10.1038/nature05471 SUPPLEMENTARY INFORMATION
www.nature.com/nature 31