Embed Size (px)
Citation preview

3.5 The Doppler Effect: this is how we learn about the motions ofobjects in the universe, discover extraterrestrial planets, black holes at thecenters of galaxies, and the expansion of the entire universe.
4.1 Spectral Lines: appearance, excess or deficit of energy atparticular wavelengths. (Don’t worry about Kirchoff’s laws, and the pictureswith little prisms and light bulbs etc.--see notes)
4.2 Atoms and Radiation: quantized energy levels of electrons inatoms, and how they interact with radiation.
The hydrogen atom--the simplest, and most important case.
4.3 The Formation of Spectral Lines: understandingemission lines and absorption lines
4.4 Molecules: not just electronic changes, but vibrational androtational changes of energy.
4.5 Spectral-Line Analysis: Information from spectral lines-abundances, turbulent motions, rotation, …
Topics through Chapter 4

3.5 The Doppler EffectThe wavelength (or frequency) of a wave, as measured by an observer, depends on the relativeradial speed of the source and observer.
Radial motion means: motion towards or away; along the line of sight.
The Doppler effect involves only this component of motion. What we get from measuringit is called the radial velocity.
Moving toward: wavelengthsdecrease (“blueshift”)
Moving away: wavelengths increase (“redshift”)

3.5 The Doppler EffectRelationship between wavelength and speed:
⇒ Shift in λ compared to “rest (no motion) wavelength” is proportional to radialvelocity
⇒ So if you know the exact wavelength where some feature in the spectrumshould be (“true wavelength”), and the wavelength at which it appears(“apparent wavelength”), you can obtain the radial velocity.
⇒ This is how we get speeds of cosmic objects, stars, galaxies, even expansion ofuniverse.
Actual formula is:λ(apparent)/ λ(true) = 1 ± (speed of object/speed of light)
where the ± sign means it is + if it is moving away from us (redshift, longerwavelength), - if it is moving toward us (blueshift, shorter wavelength)
This applies to any wave; and no reason notto use frequency instead of wavelength.Textbook writes it this way:

3.5 The Doppler Effect
Important point: Dopplereffect depends only onthe relative motion ofsource and observer
See textbook for this ratherconfusing example. In classwe’ll use a simpler exampleof water waves in a pond.

More Precisely 3-3: Measuring Velocities with theDoppler Effect
Example: For a speed of 30 km/s, the Doppler shift is given by
speed of light
speed of object
This may seem small, but it is easilydetectable with a radar gun.
It is NOT so easy to detect fromthe spectrum of an astronomicalobject, unless you know somethingabout spectral lines.

Look at the Doppler shift formula again:
λ(apparent)/ λ(true) = 1 ± (radial velocity of object./speed of light)
If velocity of object away or toward us is much less than thespeed of light (true for almost all objects in the universe), the apparentwavelength will be only slightly different from the “laboratory” or “rest”wavelength.
For most objects in the universe,this relative shift is so tiny, that wecan’t detect it using the “shift” ofthe whole continuous spectrum.But we can use places in thespectrum whose wavelengths areprecisely known by the presenceof spectral lines (the subject ofChapter 4)

Chapter 4Spectroscopy
Don’t worry if you can’t understand what this pretty picture represents,unless it is the day beforethe next exam.A more important question Is why the authors insiston showing this form of spectra withoutadequately explaining!

Spectroscope: Splits light into component colors(wavelengths, frequencies)
4.1 Spectral Lines
Most of this illustration is completely unnecessary! The only importantpoint is that light from any object can be spread out into a “rainbow” ofwavelengths. A spectrum is a picture of how much light is at eachwavelength. This illustration is showing a continuous spectrum.

Emission lines:
Single frequencies emitted byparticular atoms in a hot gas
4.1 Spectral “Lines”
Absorption lines:
If a continuous spectrum passes through acool gas, atoms of the gas will absorb thesame frequencies they emit
Continuous spectrum:
Continuous range of frequenciesemitted by an object (something like the“black bodies” we discussed in ch.3)

Spectral lines
Spectral lines—very narrow, well-defined (in wavelength) wavelength/frequency regions in the spectrum where excess photon energy appears (emission lines) or else where photons are missing (absorption lines).
Often these lines are superimposed on asmooth, “continuous” spectrum, which is thenear-blackbody emission of a heated objectthat we have been discussing so far (ch. 3,Wien, Stefan-Boltzmann).
Cartoon view of absorption lines, both inthe spectrum as a graph (below), and in therecorded spectrum (top), the band ofcolors--this is just how the spectra aregathered--pay no attention to the rectangularshape!
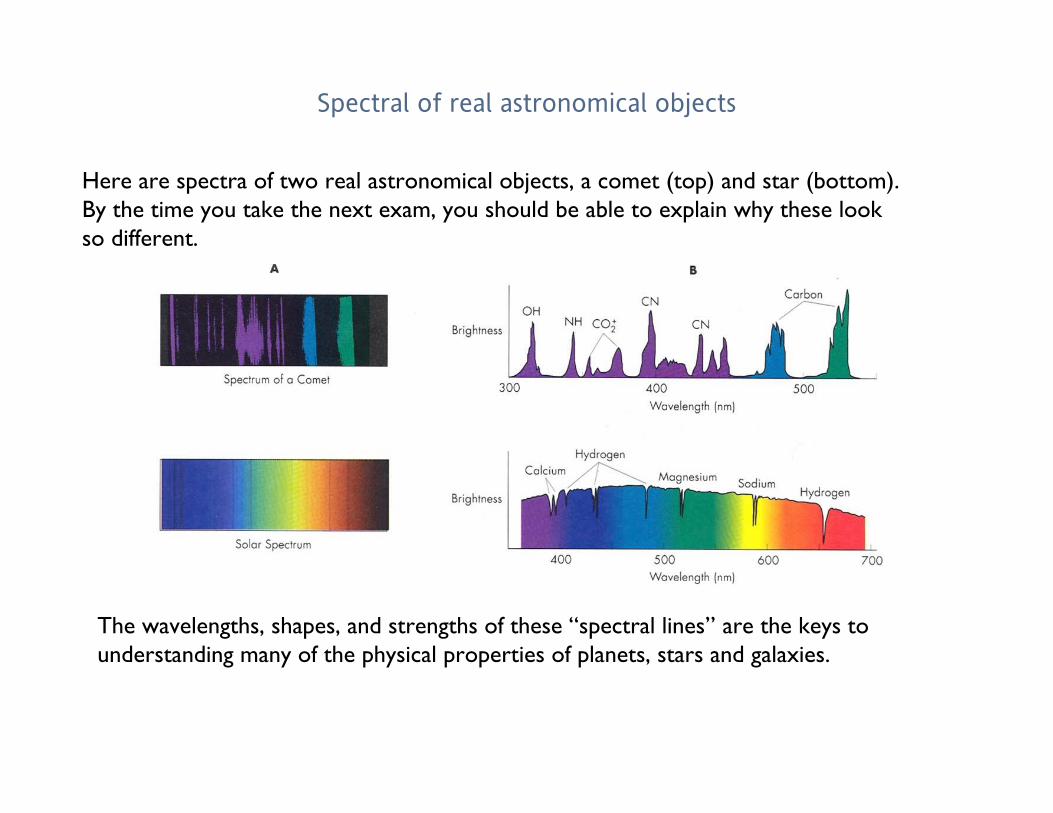
Spectral of real astronomical objects
Here are spectra of two real astronomical objects, a comet (top) and star (bottom).By the time you take the next exam, you should be able to explain why these lookso different.
The wavelengths, shapes, and strengths of these “spectral lines” are the keys tounderstanding many of the physical properties of planets, stars and galaxies.
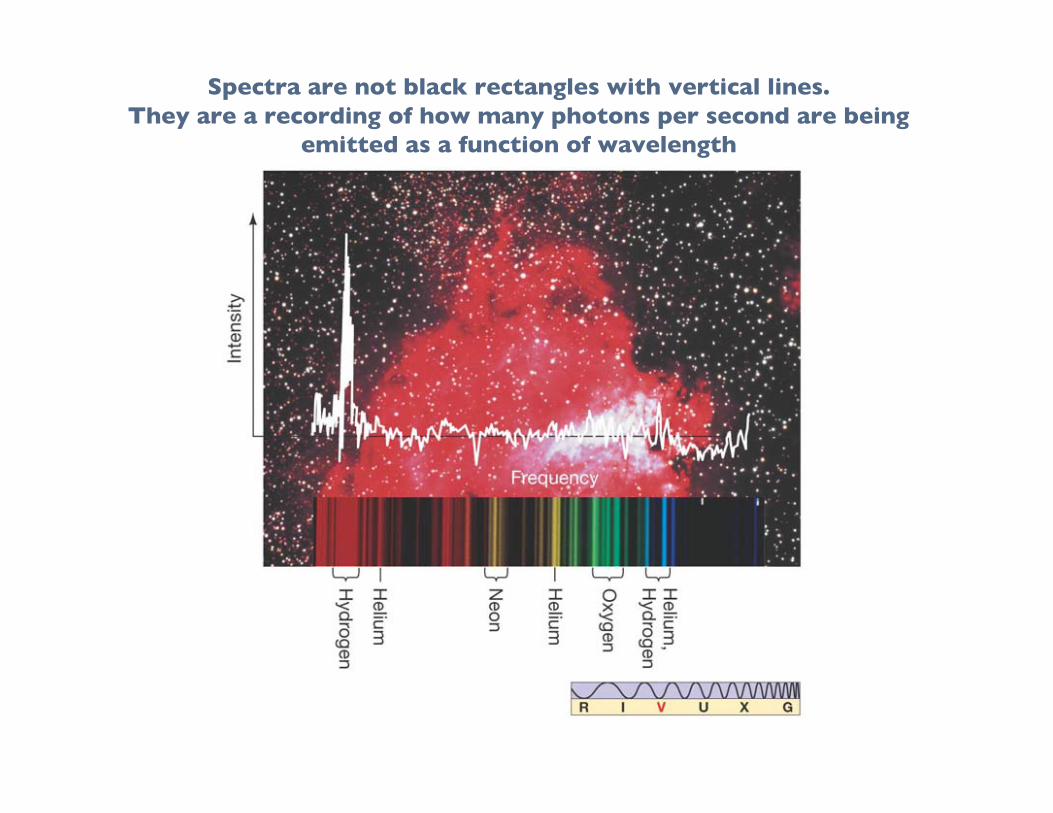
Spectra are not black rectangles with vertical lines.They are a recording of how many photons per second are being
emitted as a function of wavelength

Emission spectrumcan be used toidentify elements
4.1 Spectral Lines
An absorptionspectrum can also beused to identifyelements.
These are the emissionand absorption spectraof sodium:

Here is the Sun’s spectrum, along with a blackbody of the sun’s temperature(top--why are there no lines?), and the spectra of individual elements asobserved in the laboratory. Each spectral line is a “chemical fingerprint” tellingyou which elements, and how much of each element, is contained in the objectyou are observing.
Continuous spectrum
Sun (absorption lines)
Emission lines ofvarious elements

Kirchoff’s laws: don’t memorize them. Instead, come back to thisillustration later and find if you understand enough to explain them
“Kirchoff’s laws” are usually presented with prisms and striped colorful “spectra.”This is confusing, and they aren’t even “laws” at all!
Just note that “prism” is supposed to represent an instrument, called a “spectrometer.”
If the light from the hot “star” or blackbody doesn’t pass through any low-density gas,then the spectrum is featureless--it is a “continuous spectrum.” (top) If that continuous spectrum passes through a cloud of gas that is cooler than thesource, the cloud can absorb particular wavelengths, and you get an absorption spectrum(middle) But if the gas is hot, say at least a few thousand degrees, it will emit spectral lines on itsown (bottom), I.e. emission lines. How does this occur? The answer lies in the structure of atoms.
Maybe a star, or a planet
Maybe the atmosphere of a star or planet

Next : Energy levels of electrons in atoms

Existence of spectral lines required new model of atom,so that only certain amounts of energy could be emittedor absorbed
Bohr model had certain allowed orbits for electron
4.2 Atoms and Radiation

Emission energies correspond to energy differencesbetween allowed levels
Modern model has electron “cloud” rather than orbit
4.2 Atoms and Radiation

Absorption spectrum: Created when atoms absorbphotons of right energy for excitationMultielectron atoms: Much more complicatedspectra, many more possible states
Ionization changes energy levels
4.3 The Formation of Spectral Lines

Energy levels in H and He

Spectral lines = electronic transitions
The light emitted has awavelength correspondingto the the energy differencebetween the two electronenergy levels.

Energy levels of the hydrogen atom, showing twoseries of emission lines:Lyman and Balmer
Spectral lines of hydrogen
The energies ofthe electrons ineach orbit aregiven by:
The emission linescorrespond to theenergy differences

Absorption of energy (eitherby a collision, or byabsorbing a photon) canboost an electron to thesecond (or higher) excitedstate
Two ways to decay:
1. To ground state
2. Cascade one orbital at atime
4.3 The Formation of Spectral Lines

(a) Direct decay (b) Cascade4.3 The Formation of Spectral Lines

Absorption of light as it passes through an atmosphere

Emission lines can be used to identify atoms

Molecules can vibrate and rotate,besides having energy levels
• Electron transitions producevisible and ultraviolet lines
• Vibrational transitions produceinfrared lines
• Rotational transitions produceradio-wave lines
4.4 Molecules

Molecular spectra are much more complex thanatomic spectra, even for hydrogen:
(a) Molecular hydrogen(b) Atomic hydrogen
4.4 Molecules
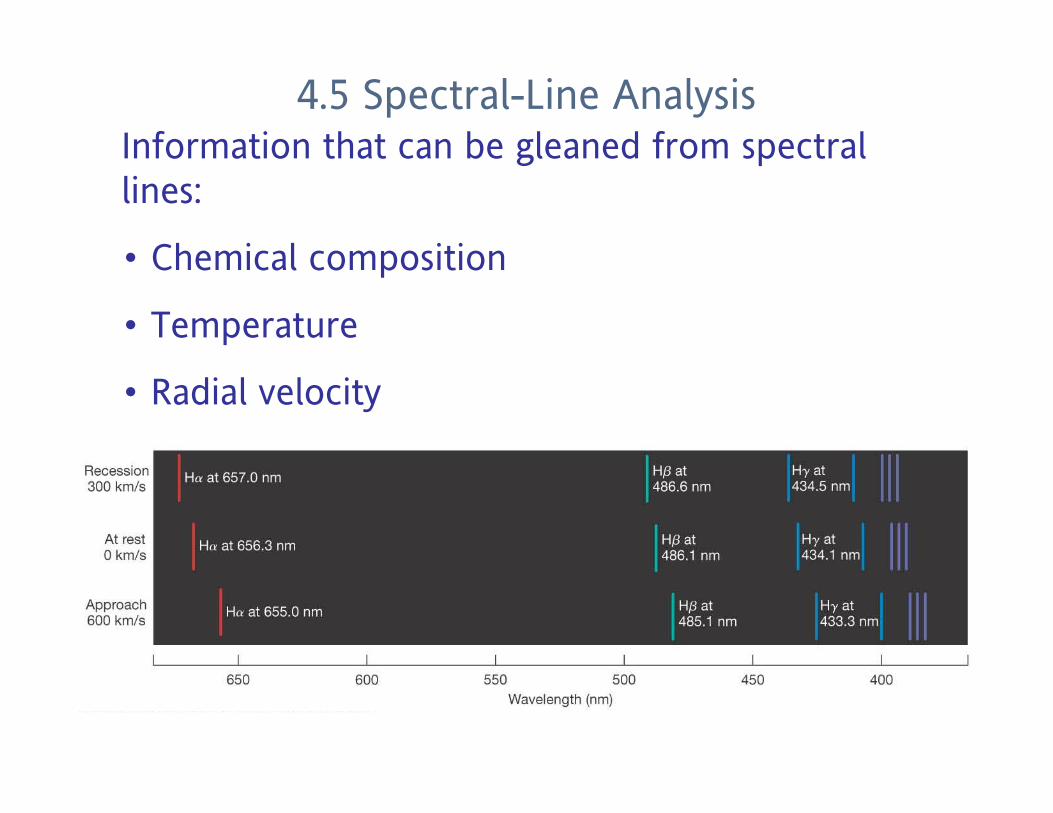
Information that can be gleaned from spectrallines:
• Chemical composition
• Temperature
• Radial velocity
4.5 Spectral-Line Analysis

Line broadening canbe due to a variety ofcauses
4.5 Spectral-Line Analysis

4.5 Spectral-Line Analysis

4.5 Spectral-Line Analysis
The Doppler shift maycause thermalbroadening of spectrallines
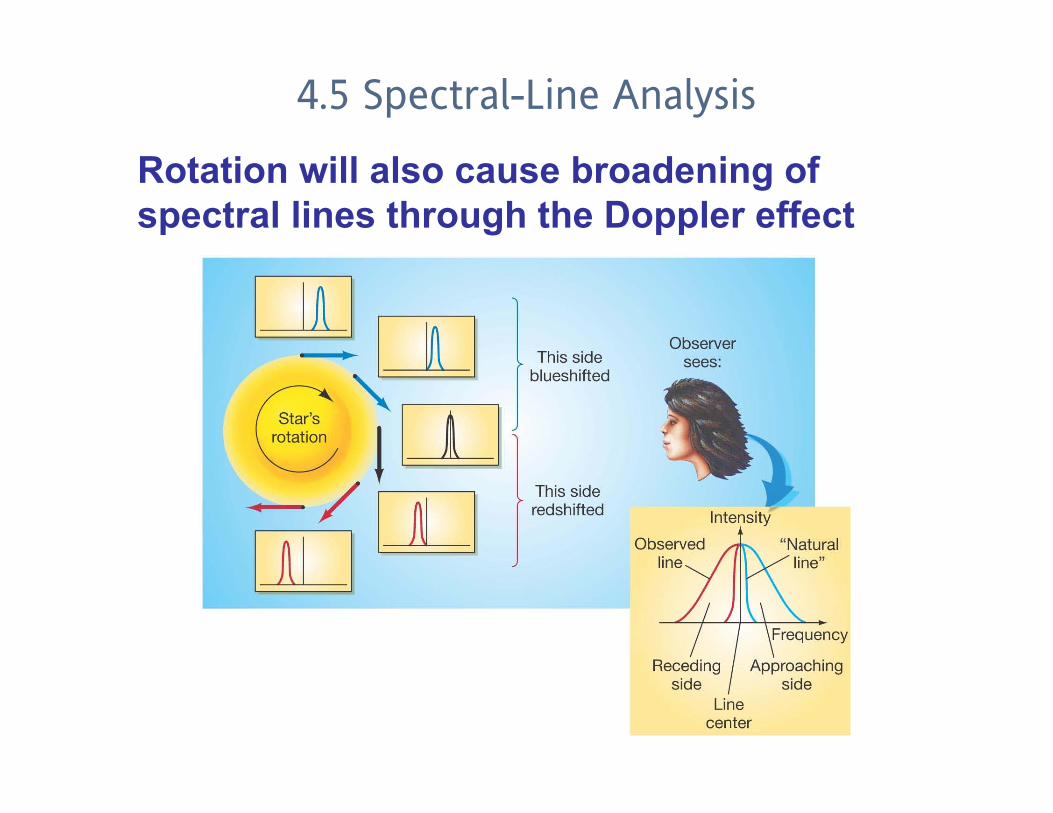
4.5 Spectral-Line Analysis
Rotation will also cause broadening ofspectral lines through the Doppler effect

• Spectroscope (spectrometer) splits light beam intocomponent frequencies/wavelengths
• Continuous spectrum is emitted by solid, liquid,and dense gas
• Hot gas has characteristic emission spectrum
• Continuous spectrum incident on cool, thin gasgives characteristic absorption spectrum
Summary of Chapter 4

• Spectra can be explained using atomic models,with electrons occupying specific orbitals
• Emission and absorption lines result fromtransitions between orbitals
• Molecules can also emit and absorb radiationwhen making transitions between vibrational orrotational states
Summary of Chapter 4 (cont.)