Embed Size (px)
Citation preview
84Glossary . . . . . . . . . . . . . . . . . . . . . . . . . . . . . . . . . . . . . . . . . . . . . .82Technical note: Data quality . . . . . . . . . . . . . . . . . . . . . . . . . . . . . . . . .80Appendix 2: Data comparison . . . . . . . . . . . . . . . . . . . . . . . . . . . . . . . .77Appendix 1: Levels of difficulty . . . . . . . . . . . . . . . . . . . . . . . . . . . . . . . .68Explanatory notes . . . . . . . . . . . . . . . . . . . . . . . . . . . . . . . . . . . . . . . .
A D D I T I O N A L I N F O R M A T I O N
67Populations . . . . . . . . . . . . . . . . . . . . . . . . . . . . . . . . . . . . . . . . . . . .60Information communication technology . . . . . . . . . . . . . . . . . . . . . . . . . .59Self-assessed health status . . . . . . . . . . . . . . . . . . . . . . . . . . . . . . . . .58Social captial . . . . . . . . . . . . . . . . . . . . . . . . . . . . . . . . . . . . . . . . . .55Self-assessed literacy . . . . . . . . . . . . . . . . . . . . . . . . . . . . . . . . . . . . .50Persons whose first language was not English . . . . . . . . . . . . . . . . . . . . . .40Employed persons . . . . . . . . . . . . . . . . . . . . . . . . . . . . . . . . . . . . . . .37Labour force . . . . . . . . . . . . . . . . . . . . . . . . . . . . . . . . . . . . . . . . . . .32Education . . . . . . . . . . . . . . . . . . . . . . . . . . . . . . . . . . . . . . . . . . . . .30Personal characteristics . . . . . . . . . . . . . . . . . . . . . . . . . . . . . . . . . . . .27International comparision . . . . . . . . . . . . . . . . . . . . . . . . . . . . . . . . . . .16Summary tables . . . . . . . . . . . . . . . . . . . . . . . . . . . . . . . . . . . . . . . . .14List of tables . . . . . . . . . . . . . . . . . . . . . . . . . . . . . . . . . . . . . . . . . . .
T A B L E S
4Summary of findings . . . . . . . . . . . . . . . . . . . . . . . . . . . . . . . . . . . . . . .3Abbreviations . . . . . . . . . . . . . . . . . . . . . . . . . . . . . . . . . . . . . . . . . . .2Notes . . . . . . . . . . . . . . . . . . . . . . . . . . . . . . . . . . . . . . . . . . . . . . . .
page
C O N T E N T S
E M B A R G O : 1 1 . 3 0 A M ( C A N B E R R A T I M E ) W E D 9 J A N 2 0 0 8
ADULT LITERACY AND LIFE SKILLSSURVEY, SUMMARY RESULTS A U S T R A L I A
4228.02 0 0 6 ( R E I S S U E )
For further informationabout these and relatedstatistics, contact theNational Information andReferral Service on1300 135 070.
I N Q U I R I E S
w w w . a b s . g o v . a u
B r i a n P i n k
Au s t r a l i a n S t a t i s t i c i a n
As estimates have been rounded, discrepancies may occur between the sums of the
component items and totals.
RO U N D I N G
This publication presents information from the 2006 Adult Literacy and Life Skills Survey
(ALLS). The results from ALLS will assist in answering questions of whether Australians'
literacy skills are adequate for the challenges they face in work and daily life. The ALLS
provides information on knowledge and skills of 15 to 74 year olds in the following four
domains: prose literacy, document literacy, numeracy and problem solving. A fifth
domain measuring health literacy proficiency was produced as a by-product of the above
domains.
AB O U T TH I S PU B L I C A T I O N
2 A B S • A D U L T L I T E R A C Y A N D L I F E SK I L L S SU R V E Y , SU M M A R Y R E S U L T S • 4 2 2 8 . 0 • 2 0 0 6 ( R E I S S U E )
N O T E S
Western AustraliaWA
standard errorSE
Survey of Aspects of LiteracySAL
Standard Australian Classification of CountriesSACC
South AustraliaSA
relative standard errorRSE
Organisation for Economic Co-operation and DevelopmentOECD
main task bookletMTB
International Adult Literacy SurveyIALS
estimated resident populationERP
Australian Government Department of Employment and Workplace RelationsDEWR
Australian Government Department of Education, Science and TrainingDEST
confidentialised unit record fileCURF
core task bookletCTB
computer assisted interviewingCAI
Australian Standard Geographical ClassificationASGC
Australian Standard Classification of OccupationsASCO
Australian Standard Classification of LanguagesASCL
Australian Standard Classification of EducationASCED
Australian and New Zealand Standard Industrial ClassificationANZSIC
Australian and New Zealand Standard Classification of OccupationsANZSCO
Adult Literacy and Life Skills SurveyALLS
International Adult Literacy and Life Skills SurveyALL
Australian Capital TerritoryACT
Australian Bureau of StatisticsABS
A B S • A D U L T L I T E R A C Y A N D L I F E SK I L L S SU R V E Y , SU M M A R Y R E S U L T S • 4 2 2 8 . 0 • 2 0 0 6 ( R E I S S U E ) 3
A B B R E V I A T I O N S
The ALLS provides information on knowledge and skills in the following four domains;
! Prose literacy: the ability to understand and use information from various kinds of
narrative texts, including texts from newspapers, magazines and brochures.
! Document literacy: the knowledge and skills required to locate and use information
contained in various formats including job applications, payroll forms, transportation
schedules, maps, tables and charts.
! Numeracy: the knowledge and skills required to effectively manage and respond to
the mathematical demands of diverse situations.
! Problem solving: goal-directed thinking and action in situations for which no routine
solution is available.
As a by-product of the above domains, a fifth domain measuring health literacy was
produced. Health literacy is defined as the knowledge and skills required to understand
and use information relating to health issues such as drugs and alcohol, disease
prevention and treatment, safety and accident prevention, first aid, emergencies, and
staying healthy.
ME A S U R E S OF L I T E R A C Y
The Adult Literacy and Life Skills Survey (ALLS) was conducted in Australia as part of an
international study coordinated by Statistics Canada and the Organisation for Economic
Co-operation and Development (OECD). In 2003, the following countries were involved
in the first wave of the study: United States of America, Bermuda, Canada, Italy, Mexico
(state of Nuevo Leon), Norway and Switzerland. Results comparing Australia and the first
wave countries (with the exception of Mexico as their results were not available at the
time of this publication) are included in tables 5 to 7. Australia participated in the second
wave of enumeration with Hungary, the Netherlands, New Zealand and South Korea.
The ALLS is designed to identify and measure literacy which can be linked to the social
and economic characteristics of people both across and within countries. The ALLS in
Australia was jointly funded by the Department of Education, Science and Technology
(DEST), the Department of Employment and Workplace Relations (DEWR) and the
Australian Bureau of Statistics (ABS). The ALLS measured the literacy of a sample of
people aged 15 to 74 years.
AB O U T TH I S SU R V E Y
Technological innovation and labour force changes, as well as the application of new
work practices, have led to major changes in the occupational composition of the
Australian labour force and in the tasks and skills required of workers. These skills are
important not only from the point of view of the labour market, they are increasingly
seen as important for an individual's ability to participate fully in modern society.
Different life contexts, including home and community, impose skill demands on
individuals at all stages of their lives. Literacy is one important underlying skill that is the
subject of this survey.
I N T R O D U C T I O N
4 A B S • A D U L T L I T E R A C Y A N D L I F E SK I L L S SU R V E Y , SU M M A R Y R E S U L T S • 4 2 2 8 . 0 • 2 0 0 6 ( R E I S S U E )
S U M M A R Y O F F I N D I N G S
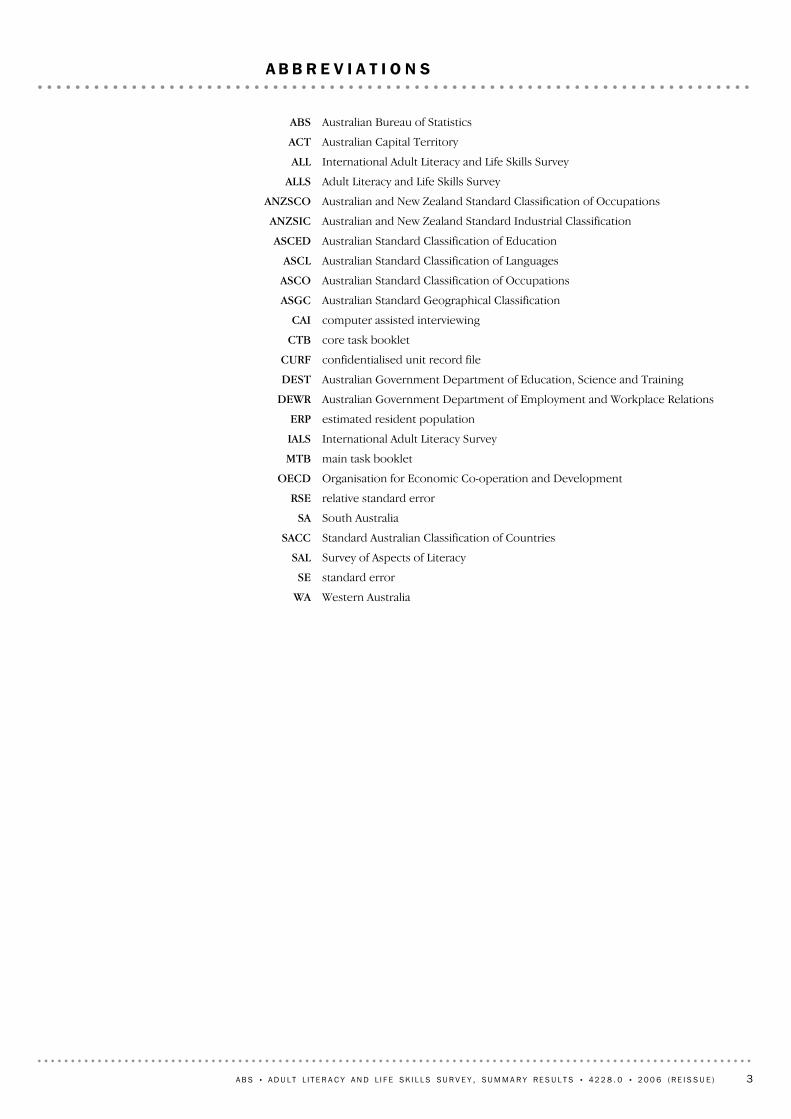
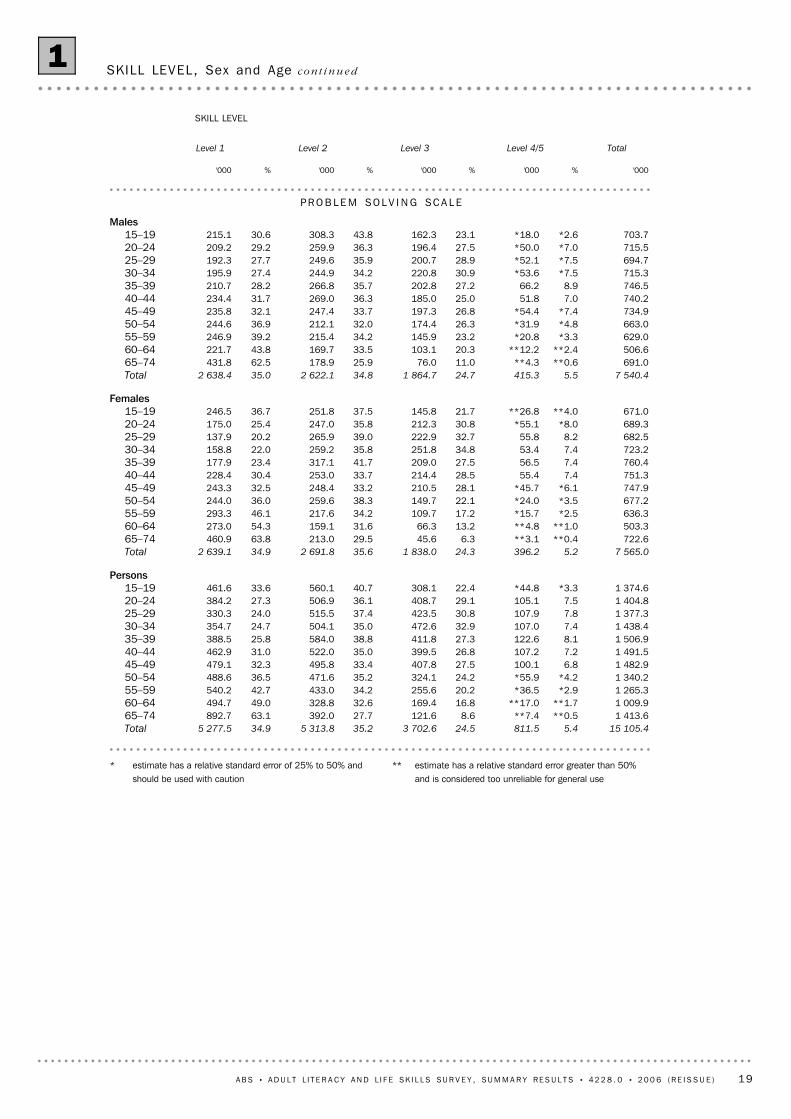
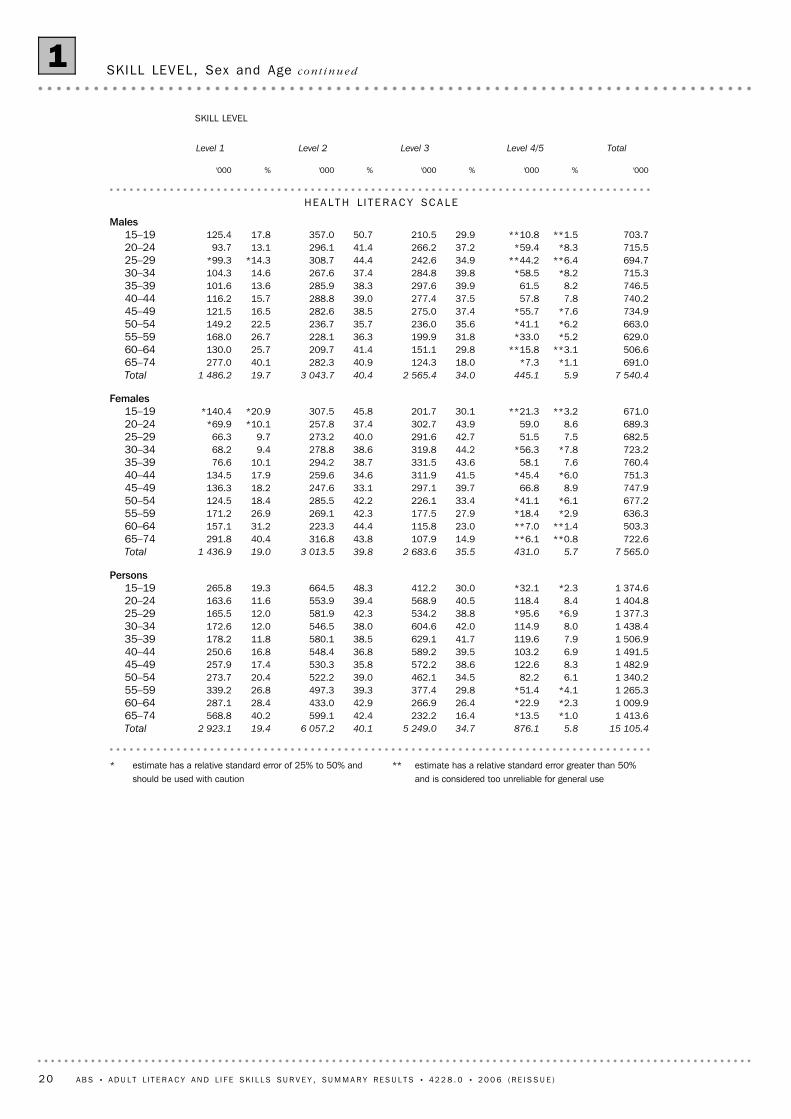
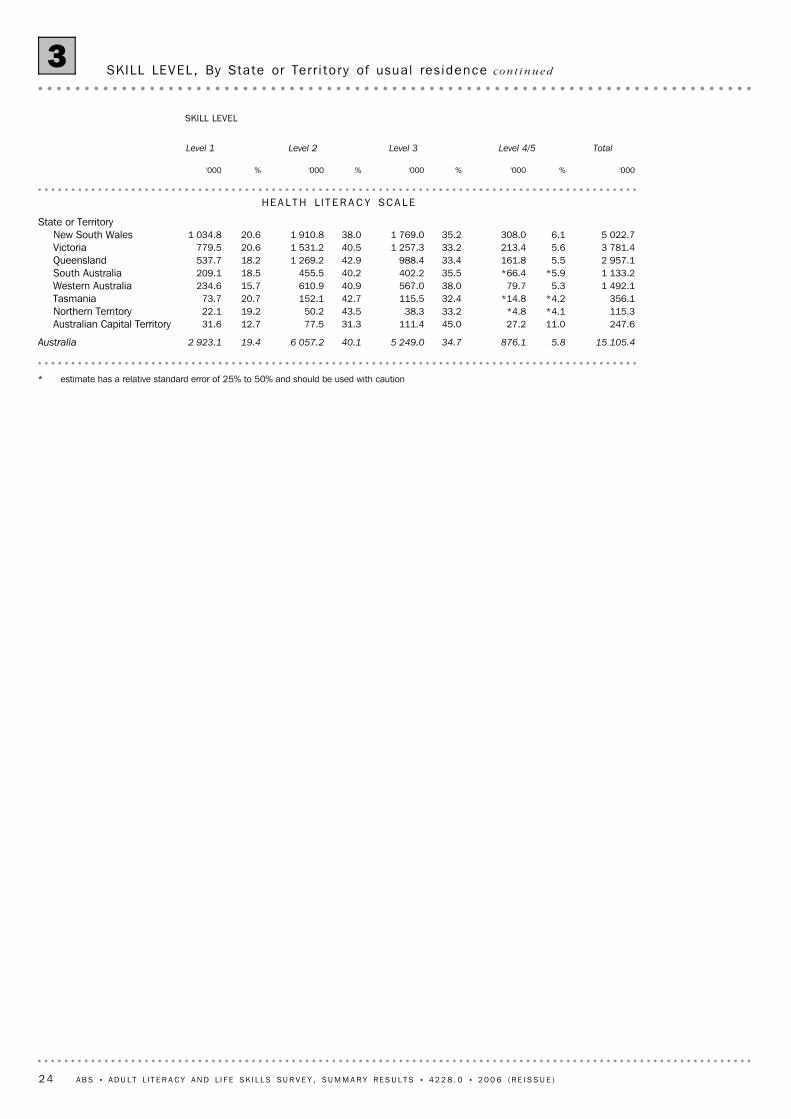
On the health scale, approximately 9 million (60%) Australians attained scores at Level 1
or 2, a further 5.2 million (35%) were at Level 3 and 900,000 (6%) were at Level 4/5
(table 1).
Prose Document Numeracy Problem solving
%
0
10
20
30
40
50 Level 1Level 2Level 3Level4/5
PROPORT ION AT EACH SKILL LEVEL1
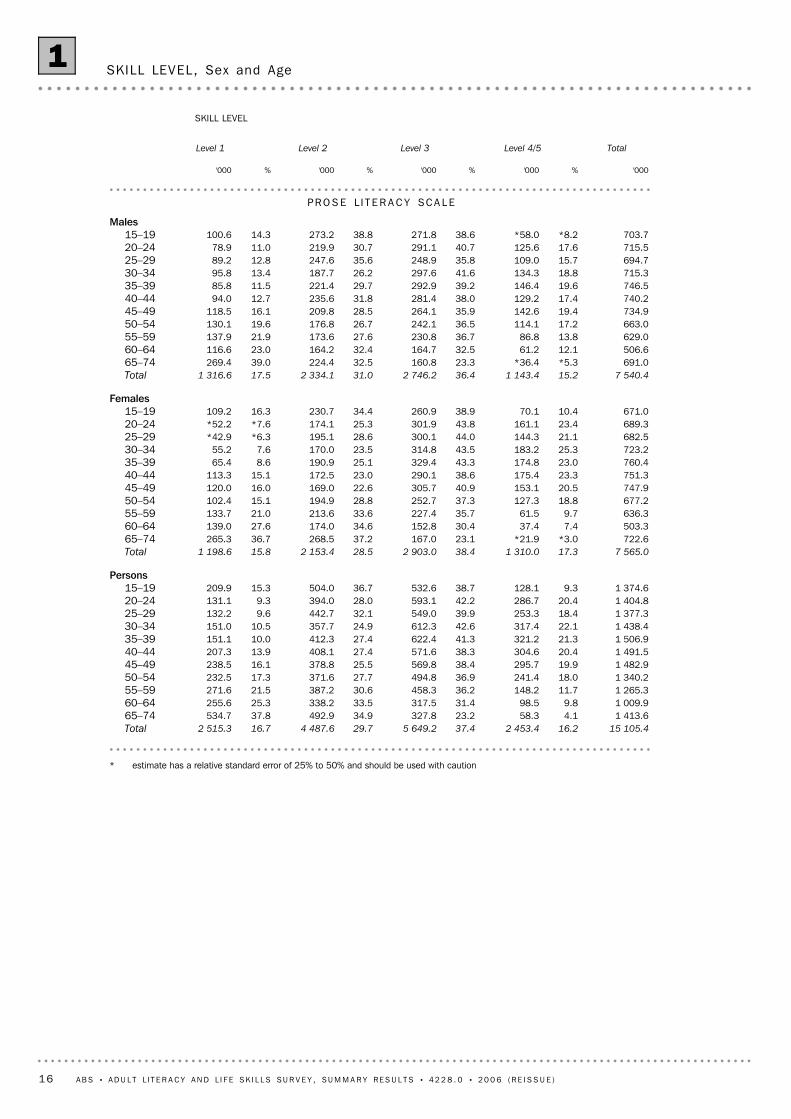
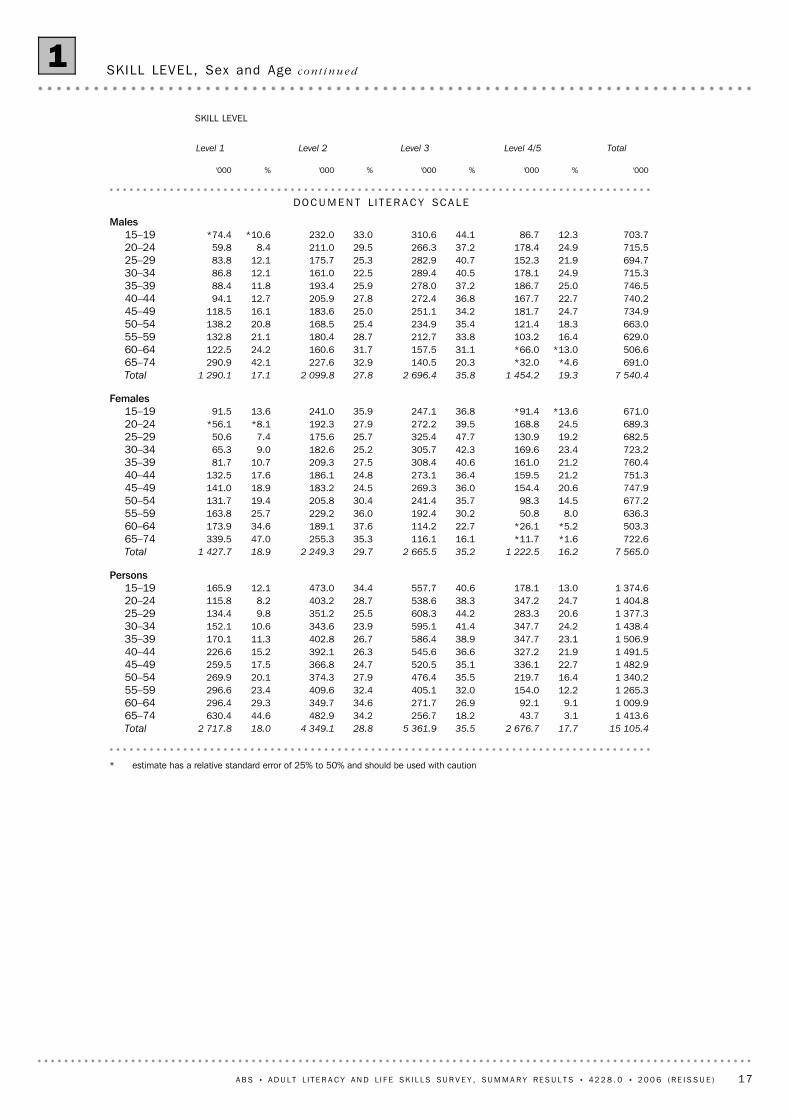
Approximately 7 million (46%) Australians aged 15 to 74 years had scores at Level 1 or 2
on the prose scale, a further 5.6 million (37%) at Level 3 and 2.5 million (16%) at Level
4/5. Results for document literacy were similar to prose. There were 7 million (47%)
Australians at Level 1 or 2 on the document scale, 5.4 million (36%) at Level 3 and 2.7
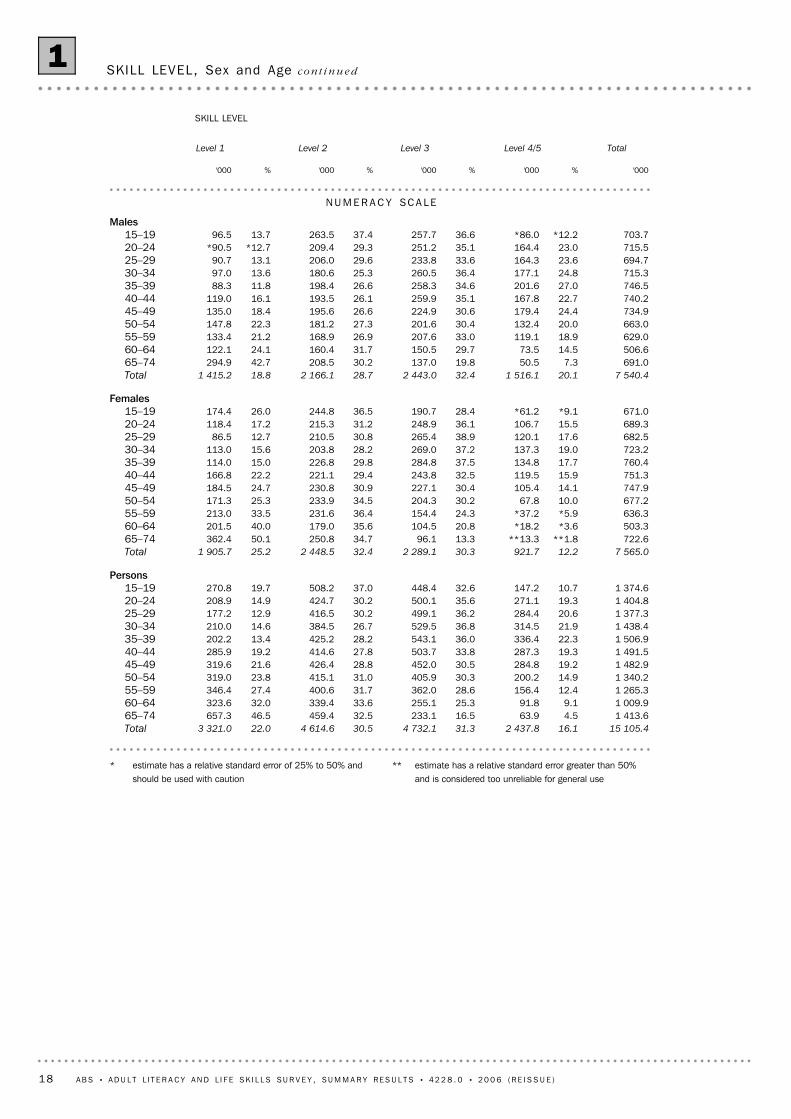
million (18%) at Level 4/5. On the numeracy scale, approximately 7.9 million (53%)
Australians were assessed at Level 1 or 2, 4.7 million (31%) at Level 3 and 2.4 million
(16%) at Level 4/5. On the problem solving scale, approximately 10.6 million (70%)
Australians were assessed at Level 1 or 2, 3.7 million (25%) at Level 3 and 800,000 (5%) at
Level 4 (table 1).
L I T E R A C Y IN 20 0 6
For each literacy domain, proficiency is measured on a scale ranging from 0 to 500
points. To facilitate analysis, these continuous scores have been grouped into 5 skill
levels (only 4 levels were defined for the problem solving scale) with Level 1 being the
lowest measured level of literacy. The relatively small proportions of respondents who
actually reach Level 5 often results in unreliable estimates of the number of people at this
level. For this reason, whenever results are presented by skill level, Levels 4 and 5 are
combined. To assist with interpreting the results, Level 3 is regarded by the survey
developers as the "minimum required for individuals to meet the complex demands of
everyday life and work in the emerging knowledge-based economy" (Learning a Living:
First results from the Adult Literacy and Life Skills Survey', available from Statistics
Canada's website (www.statcan.ca)). For a full description of the levels, refer to
Appendix 1.
ME A S U R E S OF L I T E R A C Y
continued
A B S • A D U L T L I T E R A C Y A N D L I F E SK I L L S SU R V E Y , SU M M A R Y R E S U L T S • 4 2 2 8 . 0 • 2 0 0 6 ( R E I S S U E ) 5
S U M M A R Y O F F I N D I N G S continued
Level 1 Level 2 Level 3 Level 4/5
%
0
10
20
30
40 19962006
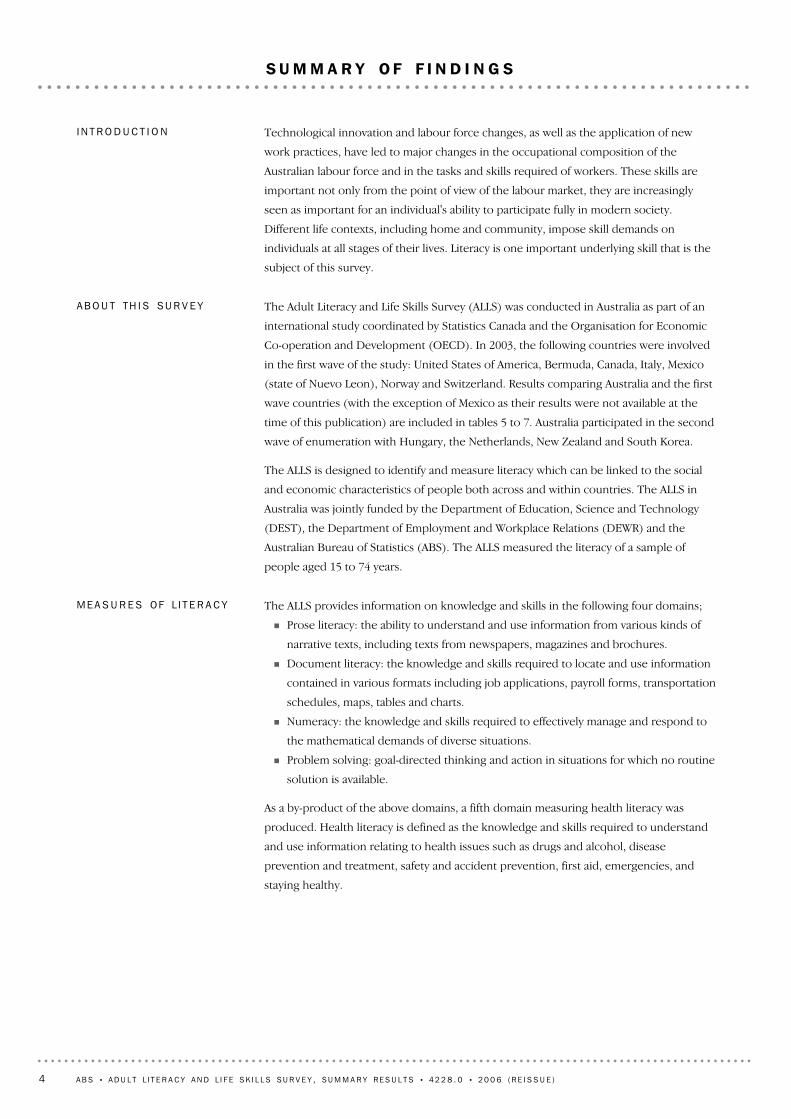
PROSE LITERACY BY SKILL LEVEL— 1996 to 20062
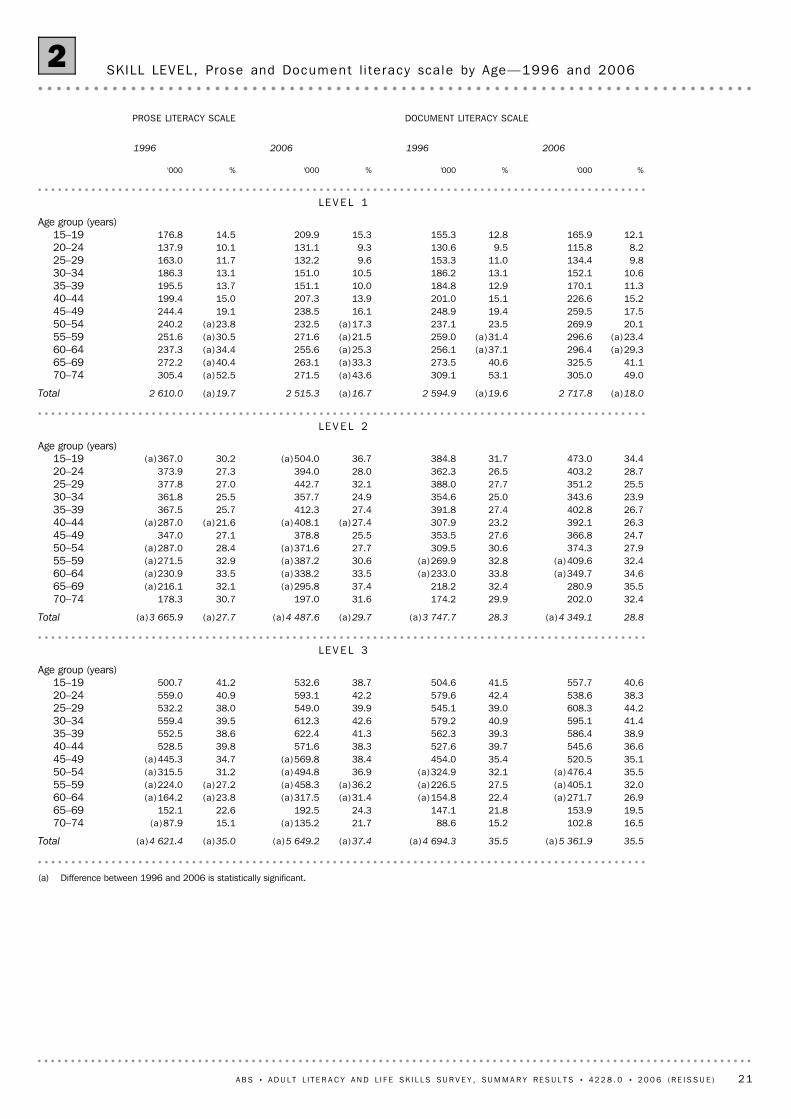
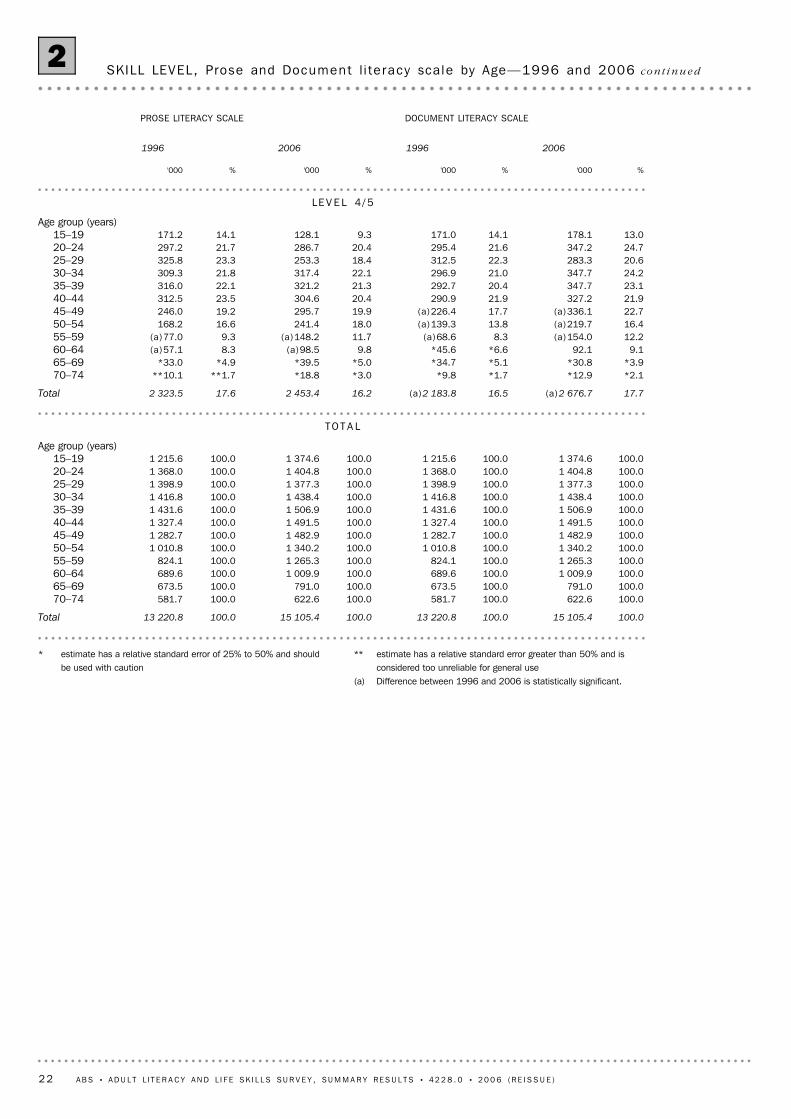
Of the five literacy domains available from the 2006 ALLS only two, prose and document
literacy, are directly comparable to those derived from the 1996 Survey of Aspects of
Literacy (SAL). The quantitative literacy domain, derived from the 1996 SAL, was
narrowly focused on numeracy competency and did not necessarily emphasise real-life
tasks which demand more diverse numeracy skills. Consequently, an expanded concept
of adult numeracy has been incorporated in the 2006 ALLS numeracy scale. As a result of
these conceptual differences, the two scales can not be compared. The problem solving
and the health literacy domains are additions to the 2006 ALLS and hence no time series
information is available.
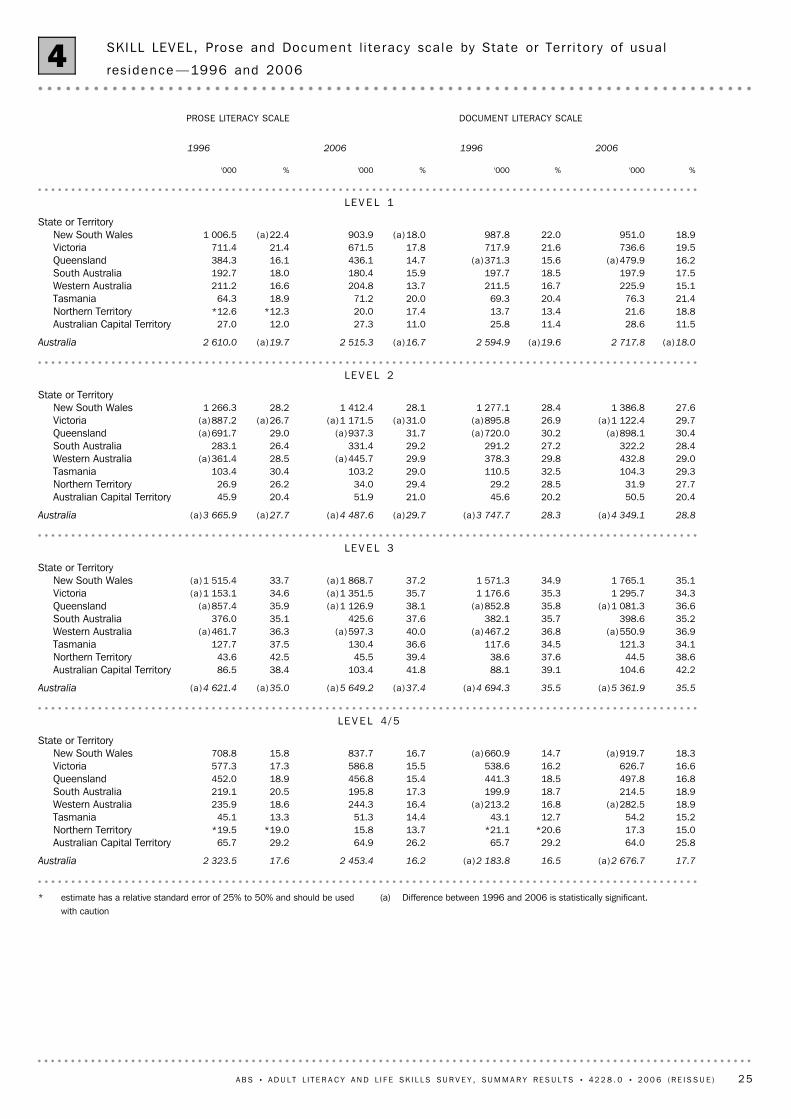
There were small, but statistically significant changes in the achieved prose and
document literacy levels of Australians from 1996. There was a statistically significant
decrease in the proportion of people at Level 1 for both prose (from 20% in 1996 to 17%
in 2006) and document literacy (from 20% in 1996 to 18% in 2006). The proportion of
people at Level 2 for document literacy remained stable, while there was a statistically
significant increase from 28% to 30% in the proportion of people attaining Level 2 for
prose literacy. The proportion of the population at Level 3 on the prose scale increased
significantly from 35% to 37%. There was no change in the proportion of people
attaining Level 3 on the document scale (36%). Similarly, the proportion of the
population at Level 4/5 on the prose and document scale did not change significantly
(table 2).
HA V E AU S T R A L I A N S '
PR O S E AN D DO C U M E N T
L I T E R A C Y SK I L L S
IM P R O V E D IN 20 0 6 ?
6 A B S • A D U L T L I T E R A C Y A N D L I F E SK I L L S SU R V E Y , SU M M A R Y R E S U L T S • 4 2 2 8 . 0 • 2 0 0 6 ( R E I S S U E )
S U M M A R Y O F F I N D I N G S continued
A higher proportion of females attained literacy scores of Level 3 or above on the prose
(56%) and health (41%) literacy scales compared to males (52% and 40% respectively).
There was a higher proportion of males attaining scores of Level 3 or above on the
document (55%) and numeracy (53%) scales compared to 51% and 42% respectively for
females. On the problem solving scale, 30% of males and females attained literacy scores
of Level 3 or above (table 1).
SE X
Comparing prose and document literacy levels in 1996 to those in 2006, there were
statistically significant changes across the older population, with decreases in the
proportions attaining Level 1, and increases in the proportions attaining Level 2 and 3.
For the prose scale, in 2006 there were fewer people over the age of 50 years attaining
Level 1, more people aged 40 to 44 years attaining Level 2, and more people aged 55 to
64 years attaining Level 3. On the document scale, there was a statistically significant
decrease in the proportions of 55 to 64 year olds attaining skill Level 1. For all other age
groups, there were no statistically significant changes from 1996 (table 2).
15-19 20-24 25-29 30-34 35-39 40-44 45-49 50-54 55-59 60-64 65-74Age groups
%
20
40
60
80
100 ProseDocumentNumeracyProblem solvingHealth
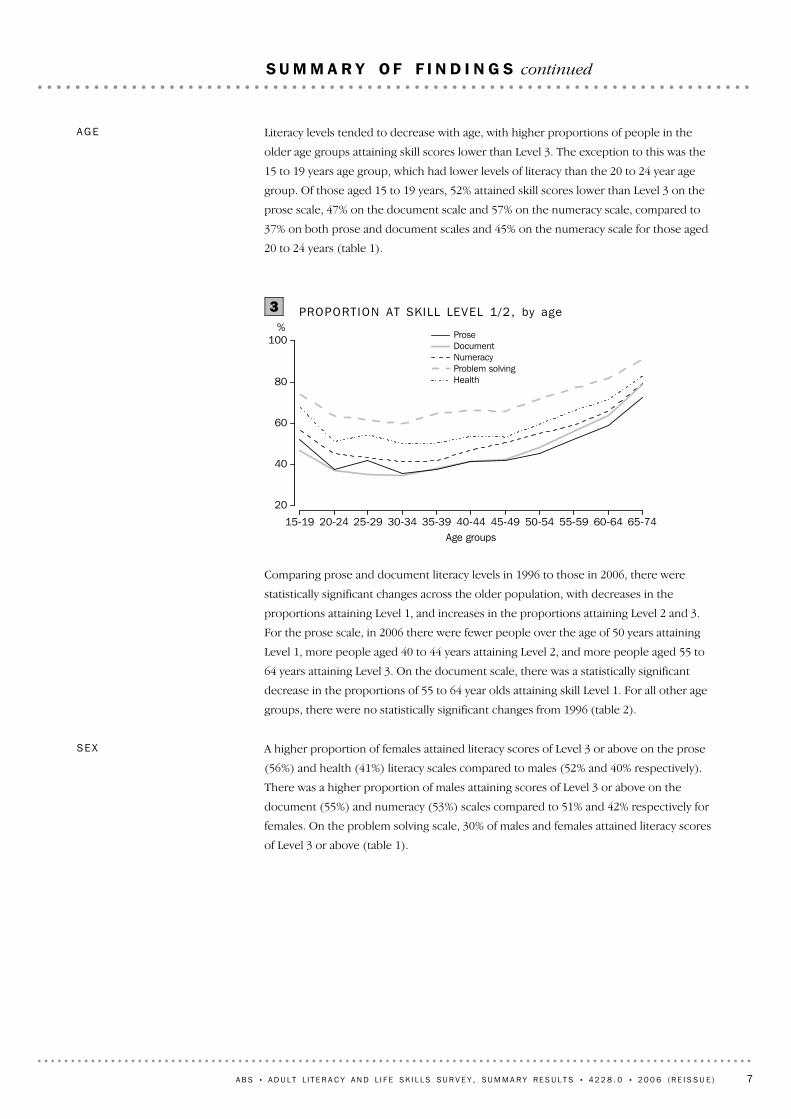
PROPORT ION AT SKILL LEVEL 1/2, by age3
Literacy levels tended to decrease with age, with higher proportions of people in the
older age groups attaining skill scores lower than Level 3. The exception to this was the
15 to 19 years age group, which had lower levels of literacy than the 20 to 24 year age
group. Of those aged 15 to 19 years, 52% attained skill scores lower than Level 3 on the
prose scale, 47% on the document scale and 57% on the numeracy scale, compared to
37% on both prose and document scales and 45% on the numeracy scale for those aged
20 to 24 years (table 1).
AG E
A B S • A D U L T L I T E R A C Y A N D L I F E SK I L L S SU R V E Y , SU M M A R Y R E S U L T S • 4 2 2 8 . 0 • 2 0 0 6 ( R E I S S U E ) 7
S U M M A R Y O F F I N D I N G S continued
(a) People aged 16-65 years
16-24 25-34 35-44 45-54 55-65Age groups
%
0
20
40
60
80 AustraliaCanadaNorwayUnited StatesItaly
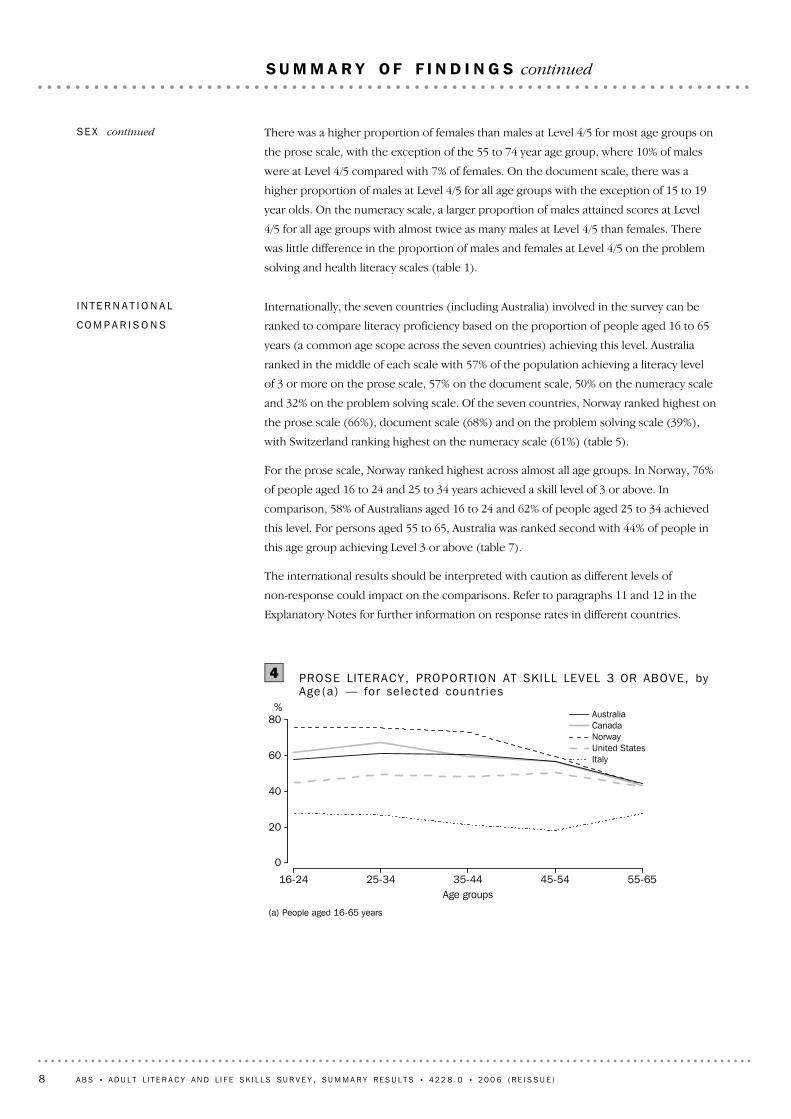
PROSE LITERACY, PROPORTION AT SKILL LEVEL 3 OR ABOVE, byAge(a) — for se lec ted count r ies
4
Internationally, the seven countries (including Australia) involved in the survey can be
ranked to compare literacy proficiency based on the proportion of people aged 16 to 65
years (a common age scope across the seven countries) achieving this level. Australia
ranked in the middle of each scale with 57% of the population achieving a literacy level
of 3 or more on the prose scale, 57% on the document scale, 50% on the numeracy scale
and 32% on the problem solving scale. Of the seven countries, Norway ranked highest on
the prose scale (66%), document scale (68%) and on the problem solving scale (39%),
with Switzerland ranking highest on the numeracy scale (61%) (table 5).
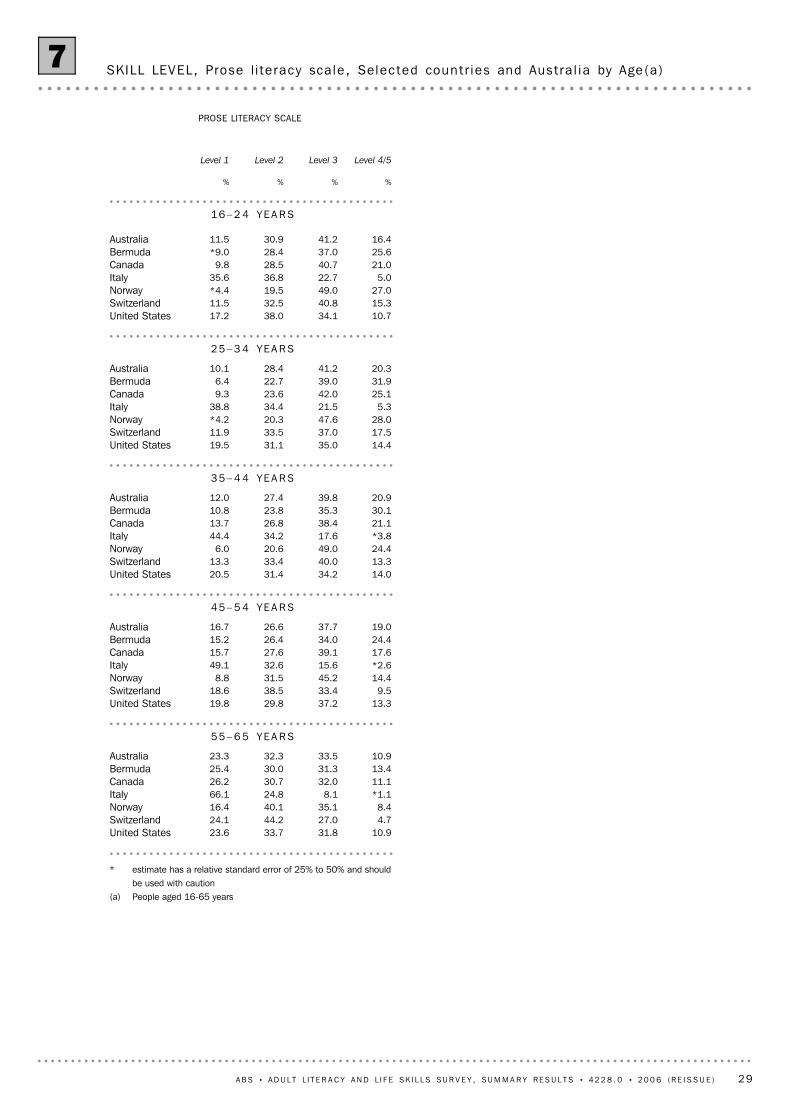
For the prose scale, Norway ranked highest across almost all age groups. In Norway, 76%
of people aged 16 to 24 and 25 to 34 years achieved a skill level of 3 or above. In
comparison, 58% of Australians aged 16 to 24 and 62% of people aged 25 to 34 achieved
this level. For persons aged 55 to 65, Australia was ranked second with 44% of people in
this age group achieving Level 3 or above (table 7).
The international results should be interpreted with caution as different levels of
non-response could impact on the comparisons. Refer to paragraphs 11 and 12 in the
Explanatory Notes for further information on response rates in different countries.
I N T E R N A T I O N A L
CO M P A R I S O N S
There was a higher proportion of females than males at Level 4/5 for most age groups on
the prose scale, with the exception of the 55 to 74 year age group, where 10% of males
were at Level 4/5 compared with 7% of females. On the document scale, there was a
higher proportion of males at Level 4/5 for all age groups with the exception of 15 to 19
year olds. On the numeracy scale, a larger proportion of males attained scores at Level
4/5 for all age groups with almost twice as many males at Level 4/5 than females. There
was little difference in the proportion of males and females at Level 4/5 on the problem
solving and health literacy scales (table 1).
SE X continued
8 A B S • A D U L T L I T E R A C Y A N D L I F E SK I L L S SU R V E Y , SU M M A R Y R E S U L T S • 4 2 2 8 . 0 • 2 0 0 6 ( R E I S S U E )
S U M M A R Y O F F I N D I N G S continued
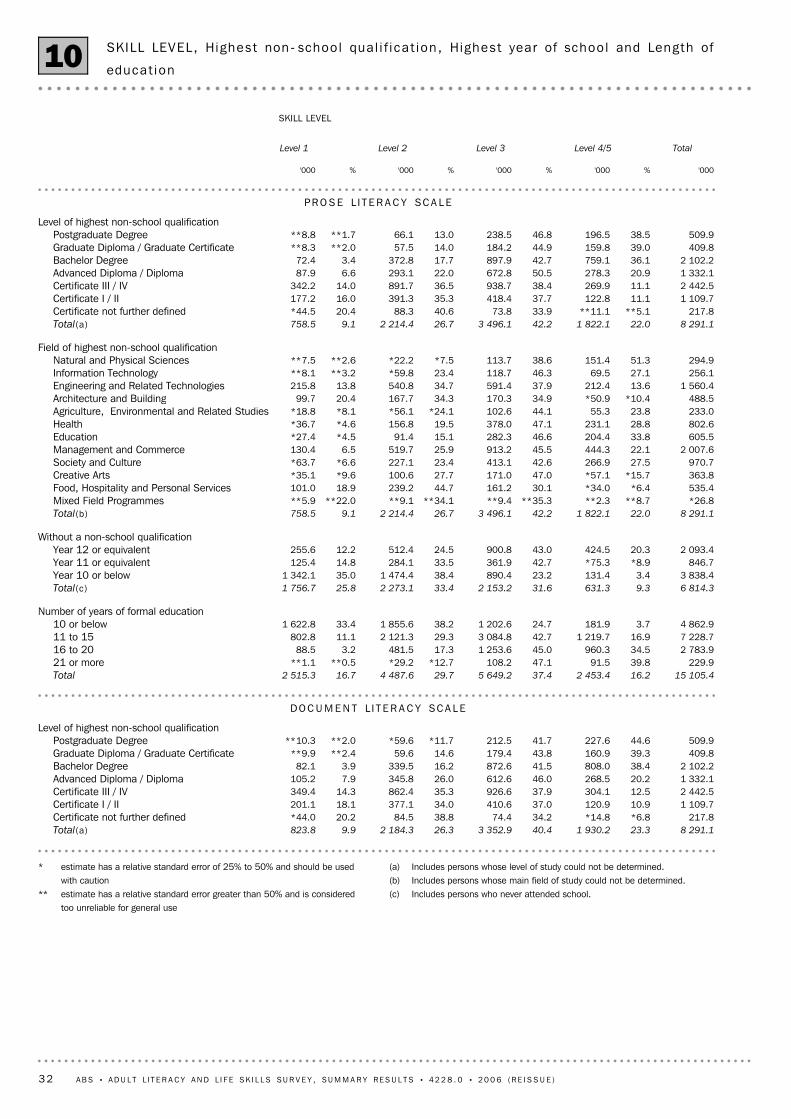
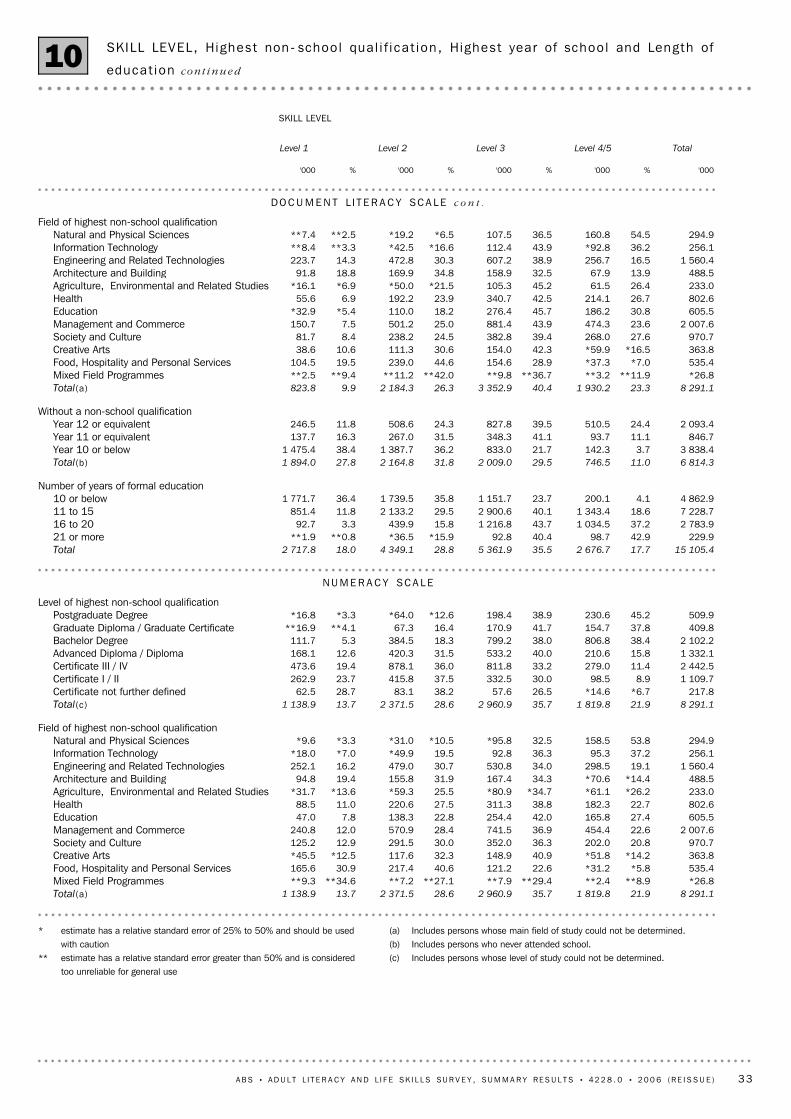
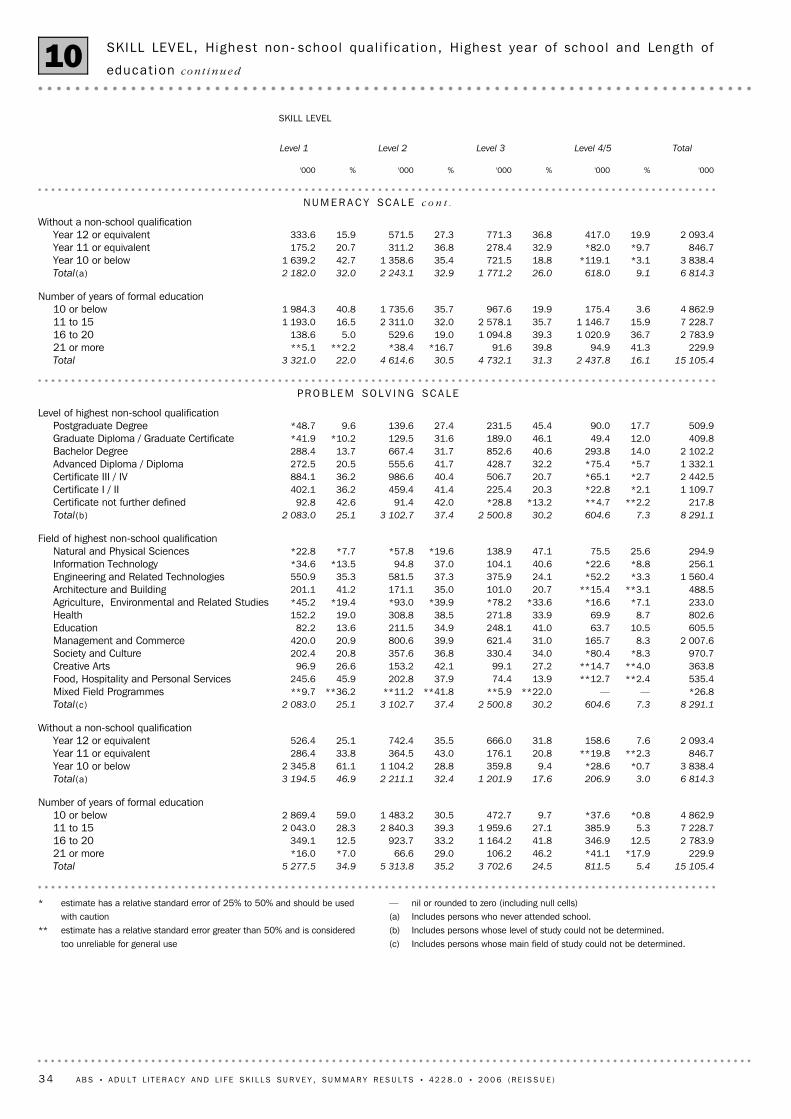
There was a strong association between educational attainment and achieved literacy
levels. People who had completed a qualification generally had higher literacy scores. For
both the prose and document literacy scales, 64% of persons who had completed a
qualification achieved Level 3 or above, compared to 41% for those who had not
completed such a qualification. On the numeracy scale, 58% of persons who had
completed a qualification achieved Level 3 or above, compared to 35% for those who had
not completed a qualification (table 10).
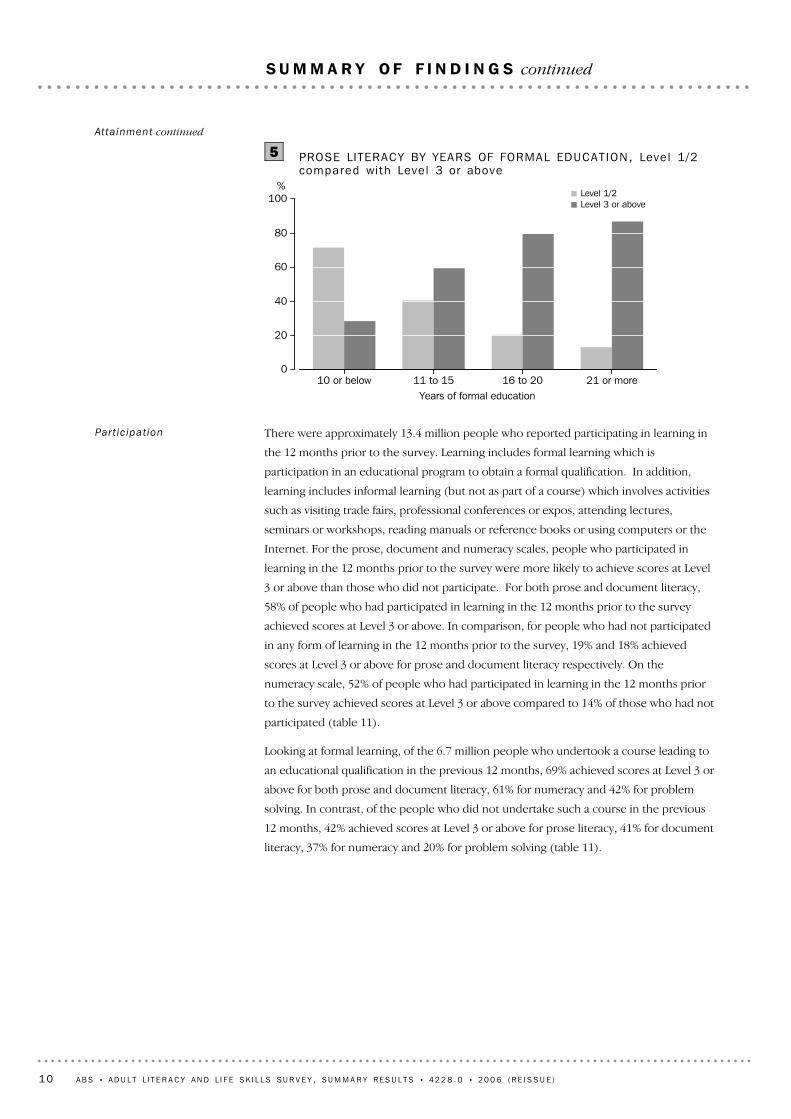
In addition, those that had completed a greater number of years of formal education
achieved higher literacy scores across all scales. Those with 21 or more years of formal
education had the highest proportion of scores at Level 4/5 ranging between 40% and
43% on the prose, document and numeracy scales and 18% on the problem solving
scale. In contrast, those with 10 or fewer years of formal education had the highest
proportion of scores at Level 1 for these scales (between 33% to 59%) (table 10).
ED U C A T I O N ST A T U S
Attainment
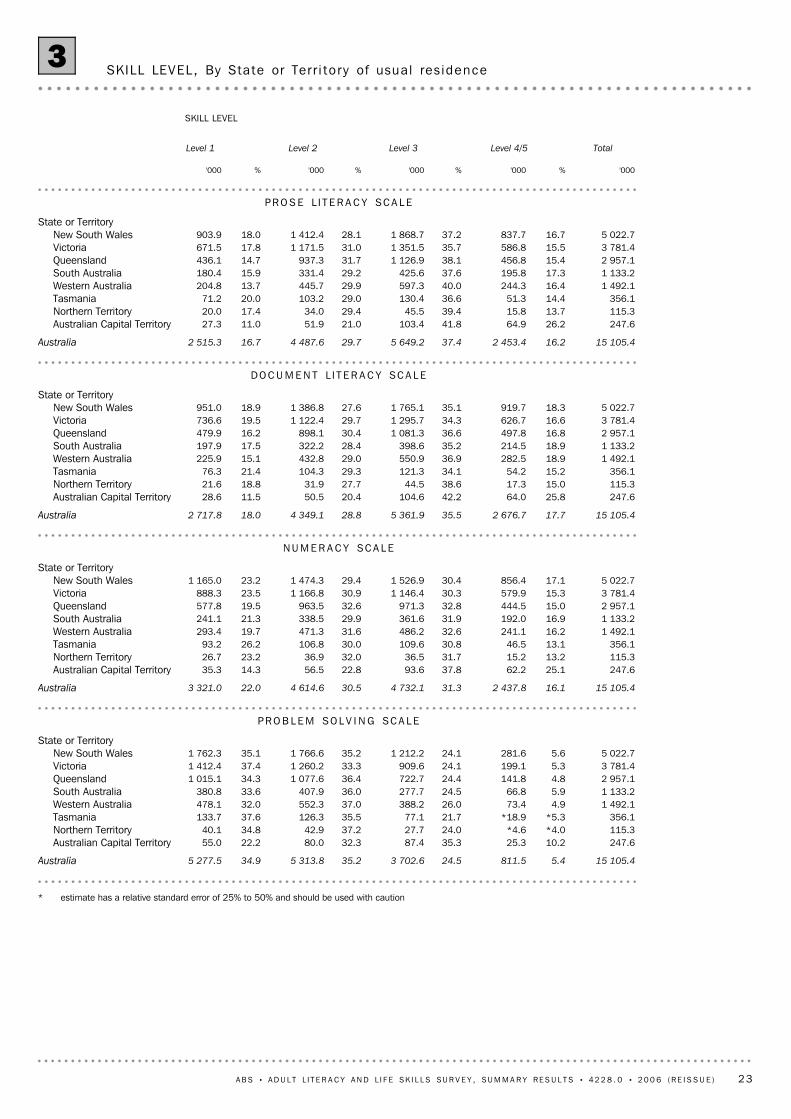
Examining the proportion of those who attained literacy scores of Level 3 or above, the
Australian Capital Territory (ACT) ranked highest on all scales followed by Western
Australia (WA) and South Australia (SA). For the prose and document scales, 68% of
those in ACT attained literacy scores of Level 3 or above, compared to 56% in WA and
55% for prose and 54% for document literacy in SA. On the numeracy scale, 63% of those
in the ACT attained literacy scores of Level 3 or above, compared to 49% for SA and WA.
While the ACT was ranked highest on the problem solving scale, with 46% attaining Level
3 or above, the results were similar across all other states and territories, ranging from
27% to 31% (table 3).
Tasmania had the highest proportion of people aged 15 to 74 at Level 1 of all the states
and territories for each literacy scale. The ACT recorded the lowest proportion of people
at Level 1 and the highest proportion of people at Level 4/5 on each literacy scale
(table 3).
Some of the differences between states and territories in literacy performance may be
due to differences in the socio-demographic characteristics of their populations,
including variations in age structures, labour force status, patterns of migration and
educational attainment.
ST A T E AN D TE R R I T O R Y
A B S • A D U L T L I T E R A C Y A N D L I F E SK I L L S SU R V E Y , SU M M A R Y R E S U L T S • 4 2 2 8 . 0 • 2 0 0 6 ( R E I S S U E ) 9
S U M M A R Y O F F I N D I N G S continued
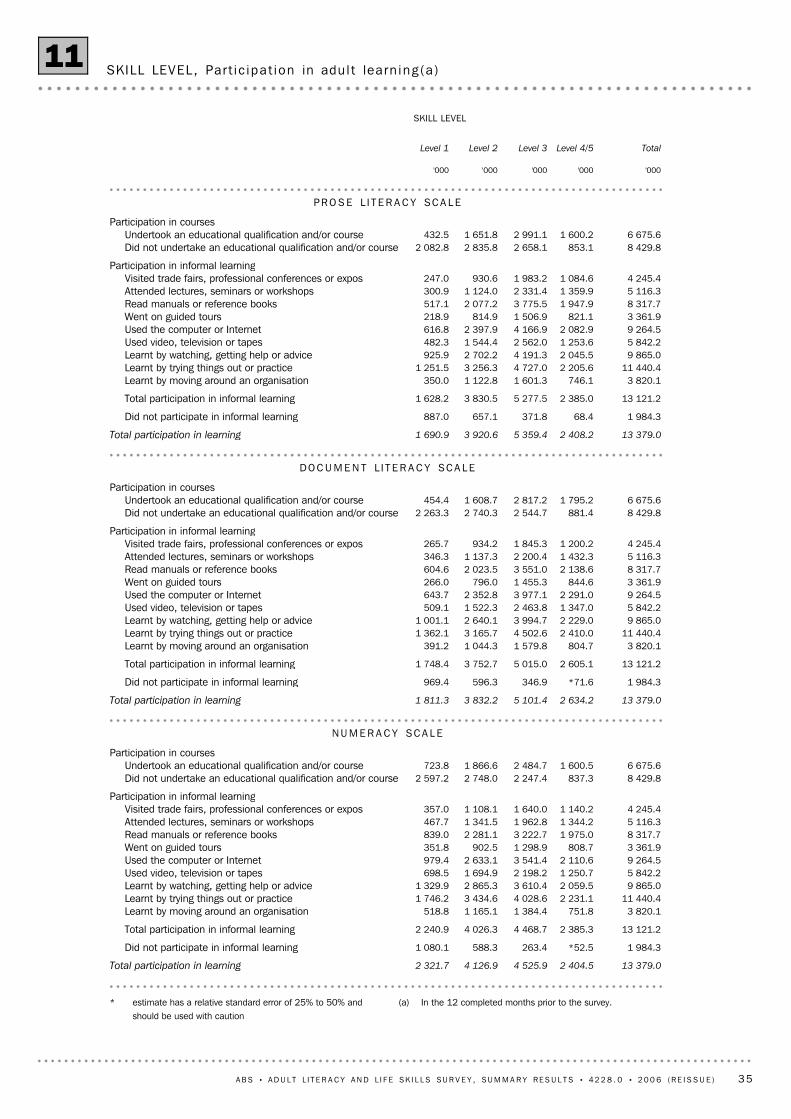
There were approximately 13.4 million people who reported participating in learning in
the 12 months prior to the survey. Learning includes formal learning which is
participation in an educational program to obtain a formal qualification. In addition,
learning includes informal learning (but not as part of a course) which involves activities
such as visiting trade fairs, professional conferences or expos, attending lectures,
seminars or workshops, reading manuals or reference books or using computers or the
Internet. For the prose, document and numeracy scales, people who participated in
learning in the 12 months prior to the survey were more likely to achieve scores at Level
3 or above than those who did not participate. For both prose and document literacy,
58% of people who had participated in learning in the 12 months prior to the survey
achieved scores at Level 3 or above. In comparison, for people who had not participated
in any form of learning in the 12 months prior to the survey, 19% and 18% achieved
scores at Level 3 or above for prose and document literacy respectively. On the
numeracy scale, 52% of people who had participated in learning in the 12 months prior
to the survey achieved scores at Level 3 or above compared to 14% of those who had not
participated (table 11).
Looking at formal learning, of the 6.7 million people who undertook a course leading to
an educational qualification in the previous 12 months, 69% achieved scores at Level 3 or
above for both prose and document literacy, 61% for numeracy and 42% for problem
solving. In contrast, of the people who did not undertake such a course in the previous
12 months, 42% achieved scores at Level 3 or above for prose literacy, 41% for document
literacy, 37% for numeracy and 20% for problem solving (table 11).
Part ic ipat ion
10 or below 11 to 15 16 to 20 21 or moreYears of formal education
%
0
20
40
60
80
100 Level 1/2Level 3 or above
PROSE LITERACY BY YEARS OF FORMAL EDUCAT ION, Leve l 1/2compared wi th Leve l 3 or above
5Attainment continued
10 A B S • A D U L T L I T E R A C Y A N D L I F E SK I L L S SU R V E Y , SU M M A R Y R E S U L T S • 4 2 2 8 . 0 • 2 0 0 6 ( R E I S S U E )
S U M M A R Y O F F I N D I N G S continued
From 1996 to 2006, prose and document literacy scores for employed people has shown
no statistically significant changes across most age groups. The exception to this was for
employed people aged 25 to 34 years who attained scores at Level 4/5 on the prose scale,
decreasing from 25% in 1996 to 21% in 2006 (table 16).
On the document scale, 68% of employed people who read letters, memos or emails at
least once a week attained scores at Level 3 or above. Conversely, 32% of employed
people who never read letters, memos or emails had scores at Level 3 or above. These
results were similar for frequency of reading or using reports, articles, magazines or
journals; manuals or reference books including catalogues; and directions or instructions
(table 17).
On the numeracy scale, 60% of employed people who count or read numbers to keep
track of things at least once a week attained scores of Level 3 or above. In contrast, 25%
of employed people who never count or read numbers to keep track of things had
scores at Level 3 or above. For employed people who write or fill in bills, invoices,
spreadsheets or budget tables at least once a week, 64% attained scores at Level 3 or
above, while of those who never perform these tasks, 40% attained scores at Level 3 or
above (table 18).
Employed persons
Prose Document Numeracy Problem solving
%
0
20
40
60
80 EmployedUnemployedNot in the Labour Force
SKILL LEVEL , PROPORT ION AT LEVEL 3 OR ABOVE, by Labourforce status
6
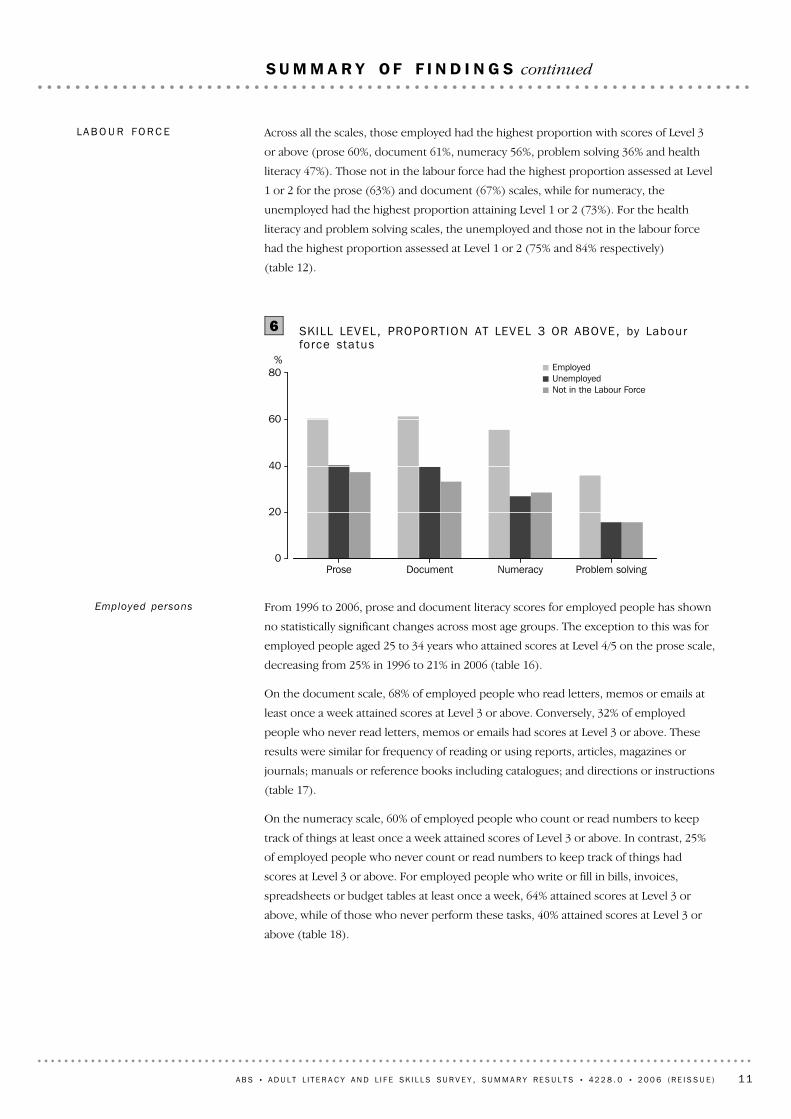
Across all the scales, those employed had the highest proportion with scores of Level 3
or above (prose 60%, document 61%, numeracy 56%, problem solving 36% and health
literacy 47%). Those not in the labour force had the highest proportion assessed at Level
1 or 2 for the prose (63%) and document (67%) scales, while for numeracy, the
unemployed had the highest proportion attaining Level 1 or 2 (73%). For the health
literacy and problem solving scales, the unemployed and those not in the labour force
had the highest proportion assessed at Level 1 or 2 (75% and 84% respectively)
(table 12).
LA B O U R FO R C E
A B S • A D U L T L I T E R A C Y A N D L I F E SK I L L S SU R V E Y , SU M M A R Y R E S U L T S • 4 2 2 8 . 0 • 2 0 0 6 ( R E I S S U E ) 11
S U M M A R Y O F F I N D I N G S continued
Over half of the population (53%) rated their English reading skills for the needs of daily
life as excellent. Of this population, 71% achieved a literacy score at Level 3 or above on
the prose scale and 68% on the document scale. Only 4% of people responding to the
survey rated their English reading skills for the needs of daily life as poor compared with
17% who achieved a literacy score at Level 1 on the prose scale and 18% on the
document scale. Of those who rated their English reading skills for the needs of daily life
as poor, 83% achieved scores at Level 1 on the prose scale and 81% on the document
scale (table 20).
SE L F RA T I N G VS
AS S E S S E D L I T E R A C Y
Prose and Document
literacy
Those with higher literacy scores (Level 3 or above) were more likely to have used the
Internet. Of those with literacy scores at Level 3 or above on the document scale, 79%
used the Internet for email at least a few times a week compared to 40% of people with
scores at Level 1 or 2. In addition, 64% of people with scores at Level 3 or above used the
Internet for shopping at least a few times a month, compared to 33% for those at Level 1
or 2. These results were similar for people who used the Internet for banking or general
browsing (table 24).
I N F O R M A T I O N
CO M M U N I C A T I O N
TE C H N O L O G Y
Quintile 1 Quintile 2 Quintile 3 Quintile 4 Quintile 5Personal gross weekly income quintile
%
0
10
20
30
40 Level 1Level 4/5
DOCUMENT LITERACY BY PERSONAL GROSS WEEKLY INCOMEQUINT ILES FOR EMPLOYED PEOPLE, Leve l 1 compared wi th Leve l4/5
7
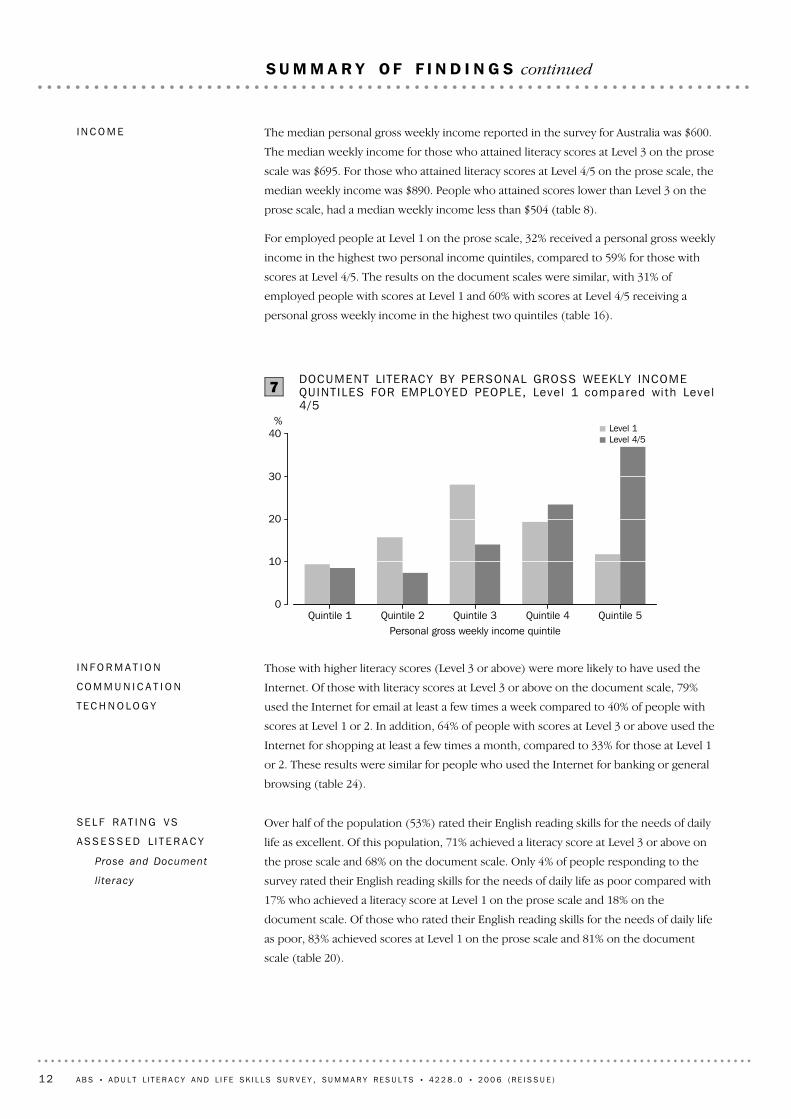
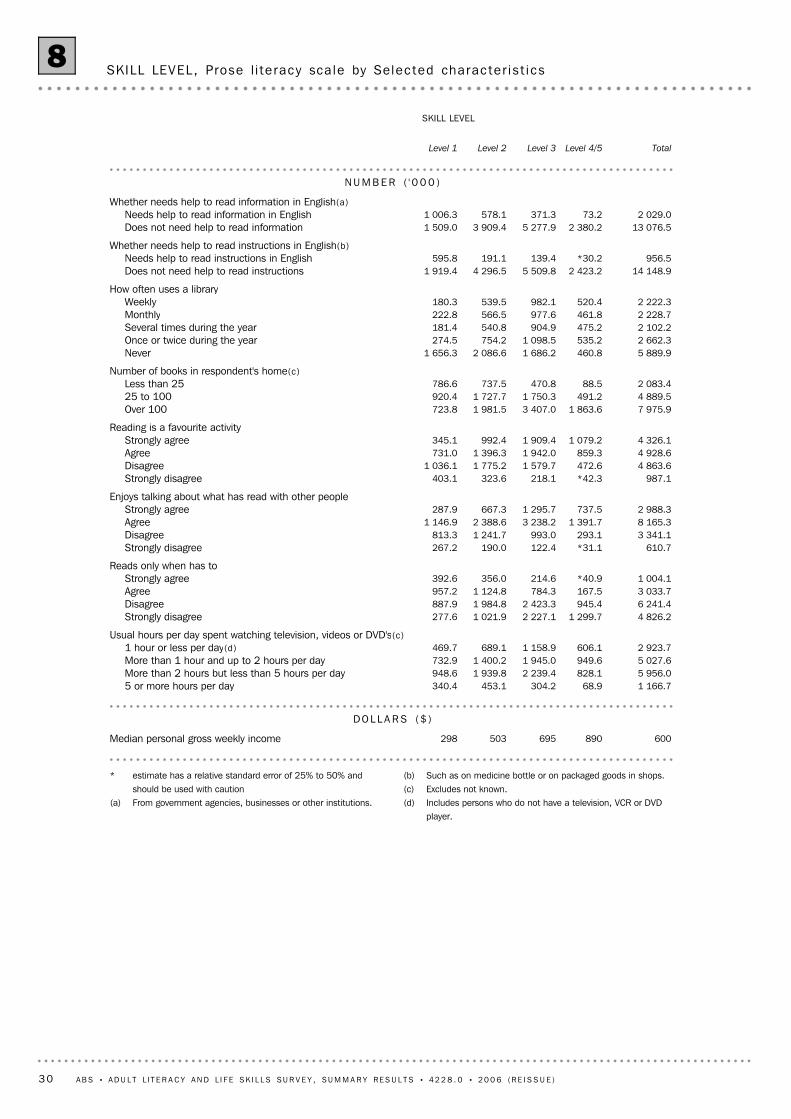
The median personal gross weekly income reported in the survey for Australia was $600.
The median weekly income for those who attained literacy scores at Level 3 on the prose
scale was $695. For those who attained literacy scores at Level 4/5 on the prose scale, the
median weekly income was $890. People who attained scores lower than Level 3 on the
prose scale, had a median weekly income less than $504 (table 8).
For employed people at Level 1 on the prose scale, 32% received a personal gross weekly
income in the highest two personal income quintiles, compared to 59% for those with
scores at Level 4/5. The results on the document scales were similar, with 31% of
employed people with scores at Level 1 and 60% with scores at Level 4/5 receiving a
personal gross weekly income in the highest two quintiles (table 16).
I N C O M E
12 A B S • A D U L T L I T E R A C Y A N D L I F E SK I L L S SU R V E Y , SU M M A R Y R E S U L T S • 4 2 2 8 . 0 • 2 0 0 6 ( R E I S S U E )
S U M M A R Y O F F I N D I N G S continued
The ALLS was conducted in Australia's official language, English. Examining the literacy
skills of people whose first language was not English, 36% of this group achieved scores
at Level 3 or above on the prose scale and 38% on the document scale, compared to 54%
and 53% respectively for the general population (table 19).
Compared to 1996, of the people who migrated to Australia in the five years prior to the
survey whose first language was not English, there was a statistically significant increase
in the proportion of people attaining literacy scores of Level 3 or above on both the
prose and document scales. On the prose scale, the proportion of this group with scores
at Level 3 or above increased from 22% to 38% while on the document scale the
proportion increased from 32% to 50% (table 19).
PE R S O N S WH O S E F I R S T
LA N G U A G E WA S NO T
EN G L I S H
For numeracy skills, 67% of people responding to the survey agreed or strongly agreed
that they received good grades in maths. Of this group, 56% achieved numeracy scores at
Level 3 or above on the numeracy scale. Similarly, 43% of males and 28% of females
strongly agreed with the statement that they are good with numbers and calculations. Of
this group, 40% of females achieved numeracy scores at Level 1 or 2 while 29% of males
achieved scores at Level 1 or 2 (table 21).
Numeracy
A B S • A D U L T L I T E R A C Y A N D L I F E SK I L L S SU R V E Y , SU M M A R Y R E S U L T S • 4 2 2 8 . 0 • 2 0 0 6 ( R E I S S U E ) 13
S U M M A R Y O F F I N D I N G S continued
56Self rating, numeracy scale by skill level by sex21 . . . . . . . . . . . . . . . . . . .55Self rating, prose and document literacy scale by skill level by sex20 . . . . . . .
SE L F - A S S E S S E D L I T E R A C Y
50
Skill level,prose and document literacy scale by selected characteristics
— 1996 and 2006
19. . . . . . . . . . . . . . . . . . . . . . . . . . . . . . . . . . . . .
PE R S O N S WH O S E F I R S T LA N G U A G E WA S NO T EN G L I S H
49
Skill level,numeracy literacy scale by selected numeracy-related work
activities
18. . . . . . . . . . . . . . . . . . . . . . . . . . . . . . . . . . . . . . . . . . .
48
Skill level,document literacy scale by selected literacy-related work
activities
17. . . . . . . . . . . . . . . . . . . . . . . . . . . . . . . . . . . . . . . . . . .
43
Skill level,prose and document literacy scale by selected characteristics
—1996 and 2006
16. . . . . . . . . . . . . . . . . . . . . . . . . . . . . . . . . . . . . .
42Skill level, occupation of main job15 . . . . . . . . . . . . . . . . . . . . . . . . . . .40Skill level, industry of main job14 . . . . . . . . . . . . . . . . . . . . . . . . . . . . .
EM P L O Y E D PE R S O N S
39Skill level, current labour force status13 . . . . . . . . . . . . . . . . . . . . . . . . .37Skill level, current labour force status and sex12 . . . . . . . . . . . . . . . . . . . .
LA B O U R FO R C E ST A T U S
35Skill level, participation in adult learning11 . . . . . . . . . . . . . . . . . . . . . . .32
Skill level, highest non-school qualification, highest year of school and
length of time in education
10. . . . . . . . . . . . . . . . . . . . . . . . . . . . . . .
ED U C A T I O N
31Skill level, document literacy scale by selected characteristics9 . . . . . . . . . .30Skill level, prose literacy scale by selected characteristics8 . . . . . . . . . . . . .
PE R S O N A L CH A R A C T E R I S T I C S
29Prose literacy scale, selected countries and Australia by age7 . . . . . . . . . . .28Skill level, selected countries and Australia by sex6 . . . . . . . . . . . . . . . . .27Skill level, selected countries and Australia5 . . . . . . . . . . . . . . . . . . . . .
I N T E R N A T I O N A L CO M P A R I S O N
25
Skill level, prose and document literacy scale by state or territory of
usual residence —1996 and 2006
4. . . . . . . . . . . . . . . . . . . . . . . . . . .
23Skill level by state or territory of usual residence3 . . . . . . . . . . . . . . . . . .21Skill level, prose and document literacy scales by age — 1996 and 20062 . . . .16Skill level, sex and age1 . . . . . . . . . . . . . . . . . . . . . . . . . . . . . . . . . .
SU M M A R Y TA B L E S
page
14 A B S • A D U L T L I T E R A C Y A N D L I F E SK I L L S SU R V E Y , SU M M A R Y R E S U L T S • 4 2 2 8 . 0 • 2 0 0 6 ( R E I S S U E )
L I S T O F T A B L E S
67Adult Literacy and Life Skills, populations by sex25 . . . . . . . . . . . . . . . . . .PO P U L A T I O N S
60
Skill level,document literacy scale by usage of selected information
communication technology
24. . . . . . . . . . . . . . . . . . . . . . . . . . . . . . .
I N F O R M A T I O N CO M M U N I C A T I O N TE C H N O L O G Y
59Skill level, self-assessed health status23 . . . . . . . . . . . . . . . . . . . . . . . . .SE L F - A S S E S S E D HE A L T H ST A T U S
58
Skill level,prose and document literacy scale by social participation and
wellbeing
22. . . . . . . . . . . . . . . . . . . . . . . . . . . . . . . . . . . . . . . . . .
SO C I A L CA P I T A L
page
A B S • A D U L T L I T E R A C Y A N D L I F E SK I L L S SU R V E Y , SU M M A R Y R E S U L T S • 4 2 2 8 . 0 • 2 0 0 6 ( R E I S S U E ) 15
L I S T O F T A B L E S continued
* estimate has a relative standard error of 25% to 50% and should be used with caution
15 105.416.22 453.437.45 649.229.74 487.616.72 515.3Total
1 413.64.158.323.2327.834.9492.937.8534.765–741 009.99.898.531.4317.533.5338.225.3255.660–641 265.311.7148.236.2458.330.6387.221.5271.655–591 340.218.0241.436.9494.827.7371.617.3232.550–541 482.919.9295.738.4569.825.5378.816.1238.545–491 491.520.4304.638.3571.627.4408.113.9207.340–441 506.921.3321.241.3622.427.4412.310.0151.135–391 438.422.1317.442.6612.324.9357.710.5151.030–341 377.318.4253.339.9549.032.1442.79.6132.225–291 404.820.4286.742.2593.128.0394.09.3131.120–241 374.69.3128.138.7532.636.7504.015.3209.915–19
Persons
7 565.017.31 310.038.42 903.028.52 153.415.81 198.6Total
722.6*3.0*21.923.1167.037.2268.536.7265.365–74503.37.437.430.4152.834.6174.027.6139.060–64636.39.761.535.7227.433.6213.621.0133.755–59677.218.8127.337.3252.728.8194.915.1102.450–54747.920.5153.140.9305.722.6169.016.0120.045–49751.323.3175.438.6290.123.0172.515.1113.340–44760.423.0174.843.3329.425.1190.98.665.435–39723.225.3183.243.5314.823.5170.07.655.230–34682.521.1144.344.0300.128.6195.1*6.3*42.925–29689.323.4161.143.8301.925.3174.1*7.6*52.220–24671.010.470.138.9260.934.4230.716.3109.215–19
Females
7 540.415.21 143.436.42 746.231.02 334.117.51 316.6Total
691.0*5.3*36.423.3160.832.5224.439.0269.465–74506.612.161.232.5164.732.4164.223.0116.660–64629.013.886.836.7230.827.6173.621.9137.955–59663.017.2114.136.5242.126.7176.819.6130.150–54734.919.4142.635.9264.128.5209.816.1118.545–49740.217.4129.238.0281.431.8235.612.794.040–44746.519.6146.439.2292.929.7221.411.585.835–39715.318.8134.341.6297.626.2187.713.495.830–34694.715.7109.035.8248.935.6247.612.889.225–29715.517.6125.640.7291.130.7219.911.078.920–24703.7*8.2*58.038.6271.838.8273.214.3100.615–19
Males
PR O S E L I T E R A C Y SC A L E
'000%'000%'000%'000%'000
Level 4/5Level 3Level 2Level 1 Total
SKILL LEVEL
SKILL LEVEL , Sex and Age1
16 A B S • A D U L T L I T E R A C Y A N D L I F E SK I L L S SU R V E Y , SU M M A R Y R E S U L T S • 4 2 2 8 . 0 • 2 0 0 6 ( R E I S S U E )
* estimate has a relative standard error of 25% to 50% and should be used with caution
15 105.417.72 676.735.55 361.928.84 349.118.02 717.8Total
1 413.63.143.718.2256.734.2482.944.6630.465–741 009.99.192.126.9271.734.6349.729.3296.460–641 265.312.2154.032.0405.132.4409.623.4296.655–591 340.216.4219.735.5476.427.9374.320.1269.950–541 482.922.7336.135.1520.524.7366.817.5259.545–491 491.521.9327.236.6545.626.3392.115.2226.640–441 506.923.1347.738.9586.426.7402.811.3170.135–391 438.424.2347.741.4595.123.9343.610.6152.130–341 377.320.6283.344.2608.325.5351.29.8134.425–291 404.824.7347.238.3538.628.7403.28.2115.820–241 374.613.0178.140.6557.734.4473.012.1165.915–19
Persons
7 565.016.21 222.535.22 665.529.72 249.318.91 427.7Total
722.6*1.6*11.716.1116.135.3255.347.0339.565–74503.3*5.2*26.122.7114.237.6189.134.6173.960–64636.38.050.830.2192.436.0229.225.7163.855–59677.214.598.335.7241.430.4205.819.4131.750–54747.920.6154.436.0269.324.5183.218.9141.045–49751.321.2159.536.4273.124.8186.117.6132.540–44760.421.2161.040.6308.427.5209.310.781.735–39723.223.4169.642.3305.725.2182.69.065.330–34682.519.2130.947.7325.425.7175.67.450.625–29689.324.5168.839.5272.227.9192.3*8.1*56.120–24671.0*13.6*91.436.8247.135.9241.013.691.515–19
Females
7 540.419.31 454.235.82 696.427.82 099.817.11 290.1Total
691.0*4.6*32.020.3140.532.9227.642.1290.965–74506.6*13.0*66.031.1157.531.7160.624.2122.560–64629.016.4103.233.8212.728.7180.421.1132.855–59663.018.3121.435.4234.925.4168.520.8138.250–54734.924.7181.734.2251.125.0183.616.1118.545–49740.222.7167.736.8272.427.8205.912.794.140–44746.525.0186.737.2278.025.9193.411.888.435–39715.324.9178.140.5289.422.5161.012.186.830–34694.721.9152.340.7282.925.3175.712.183.825–29715.524.9178.437.2266.329.5211.08.459.820–24703.712.386.744.1310.633.0232.0*10.6*74.415–19
Males
DO C U M E N T L I T E R A C Y SC A L E
'000%'000%'000%'000%'000
Level 4/5Level 3Level 2Level 1 Total
SKILL LEVEL
SKILL LEVEL , Sex and Age co n t i n u e d1
A B S • A D U L T L I T E R A C Y A N D L I F E SK I L L S SU R V E Y , SU M M A R Y R E S U L T S • 4 2 2 8 . 0 • 2 0 0 6 ( R E I S S U E ) 17
** estimate has a relative standard error greater than 50%and is considered too unreliable for general use
* estimate has a relative standard error of 25% to 50% andshould be used with caution
15 105.416.12 437.831.34 732.130.54 614.622.03 321.0Total
1 413.64.563.916.5233.132.5459.446.5657.365–741 009.99.191.825.3255.133.6339.432.0323.660–641 265.312.4156.428.6362.031.7400.627.4346.455–591 340.214.9200.230.3405.931.0415.123.8319.050–541 482.919.2284.830.5452.028.8426.421.6319.645–491 491.519.3287.333.8503.727.8414.619.2285.940–441 506.922.3336.436.0543.128.2425.213.4202.235–391 438.421.9314.536.8529.526.7384.514.6210.030–341 377.320.6284.436.2499.130.2416.512.9177.225–291 404.819.3271.135.6500.130.2424.714.9208.920–241 374.610.7147.232.6448.437.0508.219.7270.815–19
Persons
7 565.012.2921.730.32 289.132.42 448.525.21 905.7Total
722.6**1.8**13.313.396.134.7250.850.1362.465–74503.3*3.6*18.220.8104.535.6179.040.0201.560–64636.3*5.9*37.224.3154.436.4231.633.5213.055–59677.210.067.830.2204.334.5233.925.3171.350–54747.914.1105.430.4227.130.9230.824.7184.545–49751.315.9119.532.5243.829.4221.122.2166.840–44760.417.7134.837.5284.829.8226.815.0114.035–39723.219.0137.337.2269.028.2203.815.6113.030–34682.517.6120.138.9265.430.8210.512.786.525–29689.315.5106.736.1248.931.2215.317.2118.420–24671.0*9.1*61.228.4190.736.5244.826.0174.415–19
Females
7 540.420.11 516.132.42 443.028.72 166.118.81 415.2Total
691.07.350.519.8137.030.2208.542.7294.965–74506.614.573.529.7150.531.7160.424.1122.160–64629.018.9119.133.0207.626.9168.921.2133.455–59663.020.0132.430.4201.627.3181.222.3147.850–54734.924.4179.430.6224.926.6195.618.4135.045–49740.222.7167.835.1259.926.1193.516.1119.040–44746.527.0201.634.6258.326.6198.411.888.335–39715.324.8177.136.4260.525.3180.613.697.030–34694.723.6164.333.6233.829.6206.013.190.725–29715.523.0164.435.1251.229.3209.4*12.7*90.520–24703.7*12.2*86.036.6257.737.4263.513.796.515–19
Males
NU M E R A C Y SC A L E
'000%'000%'000%'000%'000
Level 4/5Level 3Level 2Level 1 Total
SKILL LEVEL
SKILL LEVEL , Sex and Age co n t i n u e d1
18 A B S • A D U L T L I T E R A C Y A N D L I F E SK I L L S SU R V E Y , SU M M A R Y R E S U L T S • 4 2 2 8 . 0 • 2 0 0 6 ( R E I S S U E )
** estimate has a relative standard error greater than 50%and is considered too unreliable for general use
* estimate has a relative standard error of 25% to 50% andshould be used with caution
15 105.45.4811.524.53 702.635.25 313.834.95 277.5Total
1 413.6**0.5**7.48.6121.627.7392.063.1892.765–741 009.9**1.7**17.016.8169.432.6328.849.0494.760–641 265.3*2.9*36.520.2255.634.2433.042.7540.255–591 340.2*4.2*55.924.2324.135.2471.636.5488.650–541 482.96.8100.127.5407.833.4495.832.3479.145–491 491.57.2107.226.8399.535.0522.031.0462.940–441 506.98.1122.627.3411.838.8584.025.8388.535–391 438.47.4107.032.9472.635.0504.124.7354.730–341 377.37.8107.930.8423.537.4515.524.0330.325–291 404.87.5105.129.1408.736.1506.927.3384.220–241 374.6*3.3*44.822.4308.140.7560.133.6461.615–19
Persons
7 565.05.2396.224.31 838.035.62 691.834.92 639.1Total
722.6**0.4**3.16.345.629.5213.063.8460.965–74503.3**1.0**4.813.266.331.6159.154.3273.060–64636.3*2.5*15.717.2109.734.2217.646.1293.355–59677.2*3.5*24.022.1149.738.3259.636.0244.050–54747.9*6.1*45.728.1210.533.2248.432.5243.345–49751.37.455.428.5214.433.7253.030.4228.440–44760.47.456.527.5209.041.7317.123.4177.935–39723.27.453.434.8251.835.8259.222.0158.830–34682.58.255.832.7222.939.0265.920.2137.925–29689.3*8.0*55.130.8212.335.8247.025.4175.020–24671.0**4.0**26.821.7145.837.5251.836.7246.515–19
Females
7 540.45.5415.324.71 864.734.82 622.135.02 638.4Total
691.0**0.6**4.311.076.025.9178.962.5431.865–74506.6**2.4**12.220.3103.133.5169.743.8221.760–64629.0*3.3*20.823.2145.934.2215.439.2246.955–59663.0*4.8*31.926.3174.432.0212.136.9244.650–54734.9*7.4*54.426.8197.333.7247.432.1235.845–49740.27.051.825.0185.036.3269.031.7234.440–44746.58.966.227.2202.835.7266.828.2210.735–39715.3*7.5*53.630.9220.834.2244.927.4195.930–34694.7*7.5*52.128.9200.735.9249.627.7192.325–29715.5*7.0*50.027.5196.436.3259.929.2209.220–24703.7*2.6*18.023.1162.343.8308.330.6215.115–19
Males
PR O B L E M SO L V I N G SC A L E
'000%'000%'000%'000%'000
Level 4/5Level 3Level 2Level 1 Total
SKILL LEVEL
SKILL LEVEL , Sex and Age co n t i n u e d1
A B S • A D U L T L I T E R A C Y A N D L I F E SK I L L S SU R V E Y , SU M M A R Y R E S U L T S • 4 2 2 8 . 0 • 2 0 0 6 ( R E I S S U E ) 19
** estimate has a relative standard error greater than 50%and is considered too unreliable for general use
* estimate has a relative standard error of 25% to 50% andshould be used with caution
15 105.45.8876.134.75 249.040.16 057.219.42 923.1Total
1 413.6*1.0*13.516.4232.242.4599.140.2568.865–741 009.9*2.3*22.926.4266.942.9433.028.4287.160–641 265.3*4.1*51.429.8377.439.3497.326.8339.255–591 340.26.182.234.5462.139.0522.220.4273.750–541 482.98.3122.638.6572.235.8530.317.4257.945–491 491.56.9103.239.5589.236.8548.416.8250.640–441 506.97.9119.641.7629.138.5580.111.8178.235–391 438.48.0114.942.0604.638.0546.512.0172.630–341 377.3*6.9*95.638.8534.242.3581.912.0165.525–291 404.88.4118.440.5568.939.4553.911.6163.620–241 374.6*2.3*32.130.0412.248.3664.519.3265.815–19
Persons
7 565.05.7431.035.52 683.639.83 013.519.01 436.9Total
722.6**0.8**6.114.9107.943.8316.840.4291.865–74503.3**1.4**7.023.0115.844.4223.331.2157.160–64636.3*2.9*18.427.9177.542.3269.126.9171.255–59677.2*6.1*41.133.4226.142.2285.518.4124.550–54747.98.966.839.7297.133.1247.618.2136.345–49751.3*6.0*45.441.5311.934.6259.617.9134.540–44760.47.658.143.6331.538.7294.210.176.635–39723.2*7.8*56.344.2319.838.6278.89.468.230–34682.57.551.542.7291.640.0273.29.766.325–29689.38.659.043.9302.737.4257.8*10.1*69.920–24671.0**3.2**21.330.1201.745.8307.5*20.9*140.415–19
Females
7 540.45.9445.134.02 565.440.43 043.719.71 486.2Total
691.0*1.1*7.318.0124.340.9282.340.1277.065–74506.6**3.1**15.829.8151.141.4209.725.7130.060–64629.0*5.2*33.031.8199.936.3228.126.7168.055–59663.0*6.2*41.135.6236.035.7236.722.5149.250–54734.9*7.6*55.737.4275.038.5282.616.5121.545–49740.27.857.837.5277.439.0288.815.7116.240–44746.58.261.539.9297.638.3285.913.6101.635–39715.3*8.2*58.539.8284.837.4267.614.6104.330–34694.7**6.4**44.234.9242.644.4308.7*14.3*99.325–29715.5*8.3*59.437.2266.241.4296.113.193.720–24703.7**1.5**10.829.9210.550.7357.017.8125.415–19
Males
HE A L T H L I T E R A C Y SC A L E
'000%'000%'000%'000%'000
Level 4/5Level 3Level 2Level 1 Total
SKILL LEVEL
SKILL LEVEL , Sex and Age co n t i n u e d1
20 A B S • A D U L T L I T E R A C Y A N D L I F E SK I L L S SU R V E Y , SU M M A R Y R E S U L T S • 4 2 2 8 . 0 • 2 0 0 6 ( R E I S S U E )
(a) Difference between 1996 and 2006 is statistically significant.
35.5(a)5 361.935.5(a)4 694.3(a)37.4(a)5 649.2(a)35.0(a)4 621.4Total
16.5102.815.288.621.7(a)135.215.1(a)87.970–7419.5153.921.8147.124.3192.522.6152.165–6926.9(a)271.722.4(a)154.8(a)31.4(a)317.5(a)23.8(a)164.260–6432.0(a)405.127.5(a)226.5(a)36.2(a)458.3(a)27.2(a)224.055–5935.5(a)476.432.1(a)324.936.9(a)494.831.2(a)315.550–5435.1520.535.4454.038.4(a)569.834.7(a)445.345–4936.6545.639.7527.638.3571.639.8528.540–4438.9586.439.3562.341.3622.438.6552.535–3941.4595.140.9579.242.6612.339.5559.430–3444.2608.339.0545.139.9549.038.0532.225–2938.3538.642.4579.642.2593.140.9559.020–2440.6557.741.5504.638.7532.641.2500.715–19
Age group (years)
LE V E L 3
28.8(a)4 349.128.3(a)3 747.7(a)29.7(a)4 487.6(a)27.7(a)3 665.9Total
32.4202.029.9174.231.6197.030.7178.370–7435.5280.932.4218.237.4(a)295.832.1(a)216.165–6934.6(a)349.733.8(a)233.033.5(a)338.233.5(a)230.960–6432.4(a)409.632.8(a)269.930.6(a)387.232.9(a)271.555–5927.9374.330.6309.527.7(a)371.628.4(a)287.050–5424.7366.827.6353.525.5378.827.1347.045–4926.3392.123.2307.9(a)27.4(a)408.1(a)21.6(a)287.040–4426.7402.827.4391.827.4412.325.7367.535–3923.9343.625.0354.624.9357.725.5361.830–3425.5351.227.7388.032.1442.727.0377.825–2928.7403.226.5362.328.0394.027.3373.920–2434.4473.031.7384.836.7(a)504.030.2(a)367.015–19
Age group (years)
LE V E L 2
(a)18.02 717.8(a)19.62 594.9(a)16.72 515.3(a)19.72 610.0Total
49.0305.053.1309.1(a)43.6271.5(a)52.5305.470–7441.1325.540.6273.5(a)33.3263.1(a)40.4272.265–69
(a)29.3296.4(a)37.1256.1(a)25.3255.6(a)34.4237.360–64(a)23.4296.6(a)31.4259.0(a)21.5271.6(a)30.5251.655–59
20.1269.923.5237.1(a)17.3232.5(a)23.8240.250–5417.5259.519.4248.916.1238.519.1244.445–4915.2226.615.1201.013.9207.315.0199.440–4411.3170.112.9184.810.0151.113.7195.535–3910.6152.113.1186.210.5151.013.1186.330–34
9.8134.411.0153.39.6132.211.7163.025–298.2115.89.5130.69.3131.110.1137.920–24
12.1165.912.8155.315.3209.914.5176.815–19Age group (years)
LE V E L 1
%'000%'000%'000%'000
2006199620061996
DOCUMENT LITERACY SCALEPROSE LITERACY SCALE
SKILL LEVEL , Prose and Document l i te racy sca le by Age—1996 and 20062
A B S • A D U L T L I T E R A C Y A N D L I F E SK I L L S SU R V E Y , SU M M A R Y R E S U L T S • 4 2 2 8 . 0 • 2 0 0 6 ( R E I S S U E ) 21
** estimate has a relative standard error greater than 50% and isconsidered too unreliable for general use
(a) Difference between 1996 and 2006 is statistically significant.
* estimate has a relative standard error of 25% to 50% and shouldbe used with caution
100.015 105.4100.013 220.8100.015 105.4100.013 220.8Total
100.0622.6100.0581.7100.0622.6100.0581.770–74100.0791.0100.0673.5100.0791.0100.0673.565–69100.01 009.9100.0689.6100.01 009.9100.0689.660–64100.01 265.3100.0824.1100.01 265.3100.0824.155–59100.01 340.2100.01 010.8100.01 340.2100.01 010.850–54100.01 482.9100.01 282.7100.01 482.9100.01 282.745–49100.01 491.5100.01 327.4100.01 491.5100.01 327.440–44100.01 506.9100.01 431.6100.01 506.9100.01 431.635–39100.01 438.4100.01 416.8100.01 438.4100.01 416.830–34100.01 377.3100.01 398.9100.01 377.3100.01 398.925–29100.01 404.8100.01 368.0100.01 404.8100.01 368.020–24100.01 374.6100.01 215.6100.01 374.6100.01 215.615–19
Age group (years)
TO T A L
17.7(a)2 676.716.5(a)2 183.816.22 453.417.62 323.5Total
*2.1*12.9*1.7*9.8*3.0*18.8**1.7**10.170–74*3.9*30.8*5.1*34.7*5.0*39.5*4.9*33.065–699.192.1*6.6*45.69.8(a)98.58.3(a)57.160–64
12.2(a)154.08.3(a)68.611.7(a)148.29.3(a)77.055–5916.4(a)219.713.8(a)139.318.0241.416.6168.250–5422.7(a)336.117.7(a)226.419.9295.719.2246.045–4921.9327.221.9290.920.4304.623.5312.540–4423.1347.720.4292.721.3321.222.1316.035–3924.2347.721.0296.922.1317.421.8309.330–3420.6283.322.3312.518.4253.323.3325.825–2924.7347.221.6295.420.4286.721.7297.220–2413.0178.114.1171.09.3128.114.1171.215–19
Age group (years)
LE V E L 4 / 5
%'000%'000%'000%'000
2006199620061996
DOCUMENT LITERACY SCALEPROSE LITERACY SCALE
SKILL LEVEL , Prose and Document l i te racy sca le by Age—1996 and 2006 co n t i n u e d2
22 A B S • A D U L T L I T E R A C Y A N D L I F E SK I L L S SU R V E Y , SU M M A R Y R E S U L T S • 4 2 2 8 . 0 • 2 0 0 6 ( R E I S S U E )
* estimate has a relative standard error of 25% to 50% and should be used with caution
15 105.45.4811.524.53 702.635.25 313.834.95 277.5Australia
247.610.225.335.387.432.380.022.255.0Australian Capital Territory115.3*4.0*4.624.027.737.242.934.840.1Northern Territory356.1*5.3*18.921.777.135.5126.337.6133.7Tasmania
1 492.14.973.426.0388.237.0552.332.0478.1Western Australia1 133.25.966.824.5277.736.0407.933.6380.8South Australia2 957.14.8141.824.4722.736.41 077.634.31 015.1Queensland3 781.45.3199.124.1909.633.31 260.237.41 412.4Victoria5 022.75.6281.624.11 212.235.21 766.635.11 762.3New South Wales
State or Territory
PR O B L E M SO L V I N G SC A L E
15 105.416.12 437.831.34 732.130.54 614.622.03 321.0Australia
247.625.162.237.893.622.856.514.335.3Australian Capital Territory115.313.215.231.736.532.036.923.226.7Northern Territory356.113.146.530.8109.630.0106.826.293.2Tasmania
1 492.116.2241.132.6486.231.6471.319.7293.4Western Australia1 133.216.9192.031.9361.629.9338.521.3241.1South Australia2 957.115.0444.532.8971.332.6963.519.5577.8Queensland3 781.415.3579.930.31 146.430.91 166.823.5888.3Victoria5 022.717.1856.430.41 526.929.41 474.323.21 165.0New South Wales
State or Territory
NU M E R A C Y SC A L E
15 105.417.72 676.735.55 361.928.84 349.118.02 717.8Australia
247.625.864.042.2104.620.450.511.528.6Australian Capital Territory115.315.017.338.644.527.731.918.821.6Northern Territory356.115.254.234.1121.329.3104.321.476.3Tasmania
1 492.118.9282.536.9550.929.0432.815.1225.9Western Australia1 133.218.9214.535.2398.628.4322.217.5197.9South Australia2 957.116.8497.836.61 081.330.4898.116.2479.9Queensland3 781.416.6626.734.31 295.729.71 122.419.5736.6Victoria5 022.718.3919.735.11 765.127.61 386.818.9951.0New South Wales
State or Territory
DO C U M E N T L I T E R A C Y SC A L E
15 105.416.22 453.437.45 649.229.74 487.616.72 515.3Australia
247.626.264.941.8103.421.051.911.027.3Australian Capital Territory115.313.715.839.445.529.434.017.420.0Northern Territory356.114.451.336.6130.429.0103.220.071.2Tasmania
1 492.116.4244.340.0597.329.9445.713.7204.8Western Australia1 133.217.3195.837.6425.629.2331.415.9180.4South Australia2 957.115.4456.838.11 126.931.7937.314.7436.1Queensland3 781.415.5586.835.71 351.531.01 171.517.8671.5Victoria5 022.716.7837.737.21 868.728.11 412.418.0903.9New South Wales
State or Territory
PR O S E L I T E R A C Y SC A L E
'000%'000%'000%'000%'000
Level 4/5Level 3Level 2Level 1 Total
SKILL LEVEL
SKILL LEVEL , By State or Ter r i to ry of usua l res idence3
A B S • A D U L T L I T E R A C Y A N D L I F E SK I L L S SU R V E Y , SU M M A R Y R E S U L T S • 4 2 2 8 . 0 • 2 0 0 6 ( R E I S S U E ) 23
* estimate has a relative standard error of 25% to 50% and should be used with caution
15 105.45.8876.134.75 249.040.16 057.219.42 923.1Australia
247.611.027.245.0111.431.377.512.731.6Australian Capital Territory115.3*4.1*4.833.238.343.550.219.222.1Northern Territory356.1*4.2*14.832.4115.542.7152.120.773.7Tasmania
1 492.15.379.738.0567.040.9610.915.7234.6Western Australia1 133.2*5.9*66.435.5402.240.2455.518.5209.1South Australia2 957.15.5161.833.4988.442.91 269.218.2537.7Queensland3 781.45.6213.433.21 257.340.51 531.220.6779.5Victoria5 022.76.1308.035.21 769.038.01 910.820.61 034.8New South Wales
State or Territory
HE A L T H L I T E R A C Y SC A L E
'000%'000%'000%'000%'000
Level 4/5Level 3Level 2Level 1 Total
SKILL LEVEL
SKILL LEVEL , By State or Ter r i to ry of usua l res idence co n t i n u e d3
24 A B S • A D U L T L I T E R A C Y A N D L I F E SK I L L S SU R V E Y , SU M M A R Y R E S U L T S • 4 2 2 8 . 0 • 2 0 0 6 ( R E I S S U E )
(a) Difference between 1996 and 2006 is statistically significant.* estimate has a relative standard error of 25% to 50% and should be usedwith caution
17.7(a)2 676.716.5(a)2 183.816.22 453.417.62 323.5Australia
25.864.029.265.726.264.929.265.7Australian Capital Territory15.017.3*20.6*21.113.715.8*19.0*19.5Northern Territory15.254.212.743.114.451.313.345.1Tasmania18.9(a)282.516.8(a)213.216.4244.318.6235.9Western Australia18.9214.518.7199.917.3195.820.5219.1South Australia16.8497.818.5441.315.4456.818.9452.0Queensland16.6626.716.2538.615.5586.817.3577.3Victoria18.3(a)919.714.7(a)660.916.7837.715.8708.8New South Wales
State or Territory
LE V E L 4 / 5
35.5(a)5 361.935.5(a)4 694.3(a)37.4(a)5 649.2(a)35.0(a)4 621.4Australia
42.2104.639.188.141.8103.438.486.5Australian Capital Territory38.644.537.638.639.445.542.543.6Northern Territory34.1121.334.5117.636.6130.437.5127.7Tasmania36.9(a)550.936.8(a)467.240.0(a)597.336.3(a)461.7Western Australia35.2398.635.7382.137.6425.635.1376.0South Australia36.6(a)1 081.335.8(a)852.838.1(a)1 126.935.9(a)857.4Queensland34.31 295.735.31 176.635.7(a)1 351.534.6(a)1 153.1Victoria35.11 765.134.91 571.337.2(a)1 868.733.7(a)1 515.4New South Wales
State or Territory
LE V E L 3
28.8(a)4 349.128.3(a)3 747.7(a)29.7(a)4 487.6(a)27.7(a)3 665.9Australia
20.450.520.245.621.051.920.445.9Australian Capital Territory27.731.928.529.229.434.026.226.9Northern Territory29.3104.332.5110.529.0103.230.4103.4Tasmania29.0432.829.8378.329.9(a)445.728.5(a)361.4Western Australia28.4322.227.2291.229.2331.426.4283.1South Australia30.4(a)898.130.2(a)720.031.7(a)937.329.0(a)691.7Queensland29.7(a)1 122.426.9(a)895.8(a)31.0(a)1 171.5(a)26.7(a)887.2Victoria27.61 386.828.41 277.128.11 412.428.21 266.3New South Wales
State or Territory
LE V E L 2
(a)18.02 717.8(a)19.62 594.9(a)16.72 515.3(a)19.72 610.0Australia
11.528.611.425.811.027.312.027.0Australian Capital Territory18.821.613.413.717.420.0*12.3*12.6Northern Territory21.476.320.469.320.071.218.964.3Tasmania15.1225.916.7211.513.7204.816.6211.2Western Australia17.5197.918.5197.715.9180.418.0192.7South Australia16.2(a)479.915.6(a)371.314.7436.116.1384.3Queensland19.5736.621.6717.917.8671.521.4711.4Victoria18.9951.022.0987.8(a)18.0903.9(a)22.41 006.5New South Wales
State or Territory
LE V E L 1
%'000%'000%'000%'000
2006199620061996
DOCUMENT LITERACY SCALEPROSE LITERACY SCALE
SKILL LEVEL , Prose and Document l i te racy sca le by State or Ter r i to ry of usua l
res idence —1996 and 20064
A B S • A D U L T L I T E R A C Y A N D L I F E SK I L L S SU R V E Y , SU M M A R Y R E S U L T S • 4 2 2 8 . 0 • 2 0 0 6 ( R E I S S U E ) 25
100.015 105.4100.013 220.8100.015 105.4100.013 220.8Australia
100.0247.6100.0225.0100.0247.6100.0225.0Australian Capital Territory100.0115.3100.0102.6100.0115.3100.0102.6Northern Territory100.0356.1100.0340.5100.0356.1100.0340.5Tasmania100.01 492.1100.01 270.3100.01 492.1100.01 270.3Western Australia100.01 133.2100.01 070.9100.01 133.2100.01 070.9South Australia100.02 957.1100.02 385.4100.02 957.1100.02 385.4Queensland100.03 781.4100.03 329.0100.03 781.4100.03 329.0Victoria100.05 022.7100.04 497.1100.05 022.7100.04 497.1New South Wales
State or Territory
TO T A L
%'000%'000%'000%'000
2006199620061996
DOCUMENT LITERACY SCALEPROSE LITERACY SCALE
SKILL LEVEL , Prose and Document l i te racy sca le by State or Ter r i to ry of usua l
res idence —1996 and 2006 co n t i n u e d4
26 A B S • A D U L T L I T E R A C Y A N D L I F E SK I L L S SU R V E Y , SU M M A R Y R E S U L T S • 4 2 2 8 . 0 • 2 0 0 6 ( R E I S S U E )
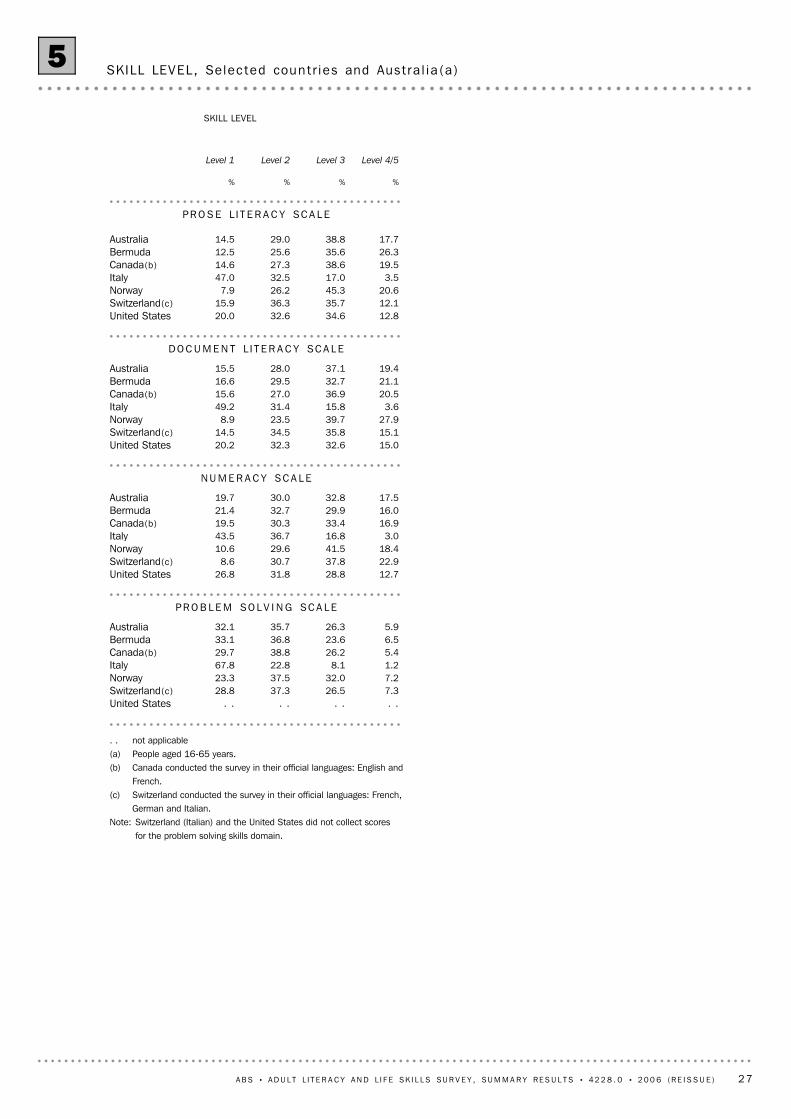
. . not applicable(a) People aged 16-65 years.(b) Canada conducted the survey in their official languages: English and
French.(c) Switzerland conducted the survey in their official languages: French,
German and Italian.Note: Switzerland (Italian) and the United States did not collect scores
for the problem solving skills domain.
. .. .. .. .United States7.326.537.328.8Switzerland(c)7.232.037.523.3Norway1.28.122.867.8Italy5.426.238.829.7Canada(b)6.523.636.833.1Bermuda5.926.335.732.1Australia
PR O B L E M SO L V I N G SC A L E
12.728.831.826.8United States22.937.830.78.6Switzerland(c)18.441.529.610.6Norway
3.016.836.743.5Italy16.933.430.319.5Canada(b)16.029.932.721.4Bermuda17.532.830.019.7Australia
NU M E R A C Y SC A L E
15.032.632.320.2United States15.135.834.514.5Switzerland(c)27.939.723.58.9Norway
3.615.831.449.2Italy20.536.927.015.6Canada(b)21.132.729.516.6Bermuda19.437.128.015.5Australia
DO C U M E N T L I T E R A C Y SC A L E
12.834.632.620.0United States12.135.736.315.9Switzerland(c)20.645.326.27.9Norway
3.517.032.547.0Italy19.538.627.314.6Canada(b)26.335.625.612.5Bermuda17.738.829.014.5Australia
PR O S E L I T E R A C Y SC A L E
%%%%
Level 4/5Level 3Level 2Level 1
SKILL LEVEL
SKILL LEVEL, Selec ted count r ies and Aust ra l ia (a )5
A B S • A D U L T L I T E R A C Y A N D L I F E SK I L L S SU R V E Y , SU M M A R Y R E S U L T S • 4 2 2 8 . 0 • 2 0 0 6 ( R E I S S U E ) 27

* estimate has a relative standard error of 25% to 50% and should be used with caution. . not applicable(a) People aged 16-65 years.(b) Canada conducted the survey in their official languages: English and French.(c) Switzerland conducted the survey in their official languages: French, German and Italian.Note: Switzerland (Italian) and the United States did not collect scores for the problem solving skills domain.
. .. .. .. .. .. .. .. .United States7.27.526.326.836.937.629.628.1Switzerland(c)7.56.932.131.937.637.322.823.8Norway
*1.0*1.57.78.521.724.069.666.0Italy5.35.426.725.738.638.929.429.9Canada(b)7.65.524.822.436.936.630.735.6Bermuda5.86.126.326.236.135.331.832.4Australia
PR O B L E M SO L V I N G SC A L E
8.716.826.930.734.329.230.223.3United States16.329.538.337.436.025.49.47.7Switzerland(c)14.022.638.544.434.325.013.28.0Norway
2.03.913.620.036.636.947.839.1Italy12.721.131.834.933.127.522.416.5Canada(b)12.419.829.430.433.631.724.618.1Bermuda13.421.731.933.631.928.222.716.6Australia
NU M E R A C Y SC A L E
13.017.032.932.333.730.720.320.0United States10.819.635.436.337.531.616.412.6Switzerland(c)25.230.639.539.925.921.29.48.4Norway
2.94.213.817.831.231.652.146.3Italy19.221.836.437.428.525.515.915.3Canada(b)20.322.034.131.229.829.215.717.6Bermuda17.821.137.237.128.927.116.214.8Australia
DO C U M E N T L I T E R A C Y SC A L E
13.512.035.533.632.133.118.821.2United States11.113.035.635.937.235.416.115.6Switzerland(c)23.617.644.146.525.427.16.88.9Norway
3.43.616.817.232.732.247.147.0Italy21.717.238.638.726.228.413.615.7Canada(b)27.724.837.233.924.426.810.714.5Bermuda19.016.539.837.827.430.513.715.3Australia
PR O S E L I T E R A C Y SC A L E
%%%%%%%%
FemalesMalesFemalesMalesFemalesMalesFemalesMales
Level 4/5Level 3Level 2Level 1
SKILL LEVEL
SKILL LEVEL , Selec ted count r ies and Aust ra l i a , by Sex(a )6
28 A B S • A D U L T L I T E R A C Y A N D L I F E SK I L L S SU R V E Y , SU M M A R Y R E S U L T S • 4 2 2 8 . 0 • 2 0 0 6 ( R E I S S U E )
* estimate has a relative standard error of 25% to 50% and shouldbe used with caution
(a) People aged 16-65 years
10.931.833.723.6United States4.727.044.224.1Switzerland8.435.140.116.4Norway
*1.18.124.866.1Italy11.132.030.726.2Canada13.431.330.025.4Bermuda10.933.532.323.3Australia
55 – 6 5 YE A R S
13.337.229.819.8United States9.533.438.518.6Switzerland
14.445.231.58.8Norway*2.615.632.649.1Italy17.639.127.615.7Canada24.434.026.415.2Bermuda19.037.726.616.7Australia
45 – 5 4 YE A R S
14.034.231.420.5United States13.340.033.413.3Switzerland24.449.020.66.0Norway*3.817.634.244.4Italy21.138.426.813.7Canada30.135.323.810.8Bermuda20.939.827.412.0Australia
35 – 4 4 YE A R S
14.435.031.119.5United States17.537.033.511.9Switzerland28.047.620.3*4.2Norway
5.321.534.438.8Italy25.142.023.69.3Canada31.939.022.76.4Bermuda20.341.228.410.1Australia
25 – 3 4 YE A R S
10.734.138.017.2United States15.340.832.511.5Switzerland27.049.019.5*4.4Norway
5.022.736.835.6Italy21.040.728.59.8Canada25.637.028.4*9.0Bermuda16.441.230.911.5Australia
16 – 2 4 YE A R S
%%%%
Level 4/5Level 3Level 2Level 1
PROSE LITERACY SCALE
SKILL LEVEL, Prose l i te racy sca le , Selec ted count r ies and Aust ra l ia by Age(a)7
A B S • A D U L T L I T E R A C Y A N D L I F E SK I L L S SU R V E Y , SU M M A R Y R E S U L T S • 4 2 2 8 . 0 • 2 0 0 6 ( R E I S S U E ) 29
(b) Such as on medicine bottle or on packaged goods in shops.(c) Excludes not known.(d) Includes persons who do not have a television, VCR or DVD
player.
* estimate has a relative standard error of 25% to 50% andshould be used with caution
(a) From government agencies, businesses or other institutions.
600890695503298Median personal gross weekly income
DO L L A R S ($ )
1 166.768.9304.2453.1340.45 or more hours per day5 956.0828.12 239.41 939.8948.6More than 2 hours but less than 5 hours per day5 027.6949.61 945.01 400.2732.9More than 1 hour and up to 2 hours per day2 923.7606.11 158.9689.1469.71 hour or less per day(d)
Usual hours per day spent watching television, videos or DVD's(c)
4 826.21 299.72 227.11 021.9277.6Strongly disagree6 241.4945.42 423.31 984.8887.9Disagree3 033.7167.5784.31 124.8957.2Agree1 004.1*40.9214.6356.0392.6Strongly agree
Reads only when has to
610.7*31.1122.4190.0267.2Strongly disagree3 341.1293.1993.01 241.7813.3Disagree8 165.31 391.73 238.22 388.61 146.9Agree2 988.3737.51 295.7667.3287.9Strongly agree
Enjoys talking about what has read with other people
987.1*42.3218.1323.6403.1Strongly disagree4 863.6472.61 579.71 775.21 036.1Disagree4 928.6859.31 942.01 396.3731.0Agree4 326.11 079.21 909.4992.4345.1Strongly agree
Reading is a favourite activity
7 975.91 863.63 407.01 981.5723.8Over 1004 889.5491.21 750.31 727.7920.425 to 1002 083.488.5470.8737.5786.6Less than 25
Number of books in respondent's home(c)
5 889.9460.81 686.22 086.61 656.3Never2 662.3535.21 098.5754.2274.5Once or twice during the year2 102.2475.2904.9540.8181.4Several times during the year2 228.7461.8977.6566.5222.8Monthly2 222.3520.4982.1539.5180.3Weekly
How often uses a library
14 148.92 423.25 509.84 296.51 919.4Does not need help to read instructions956.5*30.2139.4191.1595.8Needs help to read instructions in English
Whether needs help to read instructions in English(b)
13 076.52 380.25 277.93 909.41 509.0Does not need help to read information2 029.073.2371.3578.11 006.3Needs help to read information in English
Whether needs help to read information in English(a)
NU M B E R ( ' 0 0 0 )
Level 4/5Level 3Level 2Level 1 Total
SKILL LEVEL
SKILL LEVEL , Prose l i te racy sca le by Selec ted charac te r i s t i cs8
30 A B S • A D U L T L I T E R A C Y A N D L I F E SK I L L S SU R V E Y , SU M M A R Y R E S U L T S • 4 2 2 8 . 0 • 2 0 0 6 ( R E I S S U E )

* estimate has a relative standard error of 25% to 50% and should be used with caution
15 105.42 676.75 361.94 349.12 717.8Total
764.6*33.1167.1199.0365.5Does not read newspaper
9 597.61 986.43 501.62 644.71 464.9Generally doesn't read section4 743.2657.21 693.21 505.4887.4Generally reads section
Whether reads horoscopes
6 769.1970.92 192.72 147.11 458.3Generally doesn't read section7 571.61 672.63 002.12 003.0894.0Generally reads section
Whether reads book, movie or art reviews
9 843.21 593.63 428.02 984.61 837.0Generally doesn't read section4 497.61 050.01 766.81 165.5515.3Generally reads section
Whether reads financial news or stock reports
7 996.21 352.32 799.92 376.91 467.0Generally doesn't read section6 344.61 291.22 394.91 773.2885.3Generally reads section
Whether reads the editorial page
6 409.61 107.12 270.01 886.81 145.8Generally doesn't read section7 931.21 536.52 924.82 263.31 206.6Generally reads section
Whether reads the home, fashion, food or health section
7 039.91 266.82 595.81 998.11 179.3Generally doesn't read section7 300.91 376.82 599.02 152.01 173.0Generally reads section
Whether reads the sports section
1 931.7287.7658.3602.6383.0Generally doesn't read section12 409.12 355.84 536.53 547.51 969.3Generally reads section
Whether reads regional or local news
3 167.3285.21 004.31 147.8730.0Generally doesn't read section11 173.52 358.44 190.53 002.31 622.3Generally reads section
Whether reads national or international news
'000'000'000'000'000
Level 4/5Level 3Level 2Level 1 Total
DOCUMENT LITERACY SCALE
SKILL LEVEL , Document l i te racy sca le by Selec ted charac te r i s t i cs9
A B S • A D U L T L I T E R A C Y A N D L I F E SK I L L S SU R V E Y , SU M M A R Y R E S U L T S • 4 2 2 8 . 0 • 2 0 0 6 ( R E I S S U E ) 31
(a) Includes persons whose level of study could not be determined.(b) Includes persons whose main field of study could not be determined.(c) Includes persons who never attended school.
* estimate has a relative standard error of 25% to 50% and should be usedwith caution
** estimate has a relative standard error greater than 50% and is consideredtoo unreliable for general use
8 291.123.31 930.240.43 352.926.32 184.39.9823.8Total(a)217.8*6.8*14.834.274.438.884.520.2*44.0Certificate not further defined
1 109.710.9120.937.0410.634.0377.118.1201.1Certificate I / II2 442.512.5304.137.9926.635.3862.414.3349.4Certificate III / IV1 332.120.2268.546.0612.626.0345.87.9105.2Advanced Diploma / Diploma2 102.238.4808.041.5872.616.2339.53.982.1Bachelor Degree
409.839.3160.943.8179.414.659.6**2.4**9.9Graduate Diploma / Graduate Certificate509.944.6227.641.7212.5*11.7*59.6**2.0**10.3Postgraduate Degree
Level of highest non-school qualification
DO C U M E N T L I T E R A C Y SC A L E
15 105.416.22 453.437.45 649.229.74 487.616.72 515.3Total
229.939.891.547.1108.2*12.7*29.2**0.5**1.121 or more2 783.934.5960.345.01 253.617.3481.53.288.516 to 207 228.716.91 219.742.73 084.829.32 121.311.1802.811 to 154 862.93.7181.924.71 202.638.21 855.633.41 622.810 or below
Number of years of formal education
6 814.39.3631.331.62 153.233.42 273.125.81 756.7Total(c)3 838.43.4131.423.2890.438.41 474.435.01 342.1Year 10 or below
846.7*8.9*75.342.7361.933.5284.114.8125.4Year 11 or equivalent2 093.420.3424.543.0900.824.5512.412.2255.6Year 12 or equivalent
Without a non-school qualification
8 291.122.01 822.142.23 496.126.72 214.49.1758.5Total(b)*26.8**8.7**2.3**35.3**9.4**34.1**9.1**22.0**5.9Mixed Field Programmes535.4*6.4*34.030.1161.244.7239.218.9101.0Food, Hospitality and Personal Services363.8*15.7*57.147.0171.027.7100.6*9.6*35.1Creative Arts970.727.5266.942.6413.123.4227.1*6.6*63.7Society and Culture
2 007.622.1444.345.5913.225.9519.76.5130.4Management and Commerce605.533.8204.446.6282.315.191.4*4.5*27.4Education802.628.8231.147.1378.019.5156.8*4.6*36.7Health233.023.855.344.1102.6*24.1*56.1*8.1*18.8Agriculture, Environmental and Related Studies488.5*10.4*50.934.9170.334.3167.720.499.7Architecture and Building
1 560.413.6212.437.9591.434.7540.813.8215.8Engineering and Related Technologies256.127.169.546.3118.723.4*59.8**3.2**8.1Information Technology294.951.3151.438.6113.7*7.5*22.2**2.6**7.5Natural and Physical Sciences
Field of highest non-school qualification
8 291.122.01 822.142.23 496.126.72 214.49.1758.5Total(a)217.8**5.1**11.133.973.840.688.320.4*44.5Certificate not further defined
1 109.711.1122.837.7418.435.3391.316.0177.2Certificate I / II2 442.511.1269.938.4938.736.5891.714.0342.2Certificate III / IV1 332.120.9278.350.5672.822.0293.16.687.9Advanced Diploma / Diploma2 102.236.1759.142.7897.917.7372.83.472.4Bachelor Degree
409.839.0159.844.9184.214.057.5**2.0**8.3Graduate Diploma / Graduate Certificate509.938.5196.546.8238.513.066.1**1.7**8.8Postgraduate Degree
Level of highest non-school qualification
PR O S E L I T E R A C Y SC A L E
'000%'000%'000%'000%'000
Level 4/5Level 3Level 2Level 1 Total
SKILL LEVEL
SKILL LEVEL , Highes t non- schoo l qua l i f i ca t ion , Highes t year of schoo l and Length of
educat ion10
32 A B S • A D U L T L I T E R A C Y A N D L I F E SK I L L S SU R V E Y , SU M M A R Y R E S U L T S • 4 2 2 8 . 0 • 2 0 0 6 ( R E I S S U E )
(a) Includes persons whose main field of study could not be determined.(b) Includes persons who never attended school.(c) Includes persons whose level of study could not be determined.
* estimate has a relative standard error of 25% to 50% and should be usedwith caution
** estimate has a relative standard error greater than 50% and is consideredtoo unreliable for general use
8 291.121.91 819.835.72 960.928.62 371.513.71 138.9Total(a)*26.8**8.9**2.4**29.4**7.9**27.1**7.2**34.6**9.3Mixed Field Programmes535.4*5.8*31.222.6121.240.6217.430.9165.6Food, Hospitality and Personal Services363.8*14.2*51.840.9148.932.3117.6*12.5*45.5Creative Arts970.720.8202.036.3352.030.0291.512.9125.2Society and Culture
2 007.622.6454.436.9741.528.4570.912.0240.8Management and Commerce605.527.4165.842.0254.422.8138.37.847.0Education802.622.7182.338.8311.327.5220.611.088.5Health233.0*26.2*61.1*34.7*80.925.5*59.3*13.6*31.7Agriculture, Environmental and Related Studies488.5*14.4*70.634.3167.431.9155.819.494.8Architecture and Building
1 560.419.1298.534.0530.830.7479.016.2252.1Engineering and Related Technologies256.137.295.336.392.819.5*49.9*7.0*18.0Information Technology294.953.8158.532.5*95.8*10.5*31.0*3.3*9.6Natural and Physical Sciences
Field of highest non-school qualification
8 291.121.91 819.835.72 960.928.62 371.513.71 138.9Total(c)217.8*6.7*14.626.557.638.283.128.762.5Certificate not further defined
1 109.78.998.530.0332.537.5415.823.7262.9Certificate I / II2 442.511.4279.033.2811.836.0878.119.4473.6Certificate III / IV1 332.115.8210.640.0533.231.5420.312.6168.1Advanced Diploma / Diploma2 102.238.4806.838.0799.218.3384.55.3111.7Bachelor Degree
409.837.8154.741.7170.916.467.3**4.1**16.9Graduate Diploma / Graduate Certificate509.945.2230.638.9198.4*12.6*64.0*3.3*16.8Postgraduate Degree
Level of highest non-school qualification
NU M E R A C Y SC A L E
15 105.417.72 676.735.55 361.928.84 349.118.02 717.8Total
229.942.998.740.492.8*15.9*36.5**0.8**1.921 or more2 783.937.21 034.543.71 216.815.8439.93.392.716 to 207 228.718.61 343.440.12 900.629.52 133.211.8851.411 to 154 862.94.1200.123.71 151.735.81 739.536.41 771.710 or below
Number of years of formal education
6 814.311.0746.529.52 009.031.82 164.827.81 894.0Total(b)3 838.43.7142.321.7833.036.21 387.738.41 475.4Year 10 or below
846.711.193.741.1348.331.5267.016.3137.7Year 11 or equivalent2 093.424.4510.539.5827.824.3508.611.8246.5Year 12 or equivalent
Without a non-school qualification
8 291.123.31 930.240.43 352.926.32 184.39.9823.8Total(a)*26.8**11.9**3.2**36.7**9.8**42.0**11.2**9.4**2.5Mixed Field Programmes535.4*7.0*37.328.9154.644.6239.019.5104.5Food, Hospitality and Personal Services363.8*16.5*59.942.3154.030.6111.310.638.6Creative Arts970.727.6268.039.4382.824.5238.28.481.7Society and Culture
2 007.623.6474.343.9881.425.0501.27.5150.7Management and Commerce605.530.8186.245.7276.418.2110.0*5.4*32.9Education802.626.7214.142.5340.723.9192.26.955.6Health233.026.461.545.2105.3*21.5*50.0*6.9*16.1Agriculture, Environmental and Related Studies488.513.967.932.5158.934.8169.918.891.8Architecture and Building
1 560.416.5256.738.9607.230.3472.814.3223.7Engineering and Related Technologies256.136.2*92.843.9112.4*16.6*42.5**3.3**8.4Information Technology294.954.5160.836.5107.5*6.5*19.2**2.5**7.4Natural and Physical Sciences
Field of highest non-school qualification
DO C U M E N T L I T E R A C Y SC A L E c o n t .
'000%'000%'000%'000%'000
Level 4/5Level 3Level 2Level 1 Total
SKILL LEVEL
SKILL LEVEL , Highes t non- schoo l qua l i f i ca t ion , Highes t year of schoo l and Length of
educat ion co n t i n u e d10
A B S • A D U L T L I T E R A C Y A N D L I F E SK I L L S SU R V E Y , SU M M A R Y R E S U L T S • 4 2 2 8 . 0 • 2 0 0 6 ( R E I S S U E ) 33
— nil or rounded to zero (including null cells)(a) Includes persons who never attended school.(b) Includes persons whose level of study could not be determined.(c) Includes persons whose main field of study could not be determined.
* estimate has a relative standard error of 25% to 50% and should be usedwith caution
** estimate has a relative standard error greater than 50% and is consideredtoo unreliable for general use
15 105.45.4811.524.53 702.635.25 313.834.95 277.5Total
229.9*17.9*41.146.2106.229.066.6*7.0*16.021 or more2 783.912.5346.941.81 164.233.2923.712.5349.116 to 207 228.75.3385.927.11 959.639.32 840.328.32 043.011 to 154 862.9*0.8*37.69.7472.730.51 483.259.02 869.410 or below
Number of years of formal education
6 814.33.0206.917.61 201.932.42 211.146.93 194.5Total(a)3 838.4*0.7*28.69.4359.828.81 104.261.12 345.8Year 10 or below
846.7**2.3**19.820.8176.143.0364.533.8286.4Year 11 or equivalent2 093.47.6158.631.8666.035.5742.425.1526.4Year 12 or equivalent
Without a non-school qualification
8 291.17.3604.630.22 500.837.43 102.725.12 083.0Total(c)*26.8——**22.0**5.9**41.8**11.2**36.2**9.7Mixed Field Programmes535.4**2.4**12.713.974.437.9202.845.9245.6Food, Hospitality and Personal Services363.8**4.0**14.727.299.142.1153.226.696.9Creative Arts970.7*8.3*80.434.0330.436.8357.620.8202.4Society and Culture
2 007.68.3165.731.0621.439.9800.620.9420.0Management and Commerce605.510.563.741.0248.134.9211.513.682.2Education802.68.769.933.9271.838.5308.819.0152.2Health233.0*7.1*16.6*33.6*78.2*39.9*93.0*19.4*45.2Agriculture, Environmental and Related Studies488.5**3.1**15.420.7101.035.0171.141.2201.1Architecture and Building
1 560.4*3.3*52.224.1375.937.3581.535.3550.9Engineering and Related Technologies256.1*8.8*22.640.6104.137.094.8*13.5*34.6Information Technology294.925.675.547.1138.9*19.6*57.8*7.7*22.8Natural and Physical Sciences
Field of highest non-school qualification
8 291.17.3604.630.22 500.837.43 102.725.12 083.0Total(b)217.8**2.2**4.7*13.2*28.842.091.442.692.8Certificate not further defined
1 109.7*2.1*22.820.3225.441.4459.436.2402.1Certificate I / II2 442.5*2.7*65.120.7506.740.4986.636.2884.1Certificate III / IV1 332.1*5.7*75.432.2428.741.7555.620.5272.5Advanced Diploma / Diploma2 102.214.0293.840.6852.631.7667.413.7288.4Bachelor Degree
409.812.049.446.1189.031.6129.5*10.2*41.9Graduate Diploma / Graduate Certificate509.917.790.045.4231.527.4139.69.6*48.7Postgraduate Degree
Level of highest non-school qualification
PR O B L E M SO L V I N G SC A L E
15 105.416.12 437.831.34 732.130.54 614.622.03 321.0Total
229.941.394.939.891.6*16.7*38.4**2.2**5.121 or more2 783.936.71 020.939.31 094.819.0529.65.0138.616 to 207 228.715.91 146.735.72 578.132.02 311.016.51 193.011 to 154 862.93.6175.419.9967.635.71 735.640.81 984.310 or below
Number of years of formal education
6 814.39.1618.026.01 771.232.92 243.132.02 182.0Total(a)3 838.4*3.1*119.118.8721.535.41 358.642.71 639.2Year 10 or below
846.7*9.7*82.032.9278.436.8311.220.7175.2Year 11 or equivalent2 093.419.9417.036.8771.327.3571.515.9333.6Year 12 or equivalent
Without a non-school qualification
NU M E R A C Y SC A L E c o n t .
'000%'000%'000%'000%'000
Level 4/5Level 3Level 2Level 1 Total
SKILL LEVEL
SKILL LEVEL , Highes t non- schoo l qua l i f i ca t ion , Highes t year of schoo l and Length of
educat ion co n t i n u e d10
34 A B S • A D U L T L I T E R A C Y A N D L I F E SK I L L S SU R V E Y , SU M M A R Y R E S U L T S • 4 2 2 8 . 0 • 2 0 0 6 ( R E I S S U E )
(a) In the 12 completed months prior to the survey.* estimate has a relative standard error of 25% to 50% andshould be used with caution
13 379.02 404.54 525.94 126.92 321.7Total participation in learning
1 984.3*52.5263.4588.31 080.1Did not participate in informal learning
13 121.22 385.34 468.74 026.32 240.9Total participation in informal learning
3 820.1751.81 384.41 165.1518.8Learnt by moving around an organisation11 440.42 231.14 028.63 434.61 746.2Learnt by trying things out or practice
9 865.02 059.53 610.42 865.31 329.9Learnt by watching, getting help or advice5 842.21 250.72 198.21 694.9698.5Used video, television or tapes9 264.52 110.63 541.42 633.1979.4Used the computer or Internet3 361.9808.71 298.9902.5351.8Went on guided tours8 317.71 975.03 222.72 281.1839.0Read manuals or reference books5 116.31 344.21 962.81 341.5467.7Attended lectures, seminars or workshops4 245.41 140.21 640.01 108.1357.0Visited trade fairs, professional conferences or expos
Participation in informal learning
8 429.8837.32 247.42 748.02 597.2Did not undertake an educational qualification and/or course6 675.61 600.52 484.71 866.6723.8Undertook an educational qualification and/or course
Participation in courses
NU M E R A C Y SC A L E
13 379.02 634.25 101.43 832.21 811.3Total participation in learning
1 984.3*71.6346.9596.3969.4Did not participate in informal learning
13 121.22 605.15 015.03 752.71 748.4Total participation in informal learning
3 820.1804.71 579.81 044.3391.2Learnt by moving around an organisation11 440.42 410.04 502.63 165.71 362.1Learnt by trying things out or practice
9 865.02 229.03 994.72 640.11 001.1Learnt by watching, getting help or advice5 842.21 347.02 463.81 522.3509.1Used video, television or tapes9 264.52 291.03 977.12 352.8643.7Used the computer or Internet3 361.9844.61 455.3796.0266.0Went on guided tours8 317.72 138.63 551.02 023.5604.6Read manuals or reference books5 116.31 432.32 200.41 137.3346.3Attended lectures, seminars or workshops4 245.41 200.21 845.3934.2265.7Visited trade fairs, professional conferences or expos
Participation in informal learning
8 429.8881.42 544.72 740.32 263.3Did not undertake an educational qualification and/or course6 675.61 795.22 817.21 608.7454.4Undertook an educational qualification and/or course
Participation in courses
DO C U M E N T L I T E R A C Y SC A L E
13 379.02 408.25 359.43 920.61 690.9Total participation in learning
1 984.368.4371.8657.1887.0Did not participate in informal learning
13 121.22 385.05 277.53 830.51 628.2Total participation in informal learning
3 820.1746.11 601.31 122.8350.0Learnt by moving around an organisation11 440.42 205.64 727.03 256.31 251.5Learnt by trying things out or practice
9 865.02 045.54 191.32 702.2925.9Learnt by watching, getting help or advice5 842.21 253.62 562.01 544.4482.3Used video, television or tapes9 264.52 082.94 166.92 397.9616.8Used the computer or Internet3 361.9821.11 506.9814.9218.9Went on guided tours8 317.71 947.93 775.52 077.2517.1Read manuals or reference books5 116.31 359.92 331.41 124.0300.9Attended lectures, seminars or workshops4 245.41 084.61 983.2930.6247.0Visited trade fairs, professional conferences or expos
Participation in informal learning
8 429.8853.12 658.12 835.82 082.8Did not undertake an educational qualification and/or course6 675.61 600.22 991.11 651.8432.5Undertook an educational qualification and/or course
Participation in courses
PR O S E L I T E R A C Y SC A L E
'000'000'000'000'000
Level 4/5Level 3Level 2Level 1 Total
SKILL LEVEL
SKILL LEVEL , Par t i c ipa t ion in adu l t learn ing (a)11
A B S • A D U L T L I T E R A C Y A N D L I F E SK I L L S SU R V E Y , SU M M A R Y R E S U L T S • 4 2 2 8 . 0 • 2 0 0 6 ( R E I S S U E ) 35
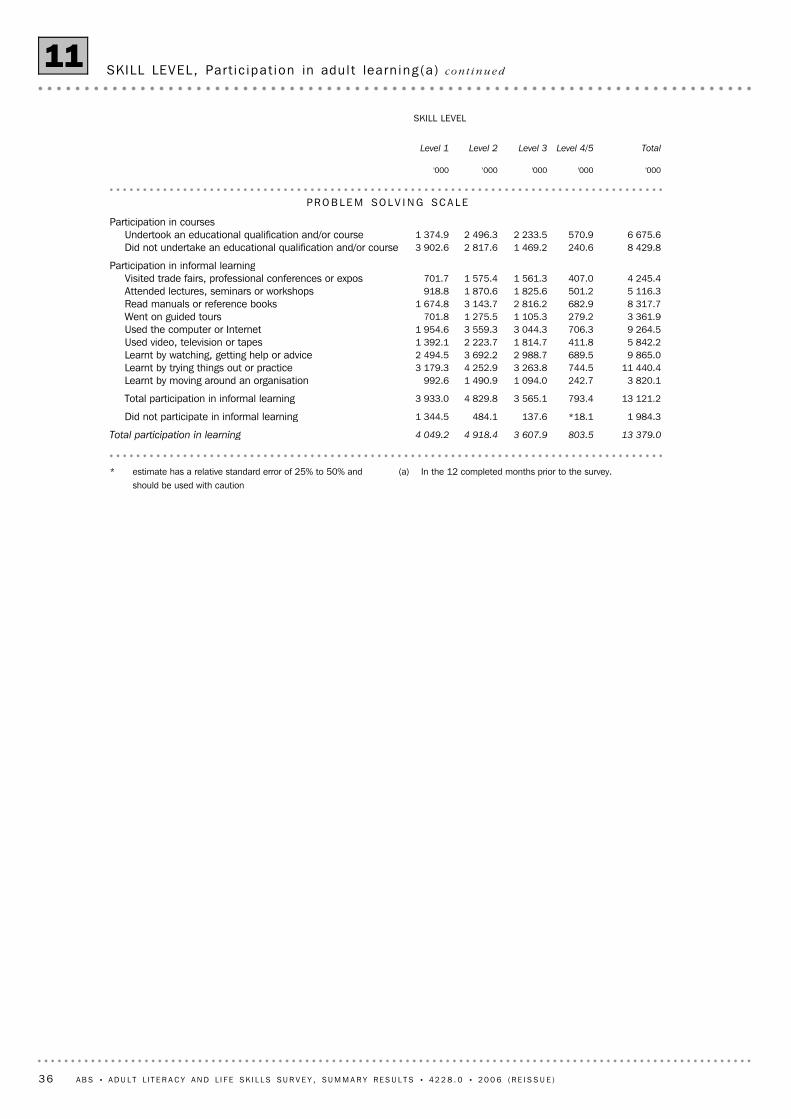
(a) In the 12 completed months prior to the survey.* estimate has a relative standard error of 25% to 50% andshould be used with caution
13 379.0803.53 607.94 918.44 049.2Total participation in learning
1 984.3*18.1137.6484.11 344.5Did not participate in informal learning
13 121.2793.43 565.14 829.83 933.0Total participation in informal learning
3 820.1242.71 094.01 490.9992.6Learnt by moving around an organisation11 440.4744.53 263.84 252.93 179.3Learnt by trying things out or practice
9 865.0689.52 988.73 692.22 494.5Learnt by watching, getting help or advice5 842.2411.81 814.72 223.71 392.1Used video, television or tapes9 264.5706.33 044.33 559.31 954.6Used the computer or Internet3 361.9279.21 105.31 275.5701.8Went on guided tours8 317.7682.92 816.23 143.71 674.8Read manuals or reference books5 116.3501.21 825.61 870.6918.8Attended lectures, seminars or workshops4 245.4407.01 561.31 575.4701.7Visited trade fairs, professional conferences or expos
Participation in informal learning
8 429.8240.61 469.22 817.63 902.6Did not undertake an educational qualification and/or course6 675.6570.92 233.52 496.31 374.9Undertook an educational qualification and/or course
Participation in courses
PR O B L E M SO L V I N G SC A L E
'000'000'000'000'000
Level 4/5Level 3Level 2Level 1 Total
SKILL LEVEL
SKILL LEVEL , Par t i c ipa t ion in adu l t learn ing (a) co n t i n u e d11
36 A B S • A D U L T L I T E R A C Y A N D L I F E SK I L L S SU R V E Y , SU M M A R Y R E S U L T S • 4 2 2 8 . 0 • 2 0 0 6 ( R E I S S U E )
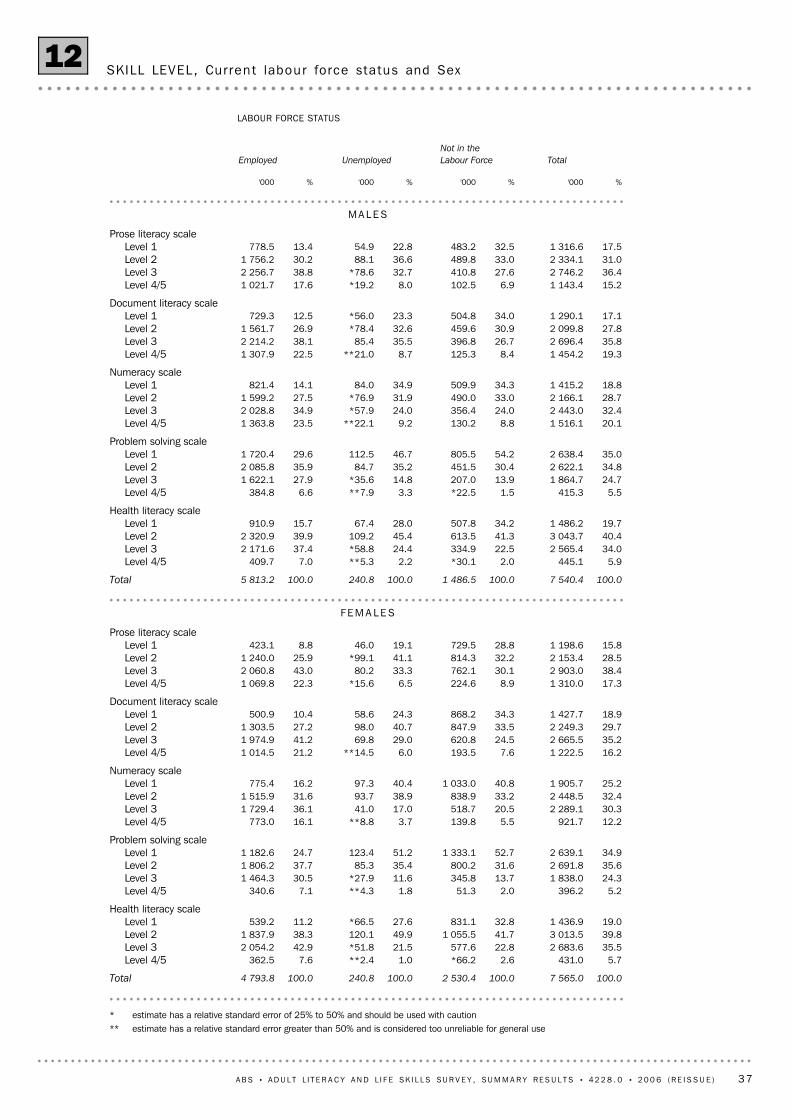
* estimate has a relative standard error of 25% to 50% and should be used with caution** estimate has a relative standard error greater than 50% and is considered too unreliable for general use
100.07 565.0100.02 530.4100.0240.8100.04 793.8Total
5.7431.02.6*66.21.0**2.47.6362.5Level 4/535.52 683.622.8577.621.5*51.842.92 054.2Level 339.83 013.541.71 055.549.9120.138.31 837.9Level 219.01 436.932.8831.127.6*66.511.2539.2Level 1
Health literacy scale
5.2396.22.051.31.8**4.37.1340.6Level 4/524.31 838.013.7345.811.6*27.930.51 464.3Level 335.62 691.831.6800.235.485.337.71 806.2Level 234.92 639.152.71 333.151.2123.424.71 182.6Level 1
Problem solving scale
12.2921.75.5139.83.7**8.816.1773.0Level 4/530.32 289.120.5518.717.041.036.11 729.4Level 332.42 448.533.2838.938.993.731.61 515.9Level 225.21 905.740.81 033.040.497.316.2775.4Level 1
Numeracy scale
16.21 222.57.6193.56.0**14.521.21 014.5Level 4/535.22 665.524.5620.829.069.841.21 974.9Level 329.72 249.333.5847.940.798.027.21 303.5Level 218.91 427.734.3868.224.358.610.4500.9Level 1
Document literacy scale
17.31 310.08.9224.66.5*15.622.31 069.8Level 4/538.42 903.030.1762.133.380.243.02 060.8Level 328.52 153.432.2814.341.1*99.125.91 240.0Level 215.81 198.628.8729.519.146.08.8423.1Level 1
Prose literacy scale
FE M A L E S
100.07 540.4100.01 486.5100.0240.8100.05 813.2Total
5.9445.12.0*30.12.2**5.37.0409.7Level 4/534.02 565.422.5334.924.4*58.837.42 171.6Level 340.43 043.741.3613.545.4109.239.92 320.9Level 219.71 486.234.2507.828.067.415.7910.9Level 1
Health literacy scale
5.5415.31.5*22.53.3**7.96.6384.8Level 4/524.71 864.713.9207.014.8*35.627.91 622.1Level 334.82 622.130.4451.535.284.735.92 085.8Level 235.02 638.454.2805.546.7112.529.61 720.4Level 1
Problem solving scale
20.11 516.18.8130.29.2**22.123.51 363.8Level 4/532.42 443.024.0356.424.0*57.934.92 028.8Level 328.72 166.133.0490.031.9*76.927.51 599.2Level 218.81 415.234.3509.934.984.014.1821.4Level 1
Numeracy scale
19.31 454.28.4125.38.7**21.022.51 307.9Level 4/535.82 696.426.7396.835.585.438.12 214.2Level 327.82 099.830.9459.632.6*78.426.91 561.7Level 217.11 290.134.0504.823.3*56.012.5729.3Level 1
Document literacy scale
15.21 143.46.9102.58.0*19.217.61 021.7Level 4/536.42 746.227.6410.832.7*78.638.82 256.7Level 331.02 334.133.0489.836.688.130.21 756.2Level 217.51 316.632.5483.222.854.913.4778.5Level 1
Prose literacy scale
MA L E S
%'000%'000%'000%'000
Not in the
Labour ForceUnemployedEmployed Total
LABOUR FORCE STATUS
SKILL LEVEL , Cur ren t labour force status and Sex12
A B S • A D U L T L I T E R A C Y A N D L I F E SK I L L S SU R V E Y , SU M M A R Y R E S U L T S • 4 2 2 8 . 0 • 2 0 0 6 ( R E I S S U E ) 37
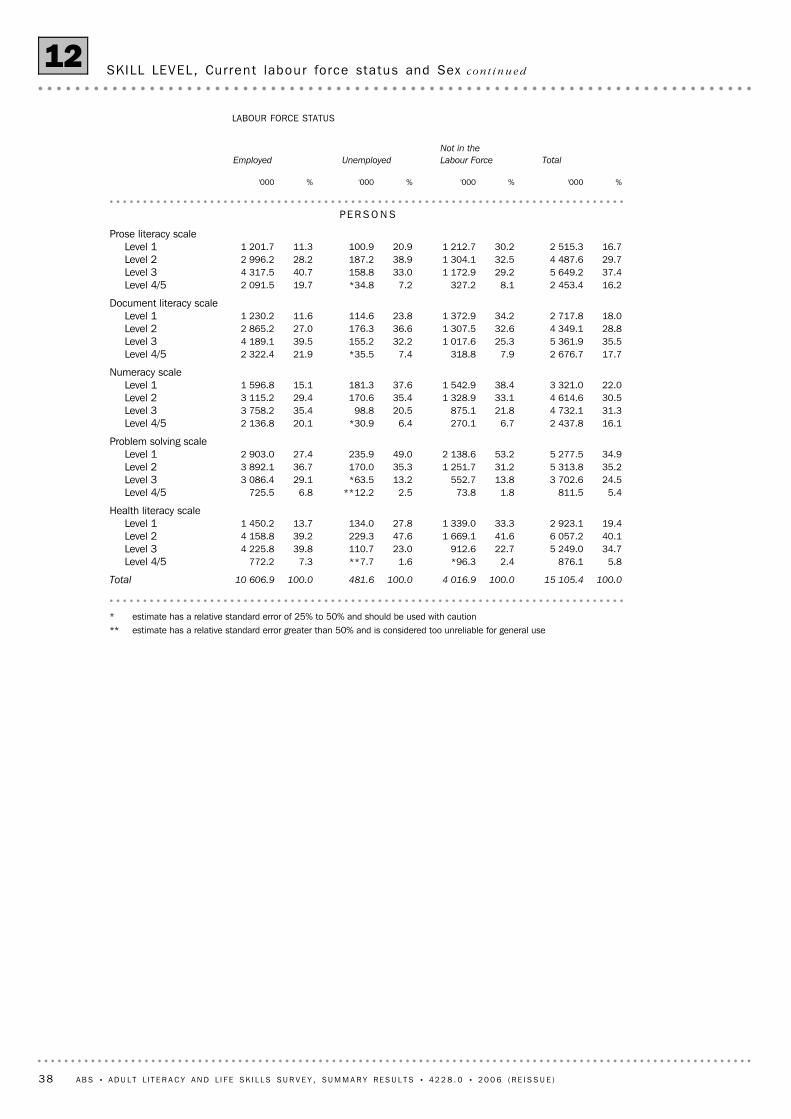
* estimate has a relative standard error of 25% to 50% and should be used with caution** estimate has a relative standard error greater than 50% and is considered too unreliable for general use
100.015 105.4100.04 016.9100.0481.6100.010 606.9Total
5.8876.12.4*96.31.6**7.77.3772.2Level 4/534.75 249.022.7912.623.0110.739.84 225.8Level 340.16 057.241.61 669.147.6229.339.24 158.8Level 219.42 923.133.31 339.027.8134.013.71 450.2Level 1
Health literacy scale
5.4811.51.873.82.5**12.26.8725.5Level 4/524.53 702.613.8552.713.2*63.529.13 086.4Level 335.25 313.831.21 251.735.3170.036.73 892.1Level 234.95 277.553.22 138.649.0235.927.42 903.0Level 1
Problem solving scale
16.12 437.86.7270.16.4*30.920.12 136.8Level 4/531.34 732.121.8875.120.598.835.43 758.2Level 330.54 614.633.11 328.935.4170.629.43 115.2Level 222.03 321.038.41 542.937.6181.315.11 596.8Level 1
Numeracy scale
17.72 676.77.9318.87.4*35.521.92 322.4Level 4/535.55 361.925.31 017.632.2155.239.54 189.1Level 328.84 349.132.61 307.536.6176.327.02 865.2Level 218.02 717.834.21 372.923.8114.611.61 230.2Level 1
Document literacy scale
16.22 453.48.1327.27.2*34.819.72 091.5Level 4/537.45 649.229.21 172.933.0158.840.74 317.5Level 329.74 487.632.51 304.138.9187.228.22 996.2Level 216.72 515.330.21 212.720.9100.911.31 201.7Level 1
Prose literacy scale
PE R S O N S
%'000%'000%'000%'000
Not in the
Labour ForceUnemployedEmployed Total
LABOUR FORCE STATUS
SKILL LEVEL , Cur ren t labour force status and Sex co n t i n u e d12
38 A B S • A D U L T L I T E R A C Y A N D L I F E SK I L L S SU R V E Y , SU M M A R Y R E S U L T S • 4 2 2 8 . 0 • 2 0 0 6 ( R E I S S U E )
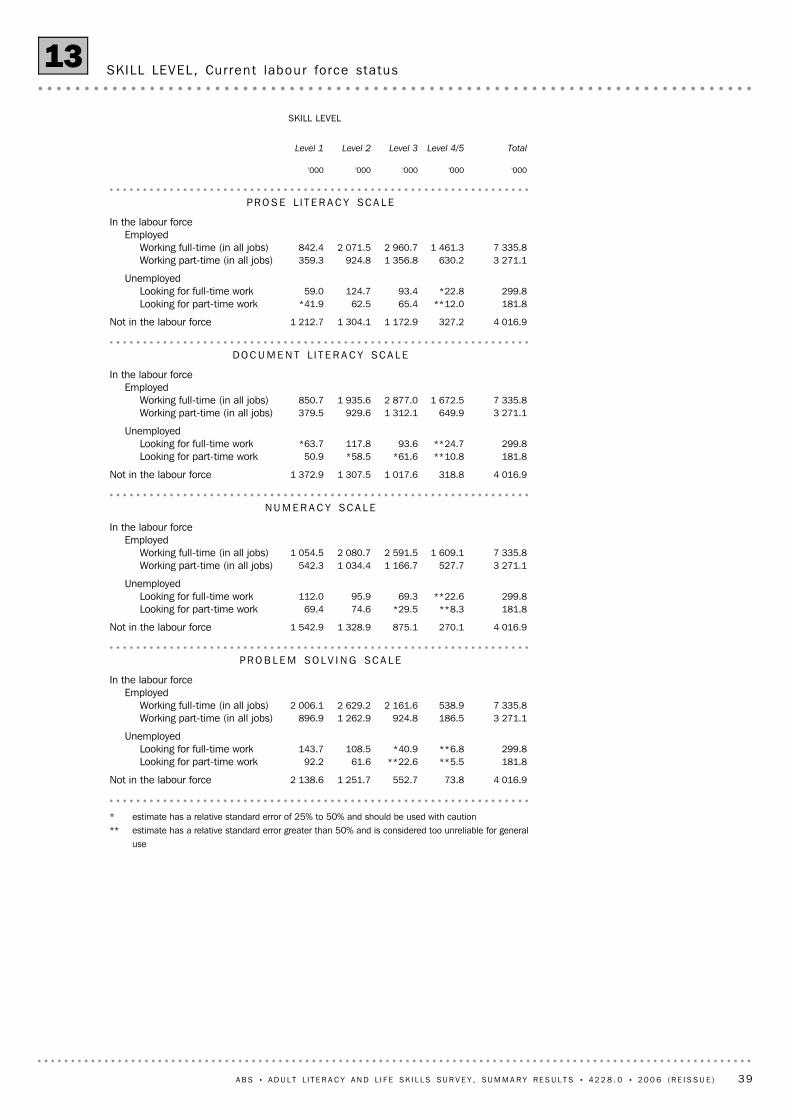
* estimate has a relative standard error of 25% to 50% and should be used with caution** estimate has a relative standard error greater than 50% and is considered too unreliable for general
use
4 016.973.8552.71 251.72 138.6Not in the labour force
181.8**5.5**22.661.692.2Looking for part-time work299.8**6.8*40.9108.5143.7Looking for full-time work
Unemployed
3 271.1186.5924.81 262.9896.9Working part-time (in all jobs)7 335.8538.92 161.62 629.22 006.1Working full-time (in all jobs)
EmployedIn the labour force
PR O B L E M SO L V I N G SC A L E
4 016.9270.1875.11 328.91 542.9Not in the labour force
181.8**8.3*29.574.669.4Looking for part-time work299.8**22.669.395.9112.0Looking for full-time work
Unemployed
3 271.1527.71 166.71 034.4542.3Working part-time (in all jobs)7 335.81 609.12 591.52 080.71 054.5Working full-time (in all jobs)
EmployedIn the labour force
NU M E R A C Y SC A L E
4 016.9318.81 017.61 307.51 372.9Not in the labour force
181.8**10.8*61.6*58.550.9Looking for part-time work299.8**24.793.6117.8*63.7Looking for full-time work
Unemployed
3 271.1649.91 312.1929.6379.5Working part-time (in all jobs)7 335.81 672.52 877.01 935.6850.7Working full-time (in all jobs)
EmployedIn the labour force
DO C U M E N T L I T E R A C Y SC A L E
4 016.9327.21 172.91 304.11 212.7Not in the labour force
181.8**12.065.462.5*41.9Looking for part-time work299.8*22.893.4124.759.0Looking for full-time work
Unemployed
3 271.1630.21 356.8924.8359.3Working part-time (in all jobs)7 335.81 461.32 960.72 071.5842.4Working full-time (in all jobs)
EmployedIn the labour force
PR O S E L I T E R A C Y SC A L E
'000'000'000'000'000
Level 4/5Level 3Level 2Level 1 Total
SKILL LEVEL
SKILL LEVEL , Cur ren t labour force status13
A B S • A D U L T L I T E R A C Y A N D L I F E SK I L L S SU R V E Y , SU M M A R Y R E S U L T S • 4 2 2 8 . 0 • 2 0 0 6 ( R E I S S U E ) 39
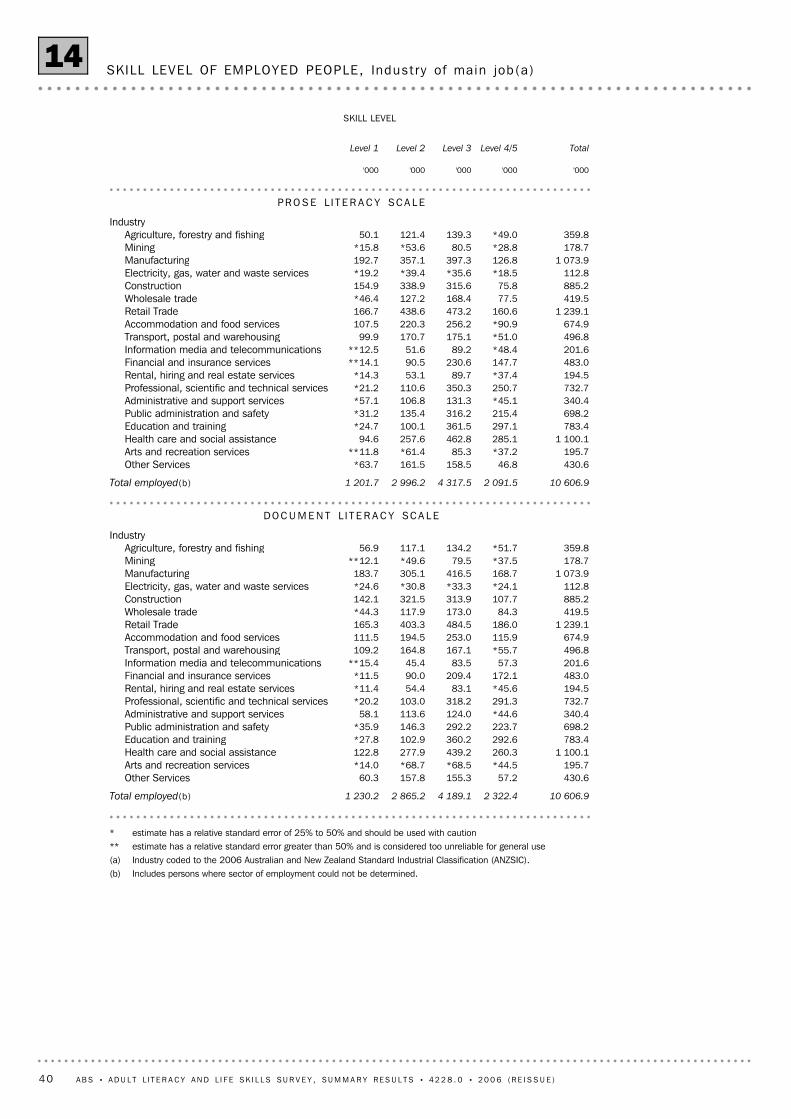
* estimate has a relative standard error of 25% to 50% and should be used with caution** estimate has a relative standard error greater than 50% and is considered too unreliable for general use(a) Industry coded to the 2006 Australian and New Zealand Standard Industrial Classification (ANZSIC).(b) Includes persons where sector of employment could not be determined.
10 606.92 322.44 189.12 865.21 230.2Total employed(b)
430.657.2155.3157.860.3Other Services195.7*44.5*68.5*68.7*14.0Arts and recreation services
1 100.1260.3439.2277.9122.8Health care and social assistance783.4292.6360.2102.9*27.8Education and training698.2223.7292.2146.3*35.9Public administration and safety340.4*44.6124.0113.658.1Administrative and support services732.7291.3318.2103.0*20.2Professional, scientific and technical services194.5*45.683.154.4*11.4Rental, hiring and real estate services483.0172.1209.490.0*11.5Financial and insurance services201.657.383.545.4**15.4Information media and telecommunications496.8*55.7167.1164.8109.2Transport, postal and warehousing674.9115.9253.0194.5111.5Accommodation and food services
1 239.1186.0484.5403.3165.3Retail Trade419.584.3173.0117.9*44.3Wholesale trade885.2107.7313.9321.5142.1Construction112.8*24.1*33.3*30.8*24.6Electricity, gas, water and waste services
1 073.9168.7416.5305.1183.7Manufacturing178.7*37.579.5*49.6**12.1Mining359.8*51.7134.2117.156.9Agriculture, forestry and fishing
Industry
DO C U M E N T L I T E R A C Y SC A L E
10 606.92 091.54 317.52 996.21 201.7Total employed(b)
430.646.8158.5161.5*63.7Other Services195.7*37.285.3*61.4**11.8Arts and recreation services
1 100.1285.1462.8257.694.6Health care and social assistance783.4297.1361.5100.1*24.7Education and training698.2215.4316.2135.4*31.2Public administration and safety340.4*45.1131.3106.8*57.1Administrative and support services732.7250.7350.3110.6*21.2Professional, scientific and technical services194.5*37.489.753.1*14.3Rental, hiring and real estate services483.0147.7230.690.5**14.1Financial and insurance services201.6*48.489.251.6**12.5Information media and telecommunications496.8*51.0175.1170.799.9Transport, postal and warehousing674.9*90.9256.2220.3107.5Accommodation and food services
1 239.1160.6473.2438.6166.7Retail Trade419.577.5168.4127.2*46.4Wholesale trade885.275.8315.6338.9154.9Construction112.8*18.5*35.6*39.4*19.2Electricity, gas, water and waste services
1 073.9126.8397.3357.1192.7Manufacturing178.7*28.880.5*53.6*15.8Mining359.8*49.0139.3121.450.1Agriculture, forestry and fishing
Industry
PR O S E L I T E R A C Y SC A L E
'000'000'000'000'000
Level 4/5Level 3Level 2Level 1 Total
SKILL LEVEL
SKILL LEVEL OF EMPLOYED PEOPLE, Indus t r y of main job(a)14
40 A B S • A D U L T L I T E R A C Y A N D L I F E SK I L L S SU R V E Y , SU M M A R Y R E S U L T S • 4 2 2 8 . 0 • 2 0 0 6 ( R E I S S U E )
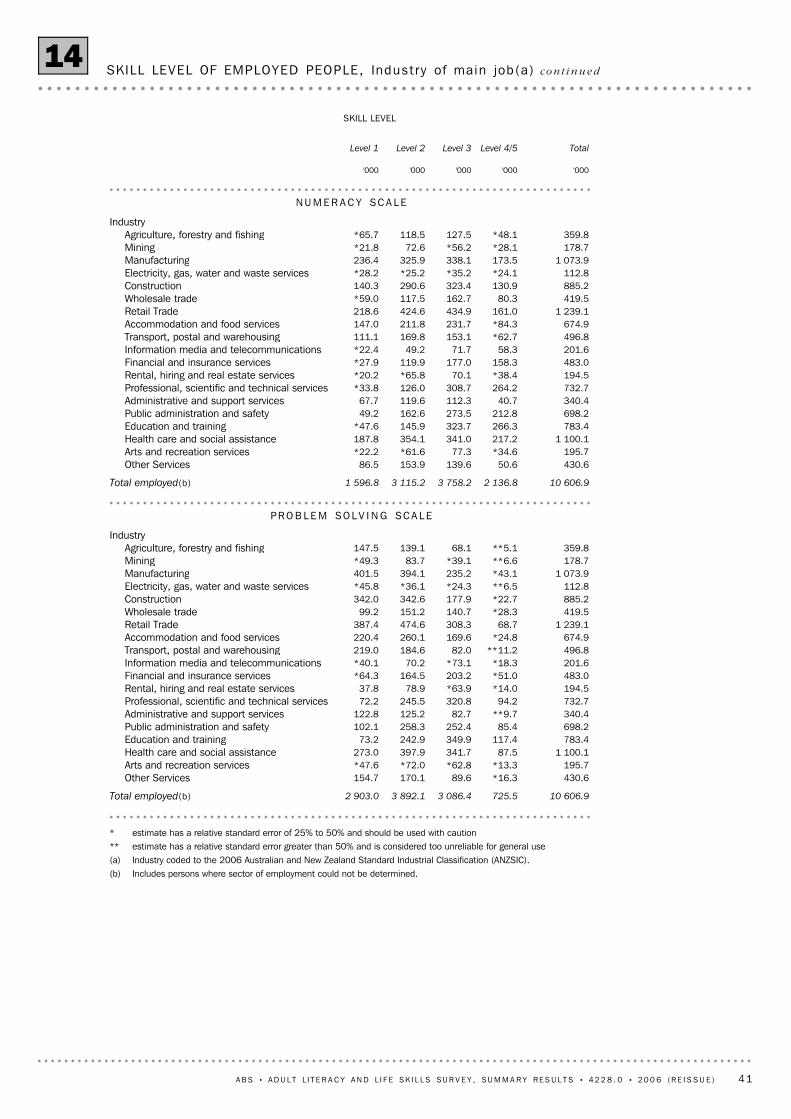
* estimate has a relative standard error of 25% to 50% and should be used with caution** estimate has a relative standard error greater than 50% and is considered too unreliable for general use(a) Industry coded to the 2006 Australian and New Zealand Standard Industrial Classification (ANZSIC).(b) Includes persons where sector of employment could not be determined.
10 606.9725.53 086.43 892.12 903.0Total employed(b)
430.6*16.389.6170.1154.7Other Services195.7*13.3*62.8*72.0*47.6Arts and recreation services
1 100.187.5341.7397.9273.0Health care and social assistance783.4117.4349.9242.973.2Education and training698.285.4252.4258.3102.1Public administration and safety340.4**9.782.7125.2122.8Administrative and support services732.794.2320.8245.572.2Professional, scientific and technical services194.5*14.0*63.978.937.8Rental, hiring and real estate services483.0*51.0203.2164.5*64.3Financial and insurance services201.6*18.3*73.170.2*40.1Information media and telecommunications496.8**11.282.0184.6219.0Transport, postal and warehousing674.9*24.8169.6260.1220.4Accommodation and food services
1 239.168.7308.3474.6387.4Retail Trade419.5*28.3140.7151.299.2Wholesale trade885.2*22.7177.9342.6342.0Construction112.8**6.5*24.3*36.1*45.8Electricity, gas, water and waste services
1 073.9*43.1235.2394.1401.5Manufacturing178.7**6.6*39.183.7*49.3Mining359.8**5.168.1139.1147.5Agriculture, forestry and fishing
Industry
PR O B L E M SO L V I N G SC A L E
10 606.92 136.83 758.23 115.21 596.8Total employed(b)
430.650.6139.6153.986.5Other Services195.7*34.677.3*61.6*22.2Arts and recreation services
1 100.1217.2341.0354.1187.8Health care and social assistance783.4266.3323.7145.9*47.6Education and training698.2212.8273.5162.649.2Public administration and safety340.440.7112.3119.667.7Administrative and support services732.7264.2308.7126.0*33.8Professional, scientific and technical services194.5*38.470.1*65.8*20.2Rental, hiring and real estate services483.0158.3177.0119.9*27.9Financial and insurance services201.658.371.749.2*22.4Information media and telecommunications496.8*62.7153.1169.8111.1Transport, postal and warehousing674.9*84.3231.7211.8147.0Accommodation and food services
1 239.1161.0434.9424.6218.6Retail Trade419.580.3162.7117.5*59.0Wholesale trade885.2130.9323.4290.6140.3Construction112.8*24.1*35.2*25.2*28.2Electricity, gas, water and waste services
1 073.9173.5338.1325.9236.4Manufacturing178.7*28.1*56.272.6*21.8Mining359.8*48.1127.5118.5*65.7Agriculture, forestry and fishing
Industry
NU M E R A C Y SC A L E
'000'000'000'000'000
Level 4/5Level 3Level 2Level 1 Total
SKILL LEVEL
SKILL LEVEL OF EMPLOYED PEOPLE, Indus t r y of main job(a) co n t i n u e d14
A B S • A D U L T L I T E R A C Y A N D L I F E SK I L L S SU R V E Y , SU M M A R Y R E S U L T S • 4 2 2 8 . 0 • 2 0 0 6 ( R E I S S U E ) 41
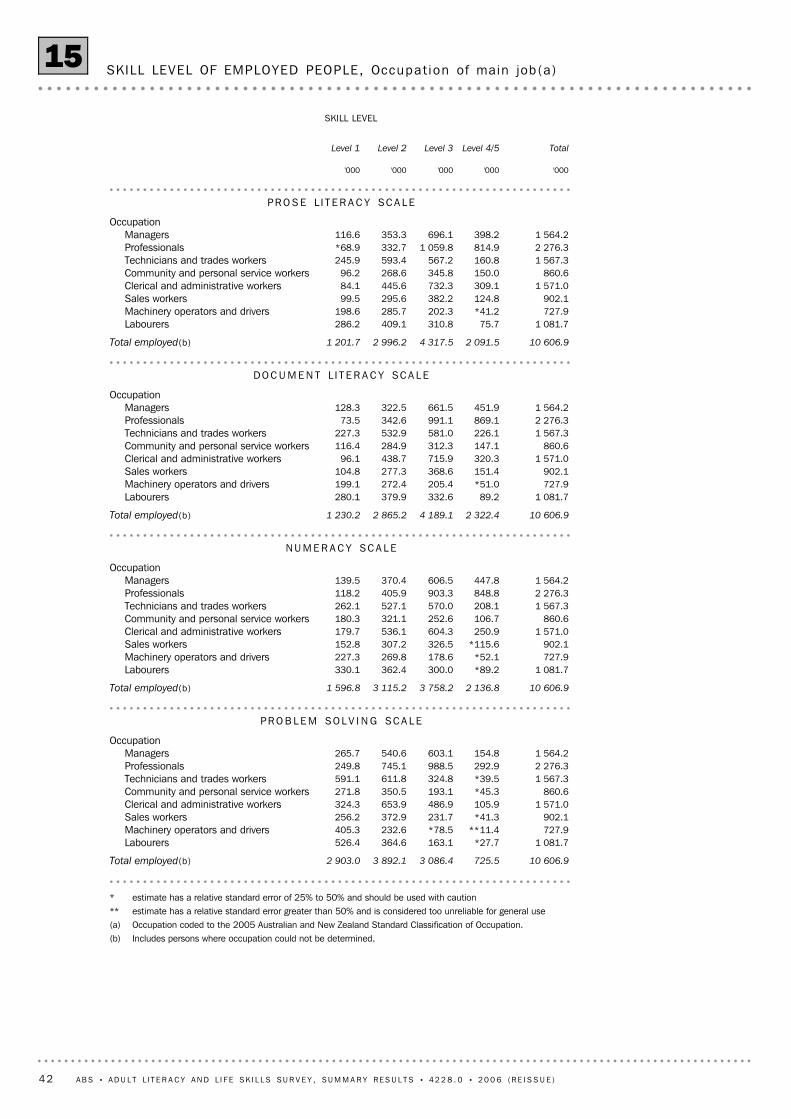
* estimate has a relative standard error of 25% to 50% and should be used with caution** estimate has a relative standard error greater than 50% and is considered too unreliable for general use(a) Occupation coded to the 2005 Australian and New Zealand Standard Classification of Occupation.(b) Includes persons where occupation could not be determined.
10 606.9725.53 086.43 892.12 903.0Total employed(b)
1 081.7*27.7163.1364.6526.4Labourers727.9**11.4*78.5232.6405.3Machinery operators and drivers902.1*41.3231.7372.9256.2Sales workers
1 571.0105.9486.9653.9324.3Clerical and administrative workers860.6*45.3193.1350.5271.8Community and personal service workers
1 567.3*39.5324.8611.8591.1Technicians and trades workers2 276.3292.9988.5745.1249.8Professionals1 564.2154.8603.1540.6265.7Managers
Occupation
PR O B L E M SO L V I N G SC A L E
10 606.92 136.83 758.23 115.21 596.8Total employed(b)
1 081.7*89.2300.0362.4330.1Labourers727.9*52.1178.6269.8227.3Machinery operators and drivers902.1*115.6326.5307.2152.8Sales workers
1 571.0250.9604.3536.1179.7Clerical and administrative workers860.6106.7252.6321.1180.3Community and personal service workers
1 567.3208.1570.0527.1262.1Technicians and trades workers2 276.3848.8903.3405.9118.2Professionals1 564.2447.8606.5370.4139.5Managers
Occupation
NU M E R A C Y SC A L E
10 606.92 322.44 189.12 865.21 230.2Total employed(b)
1 081.789.2332.6379.9280.1Labourers727.9*51.0205.4272.4199.1Machinery operators and drivers902.1151.4368.6277.3104.8Sales workers
1 571.0320.3715.9438.796.1Clerical and administrative workers860.6147.1312.3284.9116.4Community and personal service workers
1 567.3226.1581.0532.9227.3Technicians and trades workers2 276.3869.1991.1342.673.5Professionals1 564.2451.9661.5322.5128.3Managers
Occupation
DO C U M E N T L I T E R A C Y SC A L E
10 606.92 091.54 317.52 996.21 201.7Total employed(b)
1 081.775.7310.8409.1286.2Labourers727.9*41.2202.3285.7198.6Machinery operators and drivers902.1124.8382.2295.699.5Sales workers
1 571.0309.1732.3445.684.1Clerical and administrative workers860.6150.0345.8268.696.2Community and personal service workers
1 567.3160.8567.2593.4245.9Technicians and trades workers2 276.3814.91 059.8332.7*68.9Professionals1 564.2398.2696.1353.3116.6Managers
Occupation
PR O S E L I T E R A C Y SC A L E
'000'000'000'000'000
Level 4/5Level 3Level 2Level 1 Total
SKILL LEVEL
SKILL LEVEL OF EMPLOYED PEOPLE, Occupat ion of main job(a)15
42 A B S • A D U L T L I T E R A C Y A N D L I F E SK I L L S SU R V E Y , SU M M A R Y R E S U L T S • 4 2 2 8 . 0 • 2 0 0 6 ( R E I S S U E )
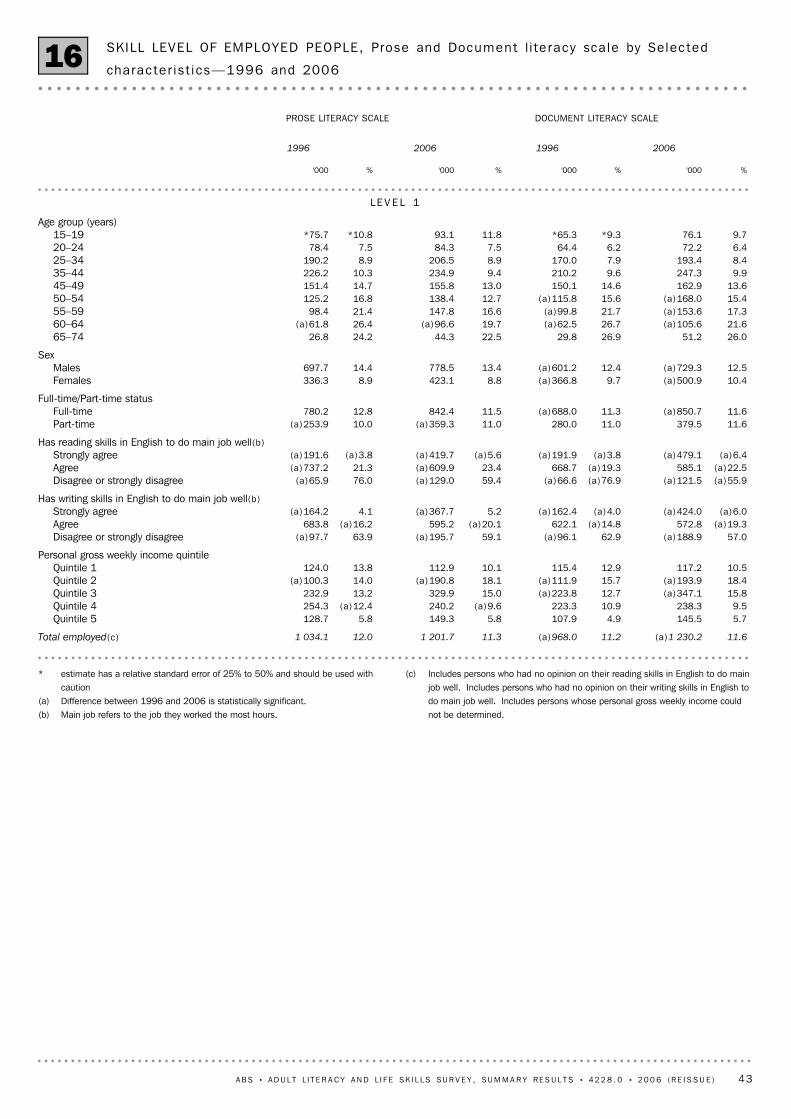
(c) Includes persons who had no opinion on their reading skills in English to do mainjob well. Includes persons who had no opinion on their writing skills in English todo main job well. Includes persons whose personal gross weekly income couldnot be determined.
* estimate has a relative standard error of 25% to 50% and should be used withcaution
(a) Difference between 1996 and 2006 is statistically significant.(b) Main job refers to the job they worked the most hours.
11.6(a)1 230.211.2(a)968.011.31 201.712.01 034.1Total employed(c)
5.7145.54.9107.95.8149.35.8128.7Quintile 59.5238.310.9223.3(a)9.6240.2(a)12.4254.3Quintile 4
15.8(a)347.112.7(a)223.815.0329.913.2232.9Quintile 318.4(a)193.915.7(a)111.918.1(a)190.814.0(a)100.3Quintile 210.5117.212.9115.410.1112.913.8124.0Quintile 1
Personal gross weekly income quintile
57.0(a)188.962.9(a)96.159.1(a)195.763.9(a)97.7Disagree or strongly disagree(a)19.3572.8(a)14.8622.1(a)20.1595.2(a)16.2683.8Agree
(a)6.0(a)424.0(a)4.0(a)162.45.2(a)367.74.1(a)164.2Strongly agreeHas writing skills in English to do main job well(b)
(a)55.9(a)121.5(a)76.9(a)66.659.4(a)129.076.0(a)65.9Disagree or strongly disagree(a)22.5585.1(a)19.3668.723.4(a)609.921.3(a)737.2Agree
(a)6.4(a)479.1(a)3.8(a)191.9(a)5.6(a)419.7(a)3.8(a)191.6Strongly agreeHas reading skills in English to do main job well(b)
11.6379.511.0280.011.0(a)359.310.0(a)253.9Part-time11.6(a)850.711.3(a)688.011.5842.412.8780.2Full-time
Full-time/Part-time status
10.4(a)500.99.7(a)366.88.8423.18.9336.3Females12.5(a)729.312.4(a)601.213.4778.514.4697.7Males
Sex
26.051.226.929.822.544.324.226.865–7421.6(a)105.626.7(a)62.519.7(a)96.626.4(a)61.860–6417.3(a)153.621.7(a)99.816.6147.821.498.455–5915.4(a)168.015.6(a)115.812.7138.416.8125.250–5413.6162.914.6150.113.0155.814.7151.445–49
9.9247.39.6210.29.4234.910.3226.235–448.4193.47.9170.08.9206.58.9190.225–346.472.26.264.47.584.37.578.420–249.776.1*9.3*65.311.893.1*10.8*75.715–19
Age group (years)
LE V E L 1
%'000%'000%'000%'000
2006199620061996
DOCUMENT LITERACY SCALEPROSE LITERACY SCALE
SKILL LEVEL OF EMPLOYED PEOPLE, Prose and Document l i te racy sca le by Selec ted
charac te r i s t i cs—1996 and 200616
A B S • A D U L T L I T E R A C Y A N D L I F E SK I L L S SU R V E Y , SU M M A R Y R E S U L T S • 4 2 2 8 . 0 • 2 0 0 6 ( R E I S S U E ) 43
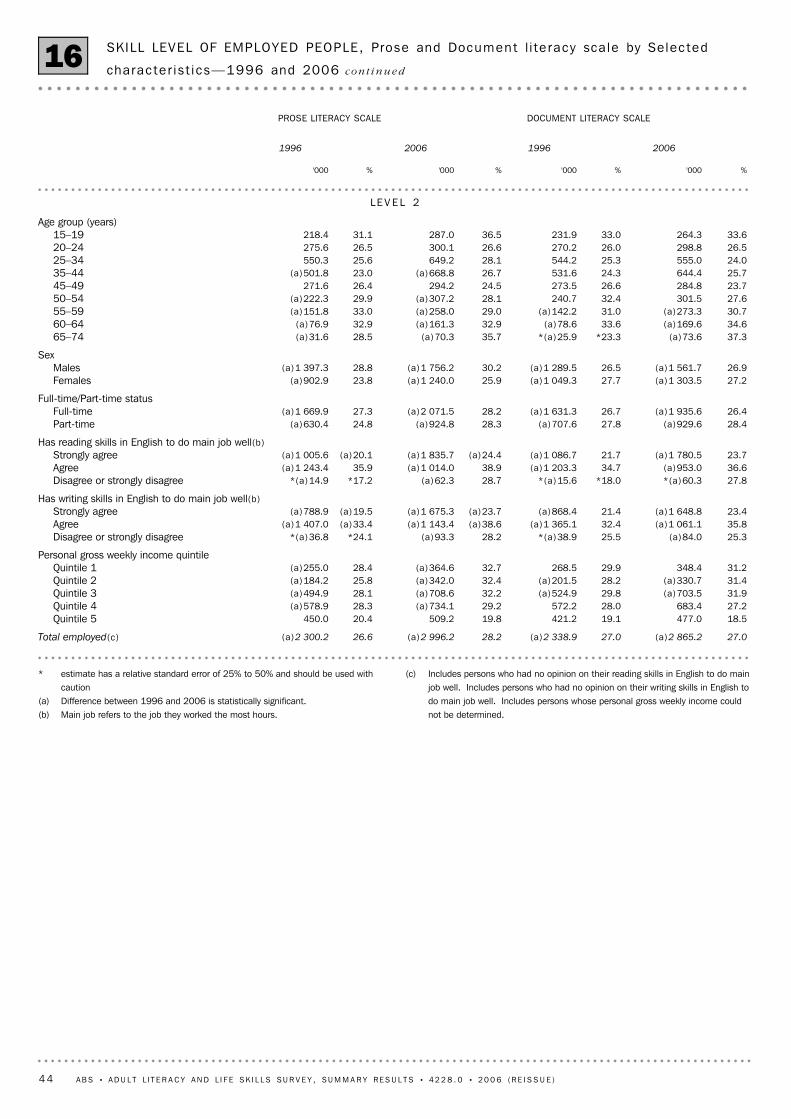
(c) Includes persons who had no opinion on their reading skills in English to do mainjob well. Includes persons who had no opinion on their writing skills in English todo main job well. Includes persons whose personal gross weekly income couldnot be determined.
* estimate has a relative standard error of 25% to 50% and should be used withcaution
(a) Difference between 1996 and 2006 is statistically significant.(b) Main job refers to the job they worked the most hours.
27.0(a)2 865.227.0(a)2 338.928.2(a)2 996.226.6(a)2 300.2Total employed(c)
18.5477.019.1421.219.8509.220.4450.0Quintile 527.2683.428.0572.229.2(a)734.128.3(a)578.9Quintile 431.9(a)703.529.8(a)524.932.2(a)708.628.1(a)494.9Quintile 331.4(a)330.728.2(a)201.532.4(a)342.025.8(a)184.2Quintile 231.2348.429.9268.532.7(a)364.628.4(a)255.0Quintile 1
Personal gross weekly income quintile
25.3(a)84.025.5*(a)38.928.2(a)93.3*24.1*(a)36.8Disagree or strongly disagree35.8(a)1 061.132.4(a)1 365.1(a)38.6(a)1 143.4(a)33.4(a)1 407.0Agree23.4(a)1 648.821.4(a)868.4(a)23.7(a)1 675.3(a)19.5(a)788.9Strongly agree
Has writing skills in English to do main job well(b)
27.8*(a)60.3*18.0*(a)15.628.7(a)62.3*17.2*(a)14.9Disagree or strongly disagree36.6(a)953.034.7(a)1 203.338.9(a)1 014.035.9(a)1 243.4Agree23.7(a)1 780.521.7(a)1 086.7(a)24.4(a)1 835.7(a)20.1(a)1 005.6Strongly agree
Has reading skills in English to do main job well(b)
28.4(a)929.627.8(a)707.628.3(a)924.824.8(a)630.4Part-time26.4(a)1 935.626.7(a)1 631.328.2(a)2 071.527.3(a)1 669.9Full-time
Full-time/Part-time status
27.2(a)1 303.527.7(a)1 049.325.9(a)1 240.023.8(a)902.9Females26.9(a)1 561.726.5(a)1 289.530.2(a)1 756.228.8(a)1 397.3Males
Sex
37.3(a)73.6*23.3*(a)25.935.7(a)70.328.5(a)31.665–7434.6(a)169.633.6(a)78.632.9(a)161.332.9(a)76.960–6430.7(a)273.331.0(a)142.229.0(a)258.033.0(a)151.855–5927.6301.532.4240.728.1(a)307.229.9(a)222.350–5423.7284.826.6273.524.5294.226.4271.645–4925.7644.424.3531.626.7(a)668.823.0(a)501.835–4424.0555.025.3544.228.1649.225.6550.325–3426.5298.826.0270.226.6300.126.5275.620–2433.6264.333.0231.936.5287.031.1218.415–19
Age group (years)
LE V E L 2
%'000%'000%'000%'000
2006199620061996
DOCUMENT LITERACY SCALEPROSE LITERACY SCALE
SKILL LEVEL OF EMPLOYED PEOPLE, Prose and Document l i te racy sca le by Selec ted
charac te r i s t i cs—1996 and 2006 co n t i n u e d16
44 A B S • A D U L T L I T E R A C Y A N D L I F E SK I L L S SU R V E Y , SU M M A R Y R E S U L T S • 4 2 2 8 . 0 • 2 0 0 6 ( R E I S S U E )
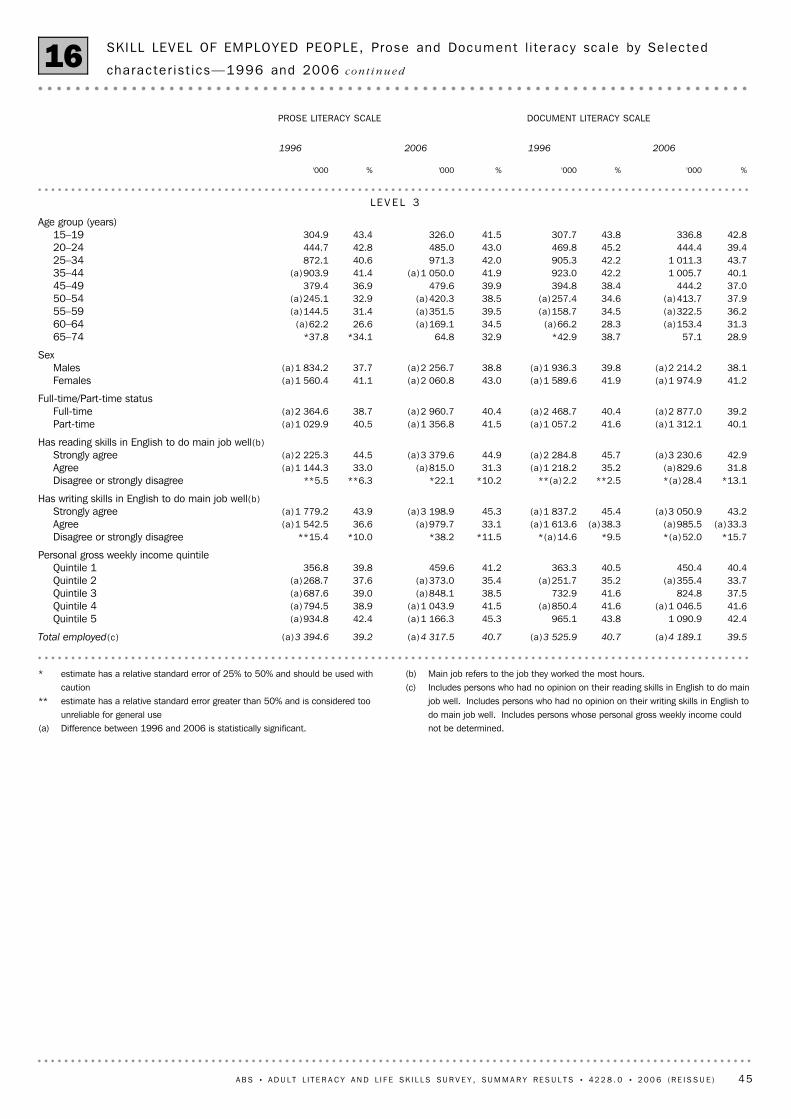
(b) Main job refers to the job they worked the most hours.(c) Includes persons who had no opinion on their reading skills in English to do main
job well. Includes persons who had no opinion on their writing skills in English todo main job well. Includes persons whose personal gross weekly income couldnot be determined.
* estimate has a relative standard error of 25% to 50% and should be used withcaution
** estimate has a relative standard error greater than 50% and is considered toounreliable for general use
(a) Difference between 1996 and 2006 is statistically significant.
39.5(a)4 189.140.7(a)3 525.940.7(a)4 317.539.2(a)3 394.6Total employed(c)
42.41 090.943.8965.145.3(a)1 166.342.4(a)934.8Quintile 541.6(a)1 046.541.6(a)850.441.5(a)1 043.938.9(a)794.5Quintile 437.5824.841.6732.938.5(a)848.139.0(a)687.6Quintile 333.7(a)355.435.2(a)251.735.4(a)373.037.6(a)268.7Quintile 240.4450.440.5363.341.2459.639.8356.8Quintile 1
Personal gross weekly income quintile
*15.7*(a)52.0*9.5*(a)14.6*11.5*38.2*10.0**15.4Disagree or strongly disagree(a)33.3(a)985.5(a)38.3(a)1 613.633.1(a)979.736.6(a)1 542.5Agree
43.2(a)3 050.945.4(a)1 837.245.3(a)3 198.943.9(a)1 779.2Strongly agreeHas writing skills in English to do main job well(b)
*13.1*(a)28.4**2.5**(a)2.2*10.2*22.1**6.3**5.5Disagree or strongly disagree31.8(a)829.635.2(a)1 218.231.3(a)815.033.0(a)1 144.3Agree42.9(a)3 230.645.7(a)2 284.844.9(a)3 379.644.5(a)2 225.3Strongly agree
Has reading skills in English to do main job well(b)
40.1(a)1 312.141.6(a)1 057.241.5(a)1 356.840.5(a)1 029.9Part-time39.2(a)2 877.040.4(a)2 468.740.4(a)2 960.738.7(a)2 364.6Full-time
Full-time/Part-time status
41.2(a)1 974.941.9(a)1 589.643.0(a)2 060.841.1(a)1 560.4Females38.1(a)2 214.239.8(a)1 936.338.8(a)2 256.737.7(a)1 834.2Males
Sex
28.957.138.7*42.932.964.8*34.1*37.865–7431.3(a)153.428.3(a)66.234.5(a)169.126.6(a)62.260–6436.2(a)322.534.5(a)158.739.5(a)351.531.4(a)144.555–5937.9(a)413.734.6(a)257.438.5(a)420.332.9(a)245.150–5437.0444.238.4394.839.9479.636.9379.445–4940.11 005.742.2923.041.9(a)1 050.041.4(a)903.935–4443.71 011.342.2905.342.0971.340.6872.125–3439.4444.445.2469.843.0485.042.8444.720–2442.8336.843.8307.741.5326.043.4304.915–19
Age group (years)
LE V E L 3
%'000%'000%'000%'000
2006199620061996
DOCUMENT LITERACY SCALEPROSE LITERACY SCALE
SKILL LEVEL OF EMPLOYED PEOPLE, Prose and Document l i te racy sca le by Selec ted
charac te r i s t i cs—1996 and 2006 co n t i n u e d16
A B S • A D U L T L I T E R A C Y A N D L I F E SK I L L S SU R V E Y , SU M M A R Y R E S U L T S • 4 2 2 8 . 0 • 2 0 0 6 ( R E I S S U E ) 45
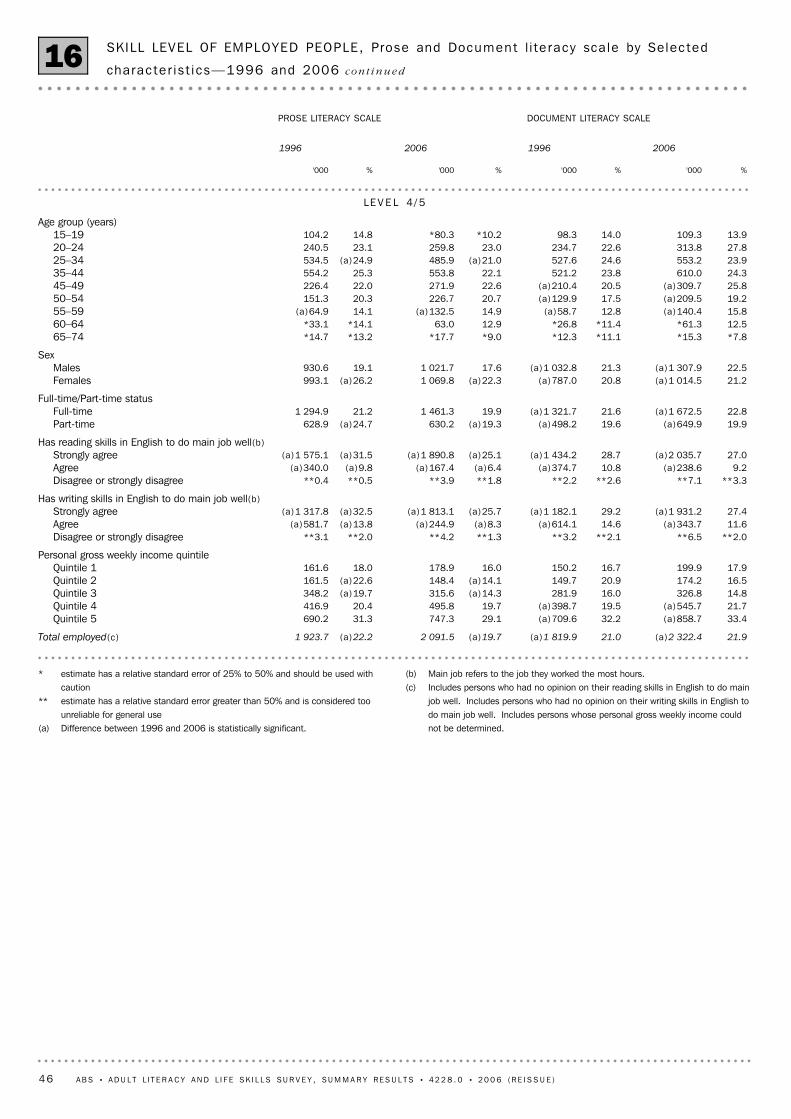
(b) Main job refers to the job they worked the most hours.(c) Includes persons who had no opinion on their reading skills in English to do main
job well. Includes persons who had no opinion on their writing skills in English todo main job well. Includes persons whose personal gross weekly income couldnot be determined.
* estimate has a relative standard error of 25% to 50% and should be used withcaution
** estimate has a relative standard error greater than 50% and is considered toounreliable for general use
(a) Difference between 1996 and 2006 is statistically significant.
21.9(a)2 322.421.0(a)1 819.9(a)19.72 091.5(a)22.21 923.7Total employed(c)
33.4(a)858.732.2(a)709.629.1747.331.3690.2Quintile 521.7(a)545.719.5(a)398.719.7495.820.4416.9Quintile 414.8326.816.0281.9(a)14.3315.6(a)19.7348.2Quintile 316.5174.220.9149.7(a)14.1148.4(a)22.6161.5Quintile 217.9199.916.7150.216.0178.918.0161.6Quintile 1
Personal gross weekly income quintile
**2.0**6.5**2.1**3.2**1.3**4.2**2.0**3.1Disagree or strongly disagree11.6(a)343.714.6(a)614.1(a)8.3(a)244.9(a)13.8(a)581.7Agree27.4(a)1 931.229.2(a)1 182.1(a)25.7(a)1 813.1(a)32.5(a)1 317.8Strongly agree
Has writing skills in English to do main job well(b)
**3.3**7.1**2.6**2.2**1.8**3.9**0.5**0.4Disagree or strongly disagree9.2(a)238.610.8(a)374.7(a)6.4(a)167.4(a)9.8(a)340.0Agree
27.0(a)2 035.728.7(a)1 434.2(a)25.1(a)1 890.8(a)31.5(a)1 575.1Strongly agreeHas reading skills in English to do main job well(b)
19.9(a)649.919.6(a)498.2(a)19.3630.2(a)24.7628.9Part-time22.8(a)1 672.521.6(a)1 321.719.91 461.321.21 294.9Full-time
Full-time/Part-time status
21.2(a)1 014.520.8(a)787.0(a)22.31 069.8(a)26.2993.1Females22.5(a)1 307.921.3(a)1 032.817.61 021.719.1930.6Males
Sex
*7.8*15.3*11.1*12.3*9.0*17.7*13.2*14.765–7412.5*61.3*11.4*26.812.963.0*14.1*33.160–6415.8(a)140.412.8(a)58.714.9(a)132.514.1(a)64.955–5919.2(a)209.517.5(a)129.920.7226.720.3151.350–5425.8(a)309.720.5(a)210.422.6271.922.0226.445–4924.3610.023.8521.222.1553.825.3554.235–4423.9553.224.6527.6(a)21.0485.9(a)24.9534.525–3427.8313.822.6234.723.0259.823.1240.520–2413.9109.314.098.3*10.2*80.314.8104.215–19
Age group (years)
LE V E L 4 / 5
%'000%'000%'000%'000
2006199620061996
DOCUMENT LITERACY SCALEPROSE LITERACY SCALE
SKILL LEVEL OF EMPLOYED PEOPLE, Prose and Document l i te racy sca le by Selec ted
charac te r i s t i cs—1996 and 2006 co n t i n u e d16
46 A B S • A D U L T L I T E R A C Y A N D L I F E SK I L L S SU R V E Y , SU M M A R Y R E S U L T S • 4 2 2 8 . 0 • 2 0 0 6 ( R E I S S U E )
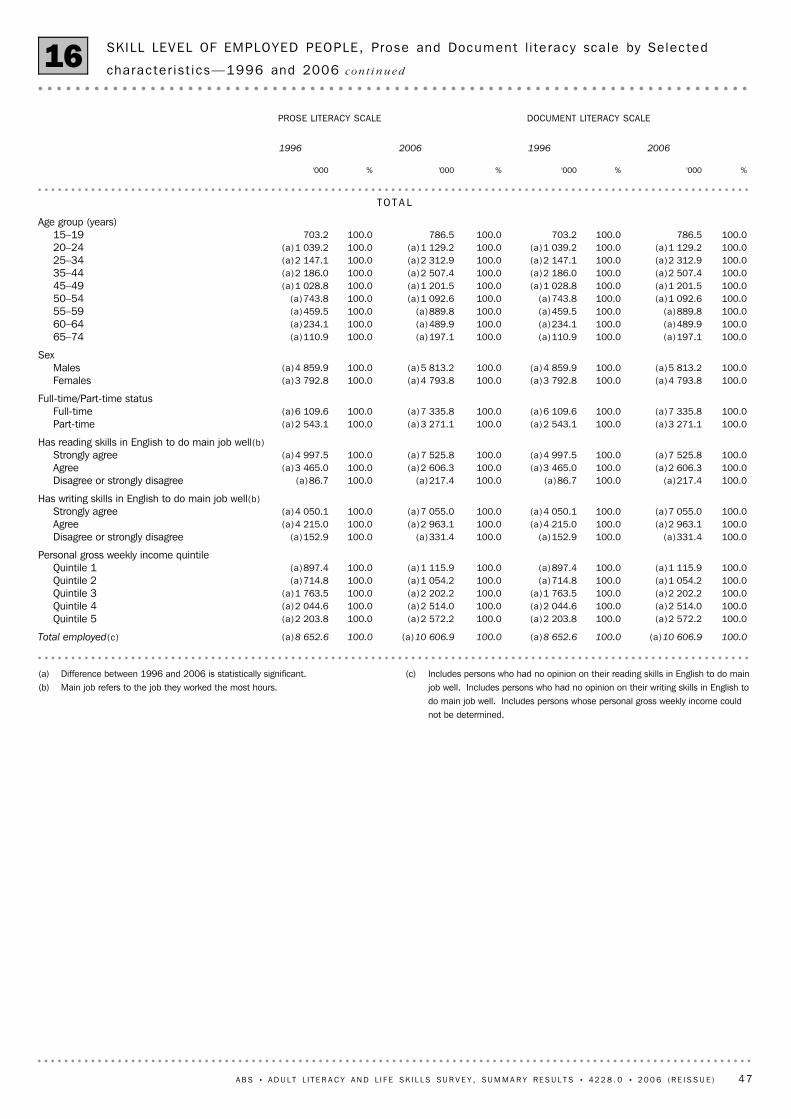
(c) Includes persons who had no opinion on their reading skills in English to do mainjob well. Includes persons who had no opinion on their writing skills in English todo main job well. Includes persons whose personal gross weekly income couldnot be determined.
(a) Difference between 1996 and 2006 is statistically significant.(b) Main job refers to the job they worked the most hours.
100.0(a)10 606.9100.0(a)8 652.6100.0(a)10 606.9100.0(a)8 652.6Total employed(c)
100.0(a)2 572.2100.0(a)2 203.8100.0(a)2 572.2100.0(a)2 203.8Quintile 5100.0(a)2 514.0100.0(a)2 044.6100.0(a)2 514.0100.0(a)2 044.6Quintile 4100.0(a)2 202.2100.0(a)1 763.5100.0(a)2 202.2100.0(a)1 763.5Quintile 3100.0(a)1 054.2100.0(a)714.8100.0(a)1 054.2100.0(a)714.8Quintile 2100.0(a)1 115.9100.0(a)897.4100.0(a)1 115.9100.0(a)897.4Quintile 1
Personal gross weekly income quintile
100.0(a)331.4100.0(a)152.9100.0(a)331.4100.0(a)152.9Disagree or strongly disagree100.0(a)2 963.1100.0(a)4 215.0100.0(a)2 963.1100.0(a)4 215.0Agree100.0(a)7 055.0100.0(a)4 050.1100.0(a)7 055.0100.0(a)4 050.1Strongly agree
Has writing skills in English to do main job well(b)
100.0(a)217.4100.0(a)86.7100.0(a)217.4100.0(a)86.7Disagree or strongly disagree100.0(a)2 606.3100.0(a)3 465.0100.0(a)2 606.3100.0(a)3 465.0Agree100.0(a)7 525.8100.0(a)4 997.5100.0(a)7 525.8100.0(a)4 997.5Strongly agree
Has reading skills in English to do main job well(b)
100.0(a)3 271.1100.0(a)2 543.1100.0(a)3 271.1100.0(a)2 543.1Part-time100.0(a)7 335.8100.0(a)6 109.6100.0(a)7 335.8100.0(a)6 109.6Full-time
Full-time/Part-time status
100.0(a)4 793.8100.0(a)3 792.8100.0(a)4 793.8100.0(a)3 792.8Females100.0(a)5 813.2100.0(a)4 859.9100.0(a)5 813.2100.0(a)4 859.9Males
Sex
100.0(a)197.1100.0(a)110.9100.0(a)197.1100.0(a)110.965–74100.0(a)489.9100.0(a)234.1100.0(a)489.9100.0(a)234.160–64100.0(a)889.8100.0(a)459.5100.0(a)889.8100.0(a)459.555–59100.0(a)1 092.6100.0(a)743.8100.0(a)1 092.6100.0(a)743.850–54100.0(a)1 201.5100.0(a)1 028.8100.0(a)1 201.5100.0(a)1 028.845–49100.0(a)2 507.4100.0(a)2 186.0100.0(a)2 507.4100.0(a)2 186.035–44100.0(a)2 312.9100.0(a)2 147.1100.0(a)2 312.9100.0(a)2 147.125–34100.0(a)1 129.2100.0(a)1 039.2100.0(a)1 129.2100.0(a)1 039.220–24100.0786.5100.0703.2100.0786.5100.0703.215–19
Age group (years)
TO T A L
%'000%'000%'000%'000
2006199620061996
DOCUMENT LITERACY SCALEPROSE LITERACY SCALE
SKILL LEVEL OF EMPLOYED PEOPLE, Prose and Document l i te racy sca le by Selec ted
charac te r i s t i cs—1996 and 2006 co n t i n u e d16
A B S • A D U L T L I T E R A C Y A N D L I F E SK I L L S SU R V E Y , SU M M A R Y R E S U L T S • 4 2 2 8 . 0 • 2 0 0 6 ( R E I S S U E ) 47
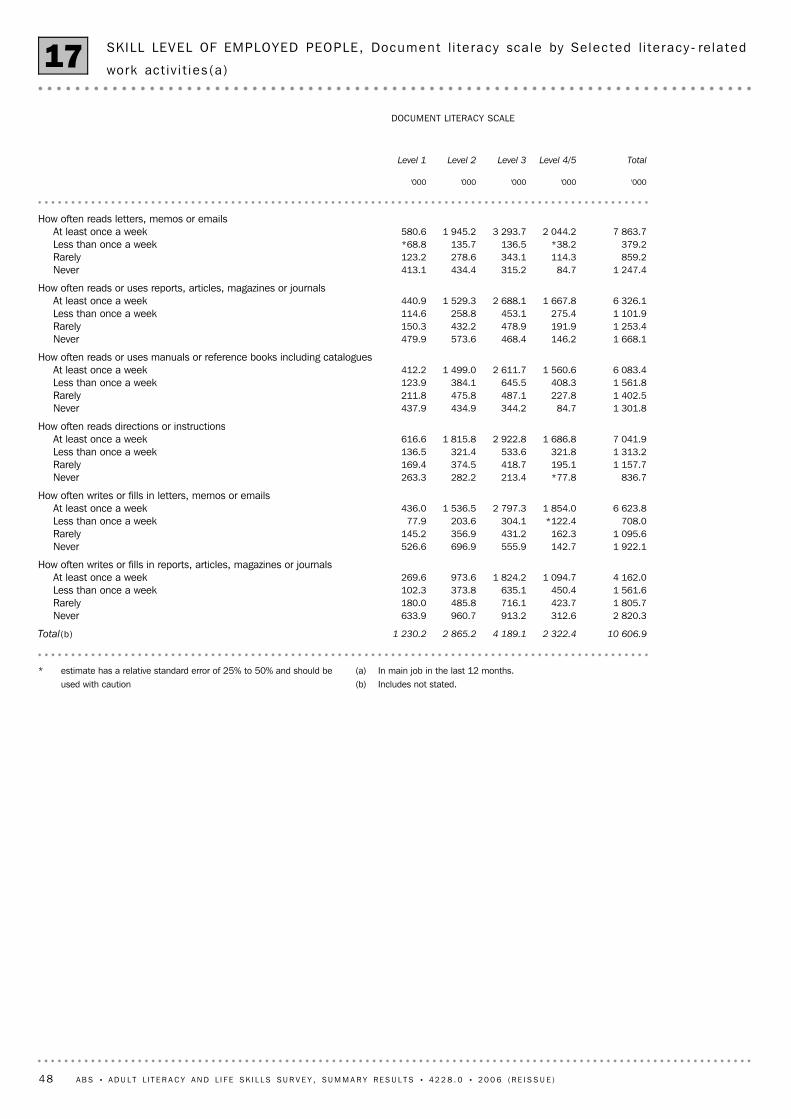
(a) In main job in the last 12 months.(b) Includes not stated.
* estimate has a relative standard error of 25% to 50% and should beused with caution
10 606.92 322.44 189.12 865.21 230.2Total(b)
2 820.3312.6913.2960.7633.9Never1 805.7423.7716.1485.8180.0Rarely1 561.6450.4635.1373.8102.3Less than once a week4 162.01 094.71 824.2973.6269.6At least once a week
How often writes or fills in reports, articles, magazines or journals
1 922.1142.7555.9696.9526.6Never1 095.6162.3431.2356.9145.2Rarely
708.0*122.4304.1203.677.9Less than once a week6 623.81 854.02 797.31 536.5436.0At least once a week
How often writes or fills in letters, memos or emails
836.7*77.8213.4282.2263.3Never1 157.7195.1418.7374.5169.4Rarely1 313.2321.8533.6321.4136.5Less than once a week7 041.91 686.82 922.81 815.8616.6At least once a week
How often reads directions or instructions
1 301.884.7344.2434.9437.9Never1 402.5227.8487.1475.8211.8Rarely1 561.8408.3645.5384.1123.9Less than once a week6 083.41 560.62 611.71 499.0412.2At least once a week
How often reads or uses manuals or reference books including catalogues
1 668.1146.2468.4573.6479.9Never1 253.4191.9478.9432.2150.3Rarely1 101.9275.4453.1258.8114.6Less than once a week6 326.11 667.82 688.11 529.3440.9At least once a week
How often reads or uses reports, articles, magazines or journals
1 247.484.7315.2434.4413.1Never859.2114.3343.1278.6123.2Rarely379.2*38.2136.5135.7*68.8Less than once a week
7 863.72 044.23 293.71 945.2580.6At least once a weekHow often reads letters, memos or emails
'000'000'000'000'000
Level 4/5Level 3Level 2Level 1 Total
DOCUMENT LITERACY SCALE
SKILL LEVEL OF EMPLOYED PEOPLE, Document l i te racy sca le by Selec ted l i te racy - re la ted
work act i v i t i es (a )17
48 A B S • A D U L T L I T E R A C Y A N D L I F E SK I L L S SU R V E Y , SU M M A R Y R E S U L T S • 4 2 2 8 . 0 • 2 0 0 6 ( R E I S S U E )
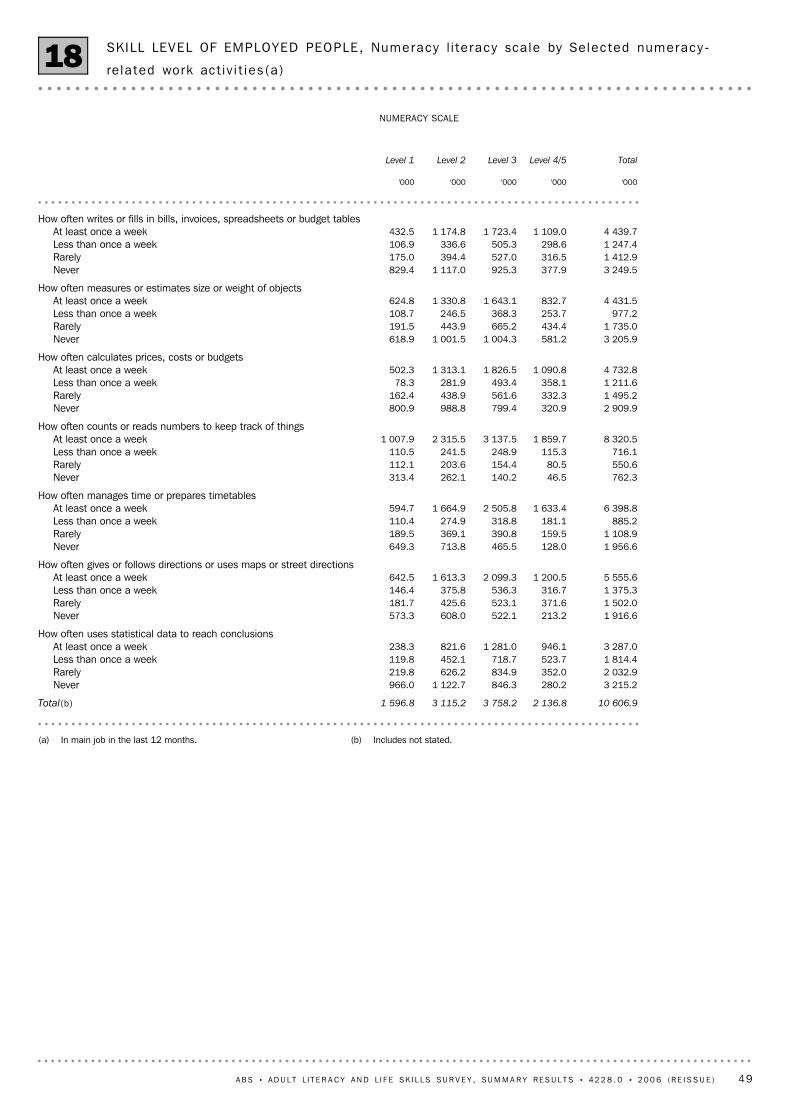
(b) Includes not stated.(a) In main job in the last 12 months.
10 606.92 136.83 758.23 115.21 596.8Total(b)
3 215.2280.2846.31 122.7966.0Never2 032.9352.0834.9626.2219.8Rarely1 814.4523.7718.7452.1119.8Less than once a week3 287.0946.11 281.0821.6238.3At least once a week
How often uses statistical data to reach conclusions
1 916.6213.2522.1608.0573.3Never1 502.0371.6523.1425.6181.7Rarely1 375.3316.7536.3375.8146.4Less than once a week5 555.61 200.52 099.31 613.3642.5At least once a week
How often gives or follows directions or uses maps or street directions
1 956.6128.0465.5713.8649.3Never1 108.9159.5390.8369.1189.5Rarely
885.2181.1318.8274.9110.4Less than once a week6 398.81 633.42 505.81 664.9594.7At least once a week
How often manages time or prepares timetables
762.346.5140.2262.1313.4Never550.680.5154.4203.6112.1Rarely716.1115.3248.9241.5110.5Less than once a week
8 320.51 859.73 137.52 315.51 007.9At least once a weekHow often counts or reads numbers to keep track of things
2 909.9320.9799.4988.8800.9Never1 495.2332.3561.6438.9162.4Rarely1 211.6358.1493.4281.978.3Less than once a week4 732.81 090.81 826.51 313.1502.3At least once a week
How often calculates prices, costs or budgets
3 205.9581.21 004.31 001.5618.9Never1 735.0434.4665.2443.9191.5Rarely
977.2253.7368.3246.5108.7Less than once a week4 431.5832.71 643.11 330.8624.8At least once a week
How often measures or estimates size or weight of objects
3 249.5377.9925.31 117.0829.4Never1 412.9316.5527.0394.4175.0Rarely1 247.4298.6505.3336.6106.9Less than once a week4 439.71 109.01 723.41 174.8432.5At least once a week
How often writes or fills in bills, invoices, spreadsheets or budget tables
'000'000'000'000'000
Level 4/5Level 3Level 2Level 1 Total
NUMERACY SCALE
SKILL LEVEL OF EMPLOYED PEOPLE, Numeracy l i te racy sca le by Selec ted numeracy-
re la ted work act i v i t i es (a )18
A B S • A D U L T L I T E R A C Y A N D L I F E SK I L L S SU R V E Y , SU M M A R Y R E S U L T S • 4 2 2 8 . 0 • 2 0 0 6 ( R E I S S U E ) 49
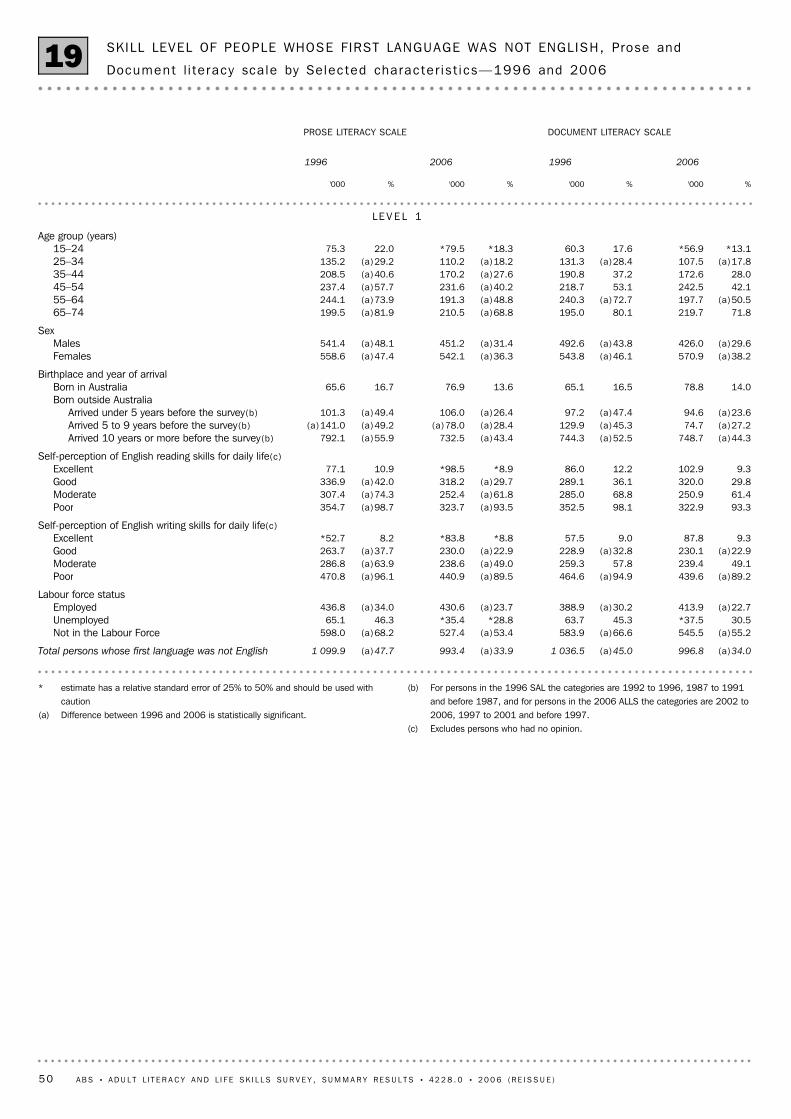
(b) For persons in the 1996 SAL the categories are 1992 to 1996, 1987 to 1991and before 1987, and for persons in the 2006 ALLS the categories are 2002 to2006, 1997 to 2001 and before 1997.
(c) Excludes persons who had no opinion.
* estimate has a relative standard error of 25% to 50% and should be used withcaution
(a) Difference between 1996 and 2006 is statistically significant.
(a)34.0996.8(a)45.01 036.5(a)33.9993.4(a)47.71 099.9Total persons whose first language was not English
(a)55.2545.5(a)66.6583.9(a)53.4527.4(a)68.2598.0Not in the Labour Force30.5*37.545.363.7*28.8*35.446.365.1Unemployed
(a)22.7413.9(a)30.2388.9(a)23.7430.6(a)34.0436.8EmployedLabour force status
(a)89.2439.6(a)94.9464.6(a)89.5440.9(a)96.1470.8Poor49.1239.457.8259.3(a)49.0238.6(a)63.9286.8Moderate
(a)22.9230.1(a)32.8228.9(a)22.9230.0(a)37.7263.7Good9.387.89.057.5*8.8*83.88.2*52.7Excellent
Self-perception of English writing skills for daily life(c)
93.3322.998.1352.5(a)93.5323.7(a)98.7354.7Poor61.4250.968.8285.0(a)61.8252.4(a)74.3307.4Moderate29.8320.036.1289.1(a)29.7318.2(a)42.0336.9Good
9.3102.912.286.0*8.9*98.510.977.1ExcellentSelf-perception of English reading skills for daily life(c)
(a)44.3748.7(a)52.5744.3(a)43.4732.5(a)55.9792.1Arrived 10 years or more before the survey(b)(a)27.274.7(a)45.3129.9(a)28.4(a)78.0(a)49.2(a)141.0Arrived 5 to 9 years before the survey(b)(a)23.694.6(a)47.497.2(a)26.4106.0(a)49.4101.3Arrived under 5 years before the survey(b)
Born outside Australia14.078.816.565.113.676.916.765.6Born in Australia
Birthplace and year of arrival
(a)38.2570.9(a)46.1543.8(a)36.3542.1(a)47.4558.6Females(a)29.6426.0(a)43.8492.6(a)31.4451.2(a)48.1541.4Males
Sex
71.8219.780.1195.0(a)68.8210.5(a)81.9199.565–74(a)50.5197.7(a)72.7240.3(a)48.8191.3(a)73.9244.155–64
42.1242.553.1218.7(a)40.2231.6(a)57.7237.445–5428.0172.637.2190.8(a)27.6170.2(a)40.6208.535–44
(a)17.8107.5(a)28.4131.3(a)18.2110.2(a)29.2135.225–34*13.1*56.917.660.3*18.3*79.522.075.315–24
Age group (years)
LE V E L 1
%'000%'000%'000%'000
2006199620061996
DOCUMENT LITERACY SCALEPROSE LITERACY SCALE
SKILL LEVEL OF PEOPLE WHOSE FIRST LANGUAGE WAS NOT ENGL ISH, Prose and
Document l i te racy sca le by Selec ted charac te r i s t i cs—1996 and 200619
50 A B S • A D U L T L I T E R A C Y A N D L I F E SK I L L S SU R V E Y , SU M M A R Y R E S U L T S • 4 2 2 8 . 0 • 2 0 0 6 ( R E I S S U E )
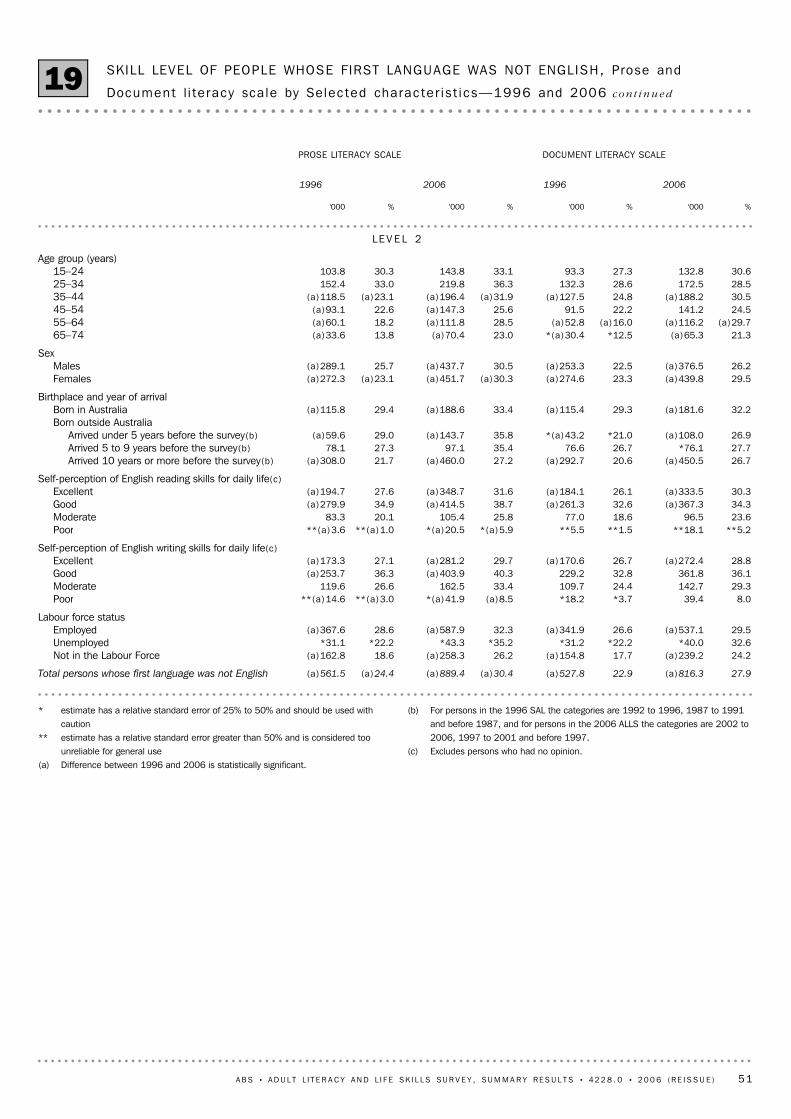
(b) For persons in the 1996 SAL the categories are 1992 to 1996, 1987 to 1991and before 1987, and for persons in the 2006 ALLS the categories are 2002 to2006, 1997 to 2001 and before 1997.
(c) Excludes persons who had no opinion.
* estimate has a relative standard error of 25% to 50% and should be used withcaution
** estimate has a relative standard error greater than 50% and is considered toounreliable for general use
(a) Difference between 1996 and 2006 is statistically significant.
27.9(a)816.322.9(a)527.8(a)30.4(a)889.4(a)24.4(a)561.5Total persons whose first language was not English
24.2(a)239.217.7(a)154.826.2(a)258.318.6(a)162.8Not in the Labour Force32.6*40.0*22.2*31.2*35.2*43.3*22.2*31.1Unemployed29.5(a)537.126.6(a)341.932.3(a)587.928.6(a)367.6Employed
Labour force status
8.039.4*3.7*18.2(a)8.5*(a)41.9**(a)3.0**(a)14.6Poor29.3142.724.4109.733.4162.526.6119.6Moderate36.1361.832.8229.240.3(a)403.936.3(a)253.7Good28.8(a)272.426.7(a)170.629.7(a)281.227.1(a)173.3Excellent
Self-perception of English writing skills for daily life(c)
**5.2**18.1**1.5**5.5*(a)5.9*(a)20.5**(a)1.0**(a)3.6Poor23.696.518.677.025.8105.420.183.3Moderate34.3(a)367.332.6(a)261.338.7(a)414.534.9(a)279.9Good30.3(a)333.526.1(a)184.131.6(a)348.727.6(a)194.7Excellent
Self-perception of English reading skills for daily life(c)
26.7(a)450.520.6(a)292.727.2(a)460.021.7(a)308.0Arrived 10 years or more before the survey(b)27.7*76.126.776.635.497.127.378.1Arrived 5 to 9 years before the survey(b)26.9(a)108.0*21.0*(a)43.235.8(a)143.729.0(a)59.6Arrived under 5 years before the survey(b)
Born outside Australia32.2(a)181.629.3(a)115.433.4(a)188.629.4(a)115.8Born in Australia
Birthplace and year of arrival
29.5(a)439.823.3(a)274.6(a)30.3(a)451.7(a)23.1(a)272.3Females26.2(a)376.522.5(a)253.330.5(a)437.725.7(a)289.1Males
Sex
21.3(a)65.3*12.5*(a)30.423.0(a)70.413.8(a)33.665–74(a)29.7(a)116.2(a)16.0(a)52.828.5(a)111.818.2(a)60.155–64
24.5141.222.291.525.6(a)147.322.6(a)93.145–5430.5(a)188.224.8(a)127.5(a)31.9(a)196.4(a)23.1(a)118.535–4428.5172.528.6132.336.3219.833.0152.425–3430.6132.827.393.333.1143.830.3103.815–24
Age group (years)
LE V E L 2
%'000%'000%'000%'000
2006199620061996
DOCUMENT LITERACY SCALEPROSE LITERACY SCALE
SKILL LEVEL OF PEOPLE WHOSE FIRST LANGUAGE WAS NOT ENGL ISH, Prose and
Document l i te racy sca le by Selec ted charac te r i s t i cs—1996 and 2006 co n t i n u e d19
A B S • A D U L T L I T E R A C Y A N D L I F E SK I L L S SU R V E Y , SU M M A R Y R E S U L T S • 4 2 2 8 . 0 • 2 0 0 6 ( R E I S S U E ) 51
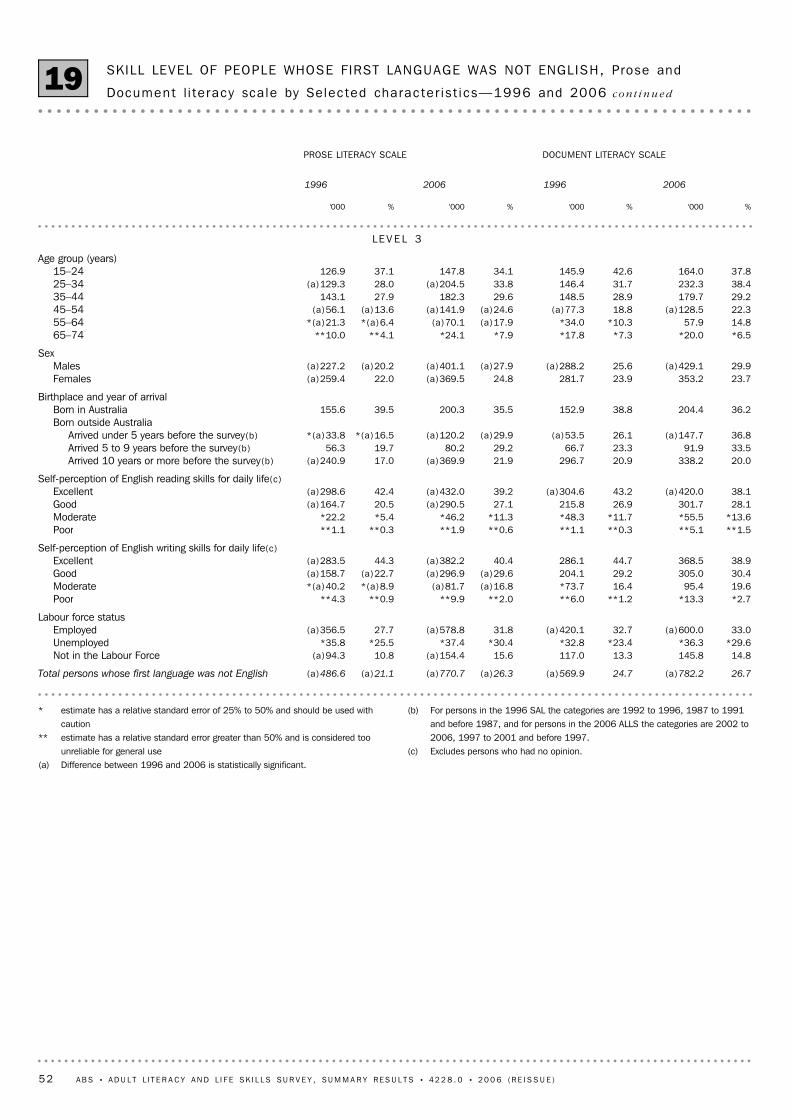
(b) For persons in the 1996 SAL the categories are 1992 to 1996, 1987 to 1991and before 1987, and for persons in the 2006 ALLS the categories are 2002 to2006, 1997 to 2001 and before 1997.
(c) Excludes persons who had no opinion.
* estimate has a relative standard error of 25% to 50% and should be used withcaution
** estimate has a relative standard error greater than 50% and is considered toounreliable for general use
(a) Difference between 1996 and 2006 is statistically significant.
26.7(a)782.224.7(a)569.9(a)26.3(a)770.7(a)21.1(a)486.6Total persons whose first language was not English
14.8145.813.3117.015.6(a)154.410.8(a)94.3Not in the Labour Force*29.6*36.3*23.4*32.8*30.4*37.4*25.5*35.8Unemployed33.0(a)600.032.7(a)420.131.8(a)578.827.7(a)356.5Employed
Labour force status
*2.7*13.3**1.2**6.0**2.0**9.9**0.9**4.3Poor19.695.416.4*73.7(a)16.8(a)81.7*(a)8.9*(a)40.2Moderate30.4305.029.2204.1(a)29.6(a)296.9(a)22.7(a)158.7Good38.9368.544.7286.140.4(a)382.244.3(a)283.5Excellent
Self-perception of English writing skills for daily life(c)
**1.5**5.1**0.3**1.1**0.6**1.9**0.3**1.1Poor*13.6*55.5*11.7*48.3*11.3*46.2*5.4*22.2Moderate28.1301.726.9215.827.1(a)290.520.5(a)164.7Good38.1(a)420.043.2(a)304.639.2(a)432.042.4(a)298.6Excellent
Self-perception of English reading skills for daily life(c)
20.0338.220.9296.721.9(a)369.917.0(a)240.9Arrived 10 years or more before the survey(b)33.591.923.366.729.280.219.756.3Arrived 5 to 9 years before the survey(b)36.8(a)147.726.1(a)53.5(a)29.9(a)120.2*(a)16.5*(a)33.8Arrived under 5 years before the survey(b)
Born outside Australia36.2204.438.8152.935.5200.339.5155.6Born in Australia
Birthplace and year of arrival
23.7353.223.9281.724.8(a)369.522.0(a)259.4Females29.9(a)429.125.6(a)288.2(a)27.9(a)401.1(a)20.2(a)227.2Males
Sex
*6.5*20.0*7.3*17.8*7.9*24.1**4.1**10.065–7414.857.9*10.3*34.0(a)17.9(a)70.1*(a)6.4*(a)21.355–6422.3(a)128.518.8(a)77.3(a)24.6(a)141.9(a)13.6(a)56.145–5429.2179.728.9148.529.6182.327.9143.135–4438.4232.331.7146.433.8(a)204.528.0(a)129.325–3437.8164.042.6145.934.1147.837.1126.915–24
Age group (years)
LE V E L 3
%'000%'000%'000%'000
2006199620061996
DOCUMENT LITERACY SCALEPROSE LITERACY SCALE
SKILL LEVEL OF PEOPLE WHOSE FIRST LANGUAGE WAS NOT ENGL ISH, Prose and
Document l i te racy sca le by Selec ted charac te r i s t i cs—1996 and 2006 co n t i n u e d19
52 A B S • A D U L T L I T E R A C Y A N D L I F E SK I L L S SU R V E Y , SU M M A R Y R E S U L T S • 4 2 2 8 . 0 • 2 0 0 6 ( R E I S S U E )
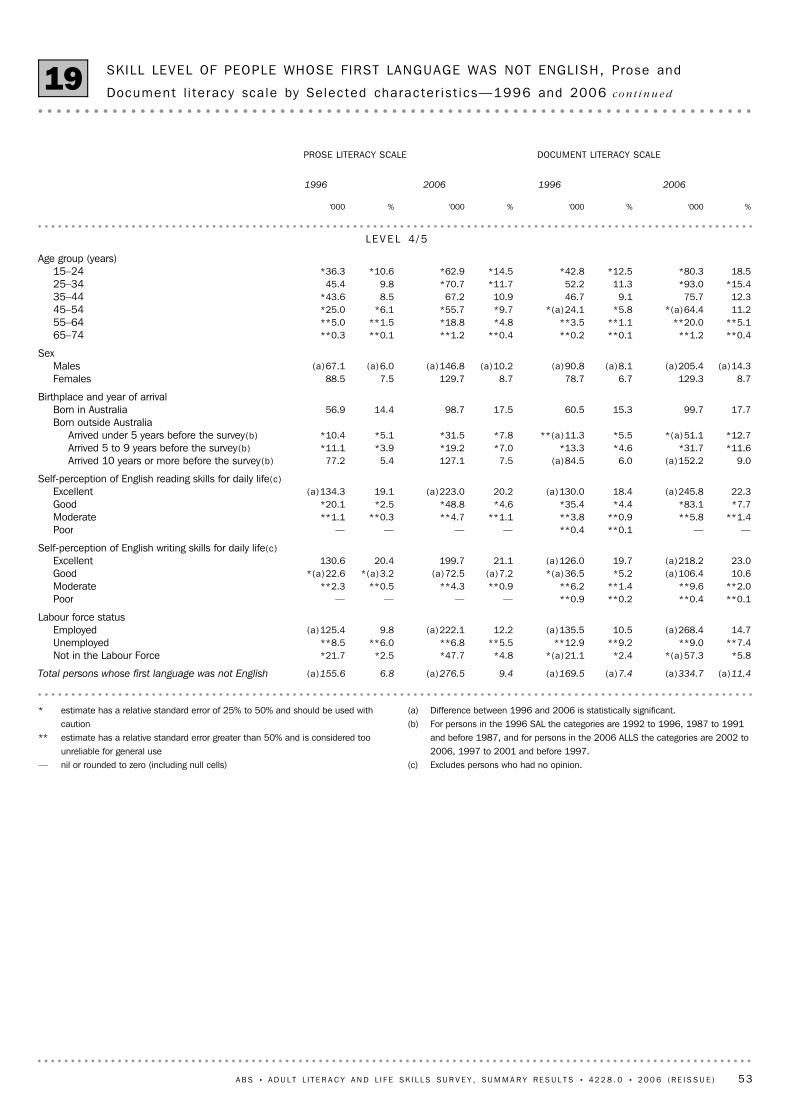
(a) Difference between 1996 and 2006 is statistically significant.(b) For persons in the 1996 SAL the categories are 1992 to 1996, 1987 to 1991
and before 1987, and for persons in the 2006 ALLS the categories are 2002 to2006, 1997 to 2001 and before 1997.
(c) Excludes persons who had no opinion.
* estimate has a relative standard error of 25% to 50% and should be used withcaution
** estimate has a relative standard error greater than 50% and is considered toounreliable for general use
— nil or rounded to zero (including null cells)
(a)11.4(a)334.7(a)7.4(a)169.59.4(a)276.56.8(a)155.6Total persons whose first language was not English
*5.8*(a)57.3*2.4*(a)21.1*4.8*47.7*2.5*21.7Not in the Labour Force**7.4**9.0**9.2**12.9**5.5**6.8**6.0**8.5Unemployed14.7(a)268.410.5(a)135.512.2(a)222.19.8(a)125.4Employed
Labour force status
**0.1**0.4**0.2**0.9————Poor**2.0**9.6**1.4**6.2**0.9**4.3**0.5**2.3Moderate10.6(a)106.4*5.2*(a)36.5(a)7.2(a)72.5*(a)3.2*(a)22.6Good23.0(a)218.219.7(a)126.021.1199.720.4130.6Excellent
Self-perception of English writing skills for daily life(c)
——**0.1**0.4————Poor**1.4**5.8**0.9**3.8**1.1**4.7**0.3**1.1Moderate*7.7*83.1*4.4*35.4*4.6*48.8*2.5*20.1Good22.3(a)245.818.4(a)130.020.2(a)223.019.1(a)134.3Excellent
Self-perception of English reading skills for daily life(c)
9.0(a)152.26.0(a)84.57.5127.15.477.2Arrived 10 years or more before the survey(b)*11.6*31.7*4.6*13.3*7.0*19.2*3.9*11.1Arrived 5 to 9 years before the survey(b)*12.7*(a)51.1*5.5**(a)11.3*7.8*31.5*5.1*10.4Arrived under 5 years before the survey(b)
Born outside Australia17.799.715.360.517.598.714.456.9Born in Australia
Birthplace and year of arrival
8.7129.36.778.78.7129.77.588.5Females(a)14.3(a)205.4(a)8.1(a)90.8(a)10.2(a)146.8(a)6.0(a)67.1Males
Sex
**0.4**1.2**0.1**0.2**0.4**1.2**0.1**0.365–74**5.1**20.0**1.1**3.5*4.8*18.8**1.5**5.055–6411.2*(a)64.4*5.8*(a)24.1*9.7*55.7*6.1*25.045–5412.375.79.146.710.967.28.5*43.635–44
*15.4*93.011.352.2*11.7*70.79.845.425–3418.5*80.3*12.5*42.8*14.5*62.9*10.6*36.315–24
Age group (years)
LE V E L 4 / 5
%'000%'000%'000%'000
2006199620061996
DOCUMENT LITERACY SCALEPROSE LITERACY SCALE
SKILL LEVEL OF PEOPLE WHOSE FIRST LANGUAGE WAS NOT ENGL ISH, Prose and
Document l i te racy sca le by Selec ted charac te r i s t i cs—1996 and 2006 co n t i n u e d19
A B S • A D U L T L I T E R A C Y A N D L I F E SK I L L S SU R V E Y , SU M M A R Y R E S U L T S • 4 2 2 8 . 0 • 2 0 0 6 ( R E I S S U E ) 53
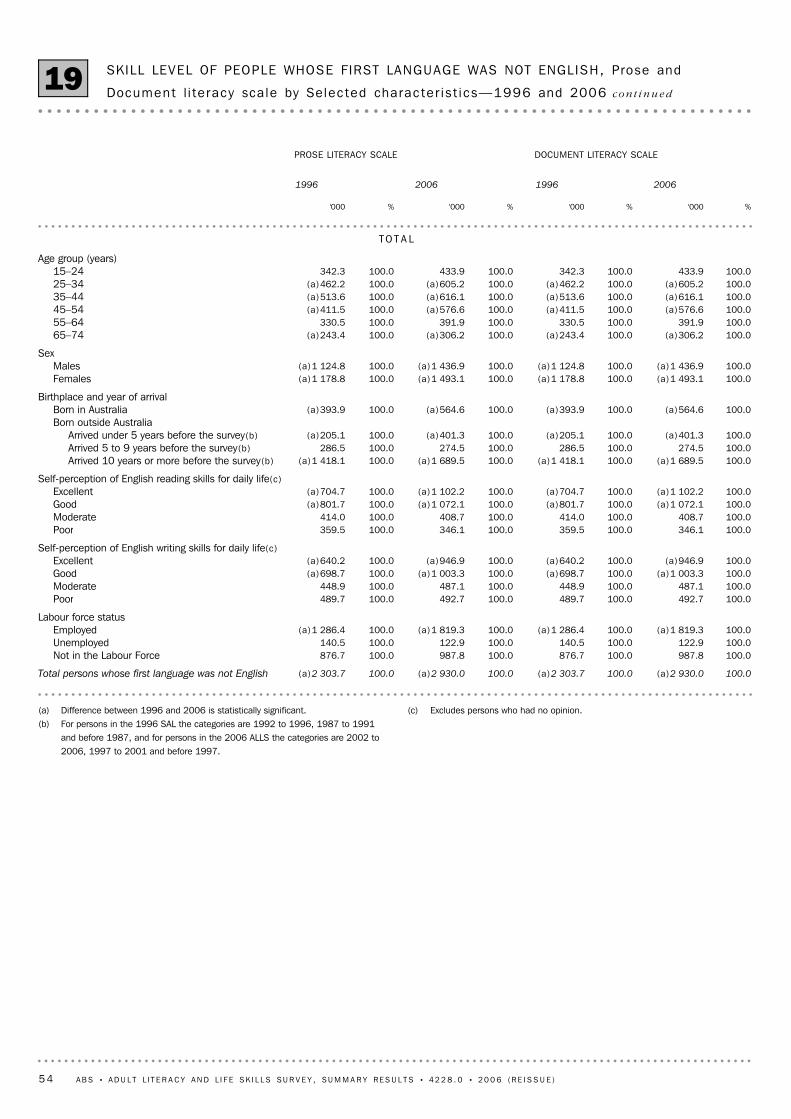
(c) Excludes persons who had no opinion.(a) Difference between 1996 and 2006 is statistically significant.(b) For persons in the 1996 SAL the categories are 1992 to 1996, 1987 to 1991
and before 1987, and for persons in the 2006 ALLS the categories are 2002 to2006, 1997 to 2001 and before 1997.
100.0(a)2 930.0100.0(a)2 303.7100.0(a)2 930.0100.0(a)2 303.7Total persons whose first language was not English
100.0987.8100.0876.7100.0987.8100.0876.7Not in the Labour Force100.0122.9100.0140.5100.0122.9100.0140.5Unemployed100.0(a)1 819.3100.0(a)1 286.4100.0(a)1 819.3100.0(a)1 286.4Employed
Labour force status
100.0492.7100.0489.7100.0492.7100.0489.7Poor100.0487.1100.0448.9100.0487.1100.0448.9Moderate100.0(a)1 003.3100.0(a)698.7100.0(a)1 003.3100.0(a)698.7Good100.0(a)946.9100.0(a)640.2100.0(a)946.9100.0(a)640.2Excellent
Self-perception of English writing skills for daily life(c)
100.0346.1100.0359.5100.0346.1100.0359.5Poor100.0408.7100.0414.0100.0408.7100.0414.0Moderate100.0(a)1 072.1100.0(a)801.7100.0(a)1 072.1100.0(a)801.7Good100.0(a)1 102.2100.0(a)704.7100.0(a)1 102.2100.0(a)704.7Excellent
Self-perception of English reading skills for daily life(c)
100.0(a)1 689.5100.0(a)1 418.1100.0(a)1 689.5100.0(a)1 418.1Arrived 10 years or more before the survey(b)100.0274.5100.0286.5100.0274.5100.0286.5Arrived 5 to 9 years before the survey(b)100.0(a)401.3100.0(a)205.1100.0(a)401.3100.0(a)205.1Arrived under 5 years before the survey(b)
Born outside Australia100.0(a)564.6100.0(a)393.9100.0(a)564.6100.0(a)393.9Born in Australia
Birthplace and year of arrival
100.0(a)1 493.1100.0(a)1 178.8100.0(a)1 493.1100.0(a)1 178.8Females100.0(a)1 436.9100.0(a)1 124.8100.0(a)1 436.9100.0(a)1 124.8Males
Sex
100.0(a)306.2100.0(a)243.4100.0(a)306.2100.0(a)243.465–74100.0391.9100.0330.5100.0391.9100.0330.555–64100.0(a)576.6100.0(a)411.5100.0(a)576.6100.0(a)411.545–54100.0(a)616.1100.0(a)513.6100.0(a)616.1100.0(a)513.635–44100.0(a)605.2100.0(a)462.2100.0(a)605.2100.0(a)462.225–34100.0433.9100.0342.3100.0433.9100.0342.315–24
Age group (years)
TO T A L
%'000%'000%'000%'000
2006199620061996
DOCUMENT LITERACY SCALEPROSE LITERACY SCALE
SKILL LEVEL OF PEOPLE WHOSE FIRST LANGUAGE WAS NOT ENGL ISH, Prose and
Document l i te racy sca le by Selec ted charac te r i s t i cs—1996 and 2006 co n t i n u e d19
54 A B S • A D U L T L I T E R A C Y A N D L I F E SK I L L S SU R V E Y , SU M M A R Y R E S U L T S • 4 2 2 8 . 0 • 2 0 0 6 ( R E I S S U E )
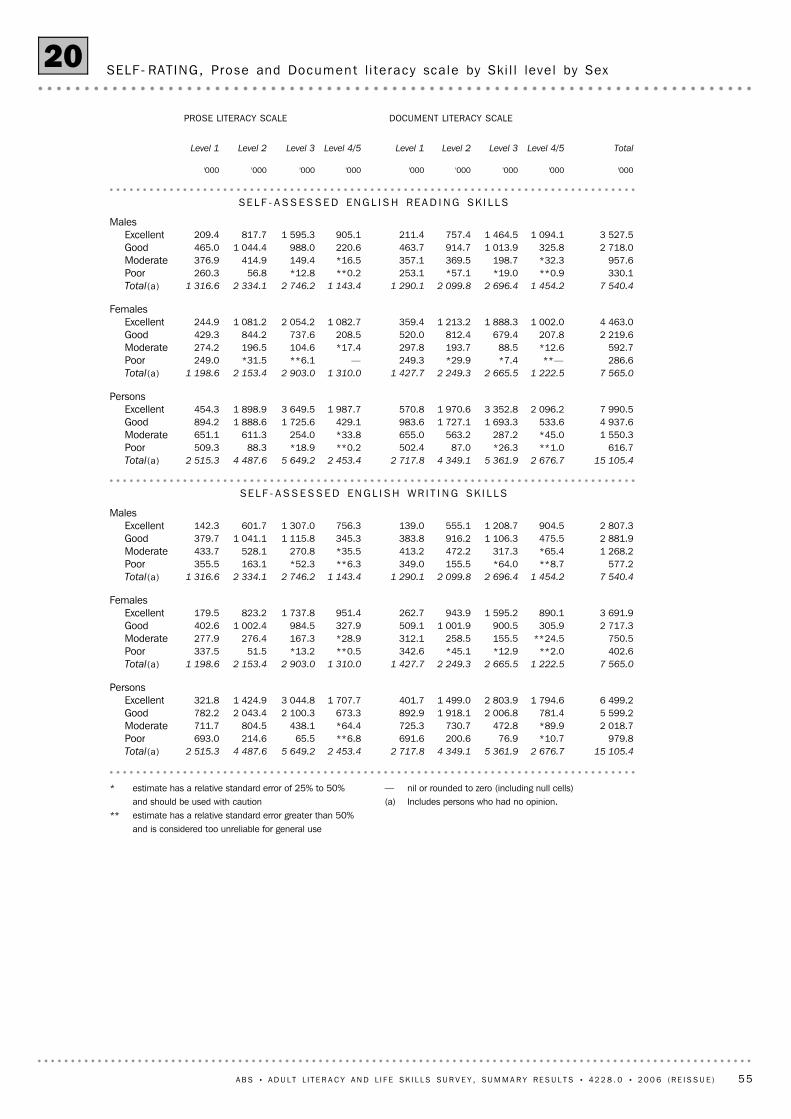
— nil or rounded to zero (including null cells)(a) Includes persons who had no opinion.
* estimate has a relative standard error of 25% to 50%and should be used with caution
** estimate has a relative standard error greater than 50%and is considered too unreliable for general use
15 105.42 676.75 361.94 349.12 717.82 453.45 649.24 487.62 515.3Total(a)979.8*10.776.9200.6691.6**6.865.5214.6693.0Poor
2 018.7*89.9472.8730.7725.3*64.4438.1804.5711.7Moderate5 599.2781.42 006.81 918.1892.9673.32 100.32 043.4782.2Good6 499.21 794.62 803.91 499.0401.71 707.73 044.81 424.9321.8Excellent
Persons
7 565.01 222.52 665.52 249.31 427.71 310.02 903.02 153.41 198.6Total(a)402.6**2.0*12.9*45.1342.6**0.5*13.251.5337.5Poor750.5**24.5155.5258.5312.1*28.9167.3276.4277.9Moderate
2 717.3305.9900.51 001.9509.1327.9984.51 002.4402.6Good3 691.9890.11 595.2943.9262.7951.41 737.8823.2179.5Excellent
Females
7 540.41 454.22 696.42 099.81 290.11 143.42 746.22 334.11 316.6Total(a)577.2**8.7*64.0155.5349.0**6.3*52.3163.1355.5Poor
1 268.2*65.4317.3472.2413.2*35.5270.8528.1433.7Moderate2 881.9475.51 106.3916.2383.8345.31 115.81 041.1379.7Good2 807.3904.51 208.7555.1139.0756.31 307.0601.7142.3Excellent
Males
SE L F - A S S E S S E D EN G L I S H WR I T I N G SK I L L S
15 105.42 676.75 361.94 349.12 717.82 453.45 649.24 487.62 515.3Total(a)616.7**1.0*26.387.0502.4**0.2*18.988.3509.3Poor
1 550.3*45.0287.2563.2655.0*33.8254.0611.3651.1Moderate4 937.6533.61 693.31 727.1983.6429.11 725.61 888.6894.2Good7 990.52 096.23 352.81 970.6570.81 987.73 649.51 898.9454.3Excellent
Persons
7 565.01 222.52 665.52 249.31 427.71 310.02 903.02 153.41 198.6Total(a)286.6**—*7.4*29.9249.3—**6.1*31.5249.0Poor592.7*12.688.5193.7297.8*17.4104.6196.5274.2Moderate
2 219.6207.8679.4812.4520.0208.5737.6844.2429.3Good4 463.01 002.01 888.31 213.2359.41 082.72 054.21 081.2244.9Excellent
Females
7 540.41 454.22 696.42 099.81 290.11 143.42 746.22 334.11 316.6Total(a)330.1**0.9*19.0*57.1253.1**0.2*12.856.8260.3Poor957.6*32.3198.7369.5357.1*16.5149.4414.9376.9Moderate
2 718.0325.81 013.9914.7463.7220.6988.01 044.4465.0Good3 527.51 094.11 464.5757.4211.4905.11 595.3817.7209.4Excellent
Males
SE L F - A S S E S S E D EN G L I S H RE A D I N G SK I L L S
'000'000'000'000'000'000'000'000'000
Level 4/5Level 3Level 2Level 1Level 4/5Level 3Level 2Level 1 Total
DOCUMENT LITERACY SCALEPROSE LITERACY SCALE
SELF- RAT ING, Prose and Document l i te racy sca le by Ski l l leve l by Sex20
A B S • A D U L T L I T E R A C Y A N D L I F E SK I L L S SU R V E Y , SU M M A R Y R E S U L T S • 4 2 2 8 . 0 • 2 0 0 6 ( R E I S S U E ) 55
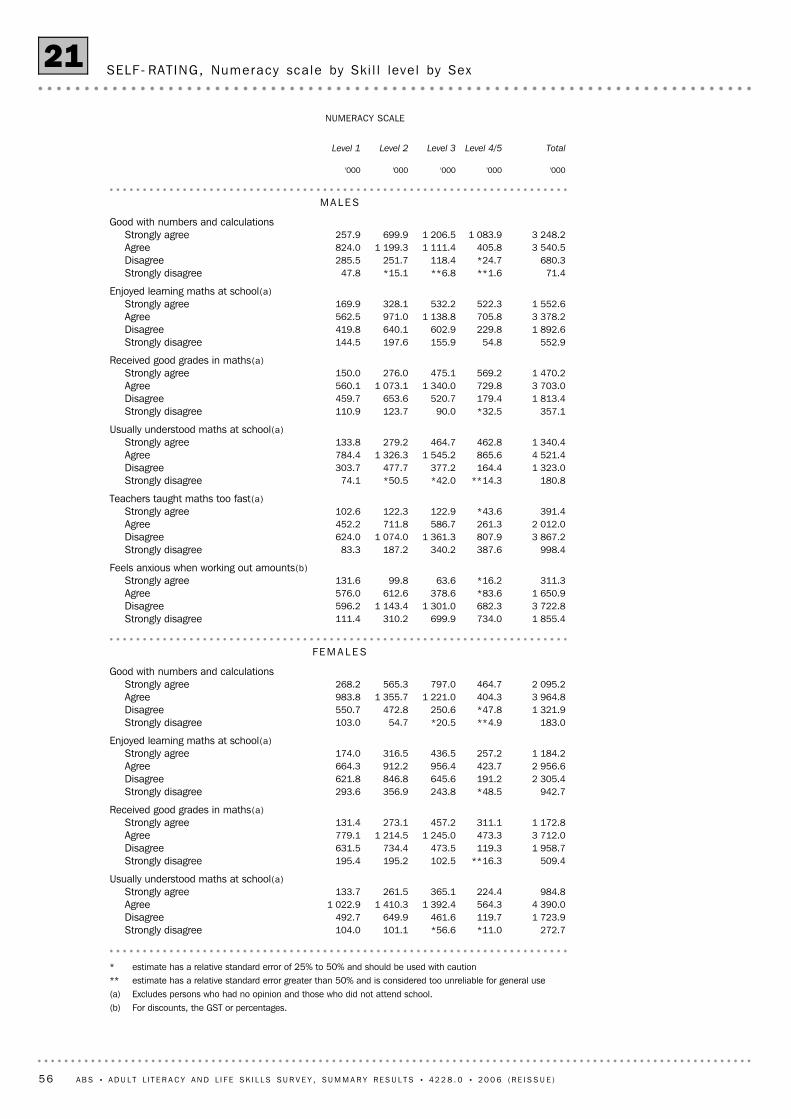
* estimate has a relative standard error of 25% to 50% and should be used with caution** estimate has a relative standard error greater than 50% and is considered too unreliable for general use(a) Excludes persons who had no opinion and those who did not attend school.(b) For discounts, the GST or percentages.
272.7*11.0*56.6101.1104.0Strongly disagree1 723.9119.7461.6649.9492.7Disagree4 390.0564.31 392.41 410.31 022.9Agree
984.8224.4365.1261.5133.7Strongly agreeUsually understood maths at school(a)
509.4**16.3102.5195.2195.4Strongly disagree1 958.7119.3473.5734.4631.5Disagree3 712.0473.31 245.01 214.5779.1Agree1 172.8311.1457.2273.1131.4Strongly agree
Received good grades in maths(a)
942.7*48.5243.8356.9293.6Strongly disagree2 305.4191.2645.6846.8621.8Disagree2 956.6423.7956.4912.2664.3Agree1 184.2257.2436.5316.5174.0Strongly agree
Enjoyed learning maths at school(a)
183.0**4.9*20.554.7103.0Strongly disagree1 321.9*47.8250.6472.8550.7Disagree3 964.8404.31 221.01 355.7983.8Agree2 095.2464.7797.0565.3268.2Strongly agree
Good with numbers and calculations
FE M A L E S
1 855.4734.0699.9310.2111.4Strongly disagree3 722.8682.31 301.01 143.4596.2Disagree1 650.9*83.6378.6612.6576.0Agree
311.3*16.263.699.8131.6Strongly agreeFeels anxious when working out amounts(b)
998.4387.6340.2187.283.3Strongly disagree3 867.2807.91 361.31 074.0624.0Disagree2 012.0261.3586.7711.8452.2Agree
391.4*43.6122.9122.3102.6Strongly agreeTeachers taught maths too fast(a)
180.8**14.3*42.0*50.574.1Strongly disagree1 323.0164.4377.2477.7303.7Disagree4 521.4865.61 545.21 326.3784.4Agree1 340.4462.8464.7279.2133.8Strongly agree
Usually understood maths at school(a)
357.1*32.590.0123.7110.9Strongly disagree1 813.4179.4520.7653.6459.7Disagree3 703.0729.81 340.01 073.1560.1Agree1 470.2569.2475.1276.0150.0Strongly agree
Received good grades in maths(a)
552.954.8155.9197.6144.5Strongly disagree1 892.6229.8602.9640.1419.8Disagree3 378.2705.81 138.8971.0562.5Agree1 552.6522.3532.2328.1169.9Strongly agree
Enjoyed learning maths at school(a)
71.4**1.6**6.8*15.147.8Strongly disagree680.3*24.7118.4251.7285.5Disagree
3 540.5405.81 111.41 199.3824.0Agree3 248.21 083.91 206.5699.9257.9Strongly agree
Good with numbers and calculations
MA L E S
'000'000'000'000'000
Level 4/5Level 3Level 2Level 1 Total
NUMERACY SCALE
SELF- RAT ING, Numeracy sca le by Ski l l leve l by Sex21
56 A B S • A D U L T L I T E R A C Y A N D L I F E SK I L L S SU R V E Y , SU M M A R Y R E S U L T S • 4 2 2 8 . 0 • 2 0 0 6 ( R E I S S U E )
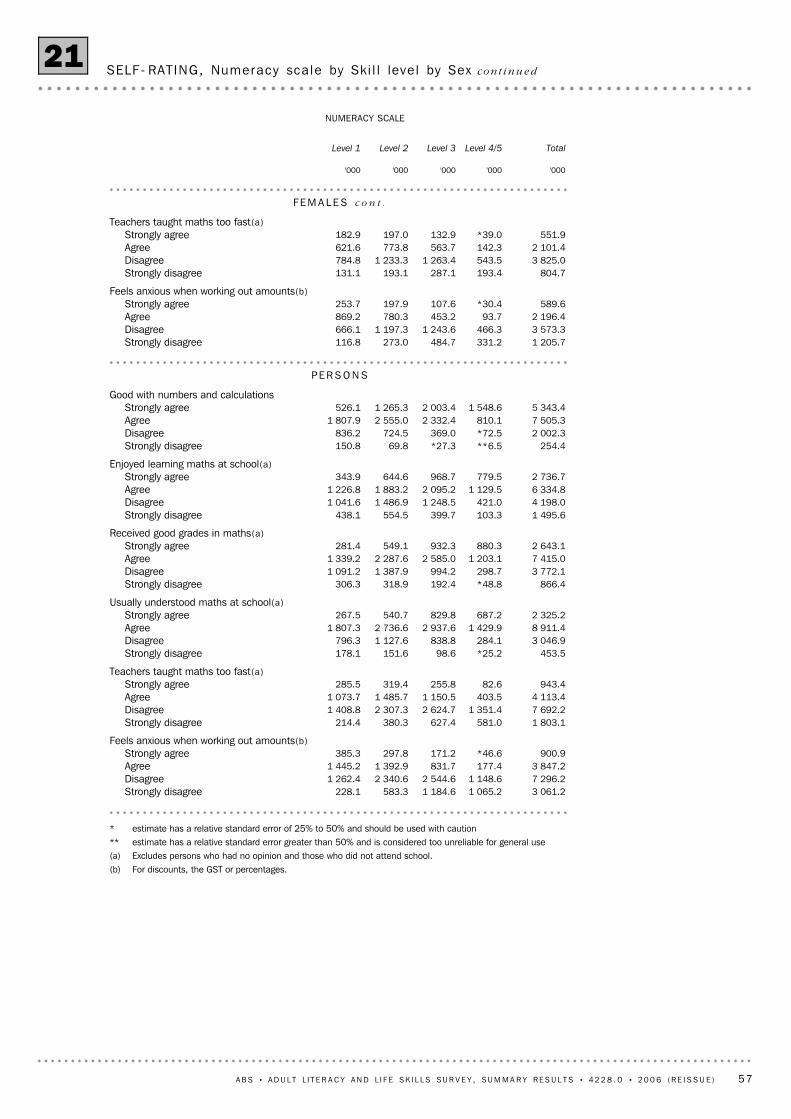
* estimate has a relative standard error of 25% to 50% and should be used with caution** estimate has a relative standard error greater than 50% and is considered too unreliable for general use(a) Excludes persons who had no opinion and those who did not attend school.(b) For discounts, the GST or percentages.
3 061.21 065.21 184.6583.3228.1Strongly disagree7 296.21 148.62 544.62 340.61 262.4Disagree3 847.2177.4831.71 392.91 445.2Agree
900.9*46.6171.2297.8385.3Strongly agreeFeels anxious when working out amounts(b)
1 803.1581.0627.4380.3214.4Strongly disagree7 692.21 351.42 624.72 307.31 408.8Disagree4 113.4403.51 150.51 485.71 073.7Agree
943.482.6255.8319.4285.5Strongly agreeTeachers taught maths too fast(a)
453.5*25.298.6151.6178.1Strongly disagree3 046.9284.1838.81 127.6796.3Disagree8 911.41 429.92 937.62 736.61 807.3Agree2 325.2687.2829.8540.7267.5Strongly agree
Usually understood maths at school(a)
866.4*48.8192.4318.9306.3Strongly disagree3 772.1298.7994.21 387.91 091.2Disagree7 415.01 203.12 585.02 287.61 339.2Agree2 643.1880.3932.3549.1281.4Strongly agree
Received good grades in maths(a)
1 495.6103.3399.7554.5438.1Strongly disagree4 198.0421.01 248.51 486.91 041.6Disagree6 334.81 129.52 095.21 883.21 226.8Agree2 736.7779.5968.7644.6343.9Strongly agree
Enjoyed learning maths at school(a)
254.4**6.5*27.369.8150.8Strongly disagree2 002.3*72.5369.0724.5836.2Disagree7 505.3810.12 332.42 555.01 807.9Agree5 343.41 548.62 003.41 265.3526.1Strongly agree
Good with numbers and calculations
PE R S O N S
1 205.7331.2484.7273.0116.8Strongly disagree3 573.3466.31 243.61 197.3666.1Disagree2 196.493.7453.2780.3869.2Agree
589.6*30.4107.6197.9253.7Strongly agreeFeels anxious when working out amounts(b)
804.7193.4287.1193.1131.1Strongly disagree3 825.0543.51 263.41 233.3784.8Disagree2 101.4142.3563.7773.8621.6Agree
551.9*39.0132.9197.0182.9Strongly agreeTeachers taught maths too fast(a)
F E M A L E S c o n t .
'000'000'000'000'000
Level 4/5Level 3Level 2Level 1 Total
NUMERACY SCALE
SELF- RAT ING, Numeracy sca le by Ski l l leve l by Sex co n t i n u e d21
A B S • A D U L T L I T E R A C Y A N D L I F E SK I L L S SU R V E Y , SU M M A R Y R E S U L T S • 4 2 2 8 . 0 • 2 0 0 6 ( R E I S S U E ) 57
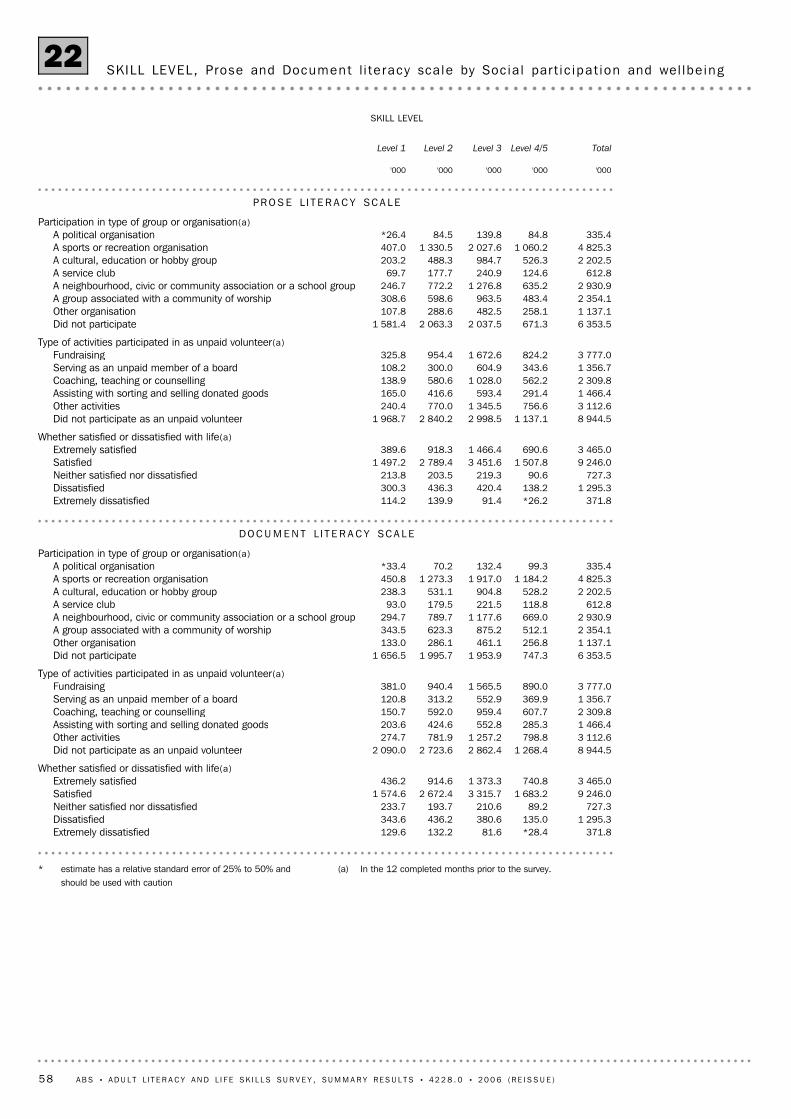
(a) In the 12 completed months prior to the survey.* estimate has a relative standard error of 25% to 50% andshould be used with caution
371.8*28.481.6132.2129.6Extremely dissatisfied1 295.3135.0380.6436.2343.6Dissatisfied
727.389.2210.6193.7233.7Neither satisfied nor dissatisfied9 246.01 683.23 315.72 672.41 574.6Satisfied3 465.0740.81 373.3914.6436.2Extremely satisfied
Whether satisfied or dissatisfied with life(a)
8 944.51 268.42 862.42 723.62 090.0Did not participate as an unpaid volunteer3 112.6798.81 257.2781.9274.7Other activities1 466.4285.3552.8424.6203.6Assisting with sorting and selling donated goods2 309.8607.7959.4592.0150.7Coaching, teaching or counselling1 356.7369.9552.9313.2120.8Serving as an unpaid member of a board3 777.0890.01 565.5940.4381.0Fundraising
Type of activities participated in as unpaid volunteer(a)
6 353.5747.31 953.91 995.71 656.5Did not participate1 137.1256.8461.1286.1133.0Other organisation2 354.1512.1875.2623.3343.5A group associated with a community of worship2 930.9669.01 177.6789.7294.7A neighbourhood, civic or community association or a school group
612.8118.8221.5179.593.0A service club2 202.5528.2904.8531.1238.3A cultural, education or hobby group4 825.31 184.21 917.01 273.3450.8A sports or recreation organisation
335.499.3132.470.2*33.4A political organisationParticipation in type of group or organisation(a)
DO C U M E N T L I T E R A C Y SC A L E
371.8*26.291.4139.9114.2Extremely dissatisfied1 295.3138.2420.4436.3300.3Dissatisfied
727.390.6219.3203.5213.8Neither satisfied nor dissatisfied9 246.01 507.83 451.62 789.41 497.2Satisfied3 465.0690.61 466.4918.3389.6Extremely satisfied
Whether satisfied or dissatisfied with life(a)
8 944.51 137.12 998.52 840.21 968.7Did not participate as an unpaid volunteer3 112.6756.61 345.5770.0240.4Other activities1 466.4291.4593.4416.6165.0Assisting with sorting and selling donated goods2 309.8562.21 028.0580.6138.9Coaching, teaching or counselling1 356.7343.6604.9300.0108.2Serving as an unpaid member of a board3 777.0824.21 672.6954.4325.8Fundraising
Type of activities participated in as unpaid volunteer(a)
6 353.5671.32 037.52 063.31 581.4Did not participate1 137.1258.1482.5288.6107.8Other organisation2 354.1483.4963.5598.6308.6A group associated with a community of worship2 930.9635.21 276.8772.2246.7A neighbourhood, civic or community association or a school group
612.8124.6240.9177.769.7A service club2 202.5526.3984.7488.3203.2A cultural, education or hobby group4 825.31 060.22 027.61 330.5407.0A sports or recreation organisation
335.484.8139.884.5*26.4A political organisationParticipation in type of group or organisation(a)
PR O S E L I T E R A C Y SC A L E
'000'000'000'000'000
Level 4/5Level 3Level 2Level 1 Total
SKILL LEVEL
SKILL LEVEL , Prose and Document l i te racy sca le by Soc ia l par t i c ipa t ion and wel lbe ing22
58 A B S • A D U L T L I T E R A C Y A N D L I F E SK I L L S SU R V E Y , SU M M A R Y R E S U L T S • 4 2 2 8 . 0 • 2 0 0 6 ( R E I S S U E )
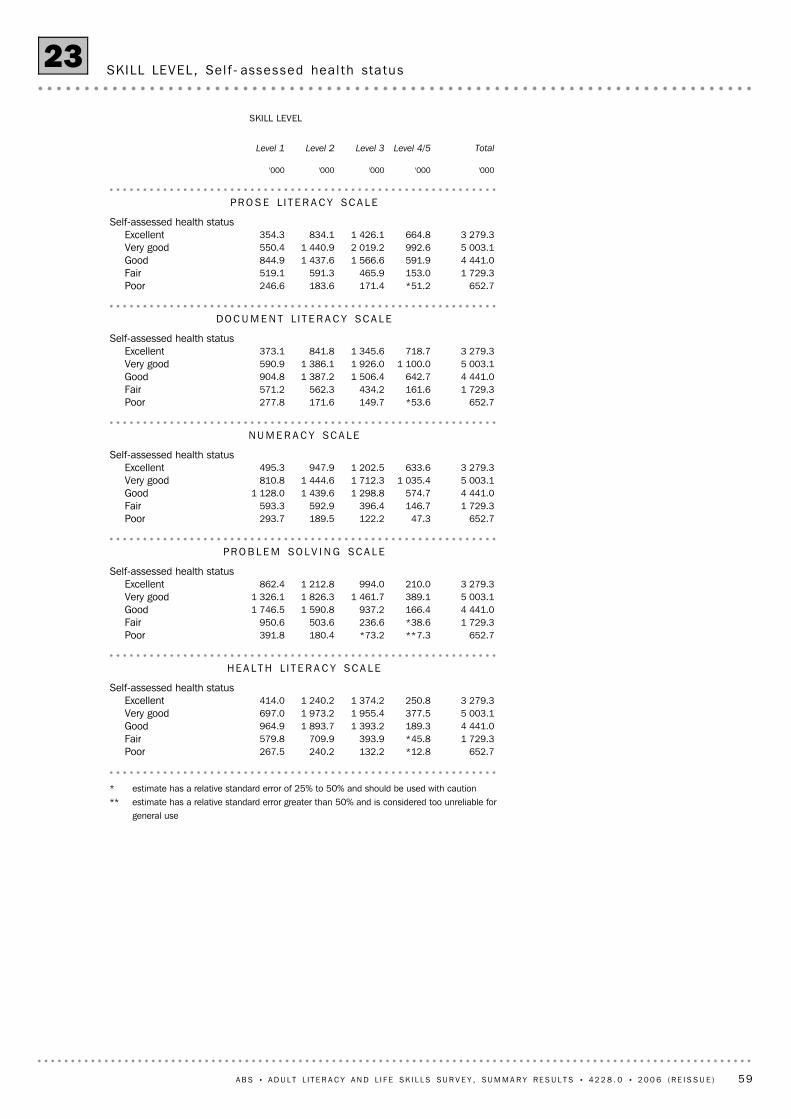
* estimate has a relative standard error of 25% to 50% and should be used with caution** estimate has a relative standard error greater than 50% and is considered too unreliable for
general use
652.7*12.8132.2240.2267.5Poor1 729.3*45.8393.9709.9579.8Fair4 441.0189.31 393.21 893.7964.9Good5 003.1377.51 955.41 973.2697.0Very good3 279.3250.81 374.21 240.2414.0Excellent
Self-assessed health status
HE A L T H L I T E R A C Y SC A L E
652.7**7.3*73.2180.4391.8Poor1 729.3*38.6236.6503.6950.6Fair4 441.0166.4937.21 590.81 746.5Good5 003.1389.11 461.71 826.31 326.1Very good3 279.3210.0994.01 212.8862.4Excellent
Self-assessed health status
PR O B L E M SO L V I N G SC A L E
652.747.3122.2189.5293.7Poor1 729.3146.7396.4592.9593.3Fair4 441.0574.71 298.81 439.61 128.0Good5 003.11 035.41 712.31 444.6810.8Very good3 279.3633.61 202.5947.9495.3Excellent
Self-assessed health status
NU M E R A C Y SC A L E
652.7*53.6149.7171.6277.8Poor1 729.3161.6434.2562.3571.2Fair4 441.0642.71 506.41 387.2904.8Good5 003.11 100.01 926.01 386.1590.9Very good3 279.3718.71 345.6841.8373.1Excellent
Self-assessed health status
DO C U M E N T L I T E R A C Y SC A L E
652.7*51.2171.4183.6246.6Poor1 729.3153.0465.9591.3519.1Fair4 441.0591.91 566.61 437.6844.9Good5 003.1992.62 019.21 440.9550.4Very good3 279.3664.81 426.1834.1354.3Excellent
Self-assessed health status
PR O S E L I T E R A C Y SC A L E
'000'000'000'000'000
Level 4/5Level 3Level 2Level 1 Total
SKILL LEVEL
SKILL LEVEL , Sel f - assessed hea l th sta tus23
A B S • A D U L T L I T E R A C Y A N D L I F E SK I L L S SU R V E Y , SU M M A R Y R E S U L T S • 4 2 2 8 . 0 • 2 0 0 6 ( R E I S S U E ) 59
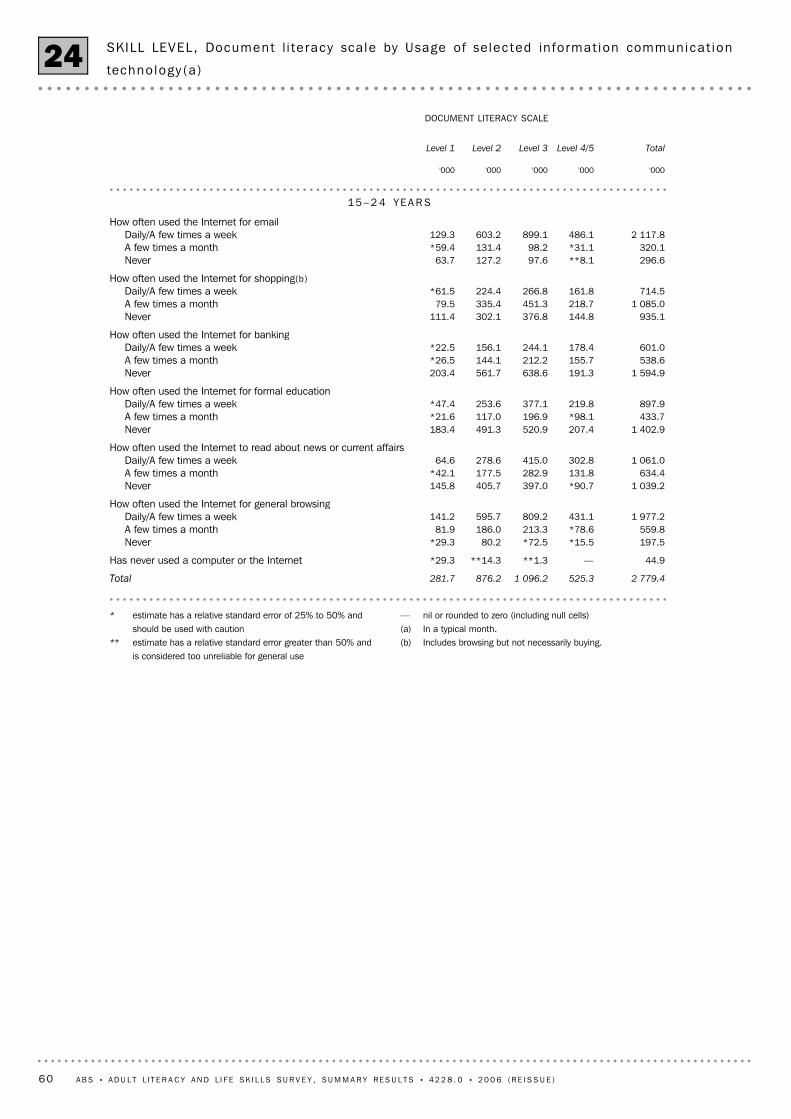
— nil or rounded to zero (including null cells)(a) In a typical month.(b) Includes browsing but not necessarily buying.
* estimate has a relative standard error of 25% to 50% andshould be used with caution
** estimate has a relative standard error greater than 50% andis considered too unreliable for general use
2 779.4525.31 096.2876.2281.7Total
44.9—**1.3**14.3*29.3Has never used a computer or the Internet
197.5*15.5*72.580.2*29.3Never559.8*78.6213.3186.081.9A few times a month
1 977.2431.1809.2595.7141.2Daily/A few times a weekHow often used the Internet for general browsing
1 039.2*90.7397.0405.7145.8Never634.4131.8282.9177.5*42.1A few times a month
1 061.0302.8415.0278.664.6Daily/A few times a weekHow often used the Internet to read about news or current affairs
1 402.9207.4520.9491.3183.4Never433.7*98.1196.9117.0*21.6A few times a month897.9219.8377.1253.6*47.4Daily/A few times a week
How often used the Internet for formal education
1 594.9191.3638.6561.7203.4Never538.6155.7212.2144.1*26.5A few times a month601.0178.4244.1156.1*22.5Daily/A few times a week
How often used the Internet for banking
935.1144.8376.8302.1111.4Never1 085.0218.7451.3335.479.5A few times a month
714.5161.8266.8224.4*61.5Daily/A few times a weekHow often used the Internet for shopping(b)
296.6**8.197.6127.263.7Never320.1*31.198.2131.4*59.4A few times a month
2 117.8486.1899.1603.2129.3Daily/A few times a weekHow often used the Internet for email
15 – 2 4 YE A R S
'000'000'000'000'000
Level 4/5Level 3Level 2Level 1 Total
DOCUMENT LITERACY SCALE
SKILL LEVEL, Document l i te racy sca le by Usage of selec ted info rmat ion communica t ion
techno logy (a )24
60 A B S • A D U L T L I T E R A C Y A N D L I F E SK I L L S SU R V E Y , SU M M A R Y R E S U L T S • 4 2 2 8 . 0 • 2 0 0 6 ( R E I S S U E )
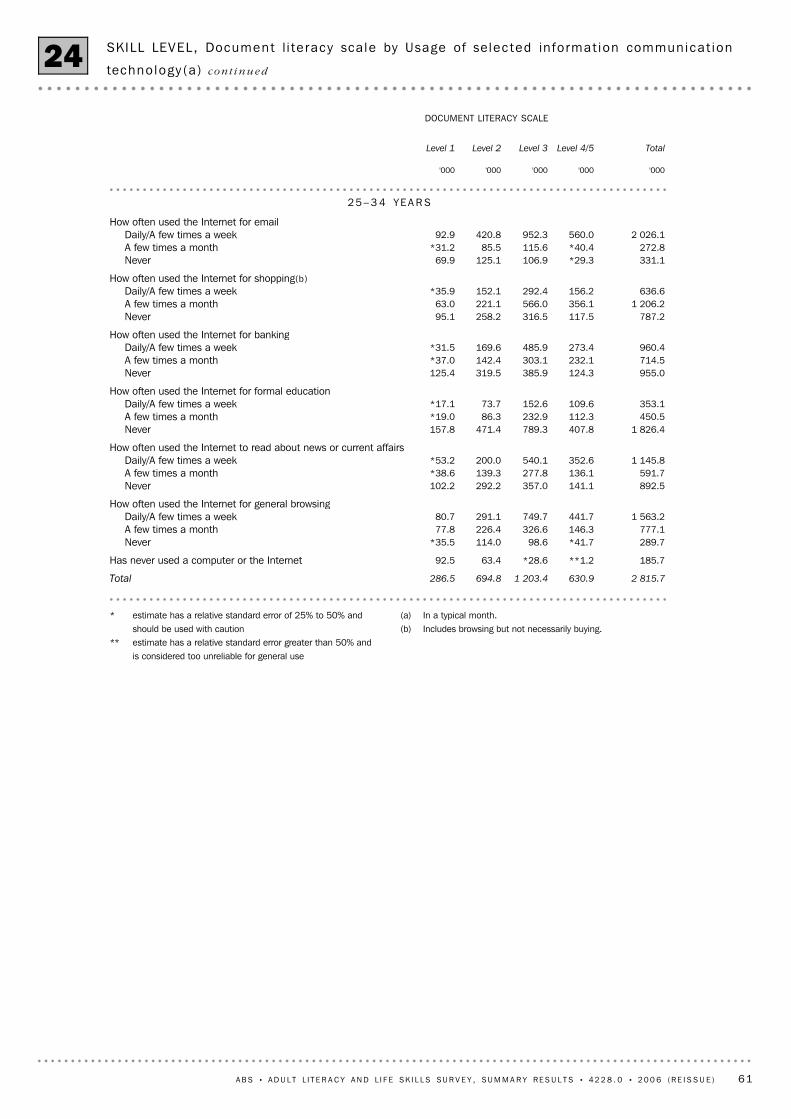
(a) In a typical month.(b) Includes browsing but not necessarily buying.
* estimate has a relative standard error of 25% to 50% andshould be used with caution
** estimate has a relative standard error greater than 50% andis considered too unreliable for general use
2 815.7630.91 203.4694.8286.5Total
185.7**1.2*28.663.492.5Has never used a computer or the Internet
289.7*41.798.6114.0*35.5Never777.1146.3326.6226.477.8A few times a month
1 563.2441.7749.7291.180.7Daily/A few times a weekHow often used the Internet for general browsing
892.5141.1357.0292.2102.2Never591.7136.1277.8139.3*38.6A few times a month
1 145.8352.6540.1200.0*53.2Daily/A few times a weekHow often used the Internet to read about news or current affairs
1 826.4407.8789.3471.4157.8Never450.5112.3232.986.3*19.0A few times a month353.1109.6152.673.7*17.1Daily/A few times a week
How often used the Internet for formal education
955.0124.3385.9319.5125.4Never714.5232.1303.1142.4*37.0A few times a month960.4273.4485.9169.6*31.5Daily/A few times a week
How often used the Internet for banking
787.2117.5316.5258.295.1Never1 206.2356.1566.0221.163.0A few times a month
636.6156.2292.4152.1*35.9Daily/A few times a weekHow often used the Internet for shopping(b)
331.1*29.3106.9125.169.9Never272.8*40.4115.685.5*31.2A few times a month
2 026.1560.0952.3420.892.9Daily/A few times a weekHow often used the Internet for email
25 – 3 4 YE A R S
'000'000'000'000'000
Level 4/5Level 3Level 2Level 1 Total
DOCUMENT LITERACY SCALE
SKILL LEVEL, Document l i te racy sca le by Usage of selec ted info rmat ion communica t ion
techno logy (a ) co n t i n u e d24
A B S • A D U L T L I T E R A C Y A N D L I F E SK I L L S SU R V E Y , SU M M A R Y R E S U L T S • 4 2 2 8 . 0 • 2 0 0 6 ( R E I S S U E ) 61
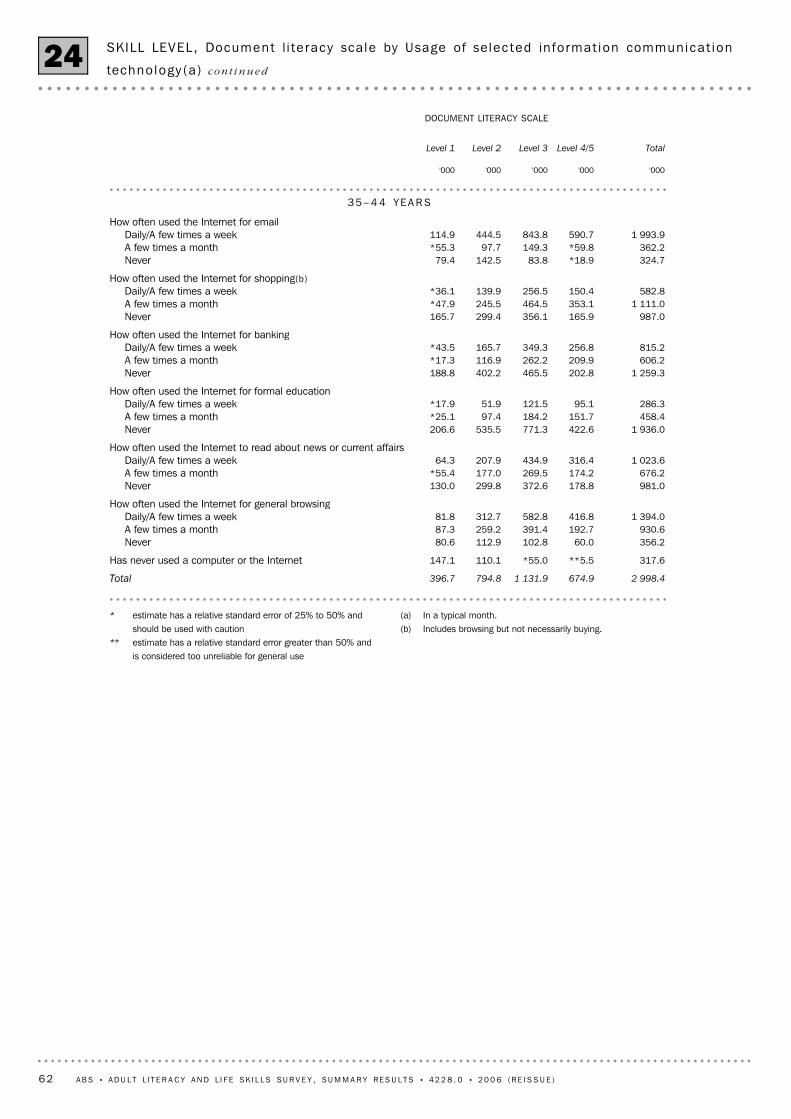
(a) In a typical month.(b) Includes browsing but not necessarily buying.
* estimate has a relative standard error of 25% to 50% andshould be used with caution
** estimate has a relative standard error greater than 50% andis considered too unreliable for general use
2 998.4674.91 131.9794.8396.7Total
317.6**5.5*55.0110.1147.1Has never used a computer or the Internet
356.260.0102.8112.980.6Never930.6192.7391.4259.287.3A few times a month
1 394.0416.8582.8312.781.8Daily/A few times a weekHow often used the Internet for general browsing
981.0178.8372.6299.8130.0Never676.2174.2269.5177.0*55.4A few times a month
1 023.6316.4434.9207.964.3Daily/A few times a weekHow often used the Internet to read about news or current affairs
1 936.0422.6771.3535.5206.6Never458.4151.7184.297.4*25.1A few times a month286.395.1121.551.9*17.9Daily/A few times a week
How often used the Internet for formal education
1 259.3202.8465.5402.2188.8Never606.2209.9262.2116.9*17.3A few times a month815.2256.8349.3165.7*43.5Daily/A few times a week
How often used the Internet for banking
987.0165.9356.1299.4165.7Never1 111.0353.1464.5245.5*47.9A few times a month
582.8150.4256.5139.9*36.1Daily/A few times a weekHow often used the Internet for shopping(b)
324.7*18.983.8142.579.4Never362.2*59.8149.397.7*55.3A few times a month
1 993.9590.7843.8444.5114.9Daily/A few times a weekHow often used the Internet for email
35 – 4 4 YE A R S
'000'000'000'000'000
Level 4/5Level 3Level 2Level 1 Total
DOCUMENT LITERACY SCALE
SKILL LEVEL, Document l i te racy sca le by Usage of selec ted info rmat ion communica t ion
techno logy (a ) co n t i n u e d24
62 A B S • A D U L T L I T E R A C Y A N D L I F E SK I L L S SU R V E Y , SU M M A R Y R E S U L T S • 4 2 2 8 . 0 • 2 0 0 6 ( R E I S S U E )

(a) In a typical month.(b) Includes browsing but not necessarily buying.
* estimate has a relative standard error of 25% to 50% andshould be used with caution
** estimate has a relative standard error greater than 50% andis considered too unreliable for general use
2 823.1555.8996.9741.1529.4Total
565.7**9.972.8176.6306.3Has never used a computer or the Internet
435.9*67.2164.6116.088.1Never718.9161.2303.2187.567.0A few times a month
1 102.7317.5456.2261.068.1Daily/A few times a weekHow often used the Internet for general browsing
886.2143.1356.7262.5123.9Never575.8155.7245.3140.7*34.2A few times a month795.5247.0322.1161.3*65.0Daily/A few times a week
How often used the Internet to read about news or current affairs
1 623.9346.5650.8441.9184.7Never406.0136.6172.077.7*19.8A few times a month227.562.8101.244.8*18.7Daily/A few times a week
How often used the Internet for formal education
1 054.8175.4401.3305.6172.5Never544.6172.4231.1113.6*27.5A few times a month658.1198.0291.7145.2*23.2Daily/A few times a week
How often used the Internet for banking
987.9169.4400.0274.8143.7Never896.3271.3383.8182.858.4A few times a month373.3105.1140.2106.9*21.0Daily/A few times a week
How often used the Internet for shopping(b)
278.3**17.579.6105.276.0Never275.037.9112.582.642.0A few times a month
1 704.2490.4731.9376.7105.2Daily/A few times a weekHow often used the Internet for email
45 – 5 4 YE A R S
'000'000'000'000'000
Level 4/5Level 3Level 2Level 1 Total
DOCUMENT LITERACY SCALE
SKILL LEVEL, Document l i te racy sca le by Usage of selec ted info rmat ion communica t ion
techno logy (a ) co n t i n u e d24
A B S • A D U L T L I T E R A C Y A N D L I F E SK I L L S SU R V E Y , SU M M A R Y R E S U L T S • 4 2 2 8 . 0 • 2 0 0 6 ( R E I S S U E ) 63

(a) In a typical month.(b) Includes browsing but not necessarily buying.
* estimate has a relative standard error of 25% to 50% andshould be used with caution
** estimate has a relative standard error greater than 50% andis considered too unreliable for general use
2 275.2246.1676.8759.3593.0Total
802.5**6.393.9267.4434.9Has never used a computer or the Internet
383.2*41.7135.8148.057.7Never510.971.9210.3179.849.0A few times a month578.5126.2236.8164.251.4Daily/A few times a week
How often used the Internet for general browsing
659.970.1226.0258.3105.4Never335.762.6139.4105.2*28.4A few times a month477.1107.2217.4128.3*24.2Daily/A few times a week
How often used the Internet to read about news or current affairs
1 245.0178.7487.1430.5148.7Never140.834.261.837.4*7.4A few times a month
86.8*26.9*34.0*24.0**1.9Daily/A few times a weekHow often used the Internet for formal education
832.287.3292.3325.8126.7Never308.180.3134.479.7*13.8A few times a month332.472.2156.286.5*17.5Daily/A few times a week
How often used the Internet for banking
785.084.1296.4280.5124.1Never488.8108.6201.8158.1*20.3A few times a month198.947.284.753.3*13.7Daily/A few times a week
How often used the Internet for shopping(b)
194.5*10.654.482.946.7Never233.8**16.590.492.1*34.8A few times a month
1 044.3212.8438.1316.976.5Daily/A few times a weekHow often used the Internet for email
55 – 6 4 YE A R S
'000'000'000'000'000
Level 4/5Level 3Level 2Level 1 Total
DOCUMENT LITERACY SCALE
SKILL LEVEL, Document l i te racy sca le by Usage of selec ted info rmat ion communica t ion
techno logy (a ) co n t i n u e d24
64 A B S • A D U L T L I T E R A C Y A N D L I F E SK I L L S SU R V E Y , SU M M A R Y R E S U L T S • 4 2 2 8 . 0 • 2 0 0 6 ( R E I S S U E )

(a) In a typical month.(b) Includes browsing but not necessarily buying.
* estimate has a relative standard error of 25% to 50% andshould be used with caution
** estimate has a relative standard error greater than 50% andis considered too unreliable for general use
1 413.643.7256.7482.9630.4Total
856.6**2.767.7248.5537.7Has never used a computer or the Internet
185.3**15.2*58.276.5*35.4Never196.9*9.271.385.630.8A few times a month174.8*16.559.572.2*26.5Daily/A few times a week
How often used the Internet for general browsing
298.1*20.188.8133.955.3Never111.4**6.6*40.9*43.4*20.4A few times a month147.6*14.359.3*57.0*17.0Daily/A few times a week
How often used the Internet to read about news or current affairs
491.0*31.8161.5213.184.6Never36.1**3.9*16.9*10.6**4.7A few times a month
*30.0**5.4**10.6**10.7**3.4Daily/A few times a weekHow often used the Internet for formal education
390.9*21.8118.2173.877.1Never83.0**4.8*37.3*33.3*7.7A few times a month83.2**14.4*33.5*27.2**8.0Daily/A few times a week
How often used the Internet for banking
370.9*23.7116.1167.963.1Never132.6**10.554.451.7*16.1A few times a month
53.6**6.8*18.4*14.8*13.5Daily/A few times a weekHow often used the Internet for shopping(b)
126.6**8.1*28.062.7*27.8Never101.5**4.0*32.8*44.7*19.8A few times a month329.0*28.9128.2126.945.1Daily/A few times a week
How often used the Internet for email
65 – 7 4 YE A R S
'000'000'000'000'000
Level 4/5Level 3Level 2Level 1 Total
DOCUMENT LITERACY SCALE
SKILL LEVEL, Document l i te racy sca le by Usage of selec ted info rmat ion communica t ion
techno logy (a ) co n t i n u e d24
A B S • A D U L T L I T E R A C Y A N D L I F E SK I L L S SU R V E Y , SU M M A R Y R E S U L T S • 4 2 2 8 . 0 • 2 0 0 6 ( R E I S S U E ) 65
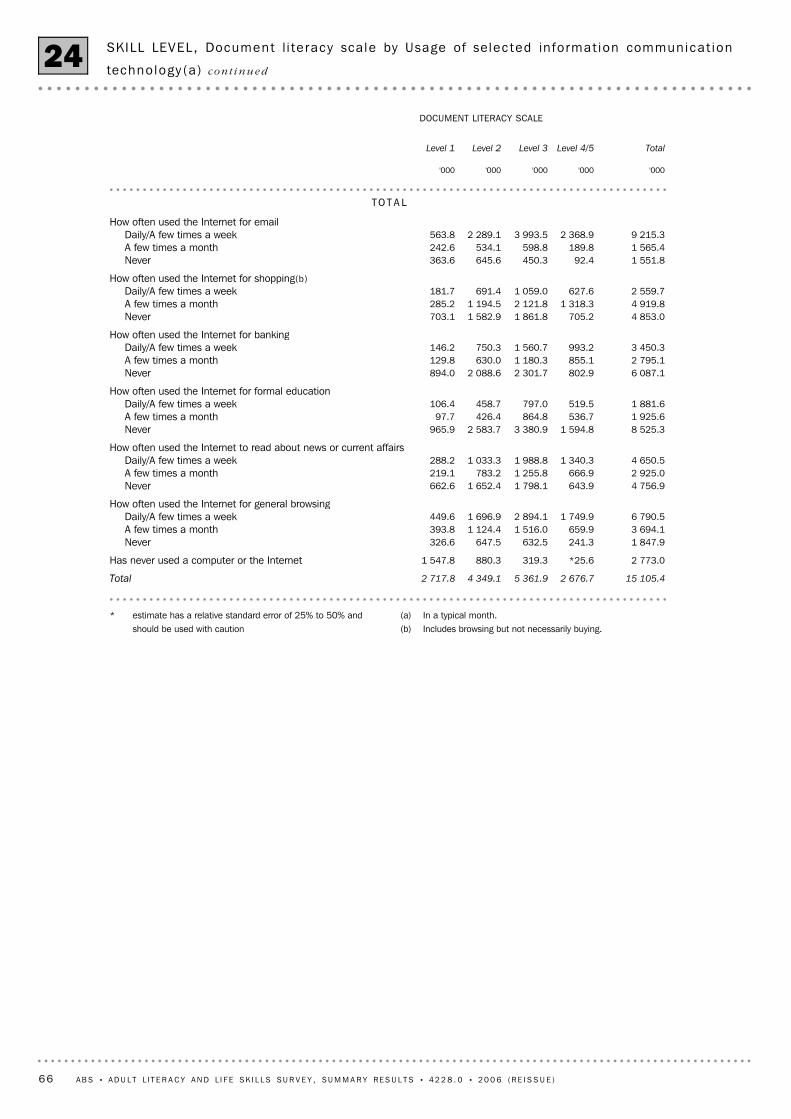
(a) In a typical month.(b) Includes browsing but not necessarily buying.
* estimate has a relative standard error of 25% to 50% andshould be used with caution
15 105.42 676.75 361.94 349.12 717.8Total
2 773.0*25.6319.3880.31 547.8Has never used a computer or the Internet
1 847.9241.3632.5647.5326.6Never3 694.1659.91 516.01 124.4393.8A few times a month6 790.51 749.92 894.11 696.9449.6Daily/A few times a week
How often used the Internet for general browsing
4 756.9643.91 798.11 652.4662.6Never2 925.0666.91 255.8783.2219.1A few times a month4 650.51 340.31 988.81 033.3288.2Daily/A few times a week
How often used the Internet to read about news or current affairs
8 525.31 594.83 380.92 583.7965.9Never1 925.6536.7864.8426.497.7A few times a month1 881.6519.5797.0458.7106.4Daily/A few times a week
How often used the Internet for formal education
6 087.1802.92 301.72 088.6894.0Never2 795.1855.11 180.3630.0129.8A few times a month3 450.3993.21 560.7750.3146.2Daily/A few times a week
How often used the Internet for banking
4 853.0705.21 861.81 582.9703.1Never4 919.81 318.32 121.81 194.5285.2A few times a month2 559.7627.61 059.0691.4181.7Daily/A few times a week
How often used the Internet for shopping(b)
1 551.892.4450.3645.6363.6Never1 565.4189.8598.8534.1242.6A few times a month9 215.32 368.93 993.52 289.1563.8Daily/A few times a week
How often used the Internet for email
TO T A L
'000'000'000'000'000
Level 4/5Level 3Level 2Level 1 Total
DOCUMENT LITERACY SCALE
SKILL LEVEL, Document l i te racy sca le by Usage of selec ted info rmat ion communica t ion
techno logy (a ) co n t i n u e d24
66 A B S • A D U L T L I T E R A C Y A N D L I F E SK I L L S SU R V E Y , SU M M A R Y R E S U L T S • 4 2 2 8 . 0 • 2 0 0 6 ( R E I S S U E )
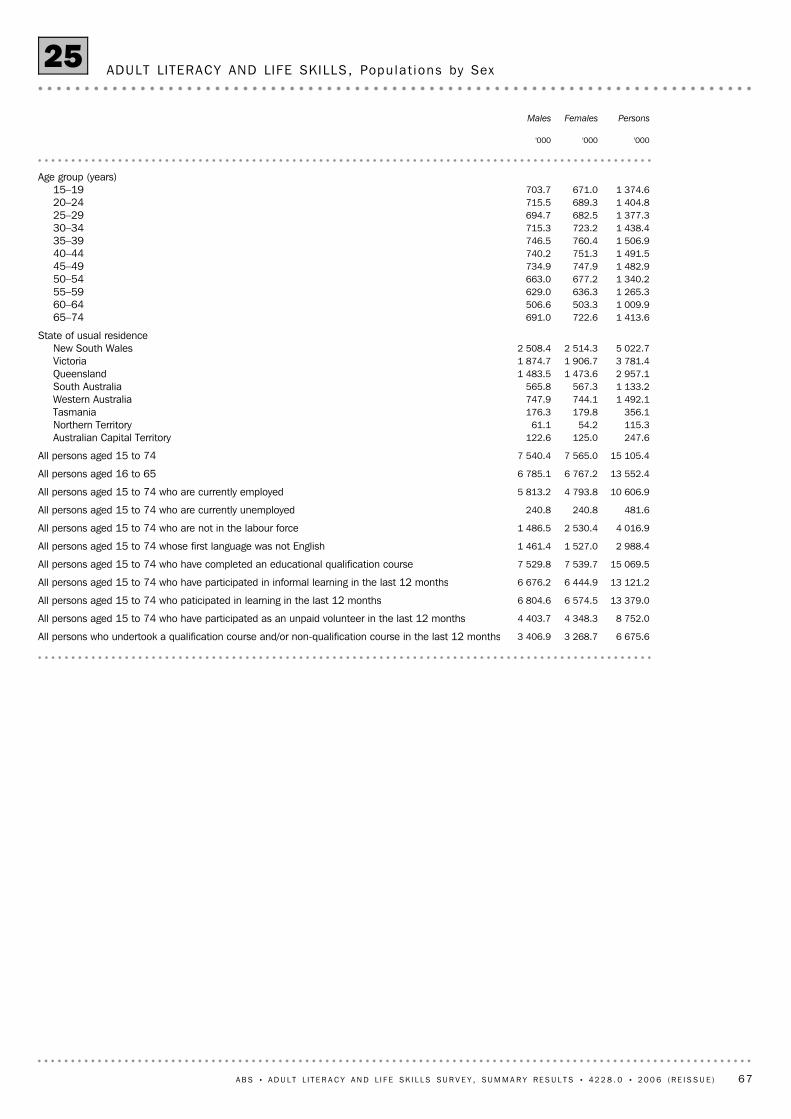
6 675.63 268.73 406.9All persons who undertook a qualification course and/or non-qualification course in the last 12 months
8 752.04 348.34 403.7All persons aged 15 to 74 who have participated as an unpaid volunteer in the last 12 months
13 379.06 574.56 804.6All persons aged 15 to 74 who paticipated in learning in the last 12 months
13 121.26 444.96 676.2All persons aged 15 to 74 who have participated in informal learning in the last 12 months
15 069.57 539.77 529.8All persons aged 15 to 74 who have completed an educational qualification course
2 988.41 527.01 461.4All persons aged 15 to 74 whose first language was not English
4 016.92 530.41 486.5All persons aged 15 to 74 who are not in the labour force
481.6240.8240.8All persons aged 15 to 74 who are currently unemployed
10 606.94 793.85 813.2All persons aged 15 to 74 who are currently employed
13 552.46 767.26 785.1All persons aged 16 to 65
15 105.47 565.07 540.4All persons aged 15 to 74
247.6125.0122.6Australian Capital Territory115.354.261.1Northern Territory356.1179.8176.3Tasmania
1 492.1744.1747.9Western Australia1 133.2567.3565.8South Australia2 957.11 473.61 483.5Queensland3 781.41 906.71 874.7Victoria5 022.72 514.32 508.4New South Wales
State of usual residence
1 413.6722.6691.065–741 009.9503.3506.660–641 265.3636.3629.055–591 340.2677.2663.050–541 482.9747.9734.945–491 491.5751.3740.240–441 506.9760.4746.535–391 438.4723.2715.330–341 377.3682.5694.725–291 404.8689.3715.520–241 374.6671.0703.715–19
Age group (years)
'000'000'000
PersonsFemalesMales
ADULT LITERACY AND LIFE SKILLS, Popu la t ions by Sex25
A B S • A D U L T L I T E R A C Y A N D L I F E SK I L L S SU R V E Y , SU M M A R Y R E S U L T S • 4 2 2 8 . 0 • 2 0 0 6 ( R E I S S U E ) 67
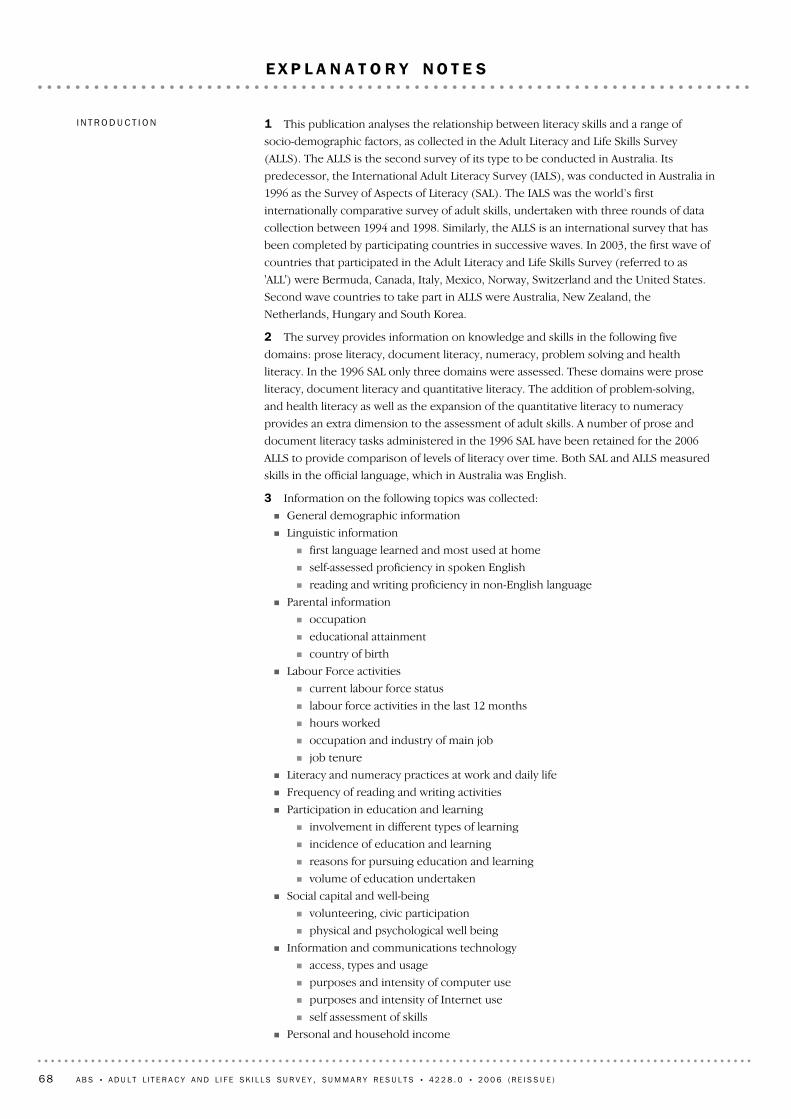
1 This publication analyses the relationship between literacy skills and a range of
socio-demographic factors, as collected in the Adult Literacy and Life Skills Survey
(ALLS). The ALLS is the second survey of its type to be conducted in Australia. Its
predecessor, the International Adult Literacy Survey (IALS), was conducted in Australia in
1996 as the Survey of Aspects of Literacy (SAL). The IALS was the world’s first
internationally comparative survey of adult skills, undertaken with three rounds of data
collection between 1994 and 1998. Similarly, the ALLS is an international survey that has
been completed by participating countries in successive waves. In 2003, the first wave of
countries that participated in the Adult Literacy and Life Skills Survey (referred to as
'ALL') were Bermuda, Canada, Italy, Mexico, Norway, Switzerland and the United States.
Second wave countries to take part in ALLS were Australia, New Zealand, the
Netherlands, Hungary and South Korea.
2 The survey provides information on knowledge and skills in the following five
domains: prose literacy, document literacy, numeracy, problem solving and health
literacy. In the 1996 SAL only three domains were assessed. These domains were prose
literacy, document literacy and quantitative literacy. The addition of problem-solving,
and health literacy as well as the expansion of the quantitative literacy to numeracy
provides an extra dimension to the assessment of adult skills. A number of prose and
document literacy tasks administered in the 1996 SAL have been retained for the 2006
ALLS to provide comparison of levels of literacy over time. Both SAL and ALLS measured
skills in the official language, which in Australia was English.
3 Information on the following topics was collected:
! General demographic information
! Linguistic information
! first language learned and most used at home
! self-assessed proficiency in spoken English
! reading and writing proficiency in non-English language
! Parental information
! occupation
! educational attainment
! country of birth
! Labour Force activities
! current labour force status
! labour force activities in the last 12 months
! hours worked
! occupation and industry of main job
! job tenure
! Literacy and numeracy practices at work and daily life
! Frequency of reading and writing activities
! Participation in education and learning
! involvement in different types of learning
! incidence of education and learning
! reasons for pursuing education and learning
! volume of education undertaken
! Social capital and well-being
! volunteering, civic participation
! physical and psychological well being
! Information and communications technology
! access, types and usage
! purposes and intensity of computer use
! purposes and intensity of Internet use
! self assessment of skills
! Personal and household income
I N T R O D U C T I O N
68 A B S • A D U L T L I T E R A C Y A N D L I F E SK I L L S SU R V E Y , SU M M A R Y R E S U L T S • 4 2 2 8 . 0 • 2 0 0 6 ( R E I S S U E )
E X P L A N A T O R Y N O T E S
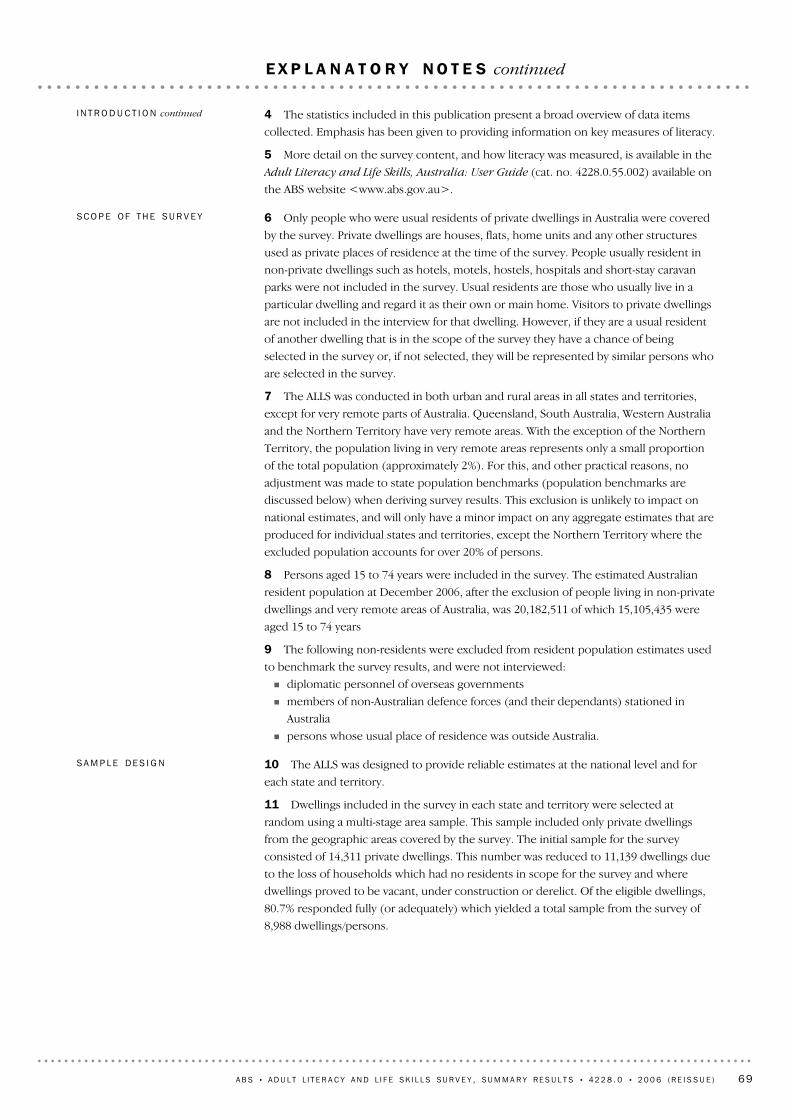
10 The ALLS was designed to provide reliable estimates at the national level and for
each state and territory.
11 Dwellings included in the survey in each state and territory were selected at
random using a multi-stage area sample. This sample included only private dwellings
from the geographic areas covered by the survey. The initial sample for the survey
consisted of 14,311 private dwellings. This number was reduced to 11,139 dwellings due
to the loss of households which had no residents in scope for the survey and where
dwellings proved to be vacant, under construction or derelict. Of the eligible dwellings,
80.7% responded fully (or adequately) which yielded a total sample from the survey of
8,988 dwellings/persons.
SA M P L E DE S I G N
6 Only people who were usual residents of private dwellings in Australia were covered
by the survey. Private dwellings are houses, flats, home units and any other structures
used as private places of residence at the time of the survey. People usually resident in
non-private dwellings such as hotels, motels, hostels, hospitals and short-stay caravan
parks were not included in the survey. Usual residents are those who usually live in a
particular dwelling and regard it as their own or main home. Visitors to private dwellings
are not included in the interview for that dwelling. However, if they are a usual resident
of another dwelling that is in the scope of the survey they have a chance of being
selected in the survey or, if not selected, they will be represented by similar persons who
are selected in the survey.
7 The ALLS was conducted in both urban and rural areas in all states and territories,
except for very remote parts of Australia. Queensland, South Australia, Western Australia
and the Northern Territory have very remote areas. With the exception of the Northern
Territory, the population living in very remote areas represents only a small proportion
of the total population (approximately 2%). For this, and other practical reasons, no
adjustment was made to state population benchmarks (population benchmarks are
discussed below) when deriving survey results. This exclusion is unlikely to impact on
national estimates, and will only have a minor impact on any aggregate estimates that are
produced for individual states and territories, except the Northern Territory where the
excluded population accounts for over 20% of persons.
8 Persons aged 15 to 74 years were included in the survey. The estimated Australian
resident population at December 2006, after the exclusion of people living in non-private
dwellings and very remote areas of Australia, was 20,182,511 of which 15,105,435 were
aged 15 to 74 years
9 The following non-residents were excluded from resident population estimates used
to benchmark the survey results, and were not interviewed:
! diplomatic personnel of overseas governments
! members of non-Australian defence forces (and their dependants) stationed in
Australia
! persons whose usual place of residence was outside Australia.
SC O P E OF TH E SU R V E Y
4 The statistics included in this publication present a broad overview of data items
collected. Emphasis has been given to providing information on key measures of literacy.
5 More detail on the survey content, and how literacy was measured, is available in the
Adult Literacy and Life Skills, Australia: User Guide (cat. no. 4228.0.55.002) available on
the ABS website <www.abs.gov.au>.
I N T R O D U C T I O N continued
A B S • A D U L T L I T E R A C Y A N D L I F E SK I L L S SU R V E Y , SU M M A R Y R E S U L T S • 4 2 2 8 . 0 • 2 0 0 6 ( R E I S S U E ) 69
E X P L A N A T O R Y N O T E S continued
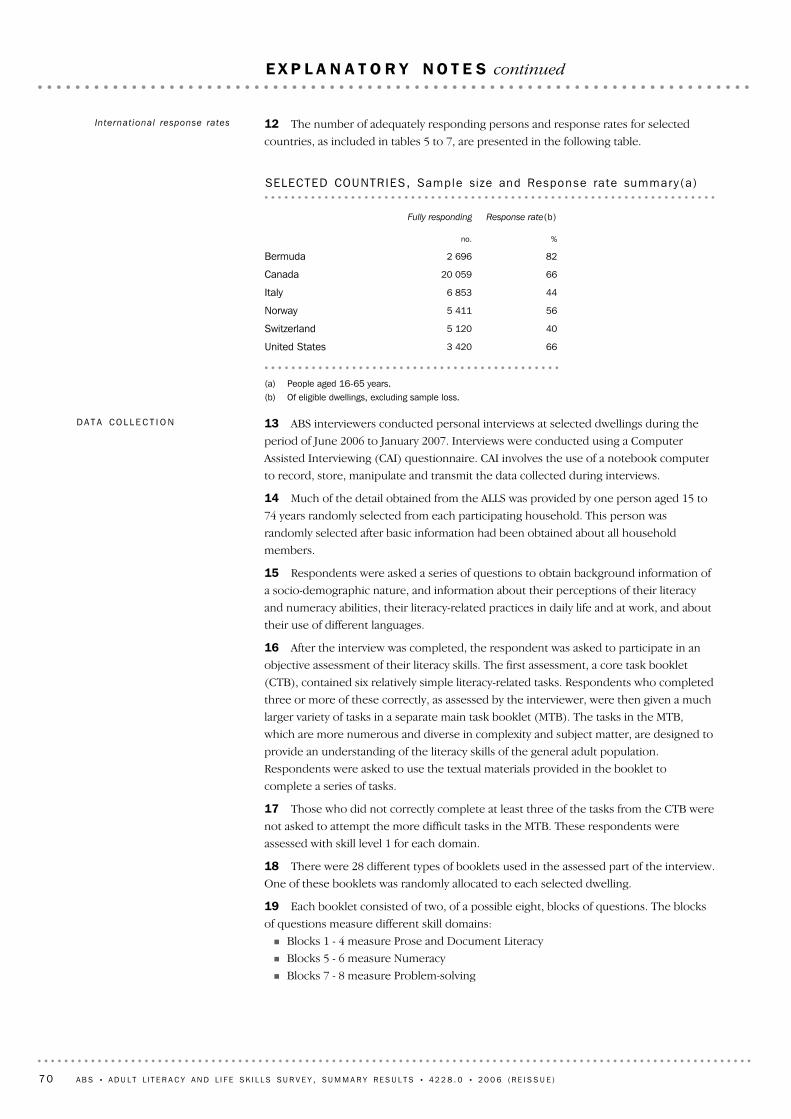
13 ABS interviewers conducted personal interviews at selected dwellings during the
period of June 2006 to January 2007. Interviews were conducted using a Computer
Assisted Interviewing (CAI) questionnaire. CAI involves the use of a notebook computer
to record, store, manipulate and transmit the data collected during interviews.
14 Much of the detail obtained from the ALLS was provided by one person aged 15 to
74 years randomly selected from each participating household. This person was
randomly selected after basic information had been obtained about all household
members.
15 Respondents were asked a series of questions to obtain background information of
a socio-demographic nature, and information about their perceptions of their literacy
and numeracy abilities, their literacy-related practices in daily life and at work, and about
their use of different languages.
16 After the interview was completed, the respondent was asked to participate in an
objective assessment of their literacy skills. The first assessment, a core task booklet
(CTB), contained six relatively simple literacy-related tasks. Respondents who completed
three or more of these correctly, as assessed by the interviewer, were then given a much
larger variety of tasks in a separate main task booklet (MTB). The tasks in the MTB,
which are more numerous and diverse in complexity and subject matter, are designed to
provide an understanding of the literacy skills of the general adult population.
Respondents were asked to use the textual materials provided in the booklet to
complete a series of tasks.
17 Those who did not correctly complete at least three of the tasks from the CTB were
not asked to attempt the more difficult tasks in the MTB. These respondents were
assessed with skill level 1 for each domain.
18 There were 28 different types of booklets used in the assessed part of the interview.
One of these booklets was randomly allocated to each selected dwelling.
19 Each booklet consisted of two, of a possible eight, blocks of questions. The blocks
of questions measure different skill domains:
! Blocks 1 - 4 measure Prose and Document Literacy
! Blocks 5 - 6 measure Numeracy
! Blocks 7 - 8 measure Problem-solving
DA T A CO L L E C T I O N
(a) People aged 16-65 years.(b) Of eligible dwellings, excluding sample loss.
663 420United States
405 120Switzerland
565 411Norway
446 853Italy
6620 059Canada
822 696Bermuda
%no.
Response rate(b)Fully responding
SELECTED COUNTRIES, Sample si ze and Response rate summary (a )
12 The number of adequately responding persons and response rates for selected
countries, as included in tables 5 to 7, are presented in the following table.
International response rates
70 A B S • A D U L T L I T E R A C Y A N D L I F E SK I L L S SU R V E Y , SU M M A R Y R E S U L T S • 4 2 2 8 . 0 • 2 0 0 6 ( R E I S S U E )
E X P L A N A T O R Y N O T E S continued
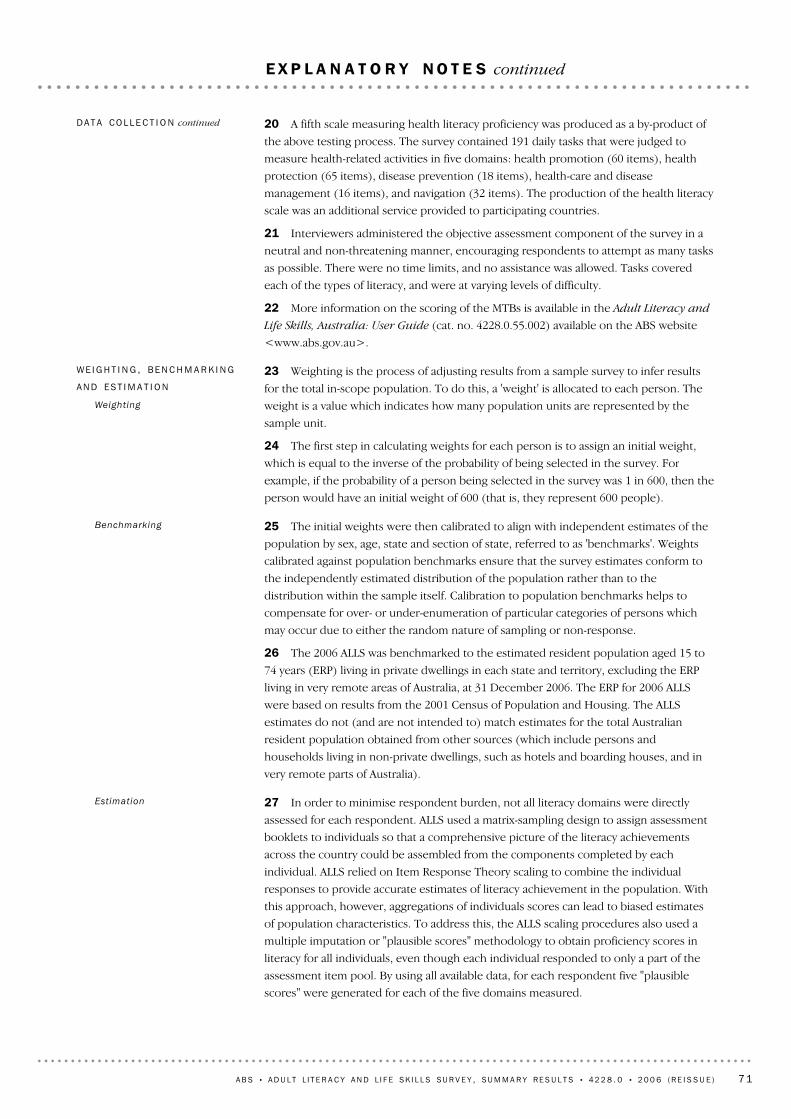
27 In order to minimise respondent burden, not all literacy domains were directly
assessed for each respondent. ALLS used a matrix-sampling design to assign assessment
booklets to individuals so that a comprehensive picture of the literacy achievements
across the country could be assembled from the components completed by each
individual. ALLS relied on Item Response Theory scaling to combine the individual
responses to provide accurate estimates of literacy achievement in the population. With
this approach, however, aggregations of individuals scores can lead to biased estimates
of population characteristics. To address this, the ALLS scaling procedures also used a
multiple imputation or "plausible scores" methodology to obtain proficiency scores in
literacy for all individuals, even though each individual responded to only a part of the
assessment item pool. By using all available data, for each respondent five "plausible
scores" were generated for each of the five domains measured.
Estimation
25 The initial weights were then calibrated to align with independent estimates of the
population by sex, age, state and section of state, referred to as 'benchmarks'. Weights
calibrated against population benchmarks ensure that the survey estimates conform to
the independently estimated distribution of the population rather than to the
distribution within the sample itself. Calibration to population benchmarks helps to
compensate for over- or under-enumeration of particular categories of persons which
may occur due to either the random nature of sampling or non-response.
26 The 2006 ALLS was benchmarked to the estimated resident population aged 15 to
74 years (ERP) living in private dwellings in each state and territory, excluding the ERP
living in very remote areas of Australia, at 31 December 2006. The ERP for 2006 ALLS
were based on results from the 2001 Census of Population and Housing. The ALLS
estimates do not (and are not intended to) match estimates for the total Australian
resident population obtained from other sources (which include persons and
households living in non-private dwellings, such as hotels and boarding houses, and in
very remote parts of Australia).
Benchmark ing
23 Weighting is the process of adjusting results from a sample survey to infer results
for the total in-scope population. To do this, a 'weight' is allocated to each person. The
weight is a value which indicates how many population units are represented by the
sample unit.
24 The first step in calculating weights for each person is to assign an initial weight,
which is equal to the inverse of the probability of being selected in the survey. For
example, if the probability of a person being selected in the survey was 1 in 600, then the
person would have an initial weight of 600 (that is, they represent 600 people).
WE I G H T I N G , BE N C H M A R K I N G
AN D ES T I M A T I O N
Weighting
20 A fifth scale measuring health literacy proficiency was produced as a by-product of
the above testing process. The survey contained 191 daily tasks that were judged to
measure health-related activities in five domains: health promotion (60 items), health
protection (65 items), disease prevention (18 items), health-care and disease
management (16 items), and navigation (32 items). The production of the health literacy
scale was an additional service provided to participating countries.
21 Interviewers administered the objective assessment component of the survey in a
neutral and non-threatening manner, encouraging respondents to attempt as many tasks
as possible. There were no time limits, and no assistance was allowed. Tasks covered
each of the types of literacy, and were at varying levels of difficulty.
22 More information on the scoring of the MTBs is available in the Adult Literacy and
Life Skills, Australia: User Guide (cat. no. 4228.0.55.002) available on the ABS website
<www.abs.gov.au>.
DA T A CO L L E C T I O N continued
A B S • A D U L T L I T E R A C Y A N D L I F E SK I L L S SU R V E Y , SU M M A R Y R E S U L T S • 4 2 2 8 . 0 • 2 0 0 6 ( R E I S S U E ) 71
E X P L A N A T O R Y N O T E S continued
30 One of the main sources of non-sampling error is non-response by persons selected
in the survey. Non-response can affect the reliability of results and can introduce bias.
The magnitude of any bias depends upon the level of non-response and the extent of the
difference between the characteristics of those people who responded to the survey and
those who did not.
31 To reduce the level and impact of non-response, the following methods were
adopted in this survey:
! face-to-face interviews with respondents
! the use of interviewers who could speak languages other than English where
necessary
! follow-up of respondents if there was initially no response
! ensuring the weighted file is representative of the population by aligning the
estimates with population benchmarks.
32 Of the dwellings selected in the 2006 ALLS , 19.3% did not respond fully or
adequately.
33 Every effort was made to minimise other non-sampling error by careful design and
testing of questionnaires, intensive training and supervision of interviewers, and
extensive editing and quality control procedures at all stages of data processing.
34 An advantage of the CAI technology used in conducting interviews for this survey is
that it potentially reduces non-sampling errors by enabling edits to be applied as the data
are being collected. The interviewer is alerted immediately if information entered into
the computer is either outside the permitted range for that question, or contradictory to
information previously recorded during the interview. These edits allow the interviewer
to query respondents and resolve issues during the interview. CAI sequencing of
questions is also automated such that respondents are asked only relevant questions and
only in the appropriate sequence, eliminating interviewer sequencing errors.
35 In contrast to most other ABS surveys, the ALLS estimates also include significant
imputation variability, due to the use of multiple possible MTB questionnaires and the
complex literacy scaling procedures. The effect of the plausible scoring methodology on
the estimation can be reliably estimated and is included in the calculated RSEs. This is
covered in more detail in the Technical notes.
Non-Sampl ing error
29 All sample surveys are subject to error which can be broadly categorised as either
sampling error or non-sampling error. Sampling error occurs because only a small
proportion of the total population is used to produce estimates that represent the whole
population. Sampling error can be reliably measured as it is calculated based on the
scientific methods used to design surveys. Non-sampling errors occur when survey
processes work less effectively than intended. For example, some persons selected for
the survey may not respond (non-response); some survey questions may not be clearly
understood by the respondent; and occasionally errors can be made in processing data
from the survey.
RE L I A B I L I T Y OF ES T I M A T E S
28 All literacy estimates presented in this publication are obtained by taking the
average of the five weighted estimates from each of the "plausible" scores. More
information on measuring literacy is covered in the Adult Literacy and Life Skills Survey:
User Guide (cat. no. 4228.0.55.002) available on the ABS website <www.abs.gov.au>.
Estimation continued
72 A B S • A D U L T L I T E R A C Y A N D L I F E SK I L L S SU R V E Y , SU M M A R Y R E S U L T S • 4 2 2 8 . 0 • 2 0 0 6 ( R E I S S U E )
E X P L A N A T O R Y N O T E S continued
38 Care has been taken to ensure that the results of this survey are as accurate as
possible. All interviews were conducted by trained ABS officers. Extensive reference
material was developed for use in the field enumeration and intensive training was
provided to interviewers in both classroom and on-the-job environments. There remain,
however, other factors which may have affected the reliability of results, and for which
no specific adjustments can be made. The following factors should be considered when
interpreting these estimates:
! Information recorded in this survey is essentially 'as reported' by respondents, and
hence may differ from information available from other sources or collected using
different methodologies. Responses may be affected by imperfect recall or individual
interpretation of survey questions.
! Some respondents may have provided responses that they felt were expected, rather
than those that accurately reflected their own situation. Every effort has been made
to minimise such bias through the development and use of culturally appropriate
survey methodology.
39 Further information on the interpretation of results is contained in the Adult
Literacy and Life Skills Survey: User Guide (cat. no. 4228.0.55.002) available on the ABS
website <www.abs.gov.au>.
40 For a number of ALLS data items, some respondents were unwilling or unable to
provide the required information. Where responses for a particular data item were
missing for a person or household they were recorded in a 'not known' or 'not stated'
category for that data item. These 'not known' or 'not stated' categories are not explicitly
shown in the publication tables, but have been included in the totals. Publication tables
presenting proportions have included any 'not known' or 'not stated' categories in the
calculation of these proportions.
41 For the personal gross weekly income data item, 11.6% of people (1.8 million) did
not provide an income amount, either because they did not know their income or they
refused to answer. There were a number of other data items included in the publication
that had missing values. The proportions of these missing values did not exceed 2% for
any data item.
I N T E R P R E T A T I O N OF RE S U L T S
37 The estimates in this publication are based on information collected from June
2006 to January 2007, and due to seasonal effects they may not be fully representative of
other time periods in the year. For example, the ALLS asked standard ABS questions on
labour force status to determine whether a person was employed. Employment is subject
to seasonal variation through the year. Therefore, the ALLS results for employment could
have differed if the ALLS had been conducted over the whole year or in a different part of
the year.
SE A S O N A L EF F E C T S
36 Sampling error is the difference between the published estimates, derived from a
sample of persons, and the value that would have been produced if all persons in scope
of the survey had been included. For more information refer to the 'Technical notes'.
Sampling error is measured for this survey by relative standard errors (RSEs). In this
publication estimates with RSEs of 25% to 50% are preceded by an asterisk (e.g. *3.4) to
indicate that the estimate should be used with caution. Estimates with RSEs over 50% are
indicated by a double asterisk (e.g.**0.6) and should be considered unreliable for most
purposes.
Sampling error
A B S • A D U L T L I T E R A C Y A N D L I F E SK I L L S SU R V E Y , SU M M A R Y R E S U L T S • 4 2 2 8 . 0 • 2 0 0 6 ( R E I S S U E ) 73
E X P L A N A T O R Y N O T E S continued
44 Selected summary results from the 1996 SAL are presented in this publication to
allow comparisons over time to be made. Of the five literacy domains available from the
2006 ALLS only two: prose and document literacy, are directly comparable to those
derived from the 1996 SAL. Experts in the field have argued that the Quantitative Literacy
domain, derived from the 1996 SAL, was only narrowly focused on numeracy
competency and did not necessarily emphasise real-life tasks which demand more
numerous and diverse numeracy skills. Consequently, a more expanded concept of adult
numeracy was developed and has been incorporated in the 2006 ALLS. The concept of
numeracy is based on a wider range of skills and knowledge that deal with situations
which demand effective responses and situational management skills. As a result of these
conceptual changes, time series analyses of the numeracy domain are not possible. The
problem solving and the health literacy domains are new additions to the 2006 ALLS and
hence no time series information is available.
45 The statistical significance of data changes between 1996 and 2006 has been
investigated and results that are statistically significant are indicated in tables 2, 4, 16 and
19. The scope, survey design, content, data collection and weighting procedures were
largely the same in both collections.
CO M P A R A B I L I T Y W I T H 19 9 6
SU R V E Y OF AS P E C T S OF
L I T E R A C Y
42 The ALLS used the following classifications;
! Coding of country of birth. The survey questionnaire listed the 10 most frequently
reported countries. Interviewers were instructed to mark the appropriate box, or if
the reported country was not among those listed, to record the name of the country
for subsequent coding. All responses for country of birth were coded according to
the Standard Australian Classification of Countries (SACC), 1998 (cat. no. 1269.0).
! Coding of geographical data. Geography data (Capital city, Balance of state/territory;
Remoteness areas) were classified according to the Australian Standard
Geographical Classification (ASGC) (cat. no. 1216.0).
! Coding of language. The survey questionnaire listed the 10 most frequently reported
languages first spoken at home. Interviewers were instructed to mark the
appropriate box, or if the reported language was not among those listed, to record
the name of the language for subsequent coding. All responses for language spoken
were coded to the Australian Standard Classification of Languages (ASCL) (cat. no.
1267.0).
! Coding of education. Level and field of education were coded to the Australian
Standard Classification of Education (ASCED) (cat. no. 1272.0). Coding was based
on the level and field of education as reported by respondents and recorded by
interviewers. In addition to this, level of education was coded to the INTERNATIONAL
STANDARD CLASSIFICATION OF EDUCATION (ISCED), 1997.
! Coding of occupation. Occupation data were dual classified according to the ASCO -
Australian Standard Classification of Occupations, Second Edition, 1997 (cat. no.
1220.0.30.001) - and the newly released ANZSCO - Australian and New Zealand
Standard Classification of Occupations, First Edition, 2006 (cat. no. 1220.0). In
addition, occupation was coded to the INTERNATIONAL STANDARD CLASSIFICATION OF
OCCUPATIONS (ISCO), 1988.
! Coding of industry. Industry data were dual classified according to the newly
released 2006 Australian and New Zealand Standard Industrial Classification
(ANZSIC) (cat. no. 1292.0) and the previous 1993 Australian and New Zealand
Standard Industrial Classification (ANZSIC) (cat. no. 1292.0.15.001). In addition,
industry was coded to the INTERNATIONAL STANDARD INDUSTRIAL CLASSIFICATION OF ALL
ECONOMIC ACTIVITIES (ISIC), 1989.
43 More information on the concepts collected in ALLS and related international
resources are available in the Adult Literacy and Life Skills, Australia: User Guide (cat.
no. 4228.0.55.002) available on the ABS website <www.abs.gov.au>.
CL A S S I F I C A T I O N S AN D
ST A N D A R D S
74 A B S • A D U L T L I T E R A C Y A N D L I F E SK I L L S SU R V E Y , SU M M A R Y R E S U L T S • 4 2 2 8 . 0 • 2 0 0 6 ( R E I S S U E )
E X P L A N A T O R Y N O T E S continued
52 For users who wish to undertake more detailed analysis of the survey data,
microdata from the 2006 ALLS will be released in the form of two confidentialised unit
record files (CURFs), the basic CURF (Adult Literacy and Life Skills Survey: Basic
Confidentialised Unit Record File, cat. no. 4228.0.30.001) and the expanded CURF
(Adult literacy and Life Skills Survey: Expanded Confidentialised Unit Record File, cat. no.
4228.0.30.002). The expanded CURF will contain more detail than the basic CURF and
will only be available via the Remote Access Data Laboratory (RADL), which is a secure
Internet-based data query service. The basic CURF will be available via CD ROM or RADL.
53 Up-to-date information on the ABS RADL service, including information on pricing,
'Applications & Undertakings', and a training manual outlining obligations and
responsibilities when accessing ABS microdata, is available on the ABS website
<www.abs.gov.au>. Those wishing to access the 2006 ALLS microdata should contact
the ABS, referring to the contact details noted at the front of this publication.
54 Technical information describing the content and use of the basic and expanded
ALLS CURFs will be available in the Technical Manual: Adult Literacy and Life Skills
Survey, Australia: Confidentialised Unit Record File (cat. no. 4228.0.55.003). Those
wishing to access ALLS microdata should contact the ABS, referring to the contact details
noted at the front of this publication.
Microdata
51 A set of tables in a spreadsheet format equivalent to those in this publication will be
produced for each state and territory (subject to standard error constraints and
excluding time series and international comparative tables) and Australia. These tables
will be available from the ABS website <www.abs.gov.au> (as Datacubes to cat. no.
4228.0).
State/ter r i tory tabulat ions
50 The ALLS User Guide has been released in conjunction with this summary results
publication. It provides detailed information about the survey content, methodology and
data interpretation. It also contains the list of ALLS data items. The User Guide is
available free-of-charge on the ABS website (cat. no. 4228.0.55.002).
Adult li teracy and Life Ski l ls
Survey: User Guide
49 An electronic version of the tables released in this publication is available on the
ABS website (cat. no. 4228.0), in spreadsheet format. The spreadsheet presents RSEs
relating to estimates and/or proportions for each publication table.
Adult Literacy and Life Ski l ls
Survey: Summary Results,
Austral ia, 2006 datacubes
48 Below is information describing the range of data to be made available from the
2006 Adult Literacy and Life Skills Survey, both in published form and on request.
Products available on the ABS website <www.abs.gov.au> are indicated accordingly.
AL L S PR O D U C T S AN D
SE R V I C E S
46 The sample sizes differed between the 2006 ALLS and 1996 SAL. In 2006, the
number of fully or adequately responding households achieved in the survey was 8,988
compared to approximately 9,302 for the 1996 cycle. The 2006 cycle had a larger initial
sample size (14,311 possible dwellings) compared to the 1996 initial sample size (13,008
possible dwellings). These differences in the sample size for 2006 and 1996 should be
considered when comparing results.
47 A full list of the data items from the 2006 ALLS is available with the Adult Literacy
and Life Skills Survey: User Guide (cat. no. 4228.0.55.002), as a datacube, available on
the ABS website <www.abs.gov.au>. For published results from the 1996 SAL, refer to
Aspects of Literacy: Assessed Skill Levels, Australia, 1996 (cat. no. 4228.0) available on the
ABS website <www.abs.gov.au>.
CO M P A R A B I L I T Y W I T H 19 9 6
SU R V E Y OF AS P E C T S OF
L I T E R A C Y continued
A B S • A D U L T L I T E R A C Y A N D L I F E SK I L L S SU R V E Y , SU M M A R Y R E S U L T S • 4 2 2 8 . 0 • 2 0 0 6 ( R E I S S U E ) 75
E X P L A N A T O R Y N O T E S continued
56 Listed below is a selection of other ABS publications on related topics which may be
of interest. Information about current ABS publications and products can be found in the
Catalogue of Publications (cat. no. 1101.0), or on-line on the ABS website
<www.abs.gov.au>.
! A Directory of Education and Training Statistics (cat. no. 1136.0),
! Aspects of Literacy: Profiles and Perceptions, Australia (cat. no. 4226.0)
! Census of Population and Housing 2006 (cat. no. 2015.0)
! Education and Work, Australia (cat. no. 6227.0)
! General Social Survey (cat. no. 4159.0 )
! Labour Force Australia (cat. no. 6202.0)
! Education and Training Experience, Australia (cat. no. 6278.0)
57 A separate publication on health literacy is expected to be available early in 2008,
through the ABS website <www.abs.gov.au>.
RE L A T E D AB S PU B L I C A T I O N S
55 Special tabulations of ALLS data are available on request and for a fee. Subject to
confidentiality and sampling variability constraints, tabulations can be produced from the
survey incorporating data items, populations and geographic areas selected to meet
individual requirements. These can be provided in printed or electronic form. Please
refer to the contact details noted at the front of this publication.
Data avai lable on request
76 A B S • A D U L T L I T E R A C Y A N D L I F E SK I L L S SU R V E Y , SU M M A R Y R E S U L T S • 4 2 2 8 . 0 • 2 0 0 6 ( R E I S S U E )
E X P L A N A T O R Y N O T E S continued
Tasks in this level require the respondent to search through complex displays that
contain multiple distractors, to make high-level text-based inferences, and to use
specialised knowledge.
Level 5 (376-500)
Tasks in this level, like those at the previous levels, ask respondents to perform
multiple-feature matches, cycle through documents, and integrate information; however,
they require a greater degree of inferencing. Many of these tasks require respondents to
provide numerous responses but do not designate how many responses are needed.
Conditional information is also present in the document tasks at this level and must be
taken into account by the respondent.
Level 4 (326-375)
Some tasks in this level require the respondent to integrate multiple pieces of
information from one or more documents. Others ask respondents to cycle through
rather complex tables or graphs which contain information that is irrelevant or
inappropriate to the task.
Level 3 (276-325)
Tasks in this level are more varied than those in Level 1. Some require the respondents
to match a single piece of information; however, several distractors may be present, or
the match may require low-level inferences. Tasks in this level may also ask the
respondent to cycle through information in a document or to integrate information from
various parts of a document.
Level 2 (226-275)
Tasks in this level tend to require the respondent either to locate a piece of information
based on a literal match or to enter information from personal knowledge onto a
document. Little, if any, distracting information is present.
DO C U M E N T
Level 1 (0-225)
Some tasks in this level require the respondent to search for information in dense text
which contains a number of plausible distractors. Others ask respondents to make
high-level inferences or use specialized background knowledge. Some tasks ask
respondents to contrast complex information.
Level 5 (376-500)
These tasks require respondents to perform multiple-feature matches and to integrate or
synthesize information from complex or lengthy passages. More complex inferences are
needed to perform successfully. Conditional information is frequently present in tasks at
this level and must be taken into consideration by the respondent.
Level 4 (326-375)
Tasks in this level tend to require respondents to make literal or synonymous matches
between the text and information given in the task, or to make matches that require
low-level inferences. Other tasks ask respondents to integrate information from dense or
lengthy text that contains no organisational aids such as headings. Respondents may also
be asked to generate a response based on information that can be easily identified in the
text. Distracting information is present, but is not located near the correct information.
Level 3 (276-325)
Some tasks in this level require respondents to locate a single piece of information in the
text; however, several distractors or plausible but incorrect pieces of information may be
present, or low-level inferences may be required. Other tasks require the respondent to
integrate two or more pieces of information or to compare and contrast easily
identifiable information based on a criterion provided in the question or directive.
Level 2 (226-275)
Most of the tasks in this level require the respondent to read relatively short text to
locate a single piece of information which is identical to or synonymous with the
information given in the question or directive. If plausible but incorrect information is
present in the text, it tends not to be located near the correct information.
PR O S E
Level 1 (0-225)
A B S • A D U L T L I T E R A C Y A N D L I F E SK I L L S SU R V E Y , SU M M A R Y R E S U L T S • 4 2 2 8 . 0 • 2 0 0 6 ( R E I S S U E ) 77
A P P E N D I X 1 L E V E L S O F D I F F I C U L T Y
Some tasks in this level require the respondent to order several objects according to
given criteria. Other tasks require the respondent to determine a sequence of
actions/events or to construct a solution by taking non-transparent or multiple
interdependent constraints into account. The reasoning process goes back and forth in a
non-linear manner, requiring a good deal of self-regulation. At this level respondents
often have to cope with multi-dimensional or ill-defined goals.
Level 3 (301-350)
Tasks in this level often require the respondent to evaluate certain alternatives with
regard to well-defined, transparent, explicitly stated criteria. The reasoning however may
be done step by step, in a linear process, without loops or backtracking. Successful
problem solving may require the combination of information from different sources, e.g.
from the question section and the information section of the test booklet.
Level 2 (251-300)
Tasks in this level typically require the respondent to make simple inferences, based on
limited information stemming from a familiar context. Tasks in this level are rather
concrete with a limited scope of reasoning. They require the respondent to make simple
connections, without having to systematically check any constraints. The respondent has
to draw direct consequences, based on the information given and on his/her previous
knowledge about a familiar context.
PR O B L E M SO L V I N G
Level 1 (0-250)
Tasks in this level require respondents to understand complex representations and
abstract and formal mathematical and statistical ideas, possibly embedded in complex
texts. Respondents may have to integrate multiple types of mathematical information,
draw inferences, or generate mathematical justification for answers.
Level 5 (376-500)
Tasks at this level require respondents to understand a broad range of mathematical
information of a more abstract nature represented in diverse ways, including in texts of
increasing complexity or in unfamiliar contexts. These tasks involve undertaking multiple
steps to find solutions to problems and require more complex reasoning and
interpretation skills, including comprehending and working with proportions and
formulas or offering explanations for answers.
Level 4 (326-375)
Tasks in this level require the respondent to demonstrate understanding of
mathematical information represented in a range of different forms, such as in numbers,
symbols, maps, graphs, texts, and drawings. Skills required involve number and spatial
sense, knowledge of mathematical patterns and relationships and the ability to interpret
proportions, data and statistics embedded in relatively simple texts where there may be
distractors. Tasks commonly involve undertaking a number of processes to solve
problems.
Level 3 (276-325)
Tasks in this level are fairly simple and relate to identifying and understanding basic
mathematical concepts embedded in a range of familiar contexts where the
mathematical content is quite explicit and visual with few distractors. Tasks tend to
include one-step or two-step processes and estimations involving whole numbers,
benchmark percents and fractions, interpreting simple graphical or spatial
representations, and performing simple measurements.
Level 2 (226-275)
Tasks in this level require the respondent to show an understanding of basic numerical
ideas by completing simple tasks in concrete, familiar contexts where the mathematical
content is explicit with little text. Tasks consist of simple, one-step operations such as
counting, sorting dates, performing simple arithmetic operations or understanding
common and simple percents such as 50%.
NU M E R A C Y
Level 1 (0-225)
78 A B S • A D U L T L I T E R A C Y A N D L I F E SK I L L S SU R V E Y , SU M M A R Y R E S U L T S • 4 2 2 8 . 0 • 2 0 0 6 ( R E I S S U E )
A P P E N D I X 1 L E V E L S O F D I F F I C U L T Y continued

Items in this level require the respondent to judge the completeness, consistency and/or
dependency among multiple criteria. In many cases, the respondent has to explain how
the solution was reached and why it is correct. The respondent has to reason from a
meta-perspective, taking into account an entire system of problem solving states and
possible solutions. Often the criteria and the goals have to be inferred from the given
information before actually starting the solution process.
Level 4 (351-500)
A B S • A D U L T L I T E R A C Y A N D L I F E SK I L L S SU R V E Y , SU M M A R Y R E S U L T S • 4 2 2 8 . 0 • 2 0 0 6 ( R E I S S U E ) 79
A P P E N D I X 1 L E V E L S O F D I F F I C U L T Y continued
The ALLS collected data across a range of topics, some of which have been included in
previous ABS surveys. Where possible question modules from existing surveys were used
in the ALLS questionnaire to ensure the ALLS data is comparable with other surveys that
users of the data may wish to compare with. However, given the ALLS is part of an
international study of literacy, there was a requirement to use internationally developed
question modules to ensure the results are comparable with other countries involved in
the study.
There are other reasons why results from the ALLS may differ from other ABS surveys
collecting information on the same topic. The ALLS is a sample survey and its results are
subject to sampling error. As such, ALLS results may differ from other sample surveys,
which are also subject to sampling error. Users should take account of the RSEs on ALLS
estimates and those of other survey estimates where comparisons are made.
Differences may also exist in the scope and/or coverage of the ALLS compared to other
surveys. Furthermore, the ALLS was collected over the period July 2006 to January 2007.
Differences in ALLS data, when compared to the estimates of other surveys, may result
from different reference periods reflecting seasonal variations, non-seasonal events that
may have impacted on one period but not another, or because of underlying trends in
the phenomena being measured.
Finally, differences can occur as a result of using different collection methodologies. This
is often evident in comparisons of similar data items reported from different ABS
collections where, after taking account of definition and scope differences and sampling
error, residual differences remain. These differences often have to do with the mode of
the collections, such as whether data is collected by an interviewer or self-enumerated by
the respondent, whether the data is collected from the person themselves or from a
proxy respondent, and the level of experience of interviewers undertaking the data
collection. Differences may also result from the context in which questions are asked, i.e.
where in the interview the questions are asked and the nature of questions that are
asked beforehand. Because of the nature of such differences between statistical
collections, the impacts on data are difficult to quantify. As a result, every effort is made
to minimise such differences.
The following table, Comparison of Data from ALLS and Other ABS Sources, presents
comparisons between a number of ALLS data items and similar data items from other
ABS sources. As can be seen from the table, ALLS data is broadly consistent with other
ABS sources.
CO M P A R I S O N OF DA T A FR O M
AL L S AN D OT H E R AB S
SO U R C E S
80 A B S • A D U L T L I T E R A C Y A N D L I F E SK I L L S SU R V E Y , SU M M A R Y R E S U L T S • 4 2 2 8 . 0 • 2 0 0 6 ( R E I S S U E )
A P P E N D I X 2 DA T A CO M P A R I S O N
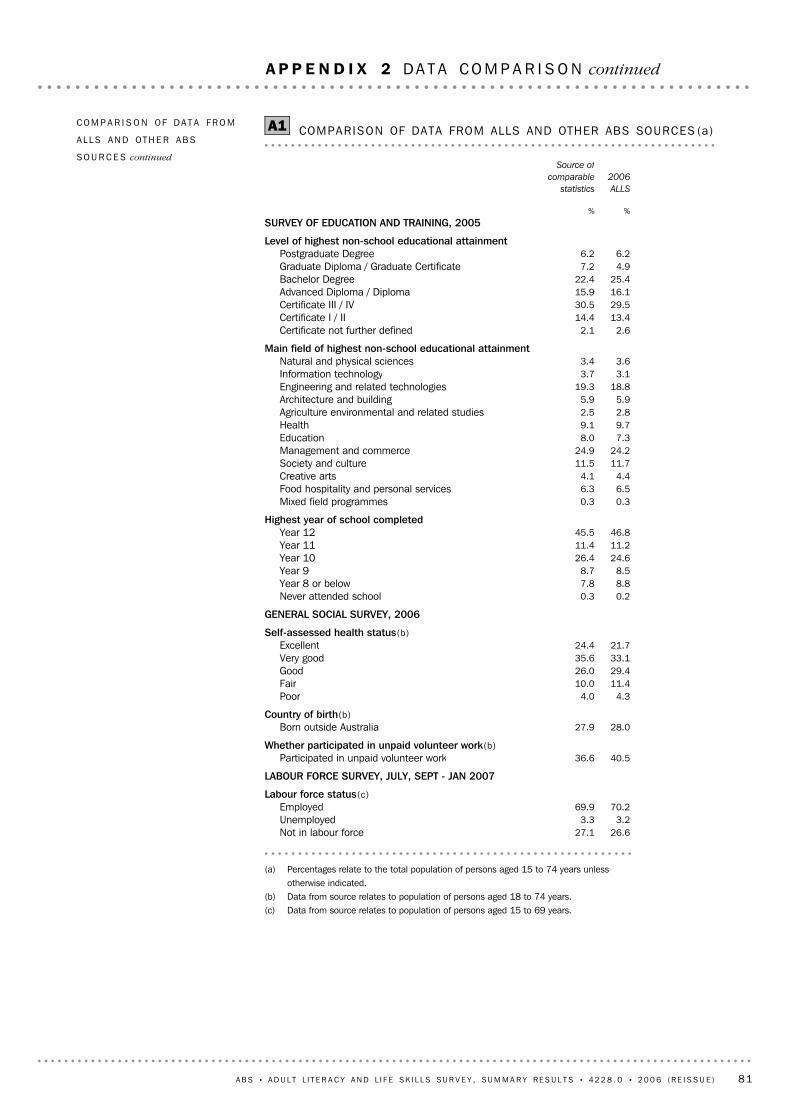
(a) Percentages relate to the total population of persons aged 15 to 74 years unlessotherwise indicated.
(b) Data from source relates to population of persons aged 18 to 74 years.(c) Data from source relates to population of persons aged 15 to 69 years.
26.627.1Not in labour force3.23.3Unemployed
70.269.9EmployedLabour force status(c)
LABOUR FORCE SURVEY, JULY, SEPT - JAN 2007
40.536.6Participated in unpaid volunteer workWhether participated in unpaid volunteer work(b)
28.027.9Born outside AustraliaCountry of birth(b)
4.34.0Poor11.410.0Fair29.426.0Good33.135.6Very good21.724.4Excellent
Self-assessed health status(b)
GENERAL SOCIAL SURVEY, 2006
0.20.3Never attended school8.87.8Year 8 or below8.58.7Year 9
24.626.4Year 1011.211.4Year 1146.845.5Year 12
Highest year of school completed
0.30.3Mixed field programmes6.56.3Food hospitality and personal services4.44.1Creative arts
11.711.5Society and culture24.224.9Management and commerce
7.38.0Education9.79.1Health2.82.5Agriculture environmental and related studies5.95.9Architecture and building
18.819.3Engineering and related technologies3.13.7Information technology3.63.4Natural and physical sciences
Main field of highest non-school educational attainment
2.62.1Certificate not further defined13.414.4Certificate I / II29.530.5Certificate III / IV16.115.9Advanced Diploma / Diploma25.422.4Bachelor Degree
4.97.2Graduate Diploma / Graduate Certificate6.26.2Postgraduate Degree
Level of highest non-school educational attainment
SURVEY OF EDUCATION AND TRAINING, 2005%%
2006
ALLS
Source of
comparable
statistics
COMPARISON OF DATA FROM ALLS AND OTHER ABS SOURCES (a)A1CO M P A R I S O N OF DA T A FR O M
AL L S AN D OT H E R AB S
SO U R C E S continued
A B S • A D U L T L I T E R A C Y A N D L I F E SK I L L S SU R V E Y , SU M M A R Y R E S U L T S • 4 2 2 8 . 0 • 2 0 0 6 ( R E I S S U E ) 81
A P P E N D I X 2 DA T A CO M P A R I S O N continued
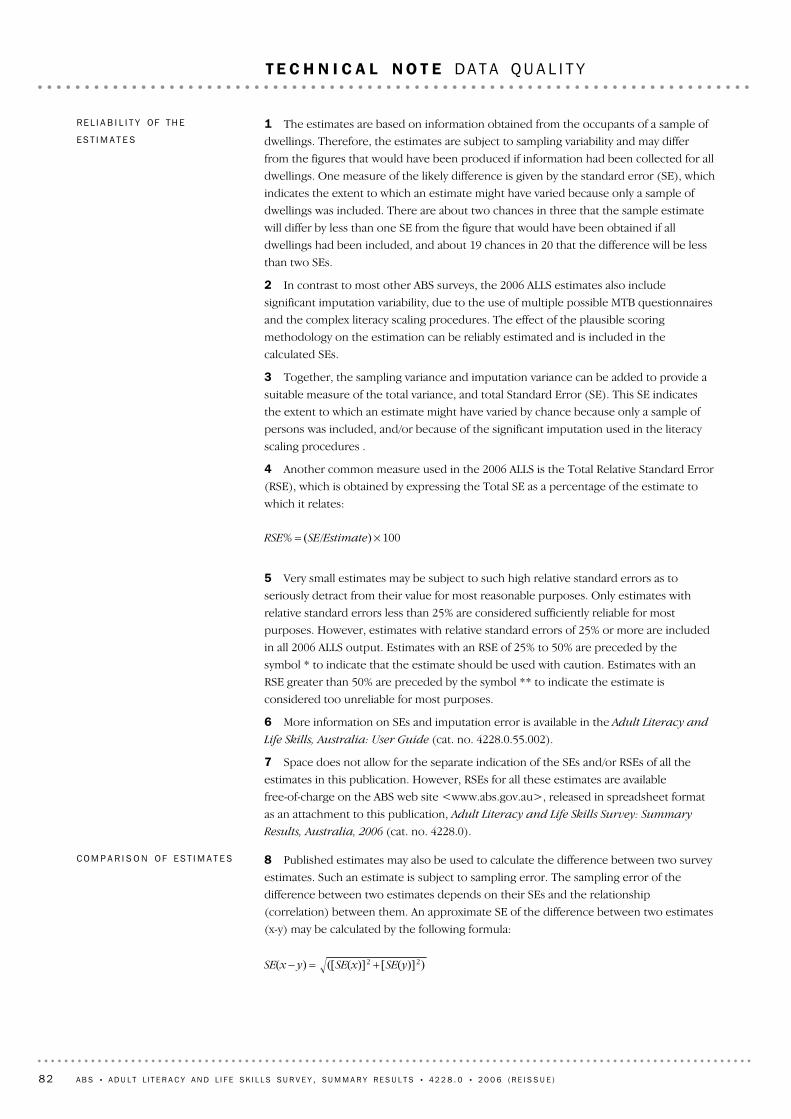
SE(x − y) = ([SE(x)]2 + [SE(y)]2)
8 Published estimates may also be used to calculate the difference between two survey
estimates. Such an estimate is subject to sampling error. The sampling error of the
difference between two estimates depends on their SEs and the relationship
(correlation) between them. An approximate SE of the difference between two estimates
(x-y) may be calculated by the following formula:
CO M P A R I S O N OF ES T I M A T E S
5 Very small estimates may be subject to such high relative standard errors as to
seriously detract from their value for most reasonable purposes. Only estimates with
relative standard errors less than 25% are considered sufficiently reliable for most
purposes. However, estimates with relative standard errors of 25% or more are included
in all 2006 ALLS output. Estimates with an RSE of 25% to 50% are preceded by the
symbol * to indicate that the estimate should be used with caution. Estimates with an
RSE greater than 50% are preceded by the symbol ** to indicate the estimate is
considered too unreliable for most purposes.
6 More information on SEs and imputation error is available in the Adult Literacy and
Life Skills, Australia: User Guide (cat. no. 4228.0.55.002).
7 Space does not allow for the separate indication of the SEs and/or RSEs of all the
estimates in this publication. However, RSEs for all these estimates are available
free-of-charge on the ABS web site <www.abs.gov.au>, released in spreadsheet format
as an attachment to this publication, Adult Literacy and Life Skills Survey: Summary
Results, Australia, 2006 (cat. no. 4228.0).
RSE% = (SE/Estimate) % 100
1 The estimates are based on information obtained from the occupants of a sample of
dwellings. Therefore, the estimates are subject to sampling variability and may differ
from the figures that would have been produced if information had been collected for all
dwellings. One measure of the likely difference is given by the standard error (SE), which
indicates the extent to which an estimate might have varied because only a sample of
dwellings was included. There are about two chances in three that the sample estimate
will differ by less than one SE from the figure that would have been obtained if all
dwellings had been included, and about 19 chances in 20 that the difference will be less
than two SEs.
2 In contrast to most other ABS surveys, the 2006 ALLS estimates also include
significant imputation variability, due to the use of multiple possible MTB questionnaires
and the complex literacy scaling procedures. The effect of the plausible scoring
methodology on the estimation can be reliably estimated and is included in the
calculated SEs.
3 Together, the sampling variance and imputation variance can be added to provide a
suitable measure of the total variance, and total Standard Error (SE). This SE indicates
the extent to which an estimate might have varied by chance because only a sample of
persons was included, and/or because of the significant imputation used in the literacy
scaling procedures .
4 Another common measure used in the 2006 ALLS is the Total Relative Standard Error
(RSE), which is obtained by expressing the Total SE as a percentage of the estimate to
which it relates:
RE L I A B I L I T Y OF TH E
ES T I M A T E S
82 A B S • A D U L T L I T E R A C Y A N D L I F E SK I L L S SU R V E Y , SU M M A R Y R E S U L T S • 4 2 2 8 . 0 • 2 0 0 6 ( R E I S S U E )
T E C H N I C A L N O T E DA T A QU A L I T Y
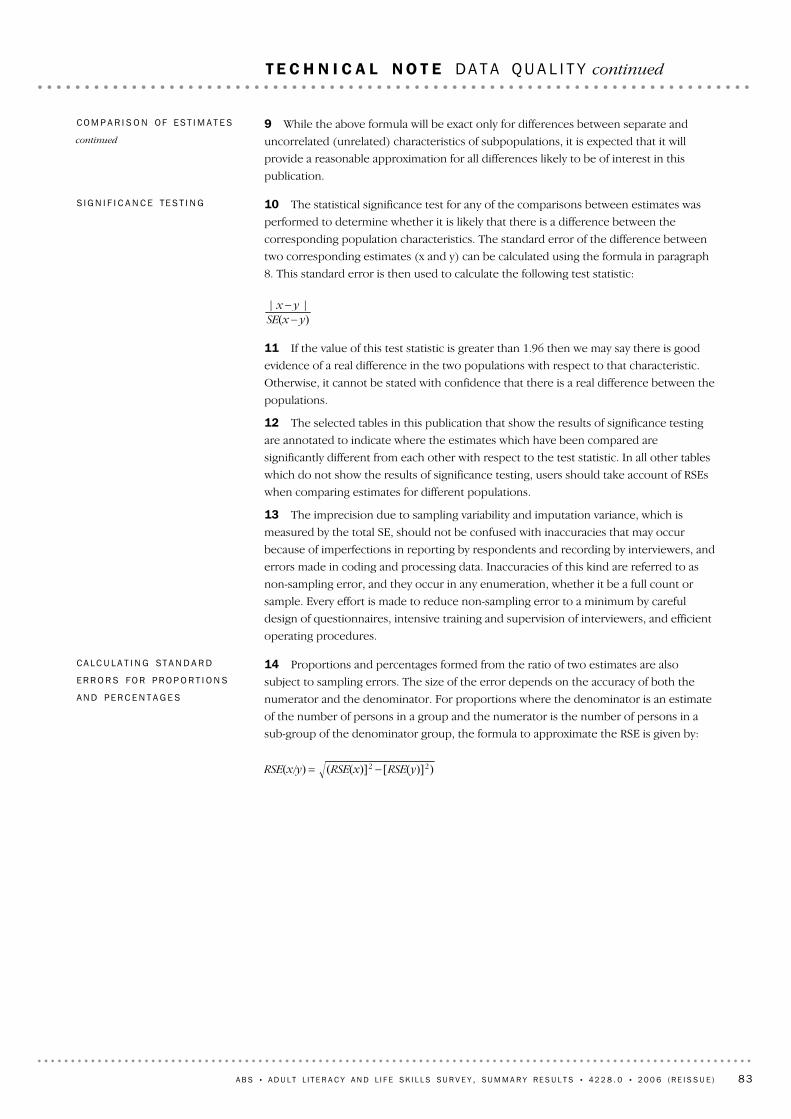
RSE(x/y) = (RSE(x)]2 − [RSE(y)]2)
14 Proportions and percentages formed from the ratio of two estimates are also
subject to sampling errors. The size of the error depends on the accuracy of both the
numerator and the denominator. For proportions where the denominator is an estimate
of the number of persons in a group and the numerator is the number of persons in a
sub-group of the denominator group, the formula to approximate the RSE is given by:
CA L C U L A T I N G ST A N D A R D
ER R O R S FO R PR O P O R T I O N S
AN D PE R C E N T A G E S
11 If the value of this test statistic is greater than 1.96 then we may say there is good
evidence of a real difference in the two populations with respect to that characteristic.
Otherwise, it cannot be stated with confidence that there is a real difference between the
populations.
12 The selected tables in this publication that show the results of significance testing
are annotated to indicate where the estimates which have been compared are
significantly different from each other with respect to the test statistic. In all other tables
which do not show the results of significance testing, users should take account of RSEs
when comparing estimates for different populations.
13 The imprecision due to sampling variability and imputation variance, which is
measured by the total SE, should not be confused with inaccuracies that may occur
because of imperfections in reporting by respondents and recording by interviewers, and
errors made in coding and processing data. Inaccuracies of this kind are referred to as
non-sampling error, and they occur in any enumeration, whether it be a full count or
sample. Every effort is made to reduce non-sampling error to a minimum by careful
design of questionnaires, intensive training and supervision of interviewers, and efficient
operating procedures.
x x − y xSE(x − y)
10 The statistical significance test for any of the comparisons between estimates was
performed to determine whether it is likely that there is a difference between the
corresponding population characteristics. The standard error of the difference between
two corresponding estimates (x and y) can be calculated using the formula in paragraph
8. This standard error is then used to calculate the following test statistic:
S I G N I F I C A N C E TE S T I N G
9 While the above formula will be exact only for differences between separate and
uncorrelated (unrelated) characteristics of subpopulations, it is expected that it will
provide a reasonable approximation for all differences likely to be of interest in this
publication.
CO M P A R I S O N OF ES T I M A T E S
continued
A B S • A D U L T L I T E R A C Y A N D L I F E SK I L L S SU R V E Y , SU M M A R Y R E S U L T S • 4 2 2 8 . 0 • 2 0 0 6 ( R E I S S U E ) 83
T E C H N I C A L N O T E DA T A QU A L I T Y continued
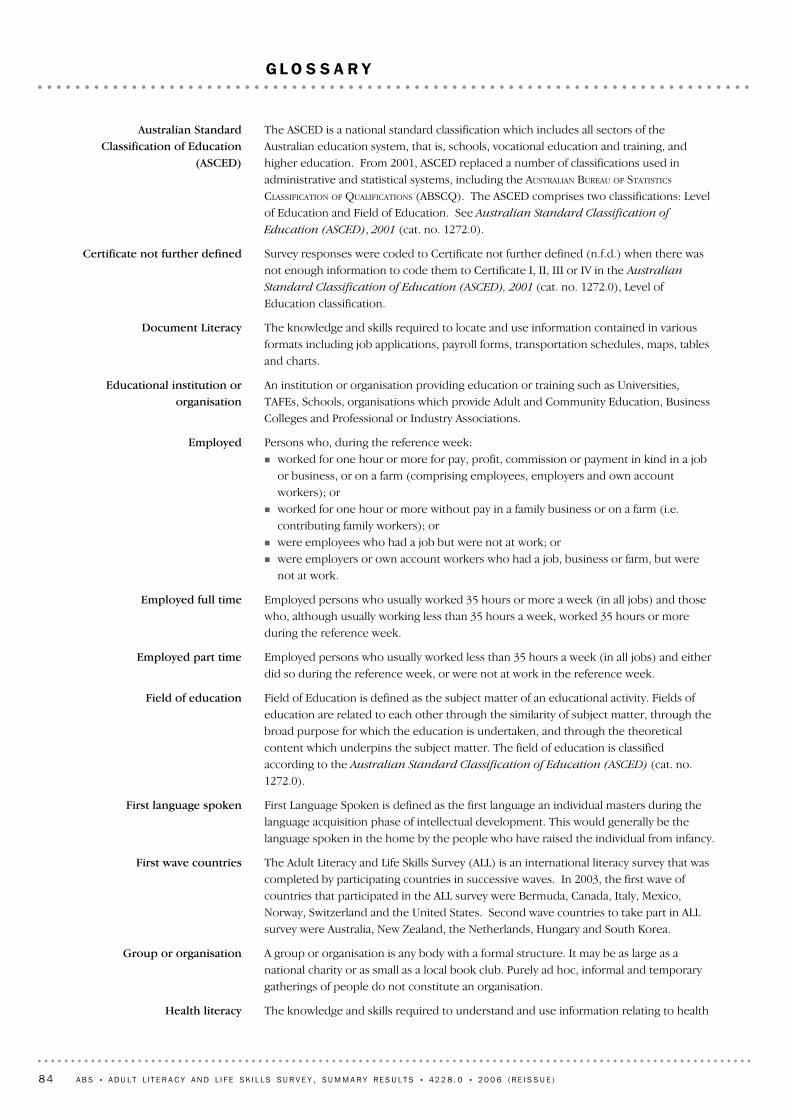
The knowledge and skills required to understand and use information relating to healthHealth literacy
A group or organisation is any body with a formal structure. It may be as large as anational charity or as small as a local book club. Purely ad hoc, informal and temporarygatherings of people do not constitute an organisation.
Group or organisation
The Adult Literacy and Life Skills Survey (ALL) is an international literacy survey that wascompleted by participating countries in successive waves. In 2003, the first wave ofcountries that participated in the ALL survey were Bermuda, Canada, Italy, Mexico,Norway, Switzerland and the United States. Second wave countries to take part in ALLsurvey were Australia, New Zealand, the Netherlands, Hungary and South Korea.
First wave countries
First Language Spoken is defined as the first language an individual masters during thelanguage acquisition phase of intellectual development. This would generally be thelanguage spoken in the home by the people who have raised the individual from infancy.
First language spoken
Field of Education is defined as the subject matter of an educational activity. Fields ofeducation are related to each other through the similarity of subject matter, through thebroad purpose for which the education is undertaken, and through the theoreticalcontent which underpins the subject matter. The field of education is classifiedaccording to the Australian Standard Classification of Education (ASCED) (cat. no.1272.0).
Field of education
Employed persons who usually worked less than 35 hours a week (in all jobs) and eitherdid so during the reference week, or were not at work in the reference week.
Employed part time
Employed persons who usually worked 35 hours or more a week (in all jobs) and thosewho, although usually working less than 35 hours a week, worked 35 hours or moreduring the reference week.
Employed full time
Persons who, during the reference week:! worked for one hour or more for pay, profit, commission or payment in kind in a job
or business, or on a farm (comprising employees, employers and own accountworkers); or
! worked for one hour or more without pay in a family business or on a farm (i.e.contributing family workers); or
! were employees who had a job but were not at work; or! were employers or own account workers who had a job, business or farm, but were
not at work.
Employed
An institution or organisation providing education or training such as Universities,TAFEs, Schools, organisations which provide Adult and Community Education, BusinessColleges and Professional or Industry Associations.
Educational institution ororganisation
The knowledge and skills required to locate and use information contained in variousformats including job applications, payroll forms, transportation schedules, maps, tablesand charts.
Document Literacy
Survey responses were coded to Certificate not further defined (n.f.d.) when there wasnot enough information to code them to Certificate I, II, III or IV in the AustralianStandard Classification of Education (ASCED), 2001 (cat. no. 1272.0), Level ofEducation classification.
Certificate not further defined
The ASCED is a national standard classification which includes all sectors of theAustralian education system, that is, schools, vocational education and training, andhigher education. From 2001, ASCED replaced a number of classifications used inadministrative and statistical systems, including the AUSTRALIAN BUREAU OF STATISTICS
CLASSIFICATION OF QUALIFICATIONS (ABSCQ). The ASCED comprises two classifications: Levelof Education and Field of Education. See Australian Standard Classification ofEducation (ASCED), 2001 (cat. no. 1272.0).
Australian StandardClassification of Education
(ASCED)
84 A B S • A D U L T L I T E R A C Y A N D L I F E SK I L L S SU R V E Y , SU M M A R Y R E S U L T S • 4 2 2 8 . 0 • 2 0 0 6 ( R E I S S U E )
G L O S S A R Y
Persons who were not in the categories employed or unemployed, as defined.Not in the labour force
Non-school qualifications are awarded for educational attainments other than those ofpre-primary, primary or secondary education. They include qualifications at the PostGraduate degree level, Master Degree level, Graduate Diploma and Graduate Certificatelevel, Bachelor Degree level, Advanced Diploma and Diploma level, and Certificates I, II,III and IV levels. Non-school qualifications may be attained concurrently with schoolqualifications.
Non-school qualification
A course that does not result in formal certification but is structured in content anddelivery.
Non-qualification course
Level (and Field) not determined includes inadequately described responses and caseswhere no response was given.
Level (and Field) notdetermined
Refers to the situation of respondents in relation to the labour force at the time of thesurvey. Categories are:! employed: had a job or business, or undertook work without pay in a family business
in the week prior to the survey, including being absent from a job or business theyhad.! full-time: persons who usually work 35 hours or more per week; or
! part-time: persons who usually work at least one hour, but less than 35 hours, per
week.
! unemployed: not employed and actively looked for work in the four weeks prior tothe survey and available to start work in the week prior to the survey.
! not in labour force: persons who were neither employed nor unemployed. Theyinclude people who are:! keeping house (unpaid);
! retired, voluntarily inactive, or permanently unable to work; or
! unpaid voluntary workers for charitable organisations.
Labour force status
An individual business entity is assigned to an industry based on its predominant activity.Industry is classified according to the Australian and New Zealand Standard Industrialclassification (ANZSIC) (cat. no. 1292.0).
Industry
Learning that results from daily work-related, family or leisure activities (OECD, 2006).Various informal learning activities are collected in ALLS and these activities can beanalysed separately or be grouped into active and passive modes of informal learning.
Passive modes of informal learning include:! going on guided tours such as museums, art galleries, or other locations;! learning by being sent around an organisation to learn different aspects of that
organisation;! visiting trade fairs, professional conferences or congresses; and! attending short lectures, seminars, workshops or special talks that were not part of a
course.
Active modes of informal learning include:! learning by watching, getting help or advice from others but not from course
instructors;! learning by yourself by trying things out, doing things for practice, trying different
approaches to doing things;! using video, television, tapes to learn but not as part of a course;! using computers or the Internet to learn but not as part of a course; and! reading manuals, reference books, journals or other written materials but not as part
of a course.
Informal learning
issues such as drugs and alcohol, disease prevention and treatment, safety and accidentprevention, first aid, emergencies, and staying healthy.
A B S • A D U L T L I T E R A C Y A N D L I F E SK I L L S SU R V E Y , SU M M A R Y R E S U L T S • 4 2 2 8 . 0 • 2 0 0 6 ( R E I S S U E ) 85
G L O S S A R Y continued
A person's relationship status in terms of whether she or he forms a couple relationshipwith another person.
Social marital status
The selected person's self-perception of their own literacy skills, given against a fourpoint scale from excellent through to poor (for example a respondent would be asked toself-rate their reading and writing skills).
Self perception of skills
The selected person's general assessment of their own health, against a five point scalefrom excellent through to poor.
Self-assessed health status
A course that results in formal certification, issued by a relevant approved body, inrecognition that a person has achieved learning outcomes or competencies relevant toidentified individual, professional, industry or community needs. Statements ofattainment awarded for partial completion of a course of study at a particular level areexcluded.
Qualification
The knowledge and skills needed to understand and use various kinds of informationfrom text including editorials, news stories, brochures and instruction manuals.
Prose Literacy
The self-assessed level of ability to speak English in every day situations, asked of peoplewhose first language spoken was a language other than English or who speak a languageother than English at home.
Proficiency in spoken English
Problem solving is goal-directed thinking action in situations for which no routinesolution procedure is available. The understanding of the problem situation and itsstep-by-step transformation, based on planning and reasoning, constitute the process ofproblem solving.
Problem Solving
These are groupings of 20% of the total population of Australia when ranked inascending order according to gross personal income.
The quintile boundaries for gross personal income for the 2006 ALLS population were:! Lowest quintile: Up to $204 per week! Second quintile: $204 to $403 per week! Third quintile: $403 to $738 per week! Fourth quintile: $738 to $1151 per week! Highest quintile: $1151 or more per week
The quintile boundaries for gross personal income for the 1996 SAL population were:! Lowest quintile: Up to $115 per week! Second quintile: $115 to $230 per week! Third quintile: $230 to $461 per week! Fourth quintile: $461 to $691 per week! Highest quintile: $691 or more per week
Personal gross income —quintile
Median personal gross weekly income was calculated by dividing the distribution of grossweekly reported income into two equal groups, one receiving income above and theother income below that amount.
Personal gross income —median
Regular and recurring cash receipts including monies received from wages and salaries,government pensions and allowances, and other regular receipts such assuperannuation, workers' compensation, child support, scholarships, profit or loss fromown unincorporated business or partnership and property income. Gross income is thesum of the income from all these sources before income tax or the Medicare levy arededucted.
Personal gross income
A collection of jobs sufficiently similar in their main tasks (in terms of skill level andspecialisation) to be grouped together for classification purposes. Occupation has beendual classified according to the AUSTRALIAN AND NEW ZEALAND STANDARD CLASSIFICATION OF
OCCUPATIONS (ANZSCO) and AUSTRALIAN STANDARD CLASSIFICATION OF OCCUPATIONS (ASCO).
Occupation
The knowledge and skills required to effectively manage and respond to themathematical demands of diverse situations.
Numeracy
86 A B S • A D U L T L I T E R A C Y A N D L I F E SK I L L S SU R V E Y , SU M M A R Y R E S U L T S • 4 2 2 8 . 0 • 2 0 0 6 ( R E I S S U E )
G L O S S A R Y continued
Refers to a person’s number of completed years in formal studies at the primary,secondary or further education level. Part time study is converted to its full-timeequivalent.
Years of formal education
Had at least one employer or own business in the last 12 months.Worked in the last 12 months
A person who provides unpaid help willingly undertaken in the form of time, service orskills, to an organisation or group.
Unpaid volunteer
Persons aged 15-74 who were not employed (as defined), had actively looked forfull-time or part-time work at any time in the four weeks up to the end of the referenceweek, and were available for work in the reference week if they had found a job.
Unemployed
Enrolment in study part-time as reported by the respondent.Studying part-time
Enrolment in study full-time as reported by the respondent.Studying full-time
Classified according to the Australian Standard Geographical Classification (ASGC)(cat. no. 1216.0).
State or territory
A B S • A D U L T L I T E R A C Y A N D L I F E SK I L L S SU R V E Y , SU M M A R Y R E S U L T S • 4 2 2 8 . 0 • 2 0 0 6 ( R E I S S U E ) 87
G L O S S A R Y continued
www.abs.gov.auWEB ADDRESS
All statistics on the ABS website can be downloaded freeof charge.
F R E E A C C E S S T O S T A T I S T I C S
Client Services, ABS, GPO Box 796, Sydney NSW 2001POST
1300 135 211FAX
1300 135 070PHONE
Our consultants can help you access the full range ofinformation published by the ABS that is available free ofcharge from our website, or purchase a hard copypublication. Information tailored to your needs can also berequested as a 'user pays' service. Specialists are on handto help you with analytical or methodological advice.
I N F O R M A T I O N A N D R E F E R R A L S E R V I C E
A range of ABS publications are available from public andtertiary libraries Australia wide. Contact your nearestlibrary to determine whether it has the ABS statistics yourequire, or visit our website for a list of libraries.
LIBRARY
www.abs.gov.au the ABS website is the best place fordata from our publications and information about the ABS.
INTERNET
F O R M O R E I N F O R M A T I O N . . .
ISBN 97806424840242422800011068
RRP $34.00
© Commonwealth of Australia 2008Produced by the Australian Bureau of Statistics
42
28
.0
•
AD
UL
T L
ITE
RA
CY
AN
D
LIF
E S
KI
LL
S
SU
RV
EY
, S
UM
MA
RY
RE
SU
LT
S,
AU
ST
RA
LI
A
• 2
00
6 (R
eis
su
e)