Embed Size (px)
Citation preview

Global Auto Industry
Franklin GuoDat HongRex LiuReya Lu
Auto Manufacturing Industry Agenda
Auto Manufacturing History & Regulation Business Strategy & Characteristics Global Auto Supply Chain Global Auto Sales & Production Analysis Industry Future Forecast
Auto Manufacturing History
Eras of Invention (late 17th century – 1890s): A small steam car was demonstrated in 1678
The early automobiles manufacturing companies: Panhard et Levassor, Oldsmobile, Cadillac, Winton, Ford, etc.
After 1930, the number of auto manufacturers declined sharply as the industry consolidated and matured.
By 1960s, foreign competition arose as Japanese appeared as a serious auto manufacturing nation.
Captive imports and badge engineering swept through the U.S. and UK, resulting in major acquisitions and merges by the end of 1960s.
Auto Manufacturing History
As the 1973 oil crisis, automobile emissions control rules, Japanese and European imports, and stagnant innovation changed American industry.
Small imported cars outperformed large American ones, and the domestic auto industry began to fail. Small performance cars from BMW, Toyota, and Nissan took the place of big-engined cars from America and Italy.
Major M & A, alliance: GM---SAAB, Daewoo; Isuzu, Subaru, Suzuki Ford---Jaguar, Land Rover, Volvo; Mazda Benz---Chrysler Renault---Nissan
Regulation History
Emission Regulation Act Since 1970, emissions from motor vehicles were regulated by
Transport Canada under the authority of the Motor Vehicle Safety Act (MVSA) and it was later amended in 1993.
In 1999, with the passage of the proposed amendment to the Canadian Environmental Protection Act (CEPA), automotive emissions regulations have become the responsibility of Environment Canada.
In 2001, Canadian government published the Canada Gazette Part I to develop and implement services and measures over the next decade to further protect the health of Canadians and the environment by reducing emissions from vehicles, engines and fuels.
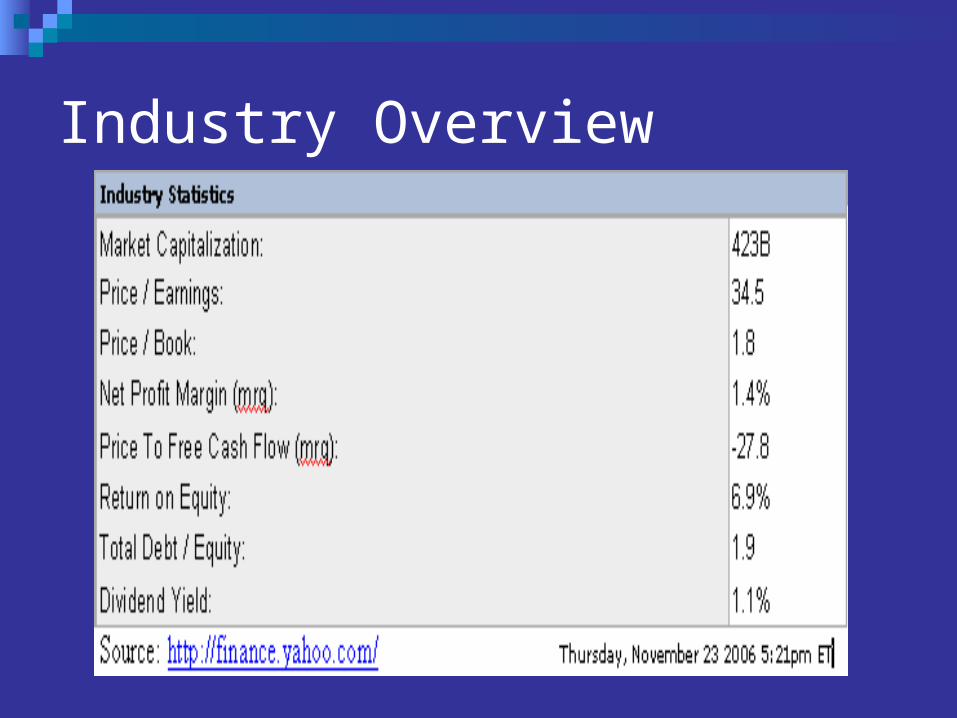
Industry Overview

The Automobile Design and Development Process

Auto Industry Business Strategy

Global Auto Ownership
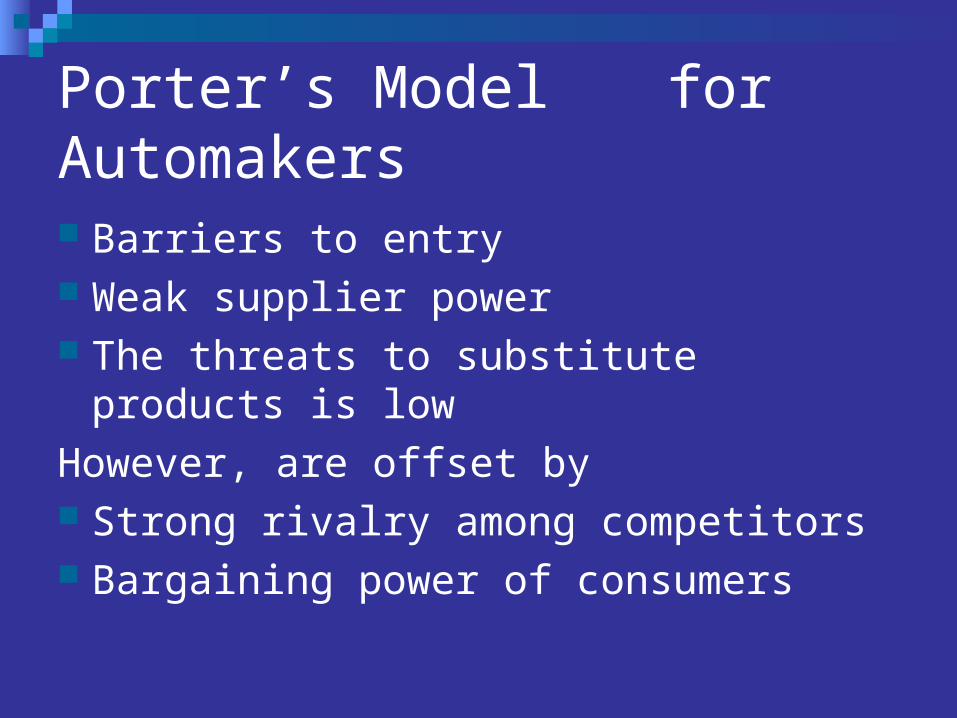
Porter’s Model for Automakers
Barriers to entry Weak supplier power The threats to substitute products is low
However, are offset by Strong rivalry among competitors Bargaining power of consumers

Supply Chain
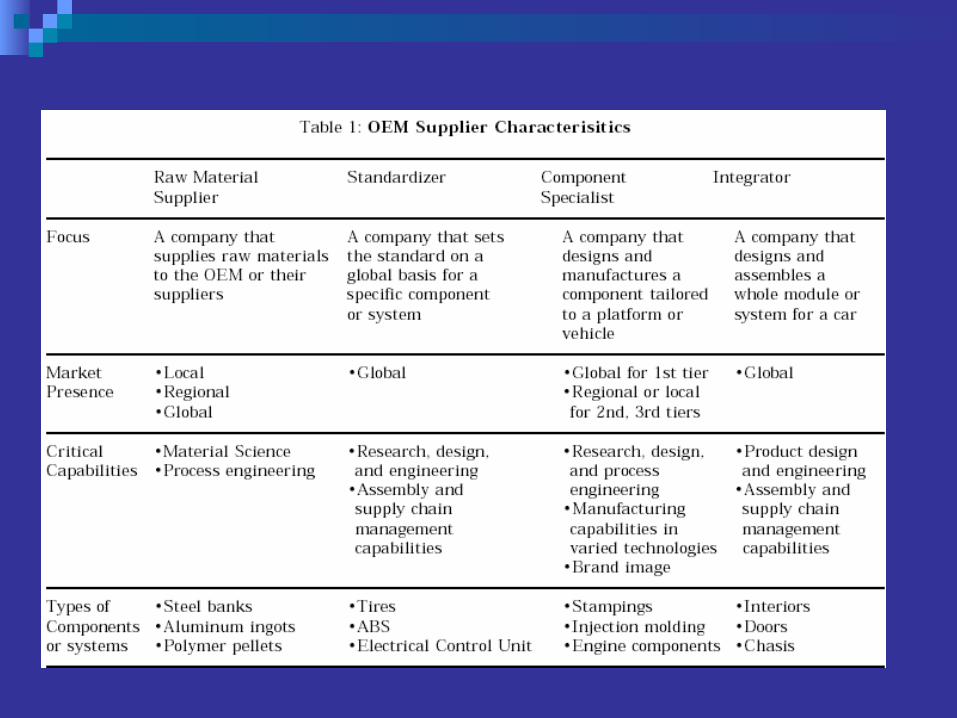

Auto Suppliers
Facing a number of challenges including:A lack of pricing power, high labor costs,
decreasing volume and increasing raw material costs;
NAFTA-only suppliers are losing market shares to global suppliers.
Suppliers are trying to increase value-added content, supply systems instead of components, technology innovations, etc.
Acquisitions, joint ventures, etc.
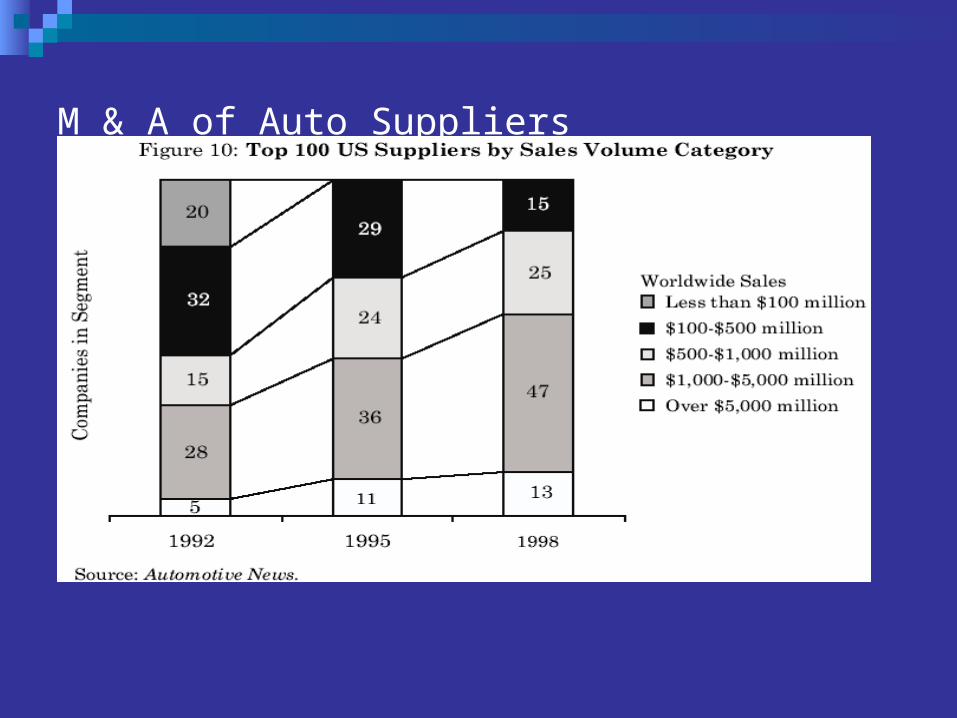
M & A of Auto Suppliers


Gasoline Prices’ Impact on Auto

Changes in Gas Price vs. SUV & Hybrid Auto Sales
Gasoline price has a positive correlation with the sales of hybrid
auto and a negative correlation with the sales of SUV.
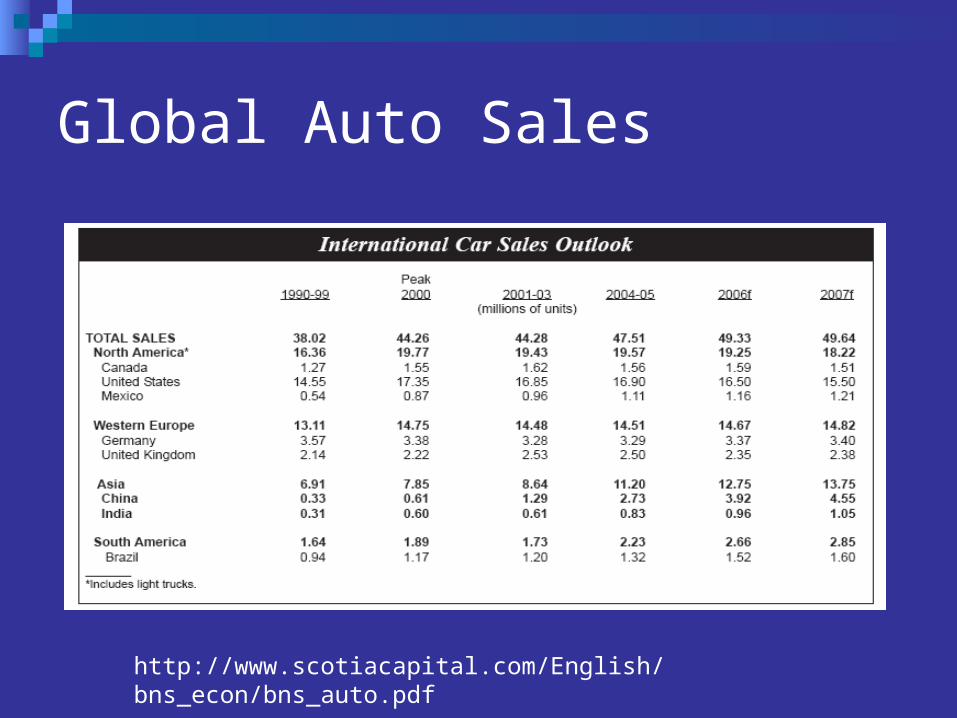
Global Auto Sales
http://www.scotiacapital.com/English/bns_econ/bns_auto.pdf

Global Auto Production


Current Auto Manufacturing


Manufacturers’ Unit Price Comparison
On average, vehicles from US car makers were sold for $21,597 in 2005, which was 13% below the comparable sales price for the Japanese car makers’. It was mainly due to:Missed design opportunitiesHeavy employee-level discountingHigher labor costs
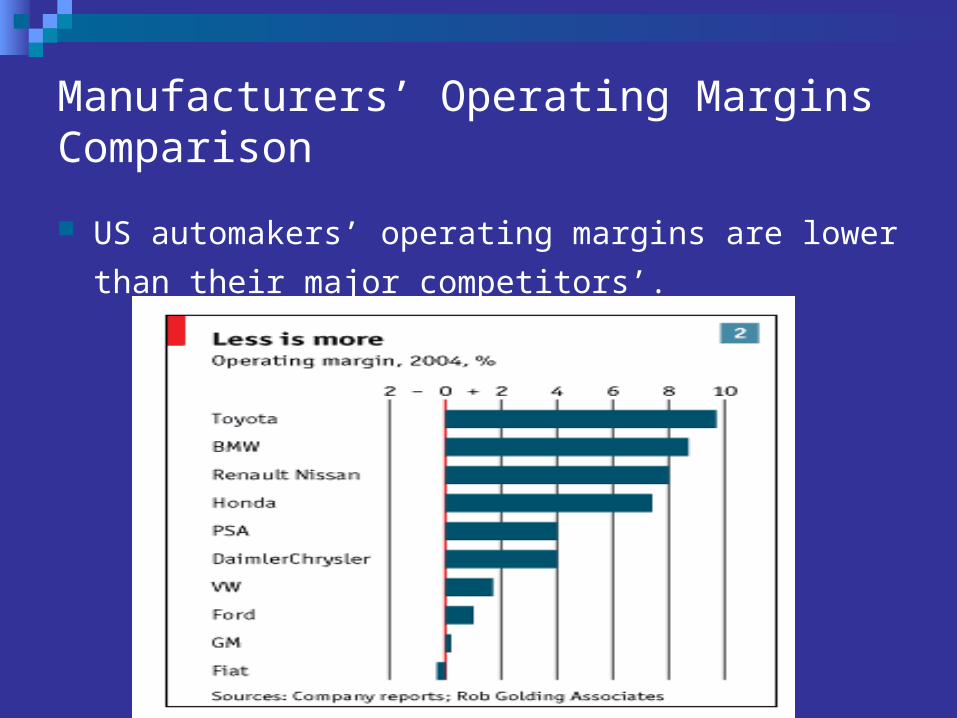
Manufacturers’ Operating Margins Comparison
US automakers’ operating margins are lower than their
major competitors’.
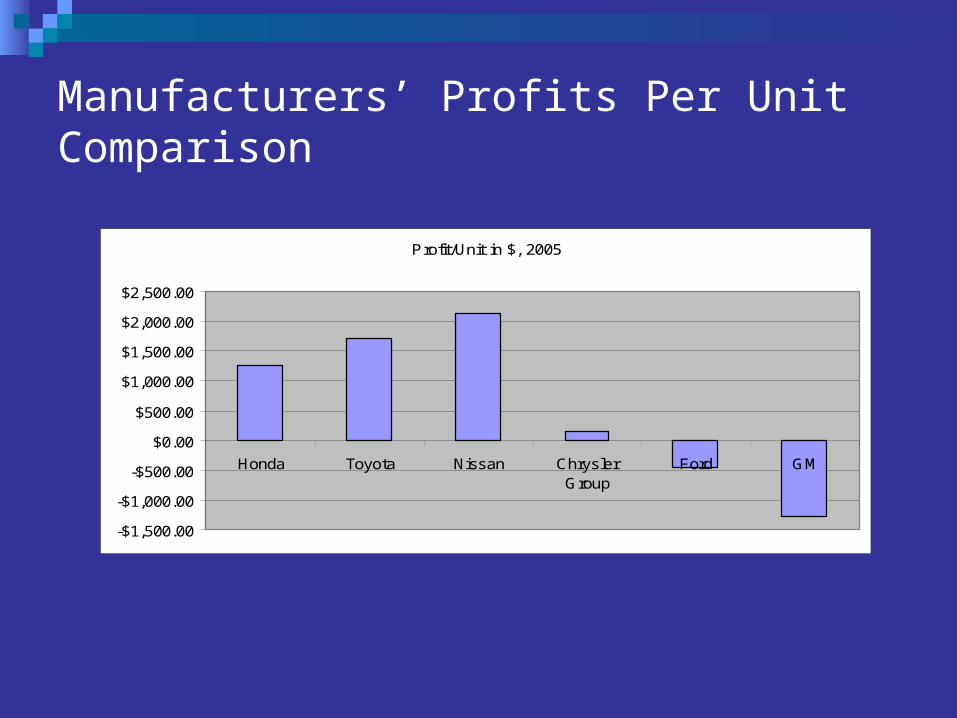
Manufacturers’ Profits Per Unit Comparison
Profit/Unit in $, 2005
-$1,500.00
-$1,000.00
-$500.00
$0.00
$500.00
$1,000.00
$1,500.00
$2,000.00
$2,500.00
Honda Toyota Nissan ChryslerGroup
Ford GM
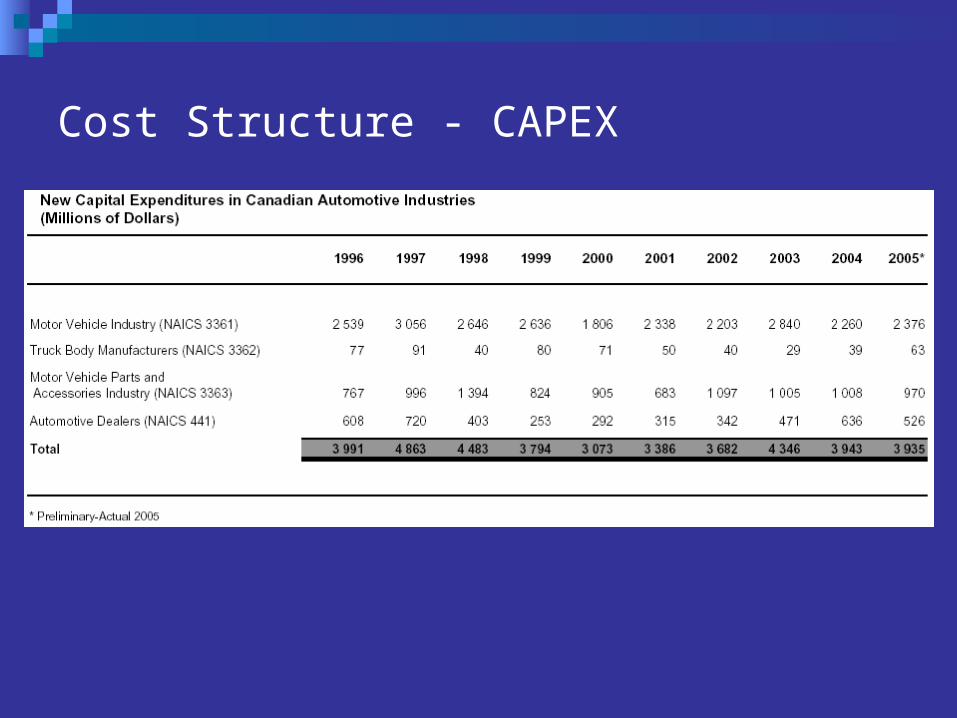
Cost Structure - CAPEX
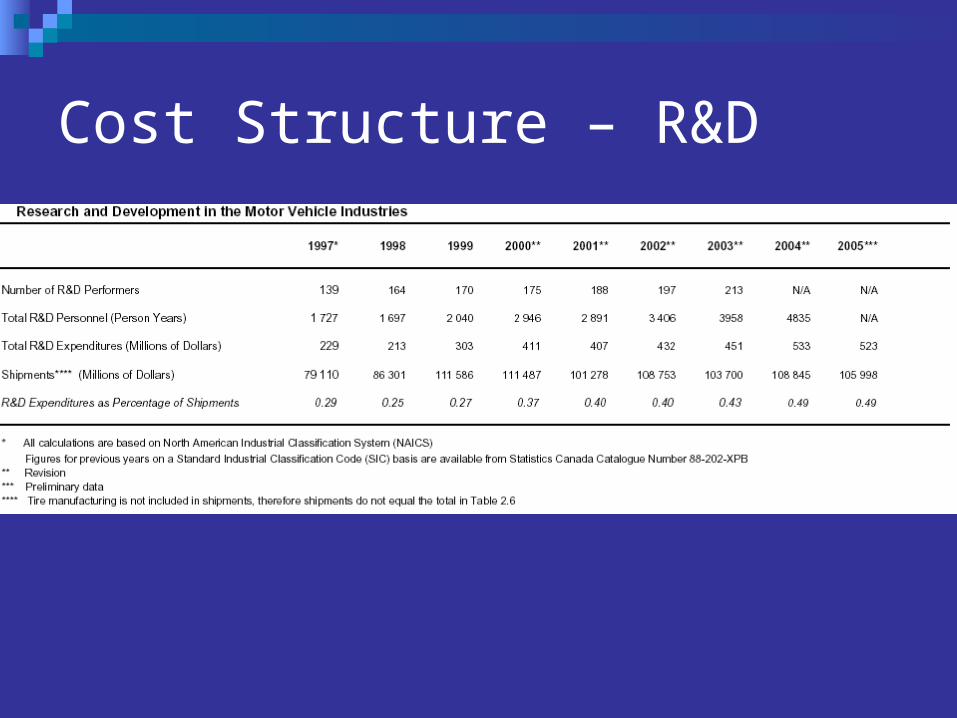
Cost Structure – R&D

Cost Structure – Health & Pension
The U.S. “Big Three” reported that pension and health cost them $1,500 per vehicle produced currently.


Interoperability Costs
Imperfect interoperability impose costs due to higher costs of design and production and slower implementation of design changes.

Vehicle Ownership Forecast

U.S. Market Forecast

Auto Market Forecast


Global Auto Sales Forecast
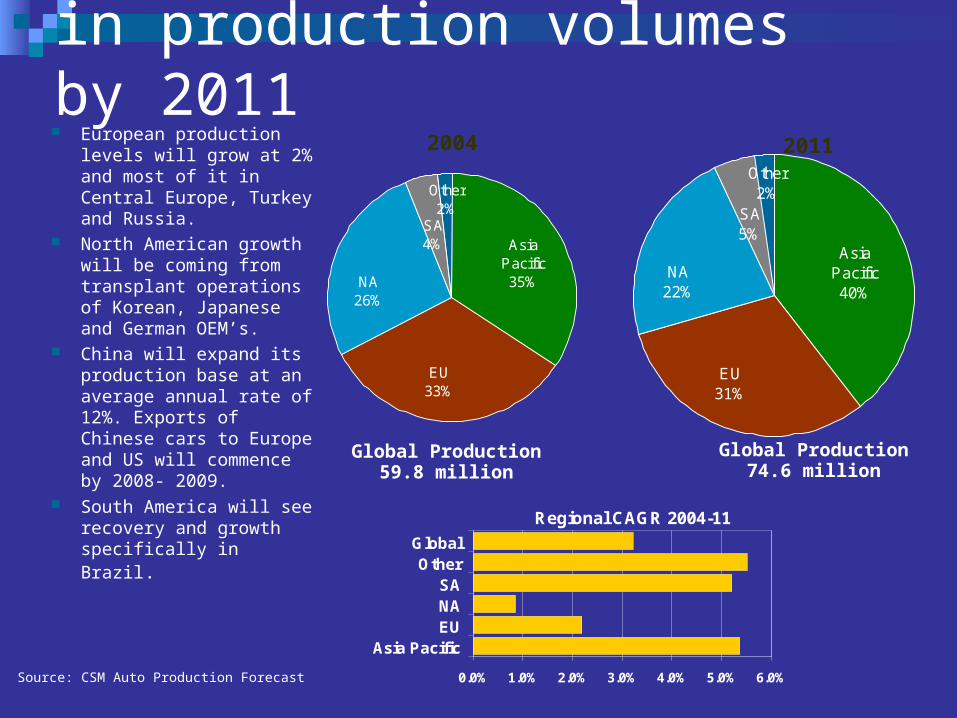
Other2%
NA26%
EU33%
Asia Pacific35%
SA4%
2004 2011
Global Production 59.8 million
Global Production 74.6 million
Asia Pacific will lead in production volumes by 2011 European production
levels will grow at 2% and most of it in Central Europe, Turkey and Russia.
North American growth will be coming from transplant operations of Korean, Japanese and German OEM’s.
China will expand its production base at an average annual rate of 12%. Exports of Chinese cars to Europe and US will commence by 2008- 2009.
South America will see recovery and growth specifically in Brazil.
Source: CSM Auto Production Forecast
Regional CAGR 2004-11
0.0% 1.0% 2.0% 3.0% 4.0% 5.0% 6.0%
Asia PacificEUNASA
OtherGlobal
Other2%
SA5%
Asia Pacific40%
EU31%
NA22%
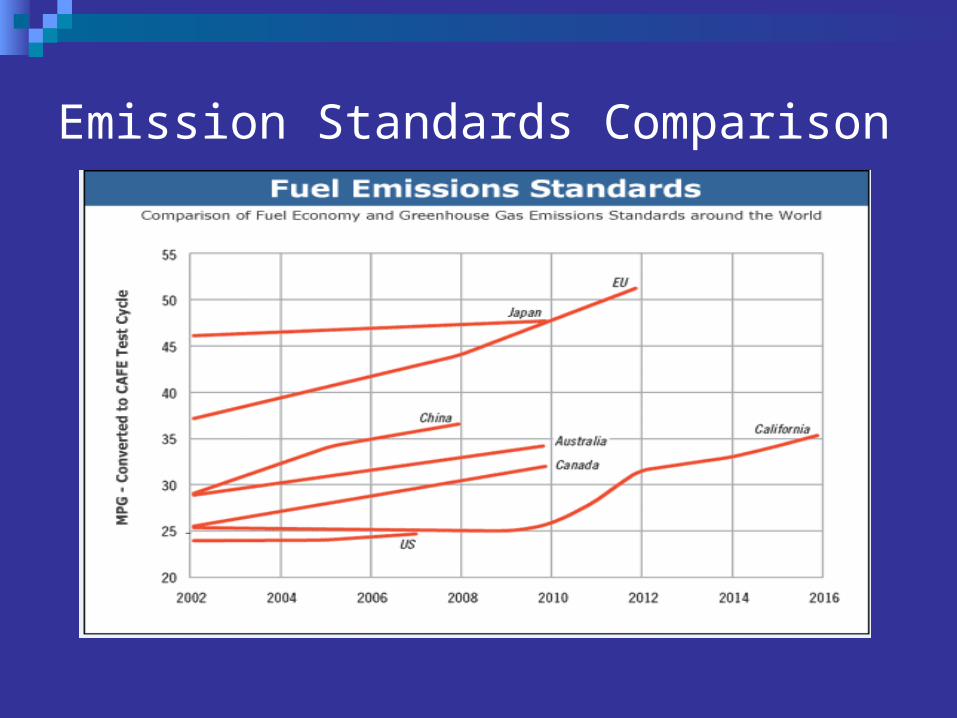
Emission Standards Comparison

Emission Standards Comparison “ACEA agreement” is a voluntary agreement between European
automobiles manufacturers association and the European Commissions. Its goal is to reduce 25% of 1995’s level of vehicle CO2 emissions by 2008. Automakers are questioned for failing to deliver the emissions cut.- Japan automakers joined the agreement later and aimed to reduce 23% in vehicle CO2 emissions by 2010 (from 1995 levels).
Australia: voluntary commitment to improve fuel economy by 18% by 2010.
Canada: has proposed a 25% improvement in fuel economy by 2010.
China: Introduced new fuel economy standards in 2004; weight-based standards to be introduced in 2 phases (2005 and 2008).
California: CARB approved GHG emissions reductions for automobiles, currently under legislative review.
New York: Clean Cars Bill proposing to follow California standards is currently in committee. Several other NE states have indicated they will follow CA’s lead.

Emission Standards Comparison
However, automakers are questioned for failing to deliver the emissions cut.
Nissan, Suzuki, Mazda, Audi, Volvo, BMW and Volkswagen are the worst performers among a group of 20 manufacturers surveyed by the Institute for European Environmental Policy (IEEP) for T&E, the European Federation for Transport and the Environment.
There will be additional manufacturing associated with CO2 emission constraints.

BMW Group

BMW GroupSymbol : Common [BMW] Preferred [BMW3]Primary Exchange: FrankfurtCurrency: Euro ($1 EUR = $1.27 USD)
Key Share Information:

Common Stock Price (BMW)[Price in Euros]
Last: $43.92 Change: $ -0.16 %Change: -0.36
Date: Nov. 23, 2006
Open: 44.10 Bid: N/AHigh: 44.36 Ask: N/ALow: 43.86 EPS: 4.23Volume: 21,311P/E: 10.4352 Week 52 Week High: 45.97 Low: 35.68Yield: 1.45% Beta: 0.80Dividend per share: 0.64

BMW Common Stock 5 Year Performance
Source: Deutsche Börse AG / Interactive Data Managed Solutions
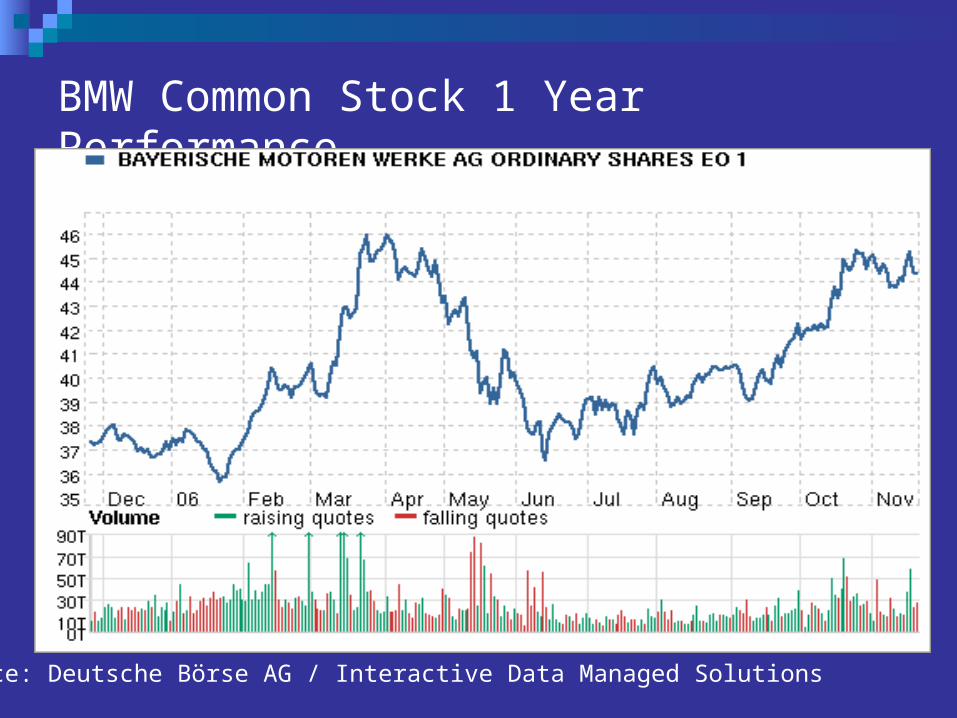
BMW Common Stock 1 Year Performance
Source: Deutsche Börse AG / Interactive Data Managed Solutions
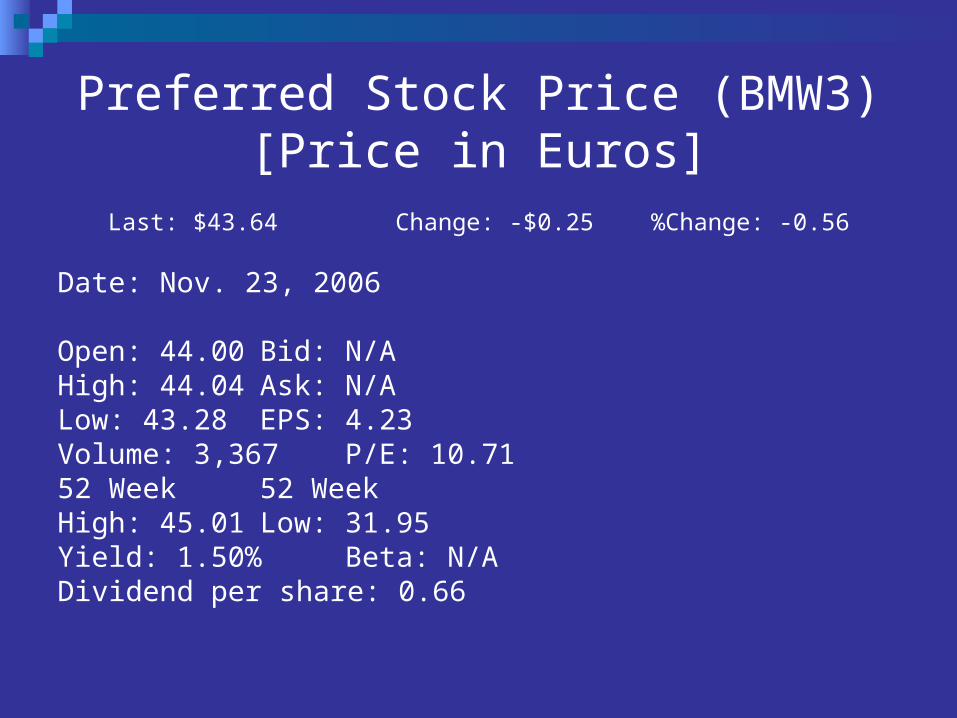
Preferred Stock Price (BMW3)[Price in Euros]
Last: $43.64 Change: -$0.25 %Change: -0.56
Date: Nov. 23, 2006
Open: 44.00 Bid: N/AHigh: 44.04 Ask: N/ALow: 43.28 EPS: 4.23Volume: 3,367 P/E: 10.7152 Week 52 Week High: 45.01 Low: 31.95Yield: 1.50% Beta: N/ADividend per share: 0.66
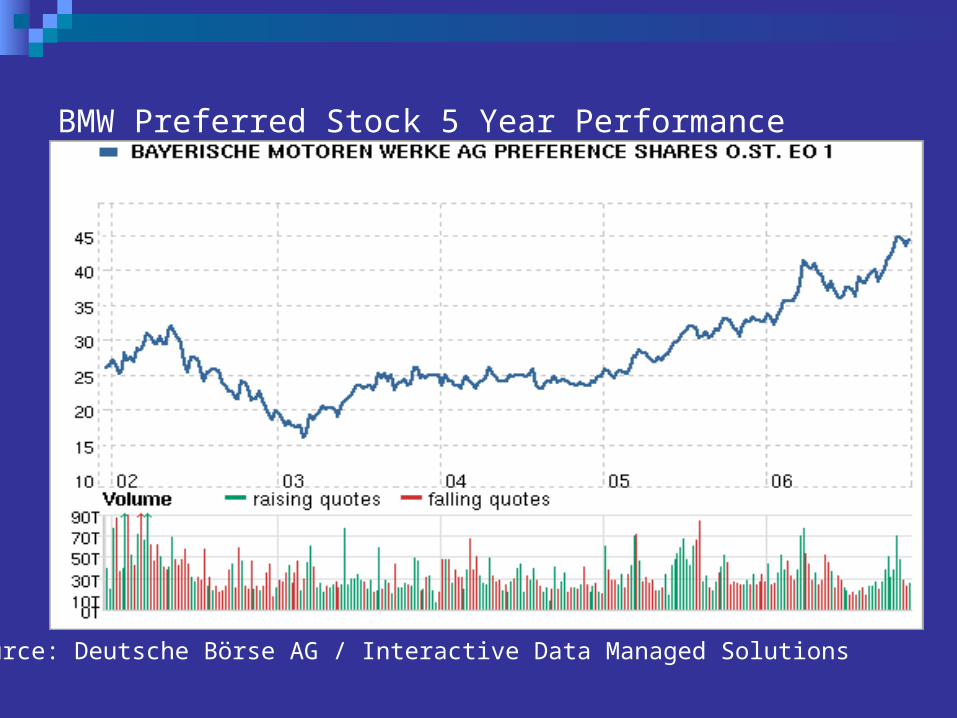
BMW Preferred Stock 5 Year Performance
Source: Deutsche Börse AG / Interactive Data Managed Solutions

BMW Preferred Stock 1 Year Stock Performance
Source: Deutsche Börse AG / Interactive Data Managed Solutions

Company Overview
Established in 1916, originally founded as an aircraft engine manufacturer Head offices located in Munich, Germany One of the top 10 largest vehicle manufacturers in the world Produces automobiles and motorbikes under the following premium brands:
BMW also operates successfully in the areas of financial services such as financing/leasing and asset management
Conducts sales in approximately 40 international markets Has 15 production facilities spanning 7 countries Employs over 100,000 people globally
Important Company Milestones
1972 - BMW ventures into South Africa and sets up first production plant outside Germany
1992 – BMW ventures into North American and sets up first production plant in South Carolina
1994 – BMW acquires the British based Rover Group, landing the brands Rover, Land Rover, MINI, and MG
1998 – BMW acquires the Rolls-Royce brand from Volkswagen Group; however, vehicle production is prohibited until 2003
2000 – BMW sells the Rover brands at a loss; however, holds onto the MINI brand
2001 – BMW successfully introduces the MINI brand into the market 2003 – BMW re-launches the Rolls-Royce brand with the introduction of the
$330,000 USD Phantom 2004 – BMW ventures into Asia and builds production plant in Shenyang,
China

Company Management
Dr. Norbert Reithofer
Current Chairman of the Board of Management as of September 1, 2006 Born in 1956
- 1991 - 1994 Director of the Body-in-White Production Division - 1994 - 1997 Technical Director BMW South Africa - 1997 - 2000 President BMW Manufacturing Corporation, USA (South Carolina) - 2000 - 2006 Member of the Board of Management; Production
Company Management
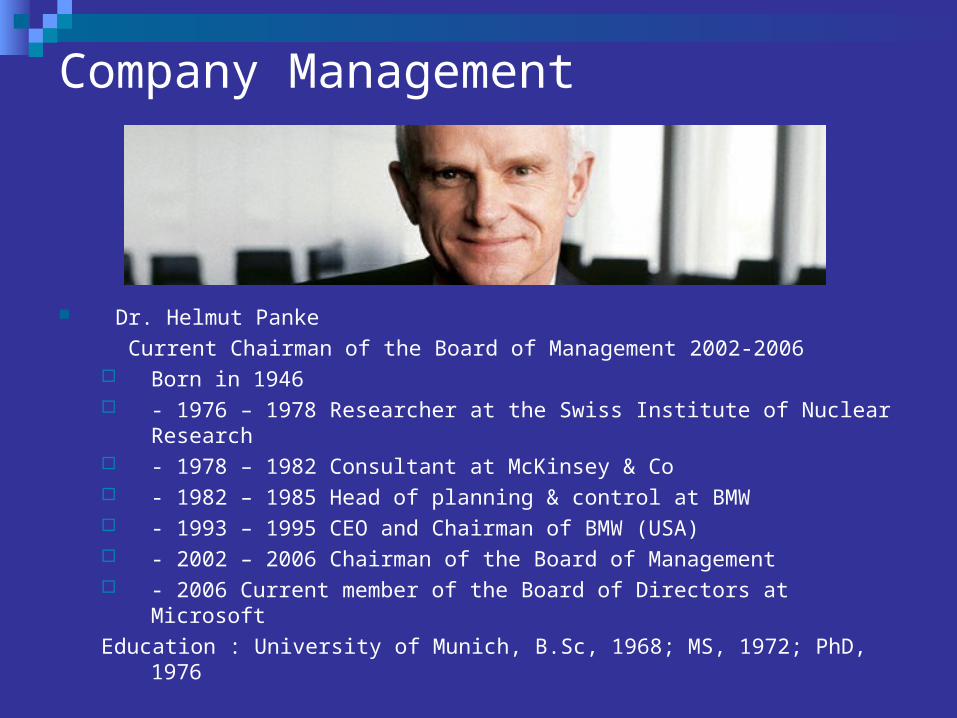
Dr. Helmut Panke
Current Chairman of the Board of Management 2002-2006 Born in 1946 - 1976 – 1978 Researcher at the Swiss Institute of Nuclear Research - 1978 – 1982 Consultant at McKinsey & Co - 1982 – 1985 Head of planning & control at BMW - 1993 – 1995 CEO and Chairman of BMW (USA) - 2002 – 2006 Chairman of the Board of Management - 2006 Current member of the Board of Directors at Microsoft
Education : University of Munich, B.Sc, 1968; MS, 1972; PhD, 1976

BMW Group Shareholder Structure Overview
17.4
16.7
12.5
53.4
Stefan Quandt
Johanna Quandt
Susanne Klatten
Free Floating
STEFAN QUANT JOHANNA QUANDT SUSANNE KLATTEN
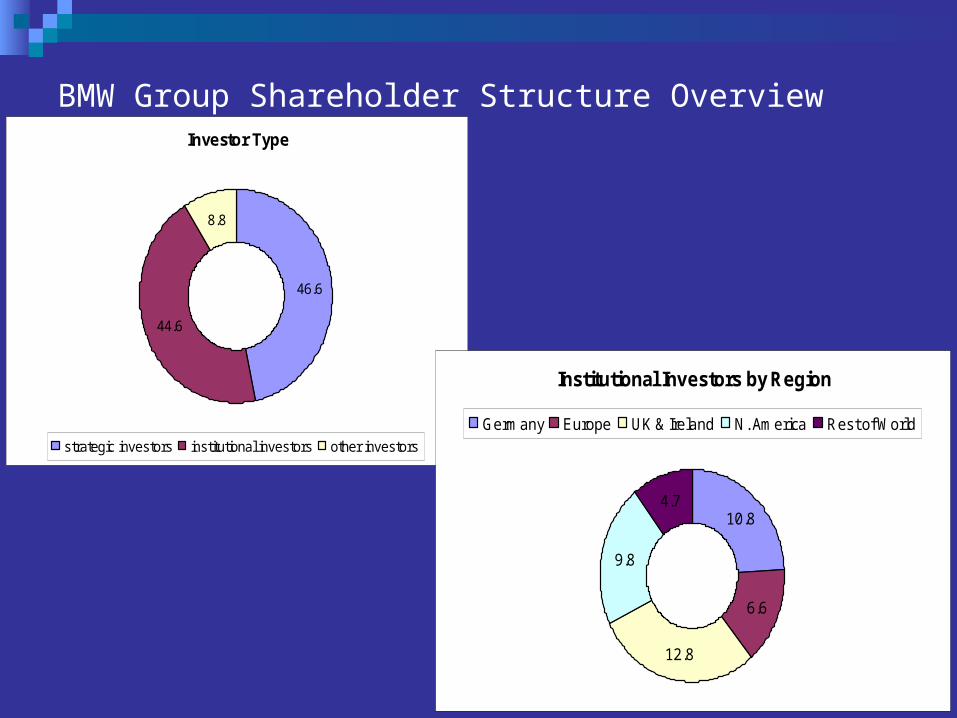
BMW Group Shareholder Structure OverviewInvestor Type
46.6
44.6
8.8
strategic investors institutional investors other investors
Institutional Investors by Region
10.8
6.6
12.8
9.8
4.7
Germany Europe UK & Ireland N. America Rest of World

BMW Share Buyback Program Approved by shareholders on May 12, 2005
BMW to buyback common shares up to a maximum of 10% of the company share capital
By the end 2005, 13,488,400 common shares have been bought back (equivalent to 2% of the company’s share capital)
Average price paid per share $37.49
Approximate total cost for the share buyback program in 2005: $506 million
In 2006, up to 1.5 millions shares of preferred stock will be bought back for employee stock plan
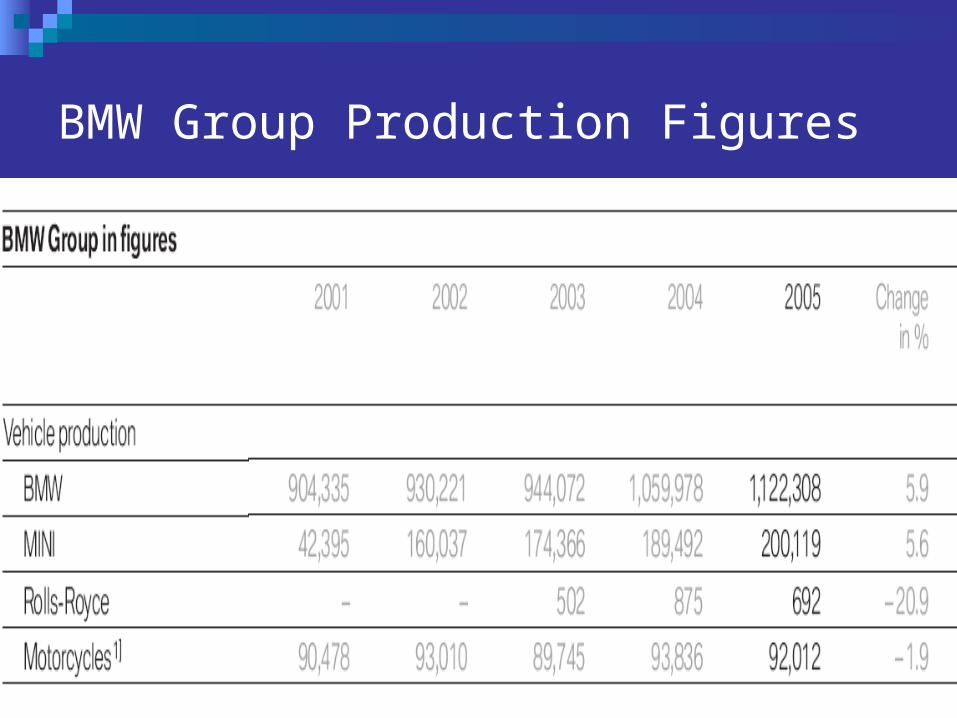
BMW Group Production Figures


BMW Group Vehicle Model Analysis

BMW Group Key Motorcycle Markets 2005• Sales of motorcycles are down 2% from last year
• Inconsistent market development throughout 2005
Large increase in sales throughout most of Western Europe
Sales up 48% in Spain, 22% U.K. and 12% Italy
Sales down 9% in Germany
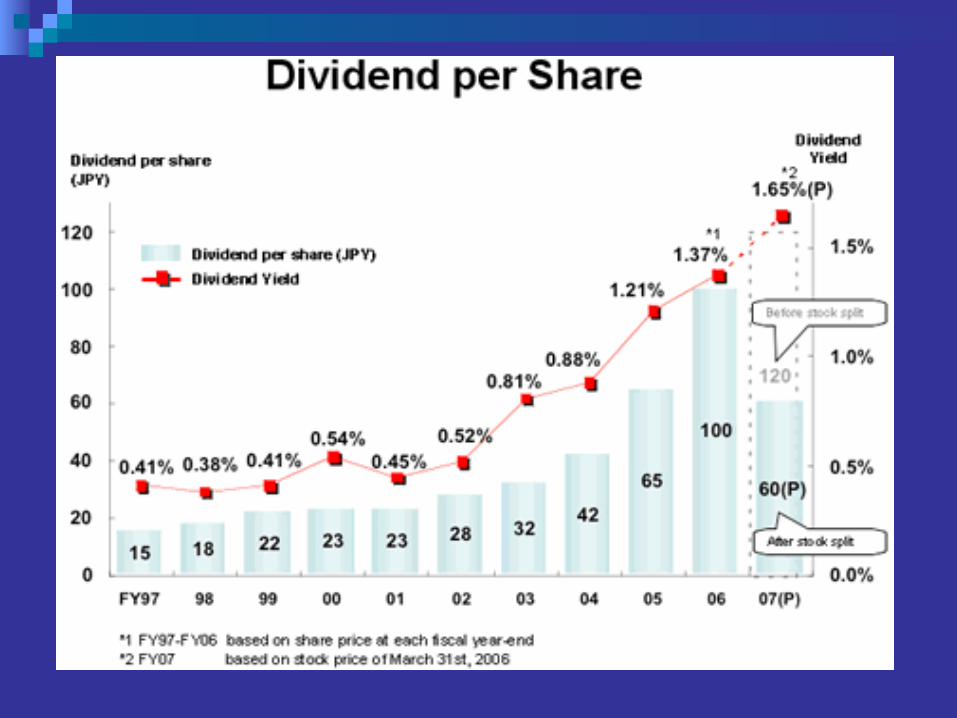
0.4
0.46
0.52 0.52
0.58
0.620.64
0.42
0.48
0.55 0.55
0.6
0.640.66
0
0.1
0.2
0.3
0.4
0.5
0.6
0.7
1999 2000 2001 2002 2003 2004 2005
Date
Eu
ro Common shares
Preferred shares
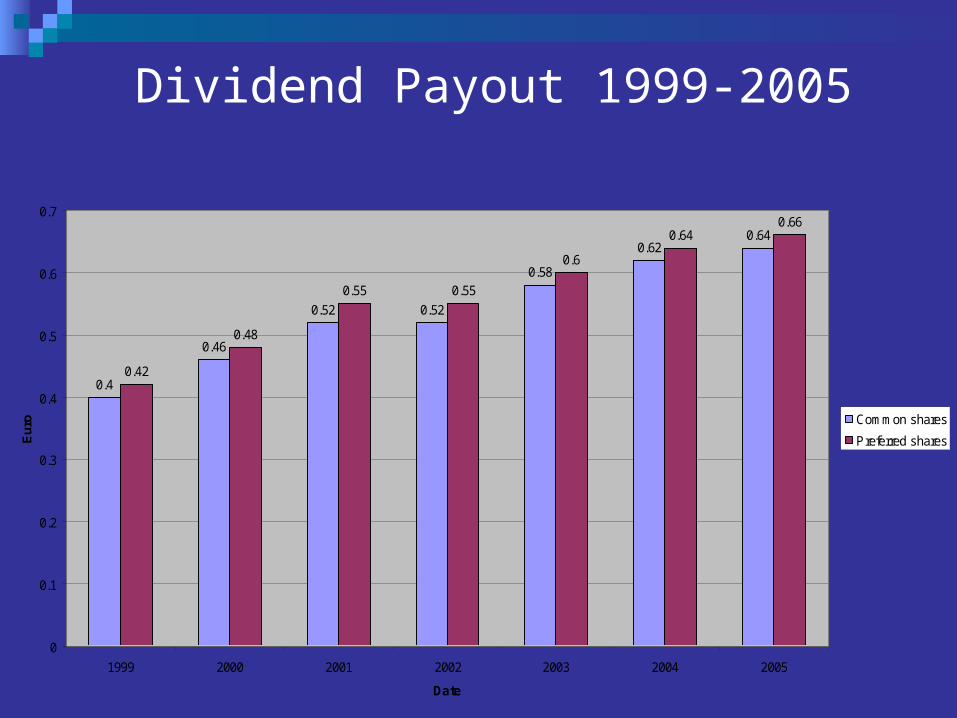
Dividend Payout 1999-2005
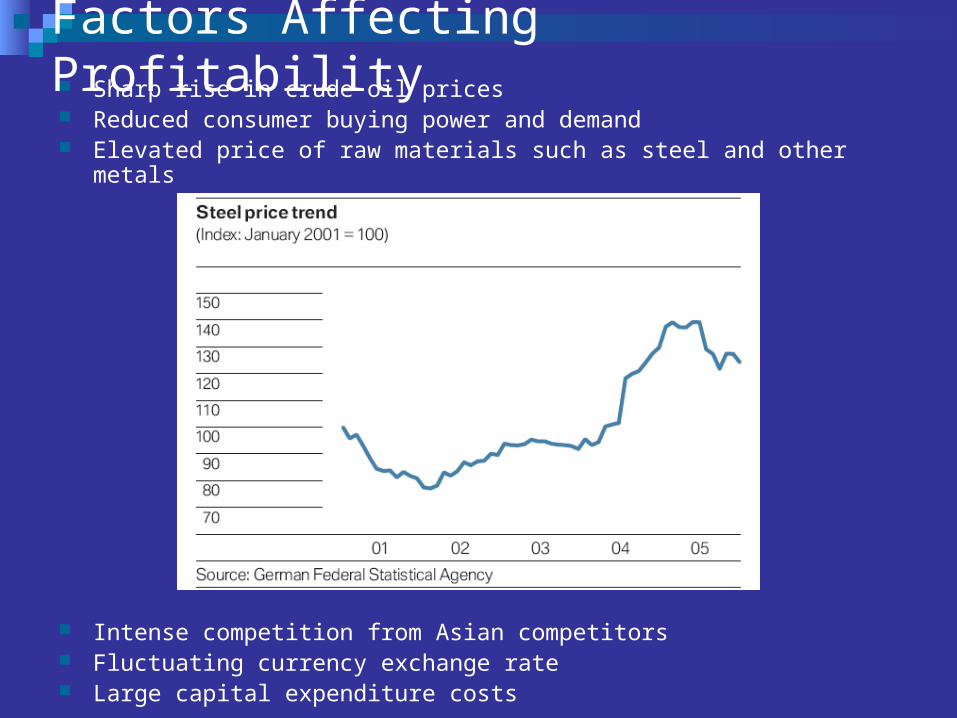
Factors Affecting Profitability Sharp rise in crude oil prices Reduced consumer buying power and demand Elevated price of raw materials such as steel and other metals
Intense competition from Asian competitors Fluctuating currency exchange rate Large capital expenditure costs
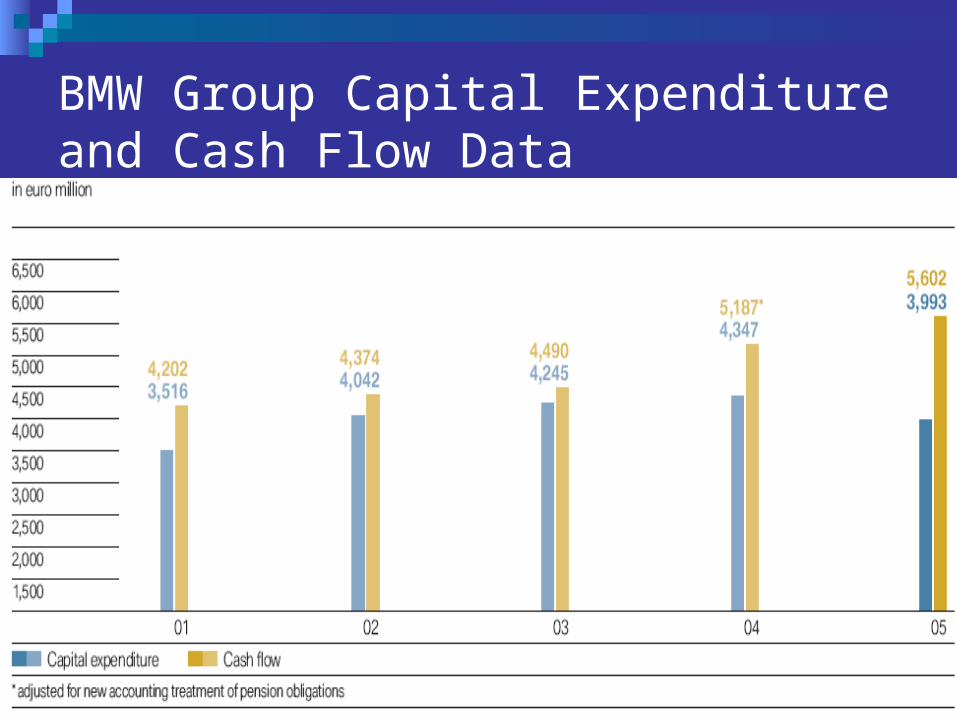
BMW Group Capital Expenditure and Cash Flow Data

Financial Statements

BMW Group Income Statement for the period of January 1 to September 30, 2006

BMW Group Income Statement for 3rd Quarter

BMW Group Cash Flow Statement for the period January 1 to September 30, 2006
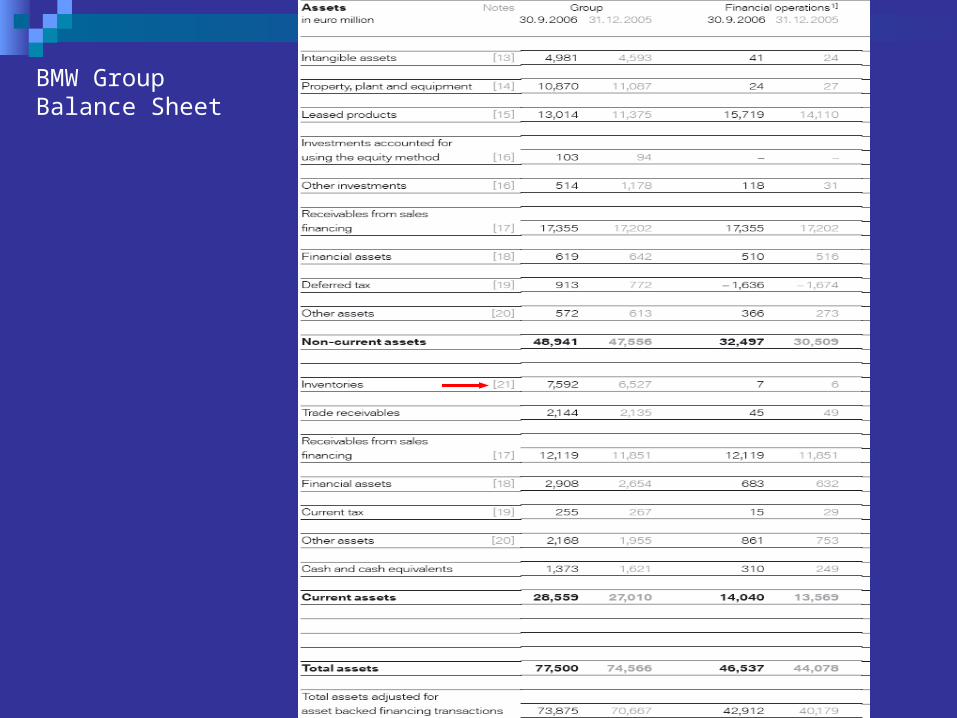
BMW Group Balance Sheet

BMW Group Balance Sheet

BMW Group Growth Strategies Objective: increase volume of automobiles sold
Producing more fuel efficient vehicles

BMW Group Growth Strategies
Increasing consumer demand with by producing safer and more reliable vehicles
BMW NightVision

BMW Group Growth Strategies Introduction of the first luxury hydrogen hybrid car 745hL
September 2005, BMW joins hybrid technology sharing partnership with GM and Mercedes to build gas-electric engines

BMW Group Growth Strategies
Continued sales network expansion to meet the needs and demands of local consumer
Continue to penetrate the dynamic Asian markets Beginning preparation to enter the Indian market
Starting 2007, BMW will build a production plant in Chennai, India Move down market and target a younger demographic with less
income with the 1 series
1 Series arriving in N. America in late 2007

BMW Group Growth Strategies Continued roll out of new updated versions of existing vehicle
models BMW New redesigned 3 series launched late 2005 New redesigned X5 launches late November 2006 New redesigned 7 series launches 2008
MINI New redesigned MINI Cooper launches late November 2006
Rolls Royce New convertible and coupe version of Phantom available late 2007

Fisher’s Analysis
1) Financial Skill- Great financial performance with increasing profits- Industry product leadership
2) People Factor- Great management team; relatively good employee relationship
3) Investment Characteristics- Limited growth space due to intense competition- Low industry profit margin
4) Investment Price- P/E ratio is relatively low

HOLD
Recommendation

Honda Motor Co., Ltd.

Agenda
Current Financial Position Company Analysis Financial Analysis
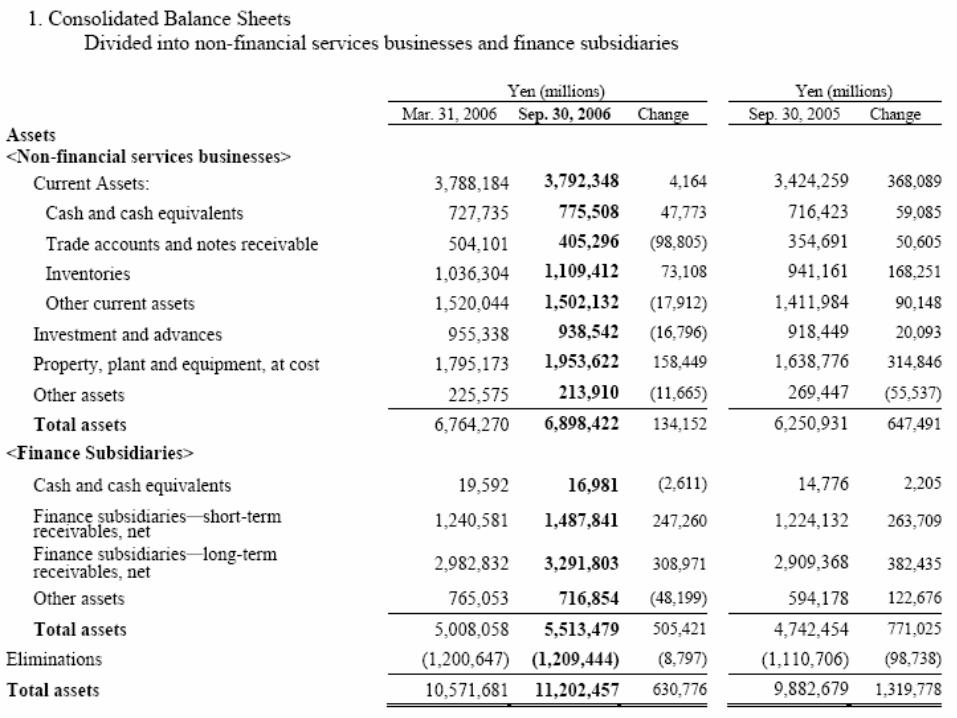
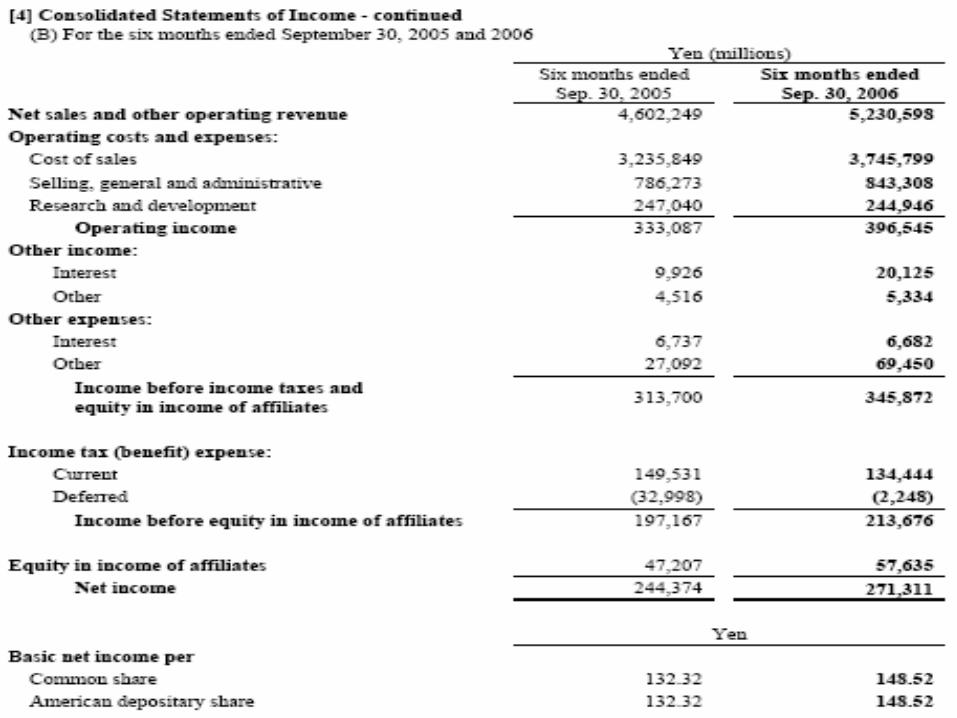
Semi-annual Financial StatementsAnnual Financial Statements
Fisher’s Analysis Recommendation
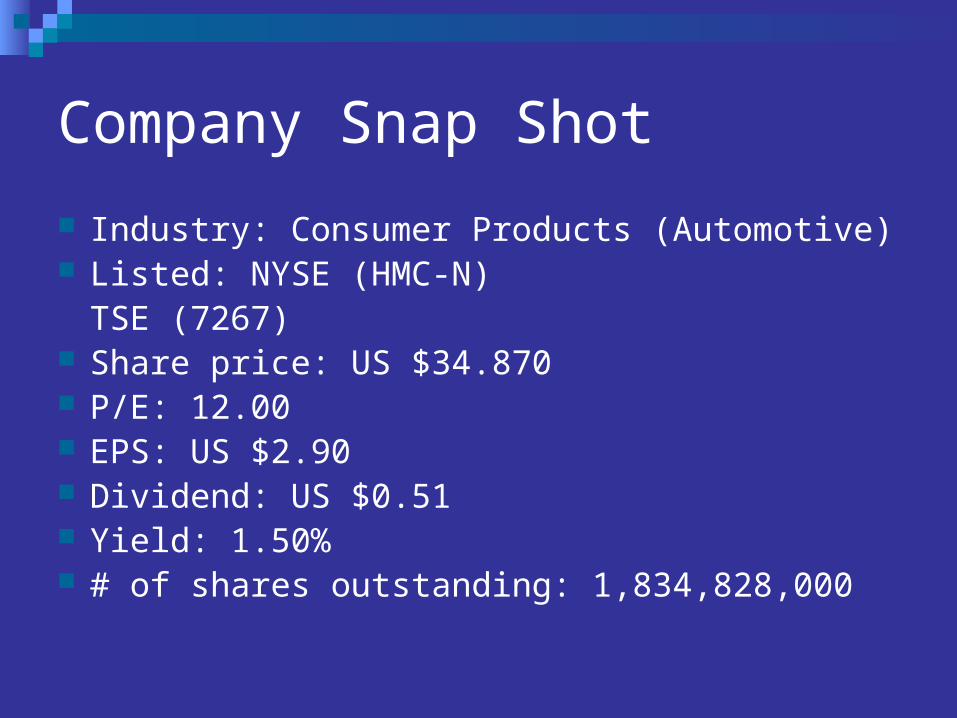
Company Snap Shot
Industry: Consumer Products (Automotive) Listed: NYSE (HMC-N)
TSE (7267) Share price: US $34.870 P/E: 12.00 EPS: US $2.90 Dividend: US $0.51 Yield: 1.50% # of shares outstanding: 1,834,828,000
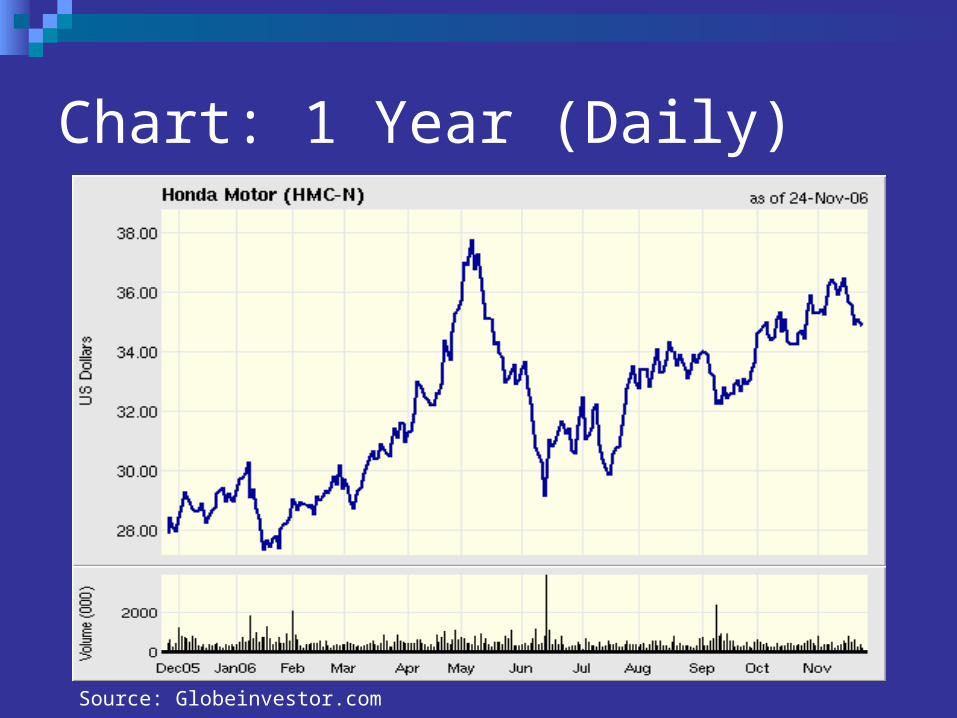
Chart: 1 Year (Daily)
Source: Globeinvestor.com

Chart: 10 Years (Weekly)
Source: http://money.cnn.com/
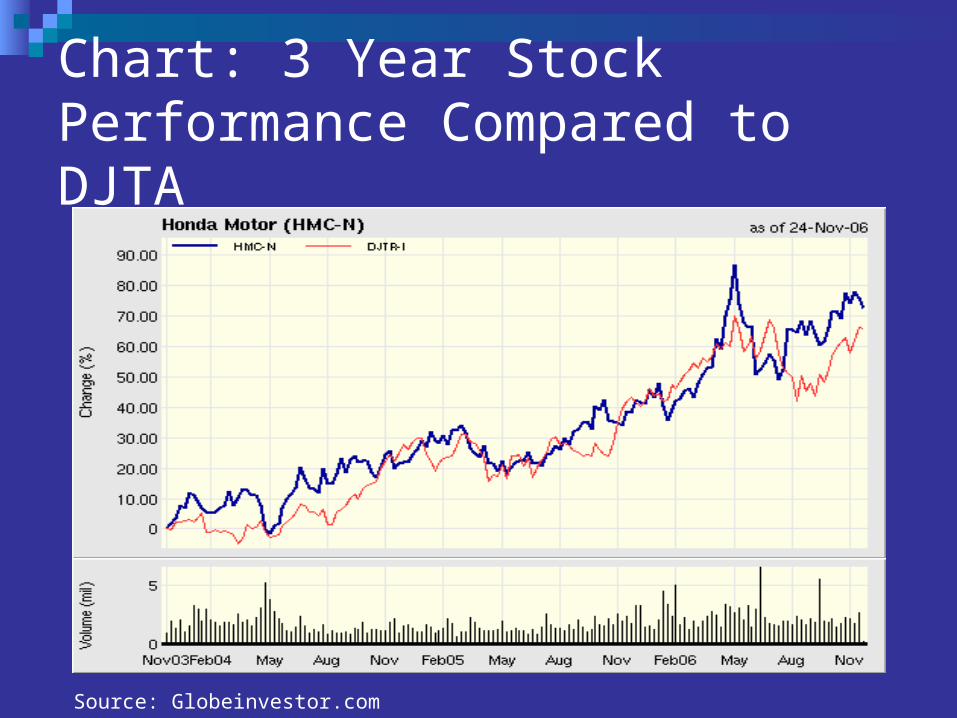
Chart: 3 Year Stock Performance Compared to DJTA
Source: Globeinvestor.com

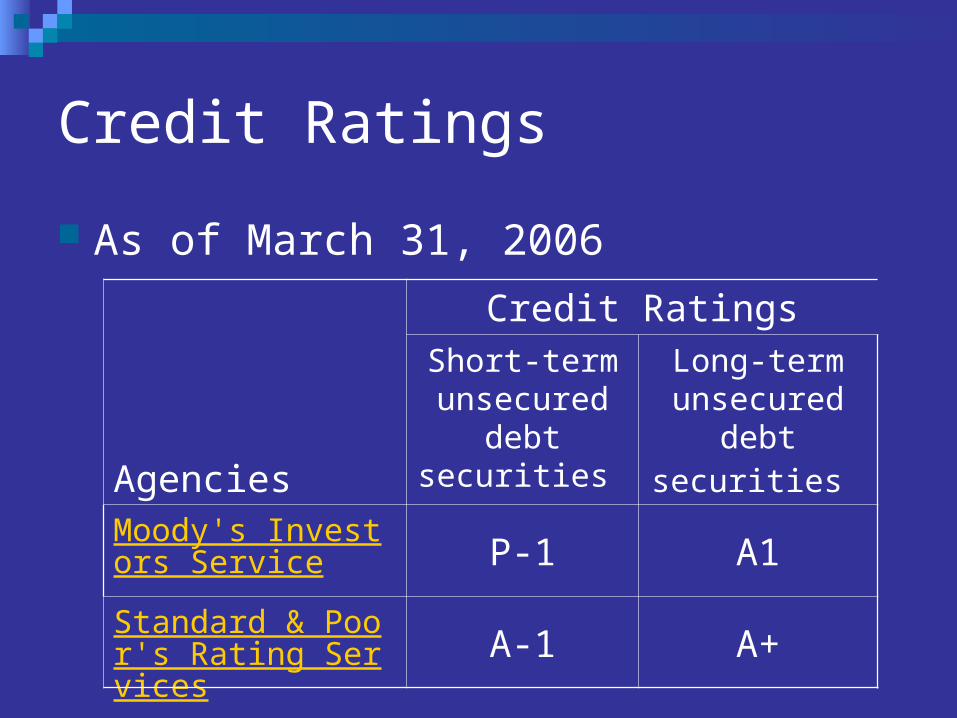
Credit Ratings
As of March 31, 2006
Agencies
Credit RatingsShort-termunsecured
debt securities
Long-termunsecured
debt securities Moody's Investors Service
P-1 A1
Standard & Poor's Rating Services
A-1 A+

Company Analysis
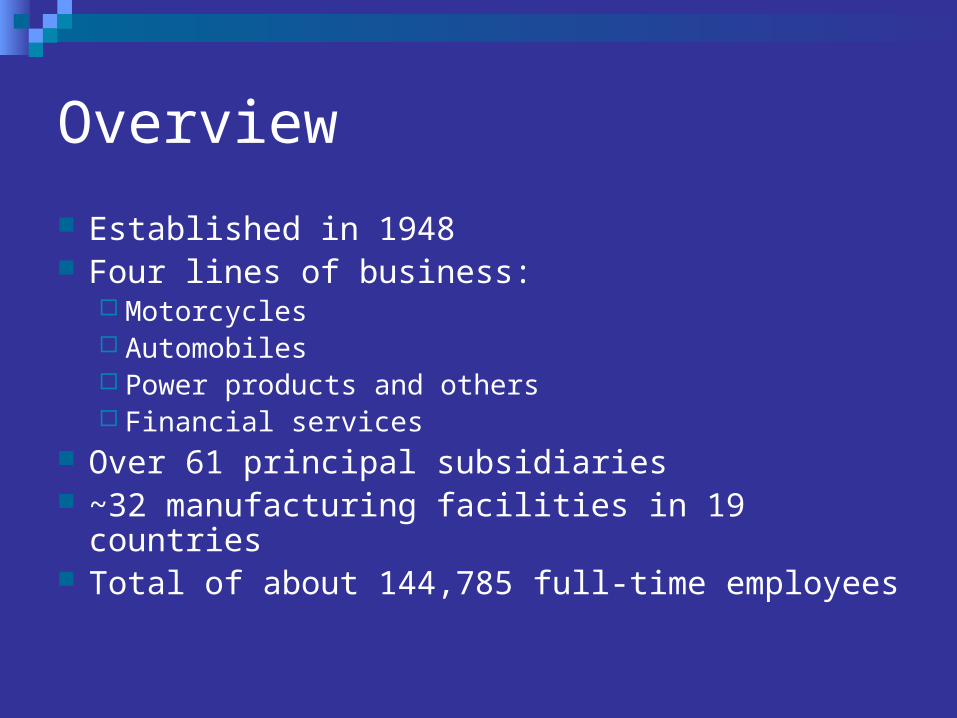
Overview
Established in 1948 Four lines of business:
Motorcycles Automobiles Power products and others Financial services
Over 61 principal subsidiaries ~32 manufacturing facilities in 19 countries Total of about 144,785 full-time employees

History
1948 Honda Motor Co., Ltd. incorporated (capital: 1 million yen)
1949 First motorcycle manufactured
1953 H-type engine, Honda’s first power product, produced
1957 Listed on the Tokyo Stock Exchange
1962 ADRs issued at market price. Adopts consolidated accounting using U.S. SEC standards
1963 Honda’s first sports car (S500) and light truck (T360) released

History
1977 ADRs listed on the New York Stock Exchange (NYSE)Consolidated financial disclosure begins
1983 Cumulative automobile production reaches 10 million units
1995 Cumulative automobile production reaches 30 million units
2004 Honda enter cooperative agreement with GE to jointly market the independently developed HF118 jet engine
2006 Implementation of two-for-one stock split for common shares

Corporate Governance

Corporate Governance
Takeo Fukui President, CEO, and Rep Director An engineerJoined Honda since 1969President since 1998CEO since 2003
Satoshi AokiExecutive VP and Rep DirectorJoined Honda since 1969Promoted to Executive VP in summer 2005

Lines of Business
Motorcycles Automobiles Power products and Others Financial services

Fields of Business
Research & Development ASIMO HondaJet Next generation powertrains
Manufacturing & Distribution Local production plants to meet local demand
Sales & Services Emphasis on customer satisfaction
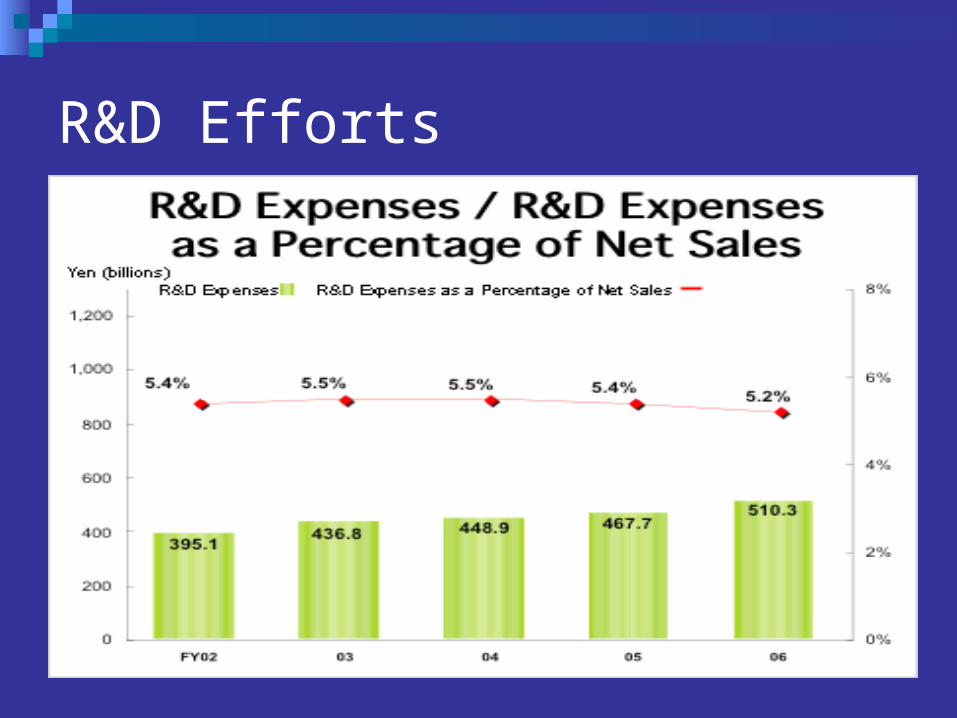
R&D Efforts

Key Regions of Operation Japan
Centers for R&D, manufacturing, and customer service North America
Honda’s overall largest market Europe
Increasing brand popularity Asia
China – increasing production facilities Others
Honda has over 80% market share in Brazilian motorcycle industry

Unit Sales Breakdown
~53% from motorcycles, ~17% from automobiles, and ~30% from power products
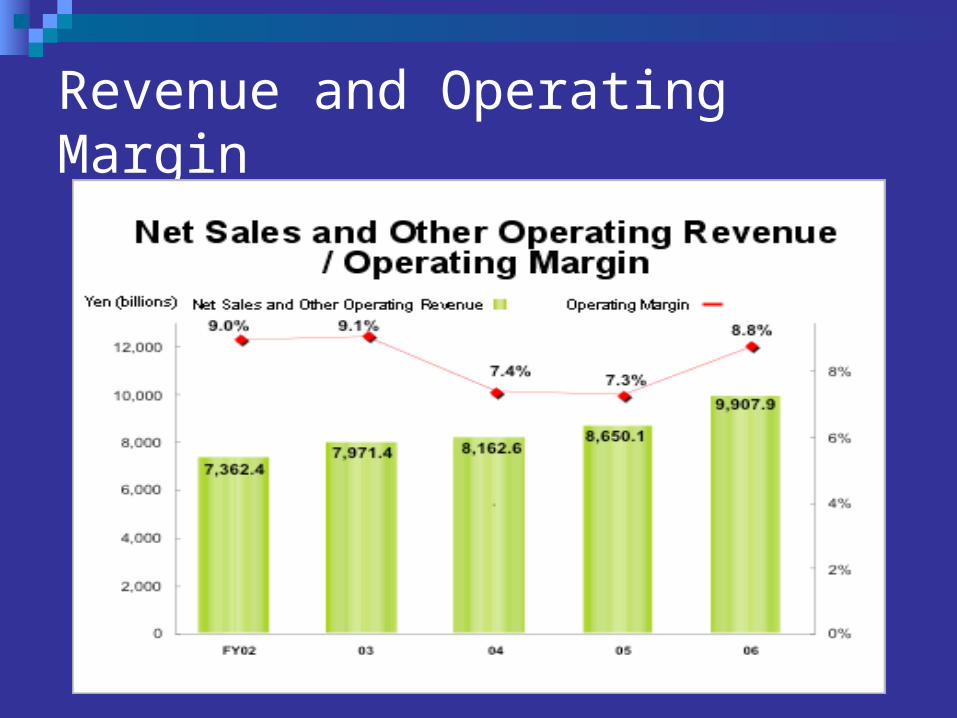
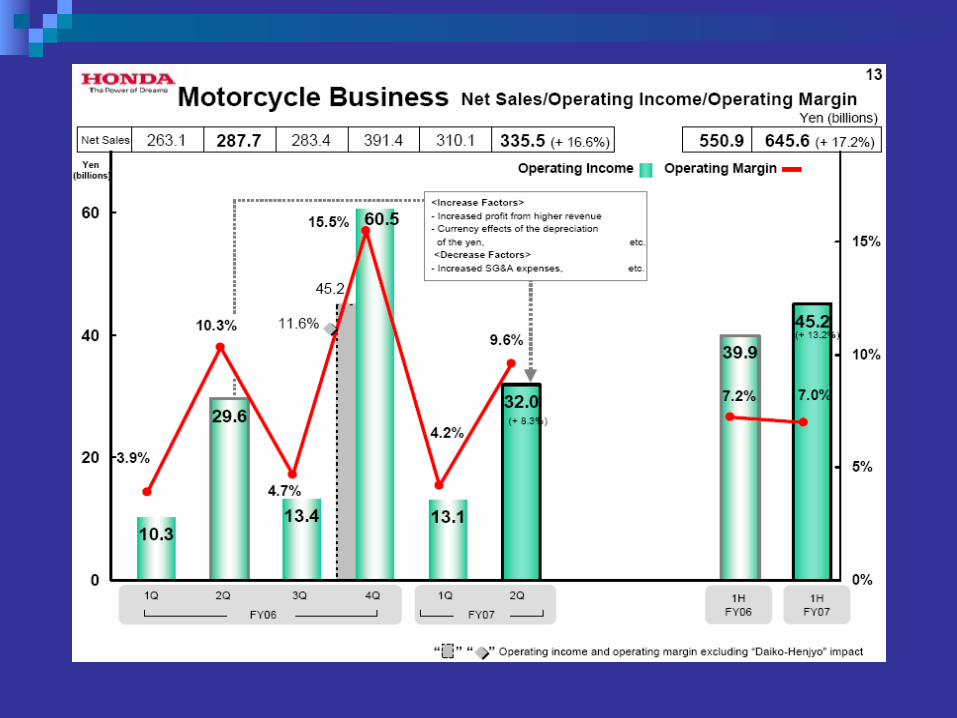
Revenue and Operating Margin
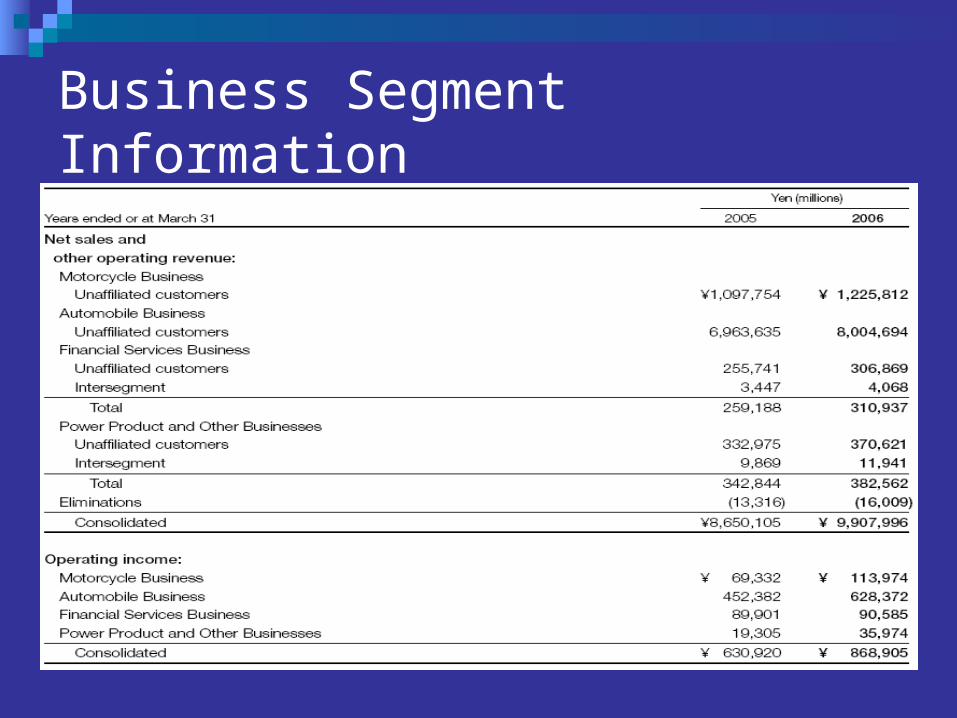
Business Segment Information

Revenue Breakdown by Business Segments (%)
0.00%
10.00%
20.00%
30.00%
40.00%
50.00%
60.00%
70.00%
80.00%
90.00%
2002 2003 2004 2005 2006
Motorcycle Business
Automobile Business
Financial Services
Power Products andOthers
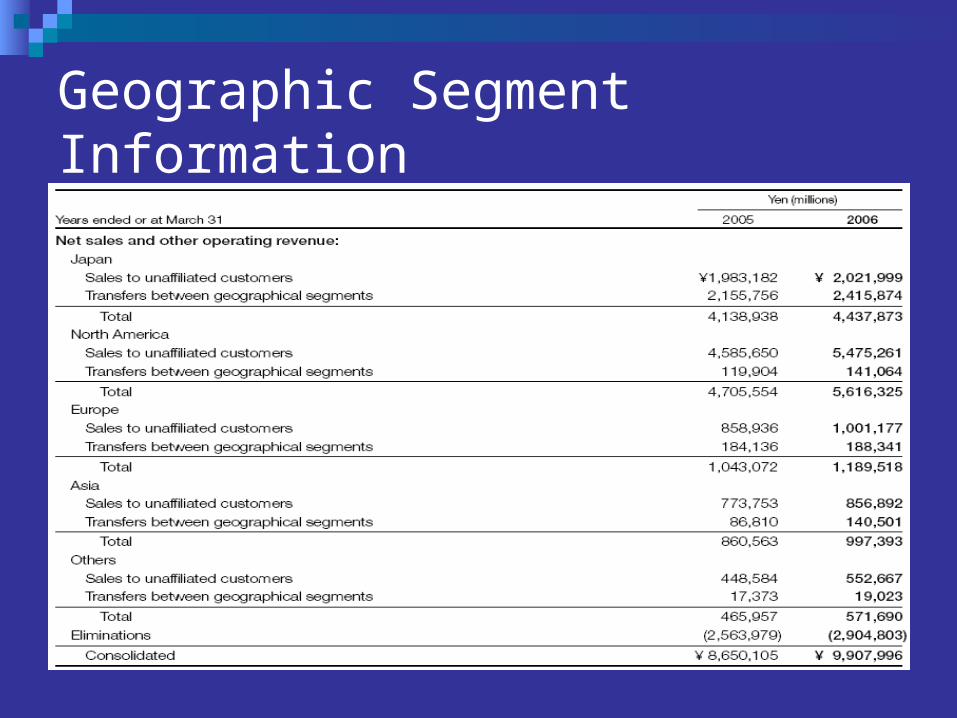
Geographic Segment Information
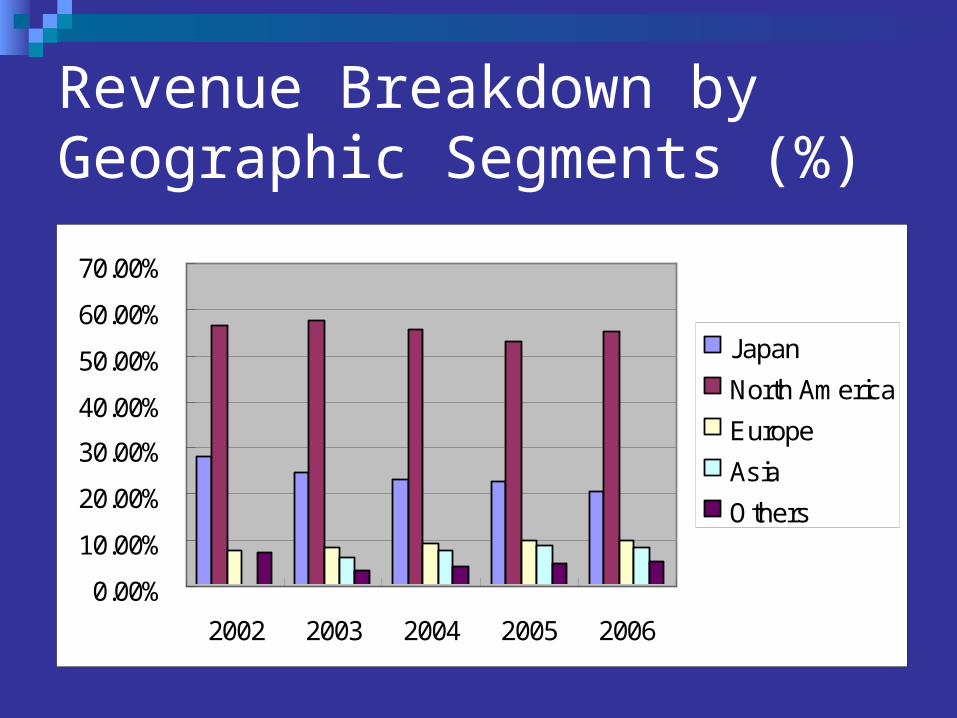
Revenue Breakdown by Geographic Segments (%)
0.00%
10.00%
20.00%
30.00%
40.00%
50.00%
60.00%
70.00%
2002 2003 2004 2005 2006
Japan
North America
Europe
Asia
Others
Risk Factors
Exchange and interest rate risks Market condition/Intensity of competition Political condition Relationship with suppliers of raw materials Legal and regulatory risks
Environmental and governmental regulations Patents and trademarks

Growth Strategies
Motorcycles Equipping scooters with automatic transmission Equipping more models with PGM-FI and other
features that provide superior environmental performance
Launching new models Offering the first motorcycles with airbags Increasing production capacity in Asia Beginning production in Argentina
2007 Sales forecast: 10,840,000 units
Growth Strategies
AutomobilesLaunching new model of SUV and refine
existing modelsExpanding light truck modelsExpanding sales and services centers in Asia to
meet increasing demandExpanding production capacity to meet demand
in Brazil 2007 Sales forecast: 3,720,000 units
Growth Strategies
Power productsSupplying cost-competitive general-purpose
engines from AsiaExtending sales of compact, home-use
cogeneration system from Japan to the US 2007 Sales forecast: 5,880,000 units

News
Nov. 21, 2006 2007 Honda CR-V and Pilot Earn Insurance
Institute for Highway Safety TOP SAFETY PICK Award
2007 Acura RDX Earns an Insurance Institute for Highway Safety TOP SAFETY PICK Award
Nov. 7, 2006 HondaJet Named Winner of Popular Science's 2006
Sept. 27, 2006 HondaJet Goes on Sale at National Business
Aviation Association Convention

Financial Analysis

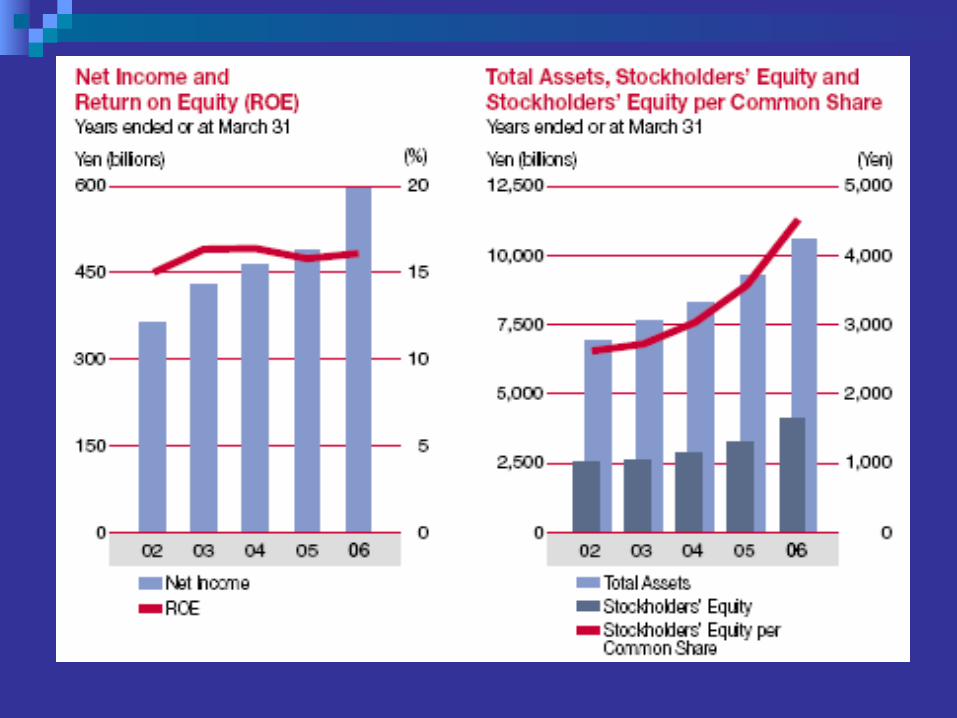
Financial Highlights

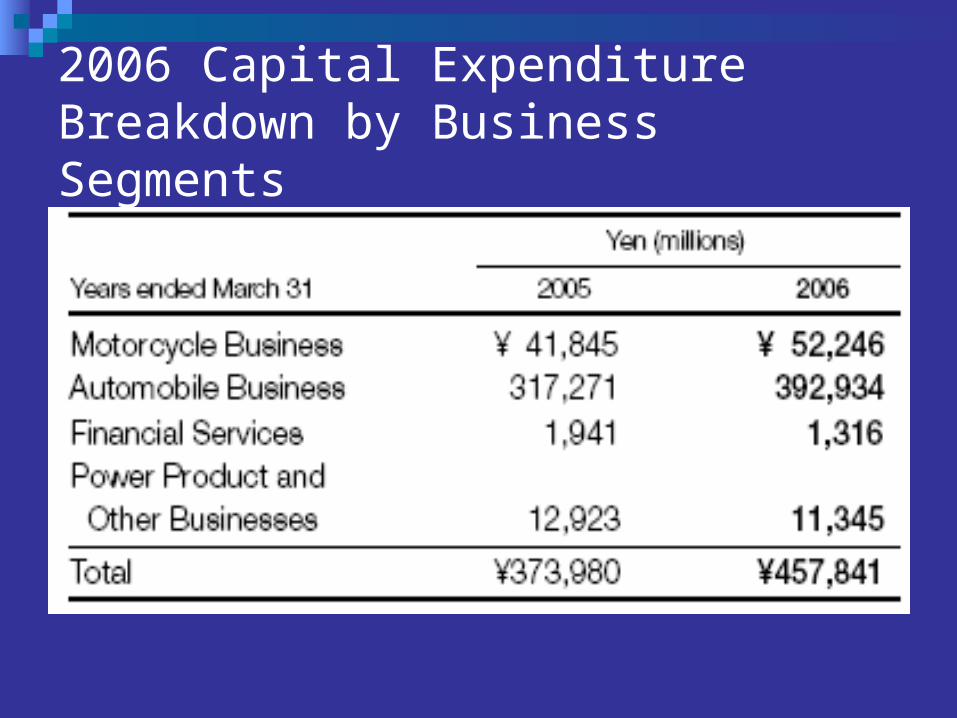
2006 Capital Expenditure Breakdown by Business Segments

Forecasted 2007 Cap. Ex. Breakdown by Business Segments

Semi-annual Financial Statements
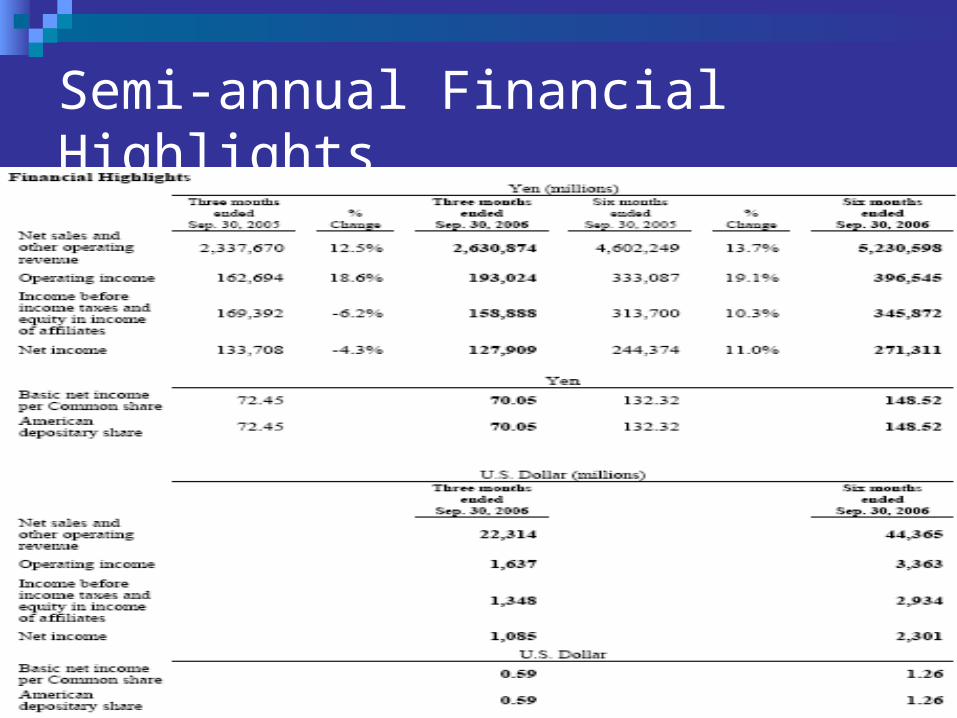
Semi-annual Financial Highlights

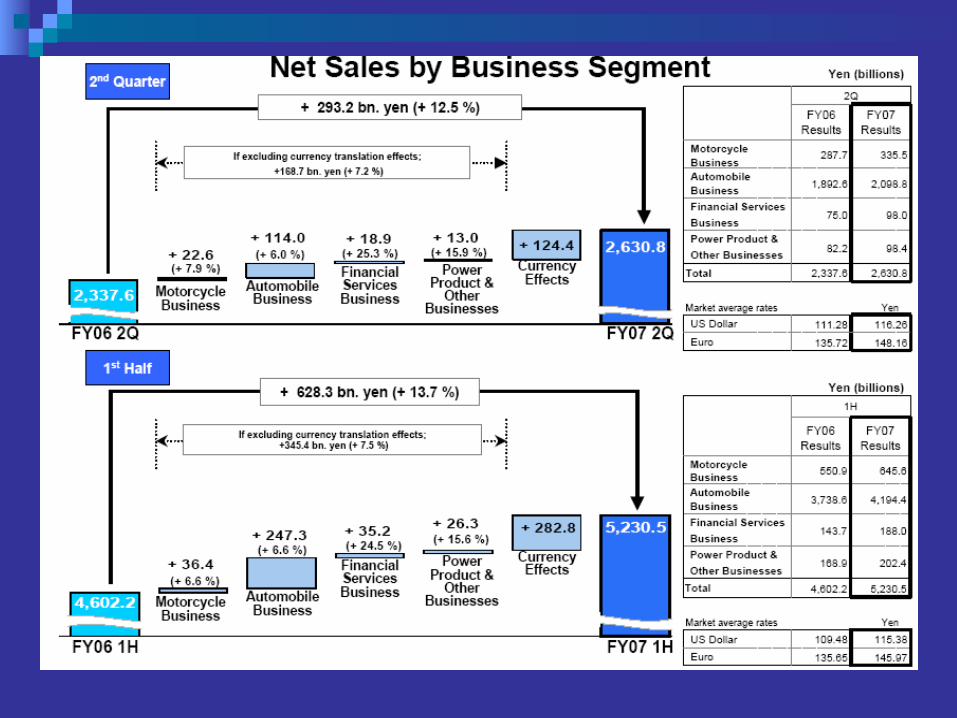
Financial Results

Important Factors


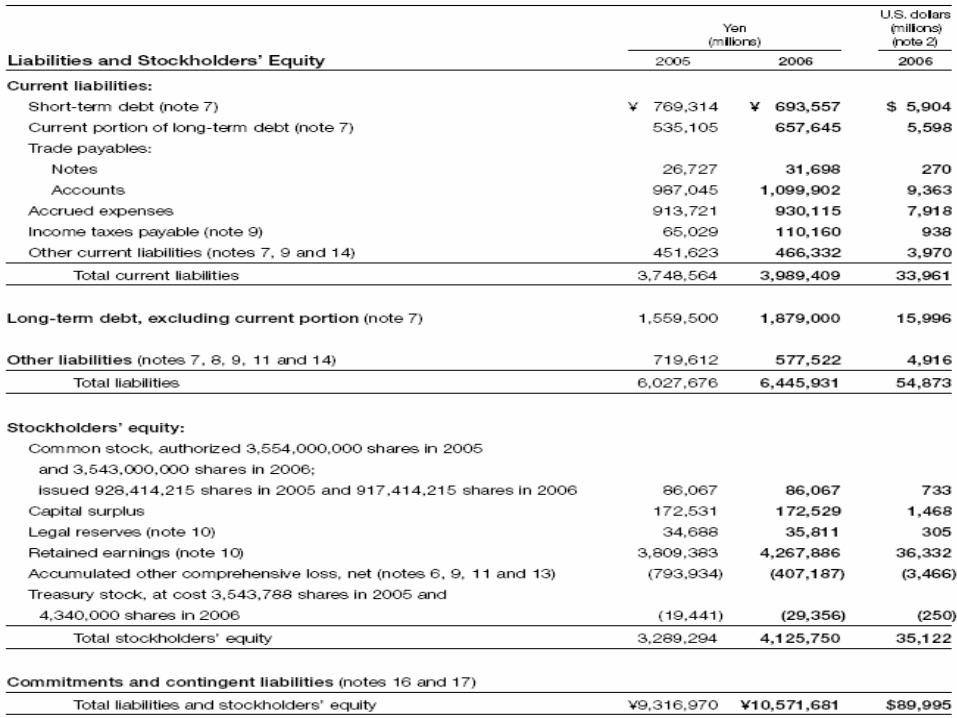
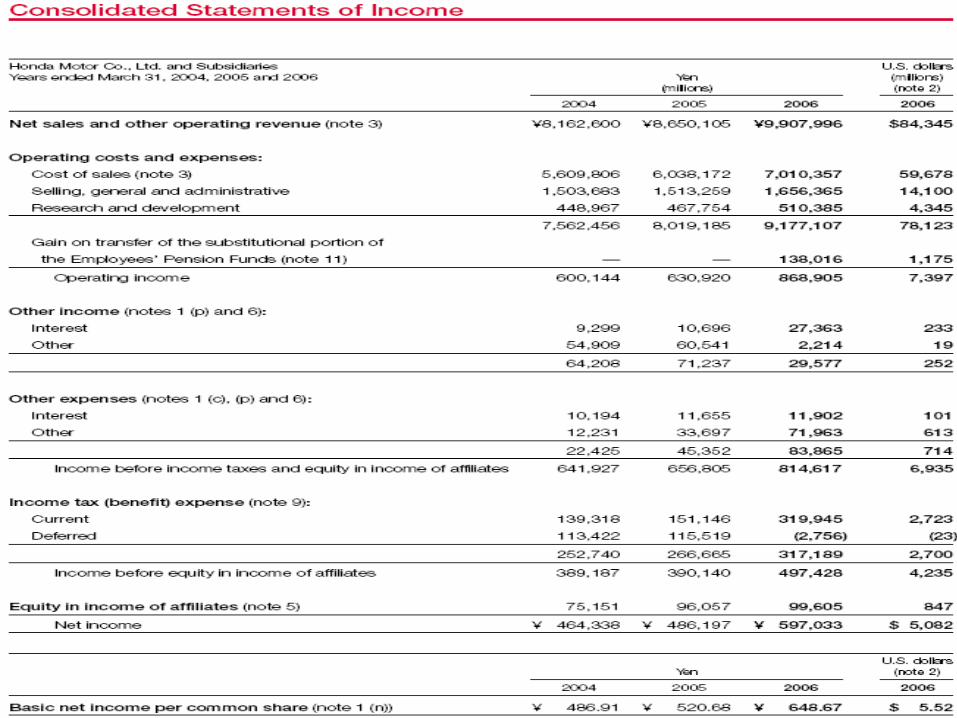
Annual Financial Statements


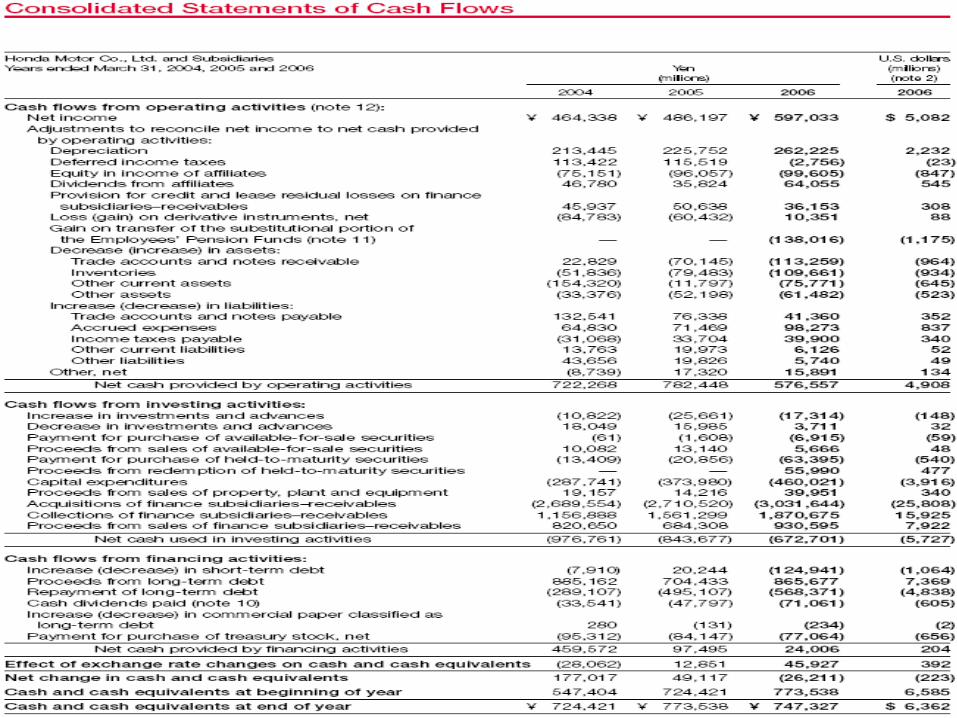

Fisher’s Analysis
Superiority in Financial skills, Production, Marketing, Research
Clear, easy to read annual reports and financial statement
Financial statements not prepared in accordance with the US GAAP
Steady increase of capital expenditure Over 30 principal manufacturing facilities About 145,000 full-time employees ~5% of total revenue used toward R&D
People Factor
Experienced management team Promote from within CEO is customer-oriented Executives and managers make up the
board of directors, this may decrease the effectiveness of corporate governance and increase risk for stakeholders

Investment Characteristics of Some Business
Strong market position Diversified into related businesses where
there are strategic fits and benefited from economies of scope

P/E Ratio
P/E ratio: 12.00 Competitor P/E ratios:
General Motors: 40.00BMW: 10.43Ford Motors: 0.00 (negative EPS)Toyota: 14.70Nissan: 0.00 (0 EPS)

Recommendation

BUY

General Motors
Table of Contents
Stock price Company Background Company Analysis Financial Highlight
(06 3rd Quarter report 05 Annual report)
Income statement Balance sheet Cash flow statement
Conclusion & Recommendation
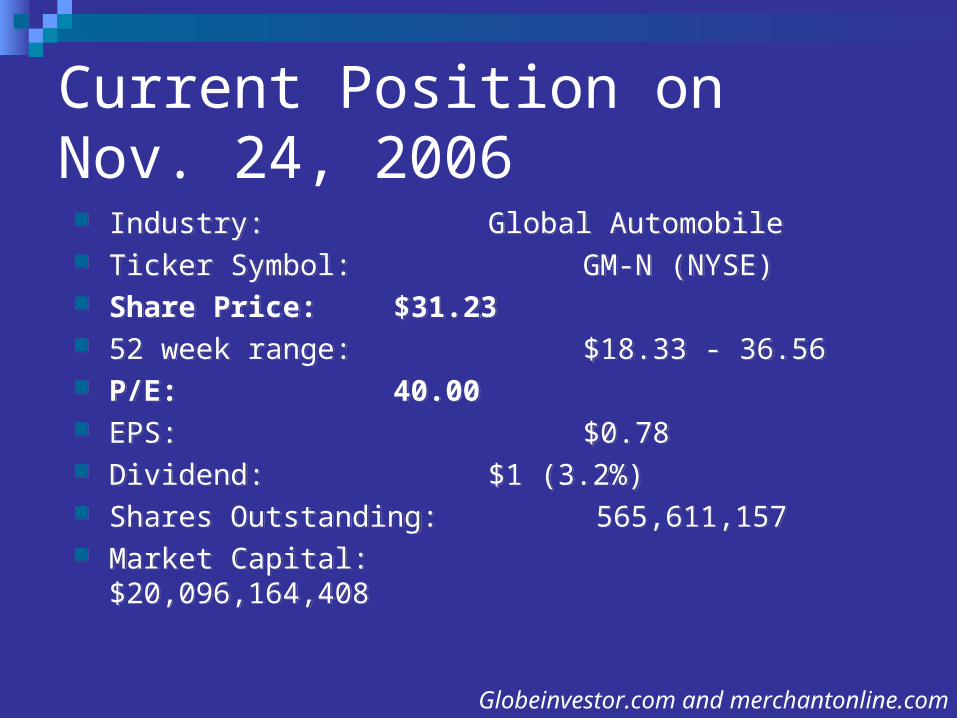
Current Position onNov. 24, 2006
Industry: Global Automobile Ticker Symbol: GM-N (NYSE) Share Price: $31.23 52 week range: $18.33 - 36.56 P/E: 40.00 EPS: $0.78 Dividend: $1 (3.2%) Shares Outstanding: 565,611,157 Market Capital: $20,096,164,408
Industry: Global Automobile Ticker Symbol: GM-N (NYSE) Share Price: $31.23 52 week range: $18.33 - 36.56 P/E: 40.00 EPS: $0.78 Dividend: $1 (3.2%) Shares Outstanding: 565,611,157 Market Capital: $20,096,164,408
Globeinvestor.com and merchantonline.com

5-Year Stock Price
(from bigcharts.com)

1-Year Stock Price
(from bigcharts.com)

GM vs. S&P/TSX Composite Index
Globeinvestor.com
Definitions
GMA – GM Auto GMNA - GM North America GME - GM Europe GMLAAM - GM Latin America / Africa / Mid-East GMAP - GM Asia Pacific
GMAC – General Motors Acceptance Corporation

Background
The world's largest automaker Founded in 1908 Global industry sales leader for 75 years GM today employs 327,000 people in the world
Huge labor pension cost Global headquarters in Detroit, Michigan, USA GM manufactures its cars and trucks in 33
countries

GM’s Products
In 2005, 9.17 million GM cars and trucks were sold globally under the following brands:
GM operates one of the world's leading finance companies GMAC Financial Services, which offers automotive, residential and commercial financing and insurance.
GM's OnStar subsidiary is the industry leader in vehicle safety, security and information services.
•GM•Daewoo•Holden•HUMMER
•Opel•Pontiac•Saab•Saturn•Vauxhall
•Buick•Cadillac•Chevrolet•GMC

GMA & GMAC Revenue Share - Nine months ended September 30, 2006
GMAC17%
OtherAuto1%
OtherFinanc
ing0%
GMA82%GMA GMAC
Other Auto Other Financing

Global Partnerships Majority shareholder of GM Daewoo Auto & Technology
Co. of South Korea
Has product, powertrain and purchasing collaborations with Suzuki Motor Corp. and Isuzu Motors Ltd. of Japan.
Advanced technology collaborations with DaimlerChrysler AG BMW AG of Germany Toyota Motor Corp. of Japan
Vehicle manufacturing ventures with Toyota Suzuki Shanghai Automotive Industry Corp. of China AVTOVAZ of Russia Renault SA of France

Type of Vehicle and Market Share

Management Key people
G. Richard Wagoner, Jr. Chairman & CEO since May 1, 2003
Joined GM since 1977 BA in economics from Duke University MBA from Harvard Business School
Frederick (Fritz) A. Henderson Vice Chairman and CFO since Jan. 1, 2006
Joined GM since 1984 BBA from the University of Michigan MBA from Harvard Business School
Robert A. Lutz Vice Chairman, Global Product Development since Sept. 1, 2001
Former CEO of Excide Technologies & Vice Chairman of Chrysler Corporation BA in production management from the University of California-Berkeley MBA from the University of California-Berkeley Degree of doctor of management from Kettering University

The World's Largest Automaker GM's largest national market in order:
1. the United States2. China3. Canada4. the United Kingdom and Germany.
Global market share for vehicles sales: 14.2%(2005) from 14.4%(2004)
Declining Revenue
High oil price GM produce high horse power vehicles
Used to be American consumers’ favorite
People switch to low oil consumption vehicles
Japanese cars Korean cars
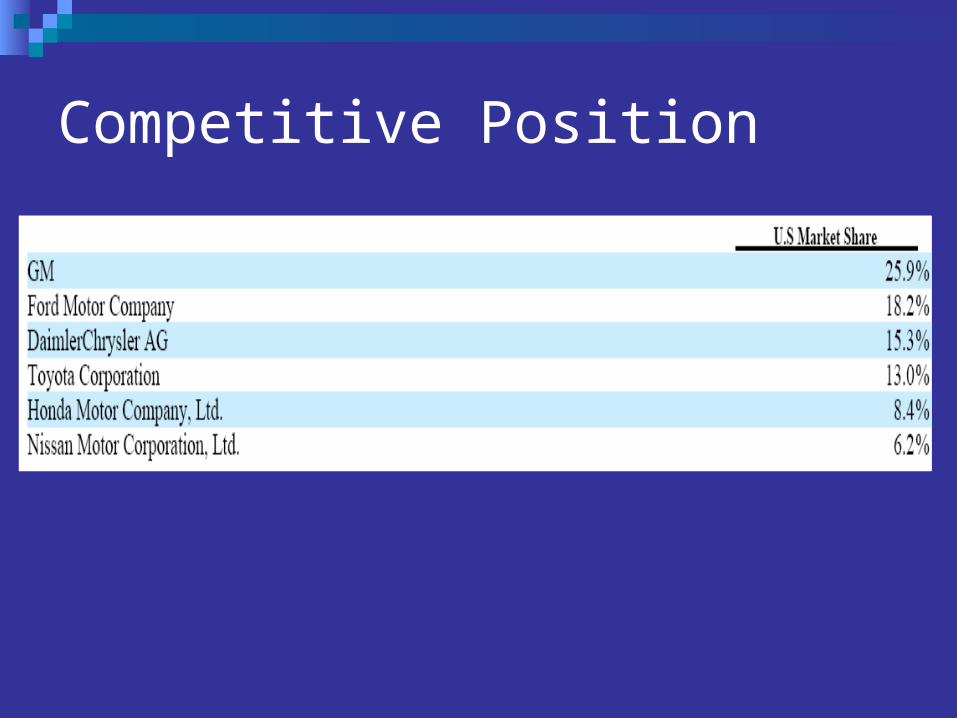
Competitive Position
Financial Statement Analysis
The 2006 3rd Quarter ReportEnded at September 30, 2006


2006 Quarter Revenue Breakdown- Auto & Financing and Insurance Operations
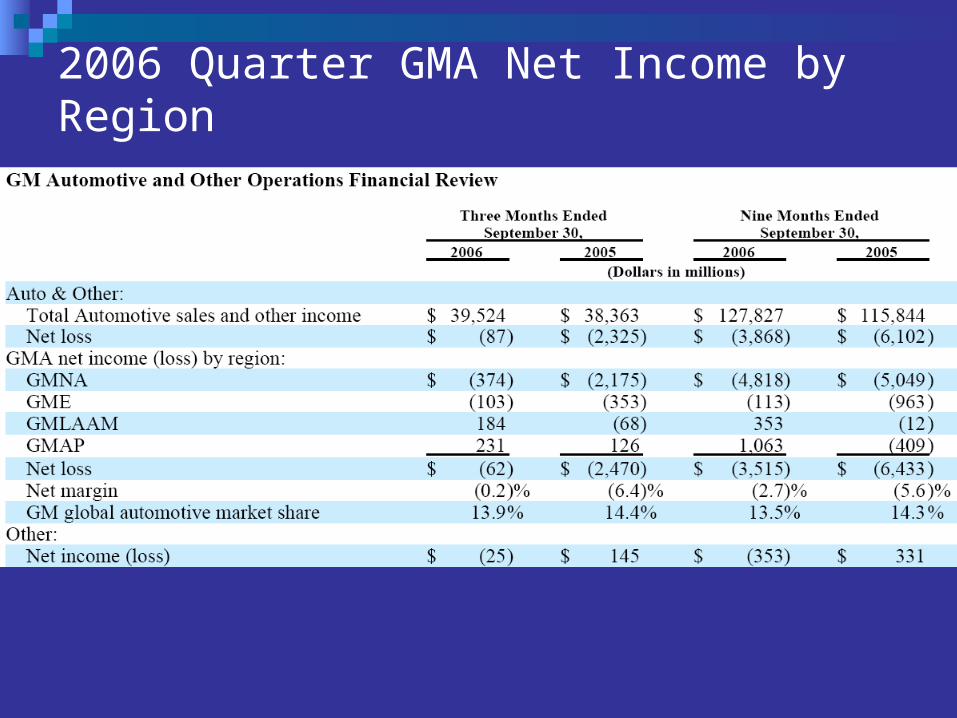
2006 Quarter GMA Net Income by Region

2006 Quarter GMAC Net Income by Division

06~07 EPS Estimates
(Earning estimates from Zacks.com)

Segment Reporting

GMAP9%GM LAAM
8%
GME19%
GMNA64%
GMNA GME GM LAAM GMAP
GMA Revenue Share by Region- Nine months ended September 30, 2006
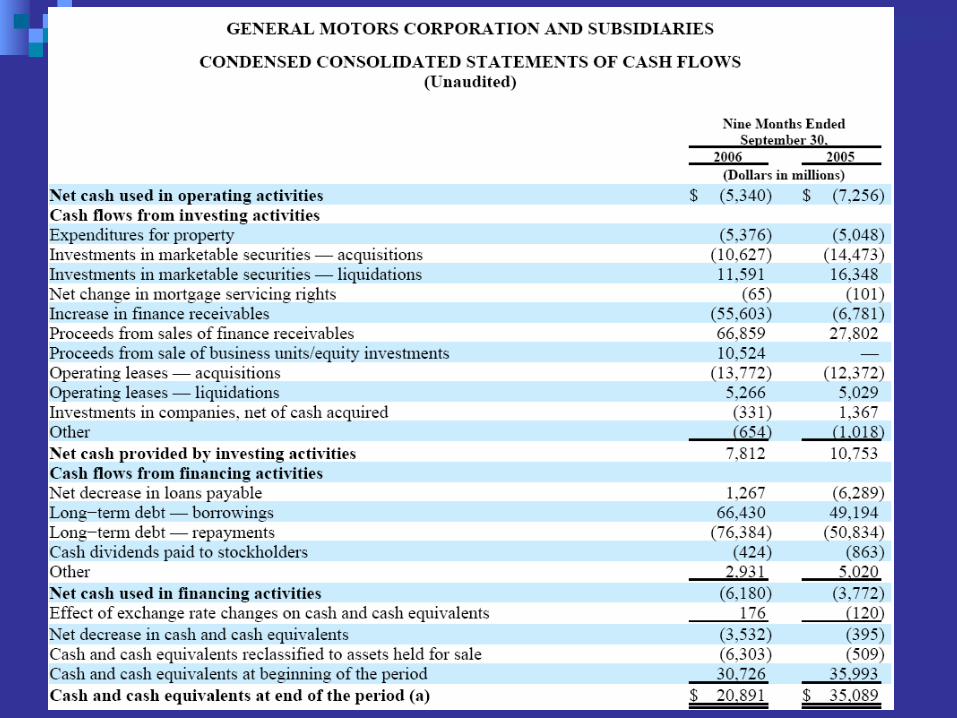
Financial Statement Analysis
2005 Annual Report

General Idea about the Performance of GM in 2005
GM is losing big money in North America GMA’s global sales revenue is good (growth) GMAC is making money We can see that the auto division is dragging the
company performance
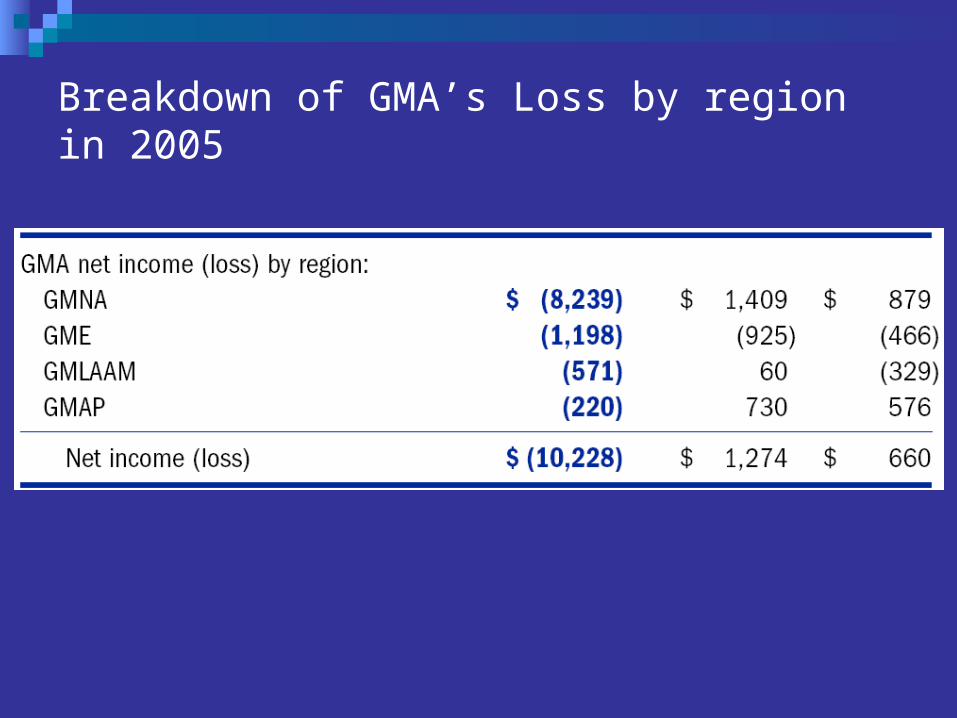
Breakdown of GMA’s Loss by region in 2005

Breakdown of GMAC’s profit in 2005

Financial Highlights (In USD as of 12/31/2005)
Total Revenue 192,604,000,000
EBITDA 31,516,000,000
Net Loss (10,567,000,000)
Total Assets 476,078,000,000
Current Assets 99,414,000,000
Total Liabilities 461,481,000,000
Current Liabilities 117,963,000,000
Long Term Debt 202,177,000,000
Stockholders' Equity 14,597,000,000

GM’s Main Challenges
Huge legacy cost burden
Inability to adjust structural costs in line with falling revenue

GM’s Legacy Challenge
Huge retiree population Huge cost for health care & pensions 11.5 active employees support 1 retiree in 1962 1 active employee supports 3.2 retirees in 2005 Health care bills totaled $5.3 billion in 2005 No other company has this much health-care obligation
(!!!Big competitive disadvantage)
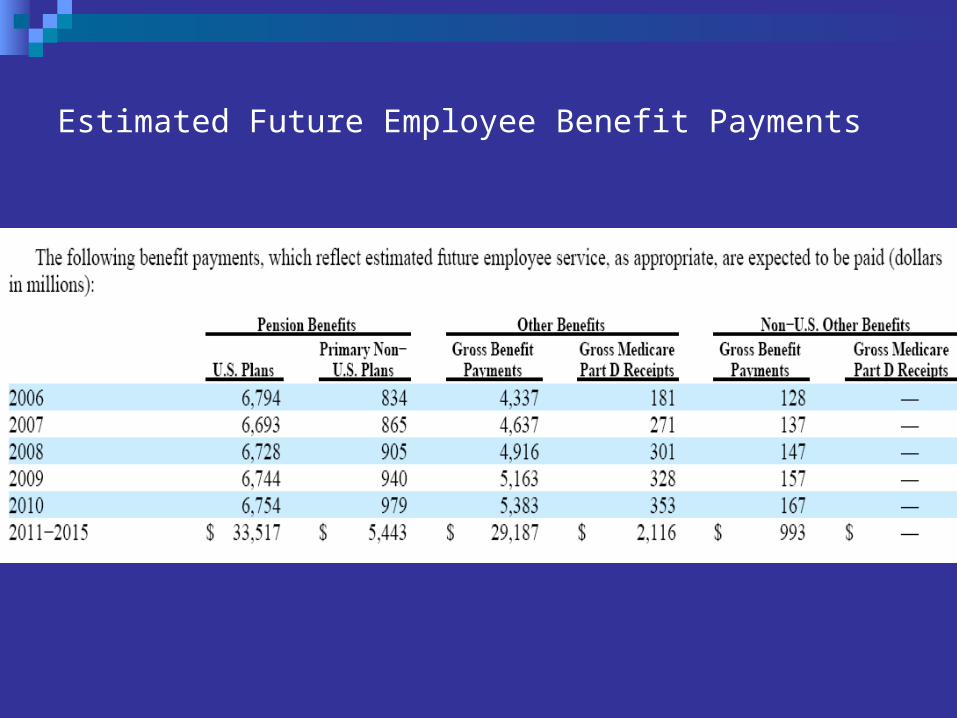
Estimated Future Employee Benefit Payments
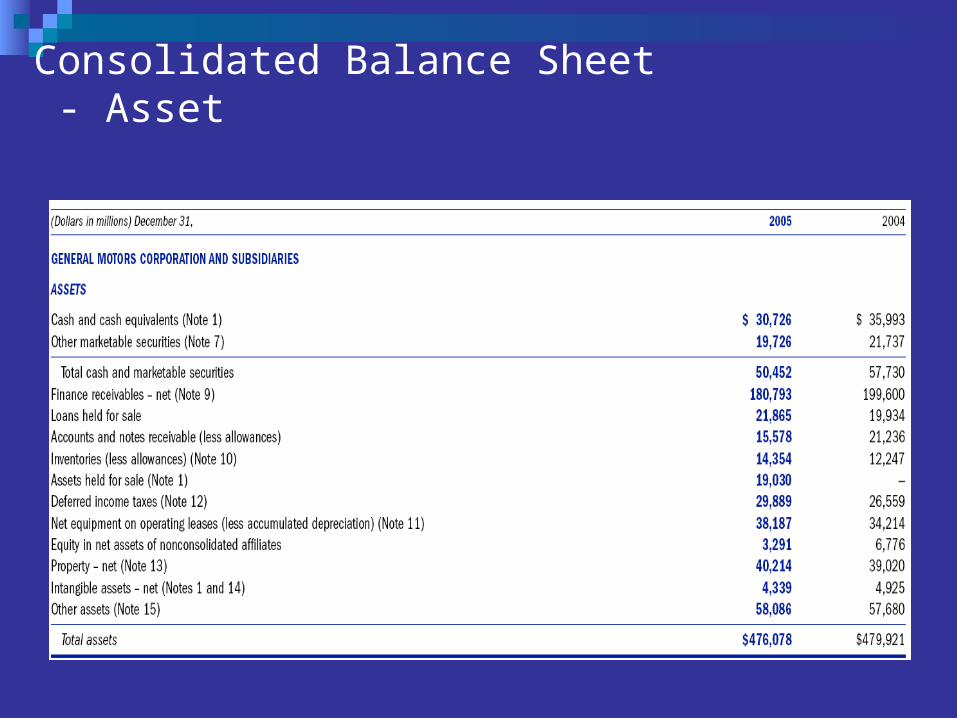
Consolidated Balance Sheet - Asset
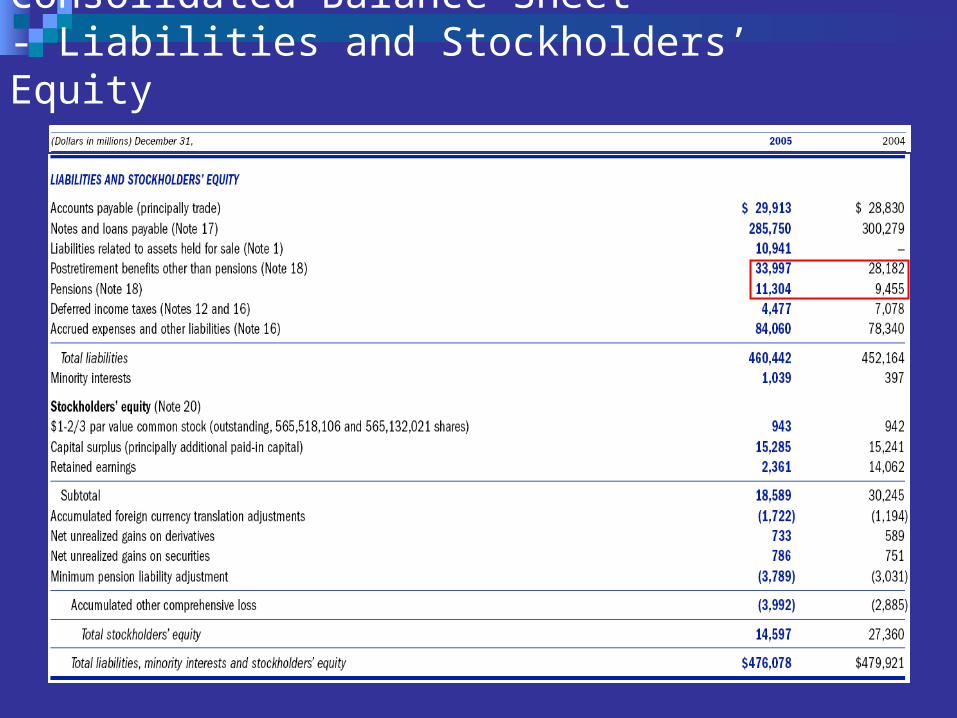
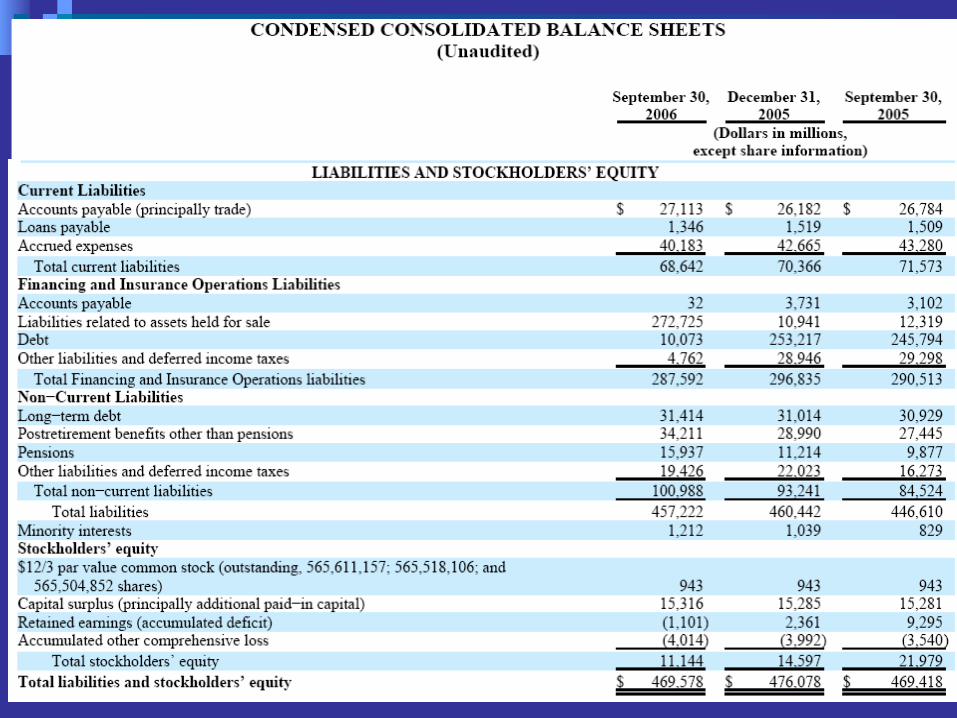
Consolidated Balance Sheet- Liabilities and Stockholders’ Equity
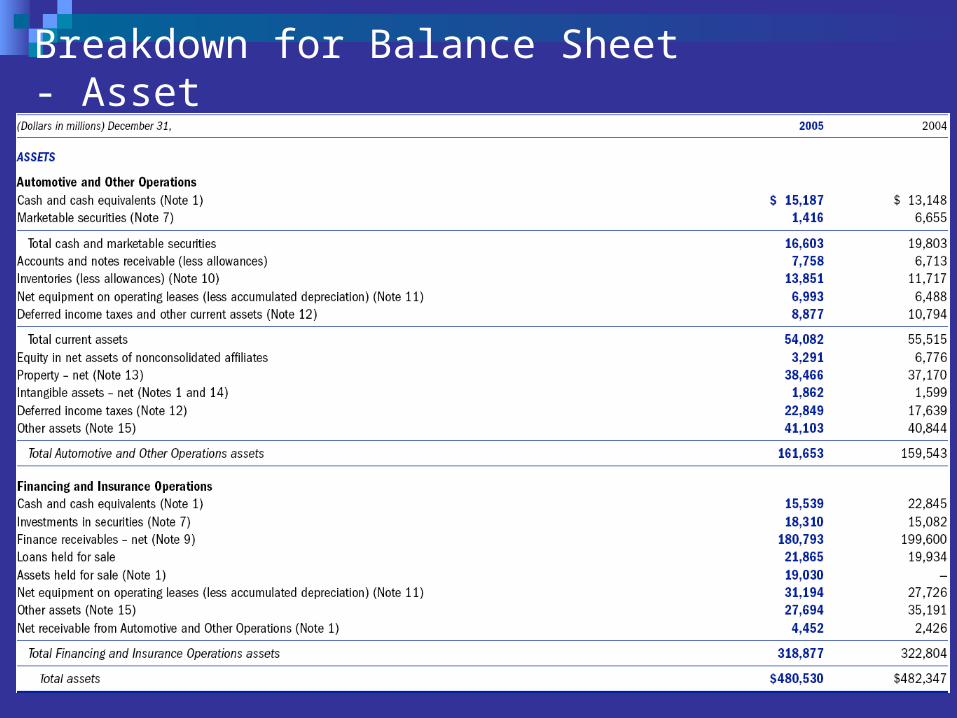
Breakdown for Balance Sheet- Asset
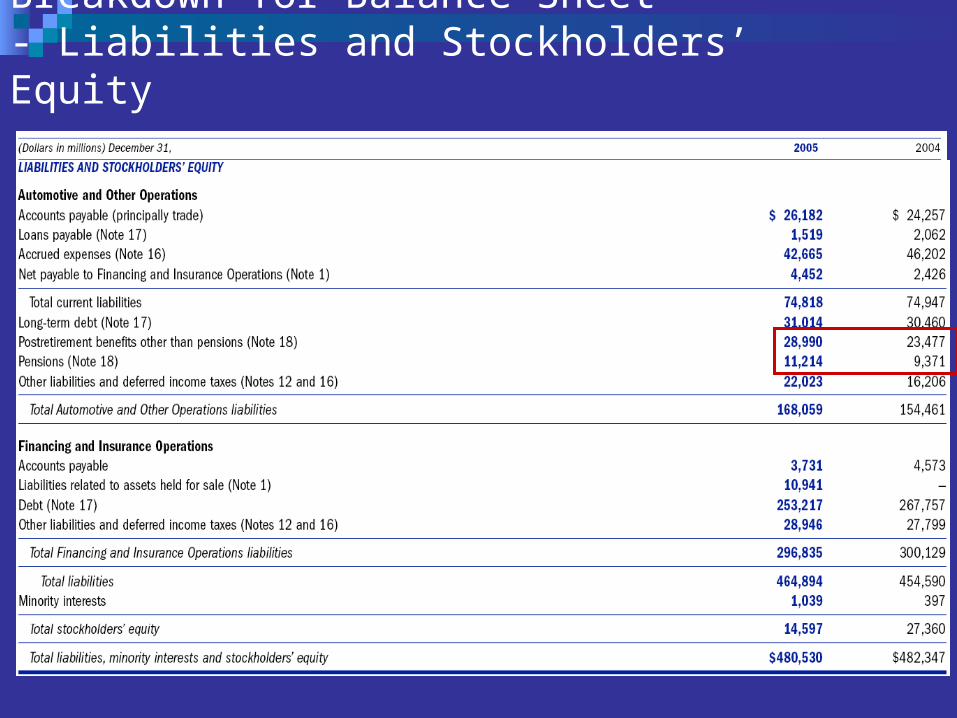
Breakdown for Balance Sheet- Liabilities and Stockholders’ Equity
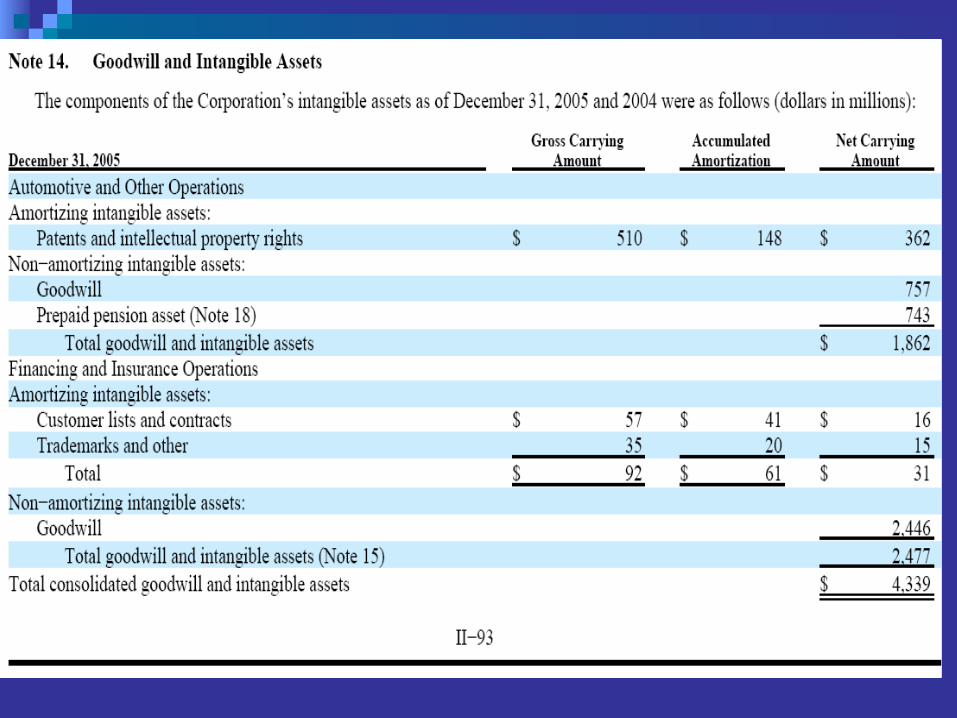

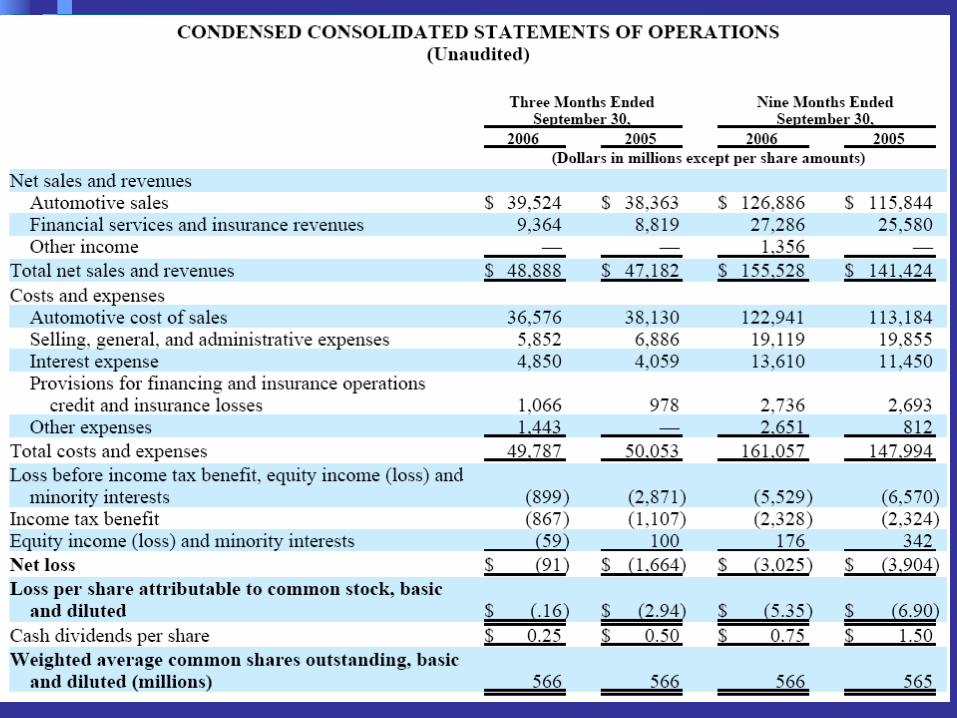
Consolidated Income Statement
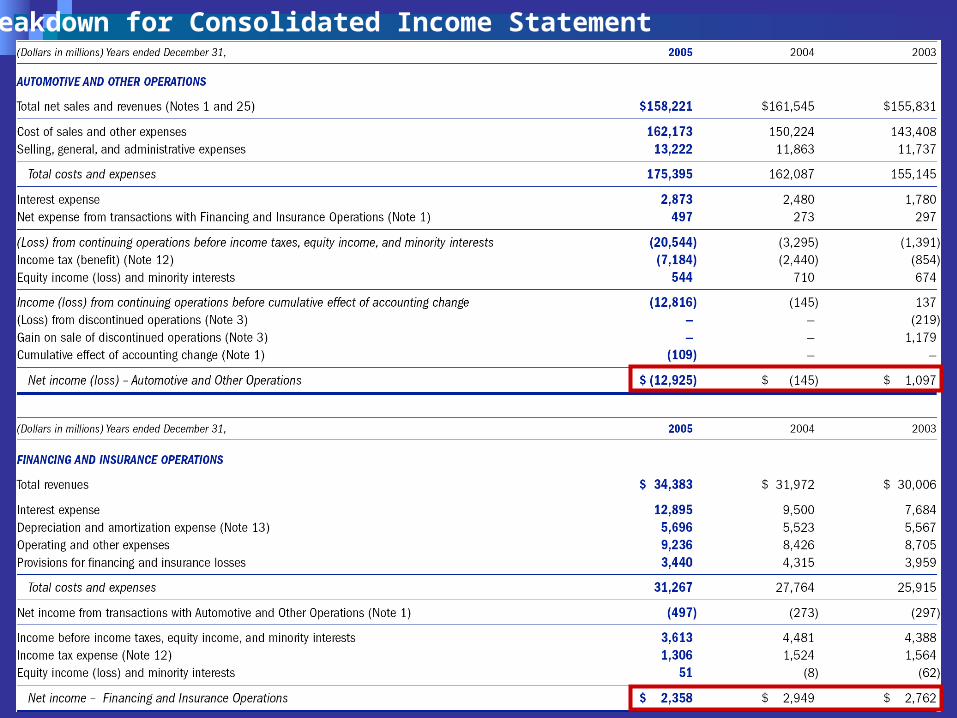
Breakdown for Consolidated Income Statement
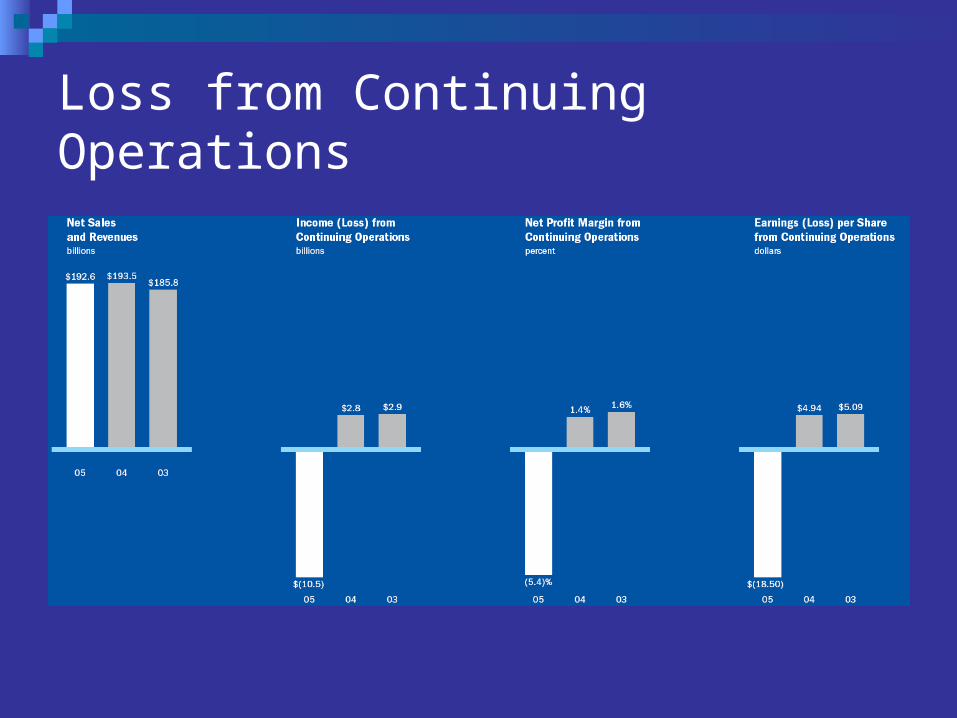
Loss from Continuing Operations

2005 to 2004 Comparison
Net sales fell to $192.6 billion from 193.5 billion Net loss of $10.6 billion from Net income of $2.8
billions Unfavorable results primarily due to losses at GMNA GMAC net income declined to $2.4 from $3.0 billion

Reasons for Unfavorable results in 2005
GMNA market share and product mix Revenue declining
Delphi Chapter 11 Proceeding GM recorded a charge of $5.5 billion Including the benefit guarantees for certain former GM U.S.
employees who transferred to Delphi
GMNA restructuring and global asset Impairments Health-care cost escalation

Factors for Loss in GMNA
Unfavorable product mix ($2.2 billion loss) Reduced in demand for higher margin large utility vehicles (reaching the end of
the life cycle)
Production volume decreases ($2.1 b. loss) Market share decline Reduction in dealer inventories
Unfavorable material costs ($700 mil. loss)
Increased health-care expenses ($600 mil. loss) Escalating health care cost trends
Advertising and sales promotion cost increase ($500 mil. loss)
Restructuring charge ($1.7 b. loss)
After-tax impairment charge ($552 mil. loss)
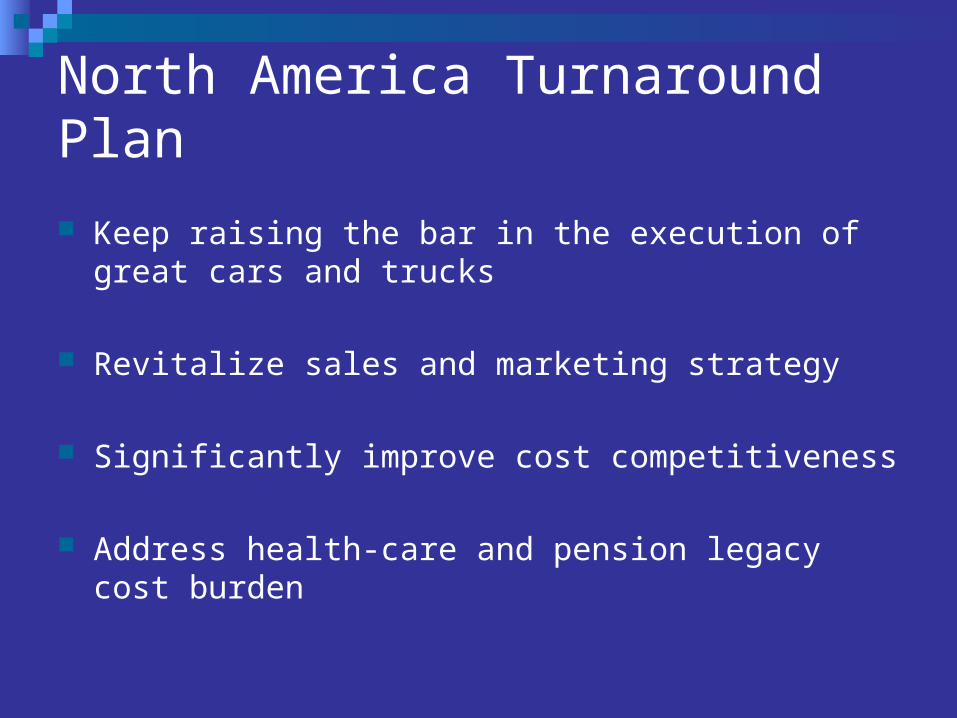
North America Turnaround Plan
Keep raising the bar in the execution of great cars and trucks
Revitalize sales and marketing strategy
Significantly improve cost competitiveness
Address health-care and pension legacy cost burden

GMNA Turnaround Plan Highlight
Cease production at 12 U.S. plans by 2008 Reduce 30,000 manufacturing positions Work with United Auto Workers to reduce health-care
obligations by $15 billion Modify pension benefits Reduce salaries of top executives Reduce dividend by 50%


Consolidated Cash Flow Statement (cont.)

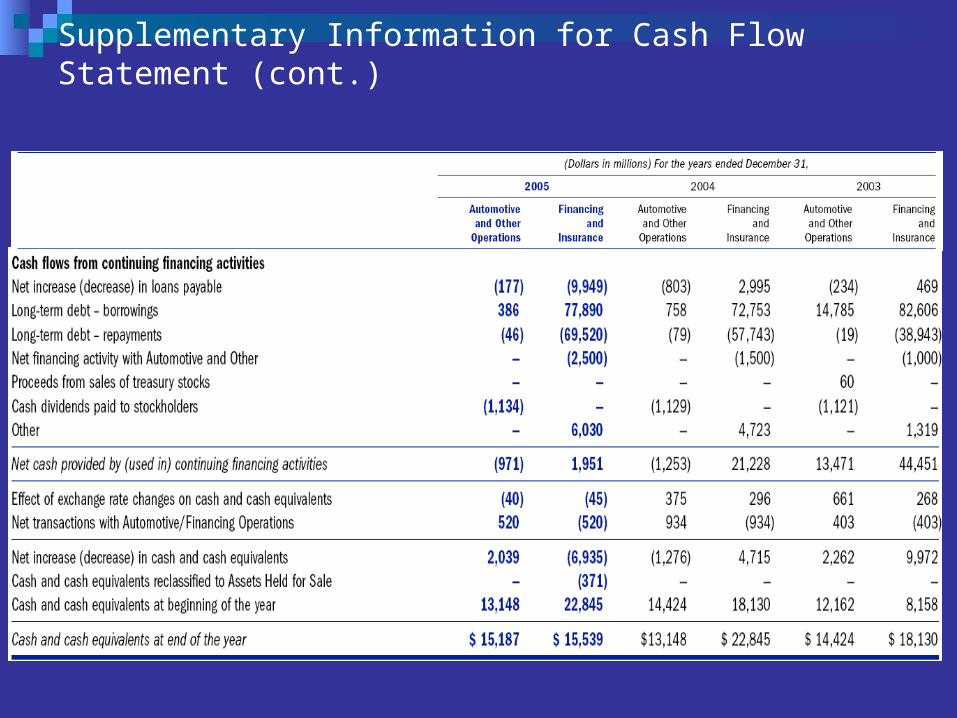
Supplementary Information for Cash Flow Statement (cont.)

GM Profitability Plan
Keep working on cost reduction
Growing revenue around the world
Invest in technology, better fuel efficiency
Revitalizing sales and marketing strategy

Significant Events Delphi Bankruptcy
GMAC – Pending Sale of 51% controlling interest
Discussions with Renault and Nissan
Sale of investments in Isuzu and Suzuki
Sale of Regional Homebuilder

GM-Fisher’s Analysis 1) Financial Skill
Bad financial performance in GMA Depending on profits from GMAC
2) People Factor Great management team Relatively bad employee relationship (cutting pension
expense) 3) Investment Characteristics
Limited growth space due to intense competition Low industry profit margin (negative profit)
4) Investment Price P/E ratio is High Increasing stock price if turn the Net loss around

Recommendation


