Embed Size (px)
Citation preview

4124 JOURNAL OF LIGHTWAVE TECHNOLOGY, VOL. 27, NO. 18, SEPTEMBER 15, 2009
Receiver Model for Depolarized Signal Due toPolarization-Mode Dispersion and Partially Polarized
Noise Due to Polarization-Dependent Loss in anOptical Fiber Communication System
Hua Jiao, Member, IEEE, John Zweck, Li Yan, Member, IEEE, Curtis R. Menyuk, Fellow, IEEE, Fellow, OSA,and Gary M. Carter, Fellow, IEEE
Abstract—We systematically investigate the combined effect onthe system performance in an optical fiber communication systemof a signal that is depolarized due to polarization-mode dispersion(PMD) and noise that is partially polarized due to polarization-de-pendent loss. We derive a formula for the variance of the electriccurrent of the signal due to the signal–noise beating between a de-polarized signal and partially polarized noise. We validate this the-oretical formula by comparing the -factor calculated using thetheory to results obtained from Monte Carlo simulations and ex-periments. We show that the system performance strongly dependson the power-splitting ratio, the degree of polarization of the noise,and the angle between the states of polarization of the signal andthe polarized part of the noise. Although the theoretical formula isderived assuming that the optical fiber only has first-order PMD,we show that for arbitrary fiber, this formula still produces a reli-able estimate of the -factor provided that the second-order PMDis on the order of 300 ps� or less.
Index Terms—Optical fiber communication, optical fiber polar-ization, optical noise, optical receivers, -factor.
I. INTRODUCTION
T HE performance of optical fiber communications systemscan be significantly impaired by polarization effects, such
as the polarization-mode dispersion (PMD) and random vari-ation of the birefringence in optical fibers, and the polariza-tion-dependent loss (PDL) in devices, such as optical amplifiers[1], [2]. The interaction that the PDL has with the random fiberbirefringence and with the PMD has two distinct effects on thesystem performance: variations in the optical SNR (OSNR) andwaveform distortions.
Manuscript received August 04, 2008; revised January 28, 2009. First pub-lished May 08, 2009; current version published August 21, 2009.
H. Jiao was with the Department of Computer Science and Electrical Engi-neering, University of Maryland, Baltimore, MD 21250 USA. He is now withCiena, Linthicum, MD 21090 USA (e-mail: [email protected]).
J. Zweck is with the Department of Mathematics and Statistics, Univer-sity of Maryland Baltimore County, Baltimore, MD 21250 USA (e-mail:[email protected]).
L. Yan, C. R. Menyuk, and G. M. Carter are with the Department of ComputerScience and Electrical Engineering, University of Maryland Baltimore County,Baltimore, MD 21250 USA (e-mail: [email protected]; [email protected];[email protected]).
Color versions of one or more of the figures in this paper are available onlineat http://ieeexplore.ieee.org.
Digital Object Identifier 10.1109/JLT.2009.2022510
Variations in the OSNR arise when initially unpolarized noiseis partially polarized by the PDL and the alignment between thepolarization states of a polarized signal and the polarized partof the noise is randomized due to variations in the fiber birefrin-gence [3]–[8]. In addition, in wavelength-division multiplexed(WDM) systems, the combination of the PMD-induced walk-offbetween the polarization states of the signal and noise in eachchannel, the PDL, and the gain saturation of optical amplifiersinduces random variations of the power levels of the signal andnoise in each channel [9].
Waveform distortions are a well-known consequence ofPMD. Since PMD also depolarizes the signal, these distortionscan be more complicated in the presence of PDL. Huttner et al.[10] discuss three simple examples that illustrate the peculiareffects that can arise when a PDL element is sandwichedbetween two fibers with PMD. They also demonstrated that ina system with distributed PMD and PDL, the additional wave-form distortion due to the interaction of the PMD and PDL canincrease the bit-error ratio (BER) above the values obtained inthe absence of the PDL. However, for these simulations, theyused a large average PDL value of 11 dB.
In a more recent simulation study, Shtaif and Rosenberg [11]showed that in systems with realistic parameters, the waveformdistorting effects of PDL are of very limited significance, bothcompared to those due to PMD alone and due to the significanceof PDL as a mechanism that affects the OSNR. They showedthat these conclusions hold provided that the average PDL didnot exceed 5 dB. Their results were based on calculations of theeye closure penalty obtained using noise-free simulations for a10 Gb/s system with 50% duty cycle return-to-zero (RZ) pulsesand average differential group delay (DGD) values ranging from10 to 40 ps. However, Kim et al. [12] found that even smallvalues of PDL (less than 1 dB) can reduce the effectiveness ofoptical PMD compensators.
Recent research has focused on the problem of developinganalytical receiver models to quantify how the BER (or equiva-lently, the -factor) depends on interactions between the PMDand PDL [13]–[16]. The BER can, of course, be approximatedusing brute-force Monte Carlo simulations. However, analyticalapproaches to computing the BER are also useful since they mayresult in greater physical insight and are often computationallyless expensive than Monte Carlo simulations.
0733-8724/$26.00 © 2009 IEEE
Authorized licensed use limited to: University of Maryland Baltimore Cty. Downloaded on January 24, 2010 at 06:45 from IEEE Xplore. Restrictions apply.
JIAO et al.: RECEIVER MODEL FOR DEPOLARIZED SIGNAL 4125
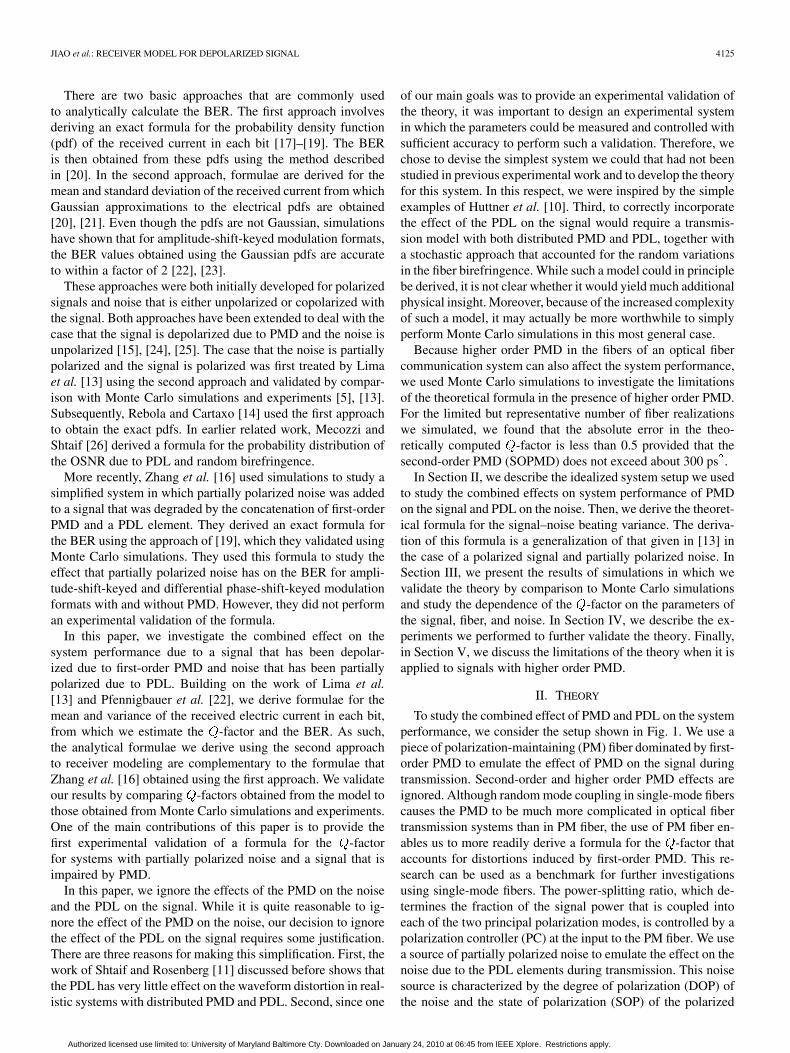
There are two basic approaches that are commonly usedto analytically calculate the BER. The first approach involvesderiving an exact formula for the probability density function(pdf) of the received current in each bit [17]–[19]. The BERis then obtained from these pdfs using the method describedin [20]. In the second approach, formulae are derived for themean and standard deviation of the received current from whichGaussian approximations to the electrical pdfs are obtained[20], [21]. Even though the pdfs are not Gaussian, simulationshave shown that for amplitude-shift-keyed modulation formats,the BER values obtained using the Gaussian pdfs are accurateto within a factor of 2 [22], [23].
These approaches were both initially developed for polarizedsignals and noise that is either unpolarized or copolarized withthe signal. Both approaches have been extended to deal with thecase that the signal is depolarized due to PMD and the noise isunpolarized [15], [24], [25]. The case that the noise is partiallypolarized and the signal is polarized was first treated by Limaet al. [13] using the second approach and validated by compar-ison with Monte Carlo simulations and experiments [5], [13].Subsequently, Rebola and Cartaxo [14] used the first approachto obtain the exact pdfs. In earlier related work, Mecozzi andShtaif [26] derived a formula for the probability distribution ofthe OSNR due to PDL and random birefringence.
More recently, Zhang et al. [16] used simulations to study asimplified system in which partially polarized noise was addedto a signal that was degraded by the concatenation of first-orderPMD and a PDL element. They derived an exact formula forthe BER using the approach of [19], which they validated usingMonte Carlo simulations. They used this formula to study theeffect that partially polarized noise has on the BER for ampli-tude-shift-keyed and differential phase-shift-keyed modulationformats with and without PMD. However, they did not performan experimental validation of the formula.
In this paper, we investigate the combined effect on thesystem performance due to a signal that has been depolar-ized due to first-order PMD and noise that has been partiallypolarized due to PDL. Building on the work of Lima et al.[13] and Pfennigbauer et al. [22], we derive formulae for themean and variance of the received electric current in each bit,from which we estimate the -factor and the BER. As such,the analytical formulae we derive using the second approachto receiver modeling are complementary to the formulae thatZhang et al. [16] obtained using the first approach. We validateour results by comparing -factors obtained from the model tothose obtained from Monte Carlo simulations and experiments.One of the main contributions of this paper is to provide thefirst experimental validation of a formula for the -factorfor systems with partially polarized noise and a signal that isimpaired by PMD.
In this paper, we ignore the effects of the PMD on the noiseand the PDL on the signal. While it is quite reasonable to ig-nore the effect of the PMD on the noise, our decision to ignorethe effect of the PDL on the signal requires some justification.There are three reasons for making this simplification. First, thework of Shtaif and Rosenberg [11] discussed before shows thatthe PDL has very little effect on the waveform distortion in real-istic systems with distributed PMD and PDL. Second, since one
of our main goals was to provide an experimental validation ofthe theory, it was important to design an experimental systemin which the parameters could be measured and controlled withsufficient accuracy to perform such a validation. Therefore, wechose to devise the simplest system we could that had not beenstudied in previous experimental work and to develop the theoryfor this system. In this respect, we were inspired by the simpleexamples of Huttner et al. [10]. Third, to correctly incorporatethe effect of the PDL on the signal would require a transmis-sion model with both distributed PMD and PDL, together witha stochastic approach that accounted for the random variationsin the fiber birefringence. While such a model could in principlebe derived, it is not clear whether it would yield much additionalphysical insight. Moreover, because of the increased complexityof such a model, it may actually be more worthwhile to simplyperform Monte Carlo simulations in this most general case.
Because higher order PMD in the fibers of an optical fibercommunication system can also affect the system performance,we used Monte Carlo simulations to investigate the limitationsof the theoretical formula in the presence of higher order PMD.For the limited but representative number of fiber realizationswe simulated, we found that the absolute error in the theo-retically computed -factor is less than 0.5 provided that thesecond-order PMD (SOPMD) does not exceed about 300 ps .
In Section II, we describe the idealized system setup we usedto study the combined effects on system performance of PMDon the signal and PDL on the noise. Then, we derive the theoret-ical formula for the signal–noise beating variance. The deriva-tion of this formula is a generalization of that given in [13] inthe case of a polarized signal and partially polarized noise. InSection III, we present the results of simulations in which wevalidate the theory by comparison to Monte Carlo simulationsand study the dependence of the -factor on the parameters ofthe signal, fiber, and noise. In Section IV, we describe the ex-periments we performed to further validate the theory. Finally,in Section V, we discuss the limitations of the theory when it isapplied to signals with higher order PMD.
II. THEORY
To study the combined effect of PMD and PDL on the systemperformance, we consider the setup shown in Fig. 1. We use apiece of polarization-maintaining (PM) fiber dominated by first-order PMD to emulate the effect of PMD on the signal duringtransmission. Second-order and higher order PMD effects areignored. Although random mode coupling in single-mode fiberscauses the PMD to be much more complicated in optical fibertransmission systems than in PM fiber, the use of PM fiber en-ables us to more readily derive a formula for the -factor thataccounts for distortions induced by first-order PMD. This re-search can be used as a benchmark for further investigationsusing single-mode fibers. The power-splitting ratio, which de-termines the fraction of the signal power that is coupled intoeach of the two principal polarization modes, is controlled by apolarization controller (PC) at the input to the PM fiber. We usea source of partially polarized noise to emulate the effect on thenoise due to the PDL elements during transmission. This noisesource is characterized by the degree of polarization (DOP) ofthe noise and the state of polarization (SOP) of the polarized
Authorized licensed use limited to: University of Maryland Baltimore Cty. Downloaded on January 24, 2010 at 06:45 from IEEE Xplore. Restrictions apply.

4126 JOURNAL OF LIGHTWAVE TECHNOLOGY, VOL. 27, NO. 18, SEPTEMBER 15, 2009
Fig. 1. System setup for receiver modeling with combined effects of PMD andPDL during transmission.
part of the noise. We ignore the effects of PDL on the signal andPMD on the noise. We also ignore other transmission effectssuch as chromatic dispersion and nonlinearities. The noise-freesignal is combined with the partially polarized noise before en-tering the receiver. The receiver consists of an optical filter, asquare-law photodetector, and an electrical filter. We evaluatethe system performance using the -factor, which we calculatefrom the pdfs of the electric current in each of the ONEs andZEROs as in [20]. We approximate each of these pdfs by Gaus-sians, which we calculate from the mean and variance of theelectric current in each bit [20].
To avoid confusion, we now clarify the notational conven-tions we use for vectors. For Jones vectors with two compo-nents, we use lower case bold symbols without arrows, e.g., .Jones vectors will always be column vectors. We let bethe row vector that is the complex-conjugate and transpose of .Then, is a scalar and is a 2 2 matrix. For a vectorwith three components, we use a capital bold symbol with an
arrow over the top, e.g., . For all vectors with four compo-nents, we use capital bold symbols without arrows, e.g., .
Our receiver model is a generalization of the model of Limaet al. [13]. Let and denote the Jones vectors of theelectric field envelopes of the noise-free signal and the noise, re-spectively, prior to the receiver, where is the time. Let ,
, , and denote the transfer function and thecorresponding impulse response of the optical and the electricalfilters, respectively. The noise-free signal and the noise after theoptical filter are given by convolving the impulse response of theoptical filter with the electric fields of the signal and the noise,respectively, which we denote by and
. As in [13], we assume that the scalar autocorrelation func-tion of the optically filtered noise is given by
ASE , where ASE is the total power spectral den-sity of the noise and is theautocorrelation function of the optical filter. Here, denotes thecomplex conjugate of a complex scalar . To model partiallypolarized noise, we introduce the temporal coherency matrix
of the optically filtered noise .If the noise has not been affected by PMD, we may assumethat the noise process is wide-sense stationary, in which case
, where . After the signaland the noise have passed through the optical filter, the photo-
detector, and the electric filter, the electric current of the com-bined signal and noise is given by
(1)
where is the electric current of the noise-freesignal and ASE is the mean current ofthe noise after the electrical filter. Here, is the responsivity ofthe photodetector and is the noise equivalent band-width of the optical filter. The variance of the electric current attime has the form
ASE ASE ASE (2)
The first term on the right-hand side of (2) is the variance of theelectric current due to the beating of the noise with itself and isgiven by [13]
ASE ASE ASEASE ASE
ASE ASE(3)
where ASE ASE is the noise–noise beating
factor and ASE ASE . Here,is the DOP of the partially polarized noise and is the au-tocorrelation function of the electrical filter, which is defined by
. The formulae for the av-erage current in the marks , the average current in the spaces
, and the noise–noise beating variance ASE ASE in (1)and (3) are the same for a depolarized signal with partially po-larized noise as for a polarized signal. The only change is to
ASE in (2).We now derive a formula for the variance ASE due to
the beating between a depolarized signal and partially polarizednoise. Let be the scalar electric field of the optical signalexiting the transmitter. After passing through a fiber with onlyfirst-order PMD, we can write the electric field of the noise-freesignal as
(4)
where are unit vectors that represent the two principal statesof the fiber in Jones space, is the DGD, and .Therefore, is the power-splitting ratio, which representsthe fraction of the total signal power that is coupled to the prin-cipal mode . For simplicity of notation, let . Afterthe optical filter, the electric field of the signal is given by
(5)
Let be the column vector whose en-tries are the Pauli spin matrices [27], where
������ �
� �� �����
� �
� �� �����
� ��
� �� �����
� �
� ���
Motivated by [15, eqs. (3.15)–(3.17)], we define the two-timeStokes parameters of the signal at times and by
Authorized licensed use limited to: University of Maryland Baltimore Cty. Downloaded on January 24, 2010 at 06:45 from IEEE Xplore. Restrictions apply.

JIAO et al.: RECEIVER MODEL FOR DEPOLARIZED SIGNAL 4127
i.e.,
with
where
The two-time Stokes parameters can be written as
(6)
where
(7)
Note that and are real vectors whereas andare complex vectors, with . The four-compo-
nent Stokes parameters of the noise are represented by
with . Since the noise process iswide-sense stationary, the variance of the electric current dueto signal–noise beating may be expressed as
ASE ASE (8)
where denotes the standard inner product of real four vec-tors. Here,
ASE
� ASE
ASE
(9)
and
ASE (10)
where is the unit Stokes vector of the polar-ized part of the noise. By (8)–(10), we have
ASE ASE ASE ASE(11)
Next, we define
ASE (12)
ASE
(13)
Then, by (6), (9), (12), and (13), we have
A A
ASE
ASE (14)
Since , we have that and. Since we neglect the effect of PDL on the signal, we have
. Therefore, by (8), the variance of the electriccurrent due to the beating between the depolarized signal andthe partially polarized noise can be expressed as
ASE
ASE ASE ASE
ASE
ASE
ASE (15)
From (15), we can see that the variance due to signal–noisebeating is determined by the power-splitting ratio, the DGD ofthe fiber, the DOP of the noise, the angle between the polarizedpart of the noise and the principal state vectors, and the relativephases between , , and ASE . To compare(15) to experimental results, we need to relate the quantitiesinvolved in (15) to experimentally measurable parameters. Todo so, we define the average Stokes vector of the signalby
(16)
and let
(17)
Authorized licensed use limited to: University of Maryland Baltimore Cty. Downloaded on January 24, 2010 at 06:45 from IEEE Xplore. Restrictions apply.

4128 JOURNAL OF LIGHTWAVE TECHNOLOGY, VOL. 27, NO. 18, SEPTEMBER 15, 2009
be the autocorrelation function of the input signal . From (5),(16), and (17), we have
(18)
(19)
(20)
To extract and from (19) and (20), we usematrix inversion to obtain
(21)From (7), the Jones vectors of the principal states of the fiber
and can be calculated from and , which canbe measured directly in the experiment. From and , wecan calculate and using (7). Therefore, (15) can bevalidated experimentally by measuring the pulse shape of thesignal at the transmitter, , , , and the shapes of theoptical and electrical filters.
III. SIMULATIONS
In this section, we perform simulations to validate formula(15) by comparison with Monte Carlo simulations and to quan-tify the degree to which the -factor varies as the angle betweenthe signal and noise is varied on the Poincare sphere.
We simulated 10 Gb/s signal transmission using a piece ofPM fiber, as shown in Fig. 1. At the transmitter, the carrier wave-length was 1554.0 nm. We used an RZ modulation format witha Gaussian pulse that had a full-width half-maximum (FWHM)width of 23 ps. The extinction ratio of the pulse was dB,and there was no chirp in the signal. We used a pseudorandombit string with a string length of 8 bits. The average power ofthe signal was 0 dBm and the OSNR was fixed at 15 dB. Thetotal DGD of the fiber was 36 ps and the length of the fiber was21 m. We ignored the effects of chromatic dispersion and non-linearity in this short fiber. The parameters of the fiber are thesame as a piece of PM fiber that we used in the experiment,which is discussed in Section IV. For simplicity and withoutloss of generality, we set the two principal states of the fiber to be
and . The receiver consistedof a Gaussian-shaped optical filter with an FWHM of 60 GHz, asquare-law photodetector, and a fifth-order, low-pass electricalBessel filter with a 3-dB bandwidth of 8.5 GHz.
In the simulation, the DOP of the partially polarized noisewas fixed to 0.5 and the power-splitting ratio was 0.5. To validateformula (15), we varied the angle between the SOP of the signaland the polarized part of the noise on the Poincaré sphere in thefollowing two ways, as shown in Fig. 2. We call these ways theorthogonal and parallel cases.
In both cases, the average SOP of the signal is in the –plane since the power-splitting ratio is 0.5 and
. Therefore, the normalized average SOP of the signalis of the form , where is the angle from the
axis to . In the simulations, for each of several values of ,
Fig. 2. Diagram of simulation setups for �� � � ���. (a) Orthogonal case.(b) Parallel case.
we varied the angle between the signal and the polarized partof the noise by rotating . In the orthogonal case shown inFig. 2(a), let the SOP of the polarized part of the noise rotate inthe – plane, i.e., , where is theangle from the axis to . We call this case the orthogonalcase because the Stokes vector of the polarized part of the noiseis always orthogonal to the principal state vectors. In the parallelcase shown in Fig. 2(b), the SOP of the signal is the same as inthe orthogonal case. However, rotates in the – plane onthe dotted circle. We call this case the parallel case because thetwo principal state vectors are always parallel to the – plane,which is the plane in which the Stokes vector of the polarizedpart of the noise lies.
In Fig. 3, the -factors calculated using (15) and from MonteCarlo simulations are plotted as a function of the angle . Forsimplicity, in the Monte Carlo simulations, the -factors werecalculated using the mean and variance of the worst ONEs andworst ZEROs, which are the middle ONE between two ZEROs(010) and the middle ZERO between two ONEs (101), respec-tively, for an 8-bit random string. However, the -factors calcu-lated using other bits are almost the same, differing by at most0.1.
In Fig. 3, the lines represent the -factor calculated using(15) and the symbols are results from Monte Carlo simulationsfor several values of the angle . The agreement between MonteCarlo simulations and the theory is excellent. The slight devia-tions between the -factors calculated using Monte Carlo simu-lations and those obtained from the theory are due to the limitednumber of 10 000 noise realizations we used in the Monte Carlosimulations.
To understand the results for the orthogonal case shown inFig. 3(a), observe that in Fig. 2(a), as is rotated in the –plane, the angle between and varies between 0 and .In the case that and , and are parallel.So, the beating between the signal and the noise is the maxi-mized and the -factor attains its minimum value, as shown inFig. 3(a). When is rotated so that , and are
Authorized licensed use limited to: University of Maryland Baltimore Cty. Downloaded on January 24, 2010 at 06:45 from IEEE Xplore. Restrictions apply.

JIAO et al.: RECEIVER MODEL FOR DEPOLARIZED SIGNAL 4129
Fig. 3. �-factor as a function of the angle � for �� � � ���. The lines arecalculated from formula (15) and the symbols are results from Monte Carlosimulations. (a) Orthogonal case. (b) Parallel case.
antipodal on the Poincaré sphere (orthogonal in Jones space),the beating between the signal and noise is minimized, and the
-factor, therefore, attains its maximum. For other values ofbetween 0 and , the maximum and the minimum of the-factor still occurs when and are, respectively, par-
allel and antipodal to each other on the Poincaré sphere, and themagnitude of the -factor variation with respect to the noiseangles is independent of . Next, we provide physical inter-pretation of the results for the parallel case shown in Fig. 3(b).
In Fig. 2(b), is still in the – plane but now rotatesin the – plane. When , is on the -axis. Thus, thebeating between the signal and the noise is maximized and min-imized when is and and the angles betweenand are 0 and , respectively. When is neither 0 nor ,
is not in the – plane. In this case, no matter whereis in the – plane, the angle between and is never 0or . As a result, the beating between the signal and the polar-ized part of the noise is always partial and the -factor varia-tion is smaller compared to the case when . Quantitativelyspeaking, when , , or , the minimum and maximumof the possible angles between and that are attainabledepend on . For example, when , the minimumand maximum possible angles between and are and
, respectively.
Fig. 4. Schematic diagram of the experimental setup.
IV. EXPERIMENTAL RESULTS
In this section, we validate the receiver model describedin Section II by comparison to results from experiments. Theschematic diagram of the experimental setup we used is shownin Fig. 4.
The transmitter generated a 10-Gb/s RZ signal with a pseudo-random pattern length of . The FWHM width of the pulseswas about 23 ps. We used a piece of PM fiber with a DGD of 36ps to emulate the effect of PMD on the signal during transmis-sion. SOPMD and higher order PMD were negligible in the PMfiber. The power-splitting ratio was controlled by a PC at theinput of the PM fiber. We emulated the partially polarized noisein a transmission system due to PDL by combining unpolarizednoise with polarized noise. The two types of noise were obtainedby a 50-50 splitting of a single amplified spontaneous emission(ASE) noise source that generated unpolarized noise. The po-larized noise was obtained by using a polarizer to polarize halfof the unpolarized noise. A PC after the polarizer was used tocontrol the SOP of the polarized noise. We varied the power ofthe other half of the noise using a tunable attenuator (ATT 1)so as to achieve a desired DOP once the unpolarized and polar-ized noise were combined. Finally, a second tunable attenuator(ATT 2) was used to achieve a desired OSNR at the receiver. TheOSNR was fixed at 15 dB and monitored by an optical spectrumanalyzer (OSA) with a resolution bandwidth of 0.2 nm. We useda polarimeter to measure the SOP and DOP of the signal andthe noise. The principal states of polarization of the PM fiberwere calculated using Poincaré arc method [28] from measure-ments of the SOP of the signal at three wavelengths. To sepa-rately measure the SOP of the noise-free signal and the noise,we used a mechanical switch to turn the signal on and off andthe second tunable attenuator (ATT 2) to turn the noise on andoff. We used the PC at the input of the polarimeter to obtain thedesired principal state of polarization (PSP) of and(0, 1, 0). Although the model and the experiment can use anyPSP, we made this to enable easy monitoring of the SOP of thesignal and the polarized part of the noise during the experiment.The receiver consisted of an optical filter with an FWHM of60 GHz, a square-law photodetector, and a fifth-order, low-passelectrical Bessel filter with a 3-dB bandwidth of 9.8 GHz. The
-factor was obtained from BER margin measurements [29]made using a BER tester (BERT) that has an unknown electricalbandwidth in the decision circuit and can operate at bit rates ofup to 12.5 Gb/s.
Authorized licensed use limited to: University of Maryland Baltimore Cty. Downloaded on January 24, 2010 at 06:45 from IEEE Xplore. Restrictions apply.

4130 JOURNAL OF LIGHTWAVE TECHNOLOGY, VOL. 27, NO. 18, SEPTEMBER 15, 2009
In PM fibers, the polarization modes do not vary along thefiber and energy is not exchanged between the two principalmodes. More importantly, the polarization modes and the DGDare independent of wavelength. However, if the signal is notlaunched along either of the two principal states, then the SOPof the signal is a function of the wavelength after the signalpasses through the PM fiber. In contrast to single-mode fiberswith random-mode coupling, the SOP of the signal in PM fiberstraces a circle on the Poincaré sphere as the wavelength is varied.The SOP of the signal rotates about the axis given by the prin-cipal state vector, and the rotation rate of the SOP of the signalas a function of wavelength is proportional to the DGD of thePM fiber. It is known that the SOP of the signal in optical fibersis sensitive to temperature and environmental perturbations andit drifts randomly over time [30]. Moreover, the drift of the SOPof the signal is faster in PM fibers than in single-mode fibers.Since the variance of the electric current of the signal due tosignal–noise beating is a function of the angle between the SOPof the signal and the polarized part of the noise, it is critical tokeep the SOP of the signal stable during each measurement ofthe -factor.
In Fig. 5, we illustrate the drift of the SOP of a monochro-matic signal at the output of an 8-m PM fiber with 10 ps DGD.In Fig. 5(a), we plot the SOP of the signal on the Poincarésphere that we measured over the course of an hour at the outputof an 8-m PM fiber with a DGD of 10 ps. In addition to plottingthe data in Fig. 5(a), we also show a circle fitted to the data usingthree well-spaced samples of . In contrast to the random driftin single-mode fibers, we can see that in PM fibers, the SOP ofthe signal drifts on a circle and that this circle is orthogonal tothe PSP vector. The location of the circle is determined by thePSP vector and the launching polarization states of the signalat the input of the PM fiber. In Fig. 5(b), the Stokes parametersof the signal are plotted as a function of time over a 60-min pe-riod. In Fig. 5(c), we plot the angle through which the SOP ofthe signal drifts during each 1-min interval of a 60-min measure-ment period. The drift angle is defined to be the angle betweenthe SOP of the signal measured at two different times. The highpeaks in Fig. 5(c) were due to air-conditioning events in the lab-oratory that occurred every 35 min. From Fig. 5(b) and (c), wecan see that the SOP of the signal drifts quickly and it can driftup to 1 rad within a minute. Even when the drift is slowest, thedrift angle within a minute can still be as large as 0.25 rad, whichcorresponds to about 14 . Since this fast drift can induce signifi-cant measurement uncertainty in the -factor in the experiment,it has to be suppressed.
To suppress the drift rate of the SOP of the signal, we im-mersed the PM fiber in water to isolate the PM fiber from tem-perature variations and environmental perturbations. This tech-nique proved to be very effective in reducing the drift of the SOPof the signal. In Fig. 6, we show the drift rate of the SOP of thesignal after the PM fiber is put in water.
As we see in Fig. 6(c), the drift rate of the SOP of the signalduring the slow-drift time windows has been reduced to less than0.05 rad. By performing experiments in the time windows wherethe drift rate is low, we significantly reduced measurement errorof the -factor due to the drift of the SOP of the signal. Thedrift of the SOP of the signal between -factor measurementshas no effect on the measurement uncertainty in the -factor.
Fig. 5. Drift of the SOP of the signal over 1 h in an 8-m PM fiber with 10 psDGD. (a) Drift of the SOP on the Poincaré sphere. Here, �� is the SOP ofthe signal. (b) Drift of the Stokes parameters of �� . (c) Angle � shown in (a)through which the SOP drifts during each 1-min interval of a 60-min measure-ment period.
As in the Monte Carlo simulations, we designed experimentsto validate formula (15) by comparing the -factors obtainedfrom the theory and the experiment. In the experiments, wechose two power-splitting ratios of 0 and 0.5. For each power-splitting ratio, two levels of the DOP of the noise were used,which were 0.5 and 1.0. For each power-splitting ratio and eachDOP of the noise, we varied the angle between the SOP of thesignal and the polarized part of noise. For each angle, we mea-sured the -factor and the Stokes vectors of the signal and thepolarized part of the noise. We then used these measured Stokesvectors to calculate the -factor from (1)–(3) and (15) using themethod described in [20].
First, we studied the case where the power-splitting ratiois equal to 0 by launching the signal in the principal state
. In this case, the SOP of the signal wasfixed and stable over time. We varied the angle betweenand the polarized part of the noise by rotating in
Authorized licensed use limited to: University of Maryland Baltimore Cty. Downloaded on January 24, 2010 at 06:45 from IEEE Xplore. Restrictions apply.

JIAO et al.: RECEIVER MODEL FOR DEPOLARIZED SIGNAL 4131
Fig. 6. Drift of the SOP of the signal in an 8-m PM fiber with 10 ps DGDwhen the fiber is placed in water. (a) Drift of the SOP on the Poincaré sphere.(b) Drift of Stokes parameters. (c) Drift angle of the SOP of the signal during1-min intervals.
Fig. 7. Experimental setup for a splitting factor of �� � � �.
increments in the – plane. The eight positions of areindicated by the small circles in Fig. 7. For each angle between
and , we repeatedly measured the -factor 70 times andused the mean -factor to average out the random fluctuations.
In Fig. 8, we show the mean -factor as a function of theangle between and in the case that . For theresults in Fig. 8(a) and (b), we set the DOP of the noise to be 0.5
Fig. 8. �-factor as a function of the angle between �� and �� for a splittingfactor of �� � � �. (a) ��� � ���. (b) ��� � ���.
and 1.0, respectively. The symbols are the measured results andthe lines represent the results calculated using (1)–(3) and (15).
From Fig. 8, we see that the measured -factor is in goodagreement with the theoretical results. The mean differences be-tween the measured and calculated -factors for the eight an-gles are 0.26 and 0.25 when the DOP of the noise is 0.5 and 1.0,respectively. Just as we saw from the Monte Carlo simulationsdiscussed in Section III, the -factor attains its minimum andthe maximum when the angles between and is 0 and
, respectively. The magnitude of the variation of the -factoris also a function of the DOP of the noise. From the calculatedresults, the variation of the -factor increases from 2.6 to 7.2when the DOP of the noise is increased from 0.5 to 1.0.
Next, we consider the case where the signal power is equallysplit between the two principal modes, i.e., . Thiscase is considered to be the worst case among all launching po-larization states because the signal is distorted the most. In thiscase, the SOP of the signal at the output of the PM fiber driftsslowly over time. As a result, it is difficult to fix the SOP of thesignal for a long time during the experiment. Since the SOP ofthe polarized part of noise is stable, we fixed during the ex-periment, and let drift slowly on the circle in the – planewhere the power-splitting ratio is 0.5, as shown in Fig. 9. Forsimplicity, we plot the normalized Stokes vector onthe Poincaré sphere.
In Fig. 10, we plot the -factor as a function of the anglebetween and . For the results shown in Fig. 10(a) and (b),the DOPs of the noise were 0.5 and 1.0, respectively. The dia-monds represent the measured -factor and the circles representthe -factor calculated using (1)–(3) and (15) using the parame-ters , , and , which we measured in the experiments.
Authorized licensed use limited to: University of Maryland Baltimore Cty. Downloaded on January 24, 2010 at 06:45 from IEEE Xplore. Restrictions apply.

4132 JOURNAL OF LIGHTWAVE TECHNOLOGY, VOL. 27, NO. 18, SEPTEMBER 15, 2009
Fig. 9. Experimental setup for a splitting factor of �� � � ���.
Fig. 10. �-factor as a function of the angle between �� and �� for a splittingfactor of �� � � ���. (a) ��� � ���. (b) ��� � ���.
In this case, the -factor is not averaged over time as in theprevious case because is not stable for long enough time.Instead, we plot the correlation between the -factor and thecorresponding angle between and . Note that the the-oretically computed -factors do not exactly lie on a smoothcurve because of uncertainties in the measurement of and
. Due to the measurement uncertainty in the -factor itselfand the slow drift of the SOP of the signal during the experi-ment, the measured -factor shows larger scattering comparedto the calculated -factor. However, the deviations in most ofthe -factors obtained from the experiments and the theory areless than 0.2 in Fig. 10(a) and less than 0.3 in Fig. 10(b), respec-tively. The level of agreement between the theory and the ex-periment is very good since the measurement uncertainty of the
-factor itself is around 0.1 in a back-to-back system withoutPMD when everything is fixed and stable.
V. LIMITATIONS OF THE THEORY
In previous sections, we introduced and validated a theoret-ical receiver model that quantifies the combined effect of first-order PMD acting on the signal and PDL acting on the noise.However, the higher order PMD of the randomly birefringentfiber in real optical communication systems can also affect thesystem performance by changing the shape of the pulses and theSOP of the signal. In this section, we use numerical simulationsto investigate the accuracy with which the theory predicts thesystem performance in a more realistic situation in which thesignal is impaired by higher order as well as first-order PMD.As in the previous sections, we assume that PDL only acts onthe noise and not on the signal.
To address this issue, we replace the PM fiber in the modelsystem shown in Fig. 1 by a segment of randomly birefrin-gent fiber. Rather than gathering statistics over a large collectionof random fibers, we generate one-parameter families of fiberswith increasing values of DGD. Because of the well-establishedcorrelation between DGD and SOPMD [31], this procedure al-lows us to easily generate fibers with a wide range of SOPMDvalues.
We used the coarse-step method [32] to generate one-param-eter families of fibers as follows. Each fiber in a family con-sisted of sections of the PM fiber. For each family, we made arandom choice of the polarization rotation between each section.We use the same set of rotations for all fibers in the family. Thedifferent fibers in a family were then determined by the choiceof a single DGD value for all sections.
For each fiber in a family, we compared the -factor cal-culated using a Monte Carlo simulation to that obtained fromthe theory. Using this procedure, we determined how large theSOPMD becomes before the receiver model starts to breakdown. Although our results depend on the choice of polarizationrotations used for each family, we expect qualitatively similarresults to hold for completely random fibers.
In the Monte Carlo simulations, we computed the DGD andPSP of the fiber at the central frequency of the signal as wellas the DOP and SOP of both the signal and noise. These quan-tities were then used as the values of the input parameters tothe theoretical receiver model. For all simulations, we set theDOP of the noise to be 0.5 and the OSNR at the receiver tobe 15 dB. For simplicity, we sampled the signal at the centerof each bit slot rather than using an automated clock recoveryalgorithm.
To validate the entire procedure, we first generated a familyfor which the fibers only had first-order PMD, i.e., we set thenumber of sections to be . In this case, we would expectthe agreement between the theory and Monte Carlo simulationto be limited only by the statistical uncertainty in the MonteCarlo simulations. For simplicity, we set the power-splittingratio to be 0.5. To obtain the minimum and maximum -fac-tors for this splitting ratio, we set and ,respectively. In Fig. 11, we plot the simulated and theoretical
-factors as a function of the DGD. The agreement between
Authorized licensed use limited to: University of Maryland Baltimore Cty. Downloaded on January 24, 2010 at 06:45 from IEEE Xplore. Restrictions apply.

JIAO et al.: RECEIVER MODEL FOR DEPOLARIZED SIGNAL 4133
Fig. 11. �-factors obtained from Monte Carlo simulations and formula (15) asa function of DGD when only first-order PMD is included in the fiber model.
TABLE IVALUES OF DGD AND SOPMD FOR FAMILIES OF FIBERS WITH SMALLER AND
LARGER SOPMD TOGETHER WITH THE CORRESPONDING �-FACTORS WHEN
THE POLARIZED PART OF NOISE IS IN THE SAME OR OPPOSITE DIRECTION TO
THE SOP OF THE SIGNAL AT THE OUTPUT OF THE FIBER
the theory and the Monte Carlo simulations is excellent, evenfor DGD values as large as 50 ps.
Next, to investigate the limitations of the theoretical modelin the presence of higher order PMD, we applied the proceduredescribed before to generate families of fibers withsections. We generated a smaller SOPMD and a larger SOPMDfamily, each of which consisted of five fibers with DGD valuesranging from 10 to 50 ps. The values of the DGD and SOPMDof these fibers are given in Table I.
For the smaller SOPMD family, the values of SOPMD werebetween about 45% and 110% of the expected value, i.e.,
of the SOPMD, whereas for thelarger SOPMD family, the majority of SOPMD values wereabout three times the expected value. We chose the SOP of thepolarized part of the noise to be in the same (opposite) directionin Stokes space to the average SOP of the signal at the outputof the fiber, which enabled us to approximate the minimum
(respectively maximum) value of the -factor. In Table I, weshow these approximations to the minimum and maximum
-factors computed using both Monte Carlo simulations andusing the theoretical model. For both families of fibers, theabsolute error between the minimum -factor obtained usingMonte Carlo simulations and with the theoretical model is lessthan 1.5, even for very large value of SOPMD. However, theerror in maximum -factor obtained from the theory can beextremely large when the SOPMD is on the order of 1000 psor larger. Moreover, we find that for similar DGD values, thehigher the SOPMD, the larger the error in the theoreticallycomputed -factor. For these two families of fibers, we requireSOPMD values on the order of 300 ps or less to ensure thatthe error in the theoretical -factor is less than 0.5 for both theminimum and maximum -factors.
VI. CONCLUSION
In conclusion, we systematically investigated the combinedeffect of first-order PMD and the PDL on the system perfor-mance when PMD induces significant distortion and depolariza-tion of the signal and PDL causes the noise to become partiallypolarized. We derived a formula for the variance of the electriccurrent in the marks and the spaces that is due to the beatingbetween a depolarized signal and partially polarized noise. Thisformula correctly accounts for the optical pulse shape and theshapes of the electrical and the optical filters. We validated thisformula by comparing the -factor obtained from the theory tothat obtained from numerical simulations and from experiments,and we obtained very good agreement. The receiver model thatwe have introduced and experimentally validated in this papercan be applied to systems in which neither waveform distortionsdue to PDL nor higher order PMD play a statistically significantrole in determining the distribution of the power penalty (or the
-factor). These conditions are expected to hold in many re-alistic systems, and specifically for those in which the averagePDL of the system does not exceed 5 dB [11] and the high-orderPMD is on the order of 300 ps or less. For such systems, themodel could in future be used to quantify the sources of vari-ation in the -factor. To illustrate the potential applications ofthe model, we showed that the BER varies from aboutto due to variations in the angle between the polarizationstates of the signal and noise when the DOP of the noise is 0.5and the PMD power-splitting ratio takes on the worst-case valueof 0.5.
In the future, the model could be more systematically appliedto compute the probability distribution of the -factor due torandom variations in the polarization effects. Such a -distri-bution could help system designers allocate a power margin forpolarization effects in systems for which PDL-induced wave-form distortions and high-order PMD are insignificant. Finally,the theoretical and experimental results presented here estab-lish a solid foundation for more general future receiver modelsin which both signal and noise are impaired by distributed PDLand PMD.
Authorized licensed use limited to: University of Maryland Baltimore Cty. Downloaded on January 24, 2010 at 06:45 from IEEE Xplore. Restrictions apply.

4134 JOURNAL OF LIGHTWAVE TECHNOLOGY, VOL. 27, NO. 18, SEPTEMBER 15, 2009
REFERENCES
[1] F. Bruyère and O. Audouin, “Penalties in long-haul optical amplifiersystems due to polarization dependent loss and gain,” IEEE Photon.Technol. Lett., vol. 6, no. 5, pp. 654–656, May 1994.
[2] J. Zhou and M. J. O’Mahony, “Optical transmission system penal-ties due to fiber polarization mode dispersion,” IEEE Photon. Technol.Lett., vol. 6, no. 10, pp. 1265–1267, Oct. 1994.
[3] C. R. Menyuk, D. Wang, and A. N. Pilipetskii, “Repolarization ofpolarization-scrambled optical signals due to polarization dependentloss,” IEEE Photon. Technol. Lett., vol. 9, no. 9, pp. 1247–1249, Sep.1997.
[4] L.-S. Yan, Q. Yu, Y. Xie, and A. E. Willner, “Experimental demon-stration of the system performance degradation due to the combinedeffect of polarization-dependent loss with polarization-mode disper-sion,” IEEE Photon. Technol. Lett., vol. 14, no. 2, pp. 224–226, Feb.2002.
[5] Y. Sun, I. T. Lima, Jr., A. O. Lima, H. Jiao, J. Zweck, L. Yan, G. M.Carter, and C. R. Menyuk, “System performance variations due to par-tially polarized noise in a receiver,” IEEE Photon. Technol. Lett., vol.15, no. 11, pp. 1648–1650, Nov. 2003.
[6] A. Mecozzi and M. Shtaif, “The statistics of polarization-dependentloss in optical communication systems,” IEEE Photon. Technol. Lett.,vol. 14, no. 3, pp. 313–315, Mar. 2002.
[7] C. Xie and L. F. Mollenauer, “Performance degradation induced bypolarization-dependent loss in optical fiber transmission systems withand without polarization-mode dispersion,” J. Lightw. Technol., vol.21, no. 9, pp. 1953–1957, Sep. 2003.
[8] M. Shtaif and A. Mecozzi, “Polarization-dependent loss and its ef-fect on the signal-to-noise ratio in fiber-optic systems,” IEEE Photon.Technol. Lett., vol. 16, no. 2, pp. 671–673, Feb. 2004.
[9] D. Wang and C. R. Menyuk, “Calculation of penalties due to po-larization effects in a long-haul WDM system using a Stokes pa-rameter model,” J. Lightw. Technol., vol. 19, no. 4, pp. 487–494,Apr. 2001.
[10] B. Huttner, C. Geiser, and N. Gisin, “Polarization-induced distortion inoptical fiber networks with polarization mode dispersion and polariza-tion-dependent losses,” IEEE J. Sel. Topics Quantum Electron., vol. 6,no. 2, pp. 317–329, Mar./Apr. 2000.
[11] M. Shtaif and O. Rosenberg, “Polarization-dependent loss as a wave-form-distorting mechanism and its effect on fiber-optical systems,” J.Lightw. Technol., vol. 23, no. 2, pp. 923–930, Feb. 2005.
[12] N. Y. Kim, D. Lee, H. Yoon, J. Park, and N. Park, “Limitation of PMDcompensation due to polarization dependent loss in high-speed opticaltransmission links,” IEEE Photon. Technol. Lett., vol. 14, no. 1, pp.104–106, Jan. 2002.
[13] I. T. Lima, Jr., A. O. Lima, Y. Sun, H. Jiao, J. Zweck, C. R. Menyuk,and G. M. Carter, “A receiver model for optical fiber communicationsystems with arbitrarily polarized noise,” J. Lightw. Technol., vol. 23,no. 3, pp. 1478–1490, Mar. 2005.
[14] J. L. Rebola and A. V. T. Cartaxo, “Performance evaluation of opti-cally preamplified receivers with partially polarized noise and arbitraryoptical filtering: A rigorous approach,” Proc. Inst. Electr. Eng. Opto-electron., vol. 152, pp. 251–262, 2005.
[15] L. Chen, Z. Zhang, and X. Bao, “Combined PMD-PDL effects on BERsin simplified optical systems: An analytical approach,” Opt. Exp., vol.15, pp. 2106–2119, 2007.
[16] Z. Zhang, L. Chen, and X. Bao, “Accurate BER evaluation for lumpedDPSK and OOK systems with PMD and PDL,” Opt. Exp., vol. 15, pp.9418–9433, 2007.
[17] D. Marcuse, “Derivation of analytical expressions for the bit-errorprobability in lightwave systems with optical amplifiers,” J. Lightw.Technol., vol. 8, no. 12, pp. 1816–1823, Dec. 1990.
[18] P. A. Humblet and M. Azizoglu, “On the bit error rate of lightwavesystems with optical amplifiers,” J. Lightw. Technol., vol. 9, no. 11, pp.1576–1582, Nov. 1991.
[19] E. Forestieri, “Evaluating the error probability in lightwave systemswith chromatic dispersion, arbitrary pulse shape and pre-and postde-tection filtering,” J. Lightw. Technol., vol. 18, no. 11, pp. 1493–1503,Nov. 2000.
[20] P. J. Winzer, M. Pfennigbauer, M. M. Strasser, and W. R. Leeb, “Op-timum filter bandwidth for optically preamplified NRZ receivers,” J.Lightw. Technol., vol. 19, no. 9, pp. 1263–1273, Sep. 2001.
[21] J. L. Rebola and A. V. T. Cartaxo, “Power penalty assessment in opti-cally preamplified receivers with arbitrary optical filtering and signal-dependent noise dominance,” J. Lightw. Technol., vol. 20, no. 3, pp.401–408, Mar. 2002.
[22] M. Pfennigbauer, M. M. Strasser, M. Pauer, and P. J. Winzer, “Depen-dence of optically preamplified receiver sensitivity on optical and elec-trical filter bandwidths—Measurement and simulation,” IEEE Photon.Technol. Lett., vol. 14, no. 6, pp. 831–833, Jun. 2002.
[23] J. Zweck and C. R. Menyuk, “Validity of the additive white Gaussiannoise model for quasi-linear long-haul return-to-zero optical fiber com-munications systems,” J. Lightw. Technol., 2009, to be published.
[24] I. T. Lima, Jr., and A. M. Lima, “Computation of the probability ofpower penalty and �-penalty outages due to PMD,” in Proc. LEOSAnnu. Meeting, 2003, pp. 316–317, Paper TuQ1.
[25] W. Xi, T. Adali, and J. Zweck, “A MAP equalizer for the opticalcommunications channel,” J. Lightw. Technol., vol. 23, no. 12, pp.3989–3996, Dec. 2005.
[26] A. Mecozzi and M. Shtaif, “Signal-to-noise-ratio degradation causedby polarization-dependent loss and the effect of dynamic gain equal-ization,” J. Lightw. Technol., vol. 22, no. 8, pp. 1856–1871, Aug. 2004.
[27] J. P. Gordon and H. Kogelnik, “PMD fundamentals: Polarization modedispersion in optical fibers,” Proc. Nat. Acad. Sci. USA, vol. 97, pp.4541–4550, 2000.
[28] H. Xu, H. Jiao, L. Yan, and G. M. Carter, “Measurement of distribu-tions of differential group delay in a recirculating loop with and withoutloop-synchronous scrambling,” IEEE Photon. Technol. Lett., vol. 16,no. 7, pp. 1691–1693, Jul. 2004.
[29] N. Bergano, F. W. Kerfoot, and C. R. Davidson, “Margin measure-ments in optical amplifier systems,” IEEE Photon. Technol. Lett., vol.5, no. 3, pp. 304–306, Mar. 1993.
[30] M. Karlsson, J. Brentel, and P. A. Andrekson, “Long-term measure-ment of PMD and polarization drift in installed fibers,” J. Lightw.Technol., vol. 18, no. 7, pp. 941–951, Jul. 2000.
[31] E. Ibragimov, G. Shtengel, and S. Suh, “Statistical correlation betweenfirst and second-order PMD,” J. Lightw. Technol., vol. 20, no. 4, pp.586–590, Apr. 2002.
[32] D. Marcuse, C. R. Menyuk, and P. K. A. Wai, “Application of the Man-akov-PMD equation to studies of signal propagation in optical fiberswith randomly varying birefringence,” J. Lightw. Technol., vol. 15, no.9, pp. 1735–1746, Sep. 1997.
Hua Jiao (M’99) received the B.S. and M.S. degreesfrom Peking University, Beijing, China, in 1996and 1999, respectively, and the Ph.D. degree fromthe University of Maryland Baltimore County,Baltimore, in 2007.
In 2006, he joined AT&T Laboratories, SanRamon, CA, where he was involved in the fieldof xDSL technologies. In 2008, he joined Ciena,Linthicum, MD, where he is engaged in research ontunable lasers, modulators, and plug-in optics.
John Zweck received the B.Sc. degree (with honors)from the University of Adelaide, Adelaide, S.A.,Australia, in 1988, and the Ph.D. degree in mathe-matics from Rice University, Houston, TX, in 1993.
He was engaged in research on differential ge-ometry, human and computer vision, computationalanatomy, and modeling of optical systems. Since2006, he has been an Associate Professor of math-ematics and statistics and an Affiliate AssociateProfessor of computer science and electrical engi-neering at the University of Maryland Baltimore
County (UMBC), Baltimore, where he was a Research Associate in the Depart-ment of Computer Science and Electrical Engineering from 2000 to 2003, andan Assistant Professor in the Department of Mathematics and Statistics from2003 to 2006. His current research interests include modeling of optical fibercommunications systems, short-pulse lasers, and photoacoustic spectroscopysensors. He is the Lead Developer of software PhoSSiL, the Photonics SystemsSimulator Library.
Dr. Zweck is a member of the Society for Industrial and AppliedMathematics.
Authorized licensed use limited to: University of Maryland Baltimore Cty. Downloaded on January 24, 2010 at 06:45 from IEEE Xplore. Restrictions apply.

JIAO et al.: RECEIVER MODEL FOR DEPOLARIZED SIGNAL 4135
Li Yan (S’84–M’87) received the B.S. degree in physics from the Universityof Science and Technology of China, Hefei, China, in 1982, and the M.S. andPh.D. degrees in physics from the University of Maryland, College Park, in 1986and 1989, respectively.
In 1990, he joined the Faculty of Electrical Engineering, University of Mary-land Baltimore County (UMBC), Baltimore, where he is currently a Professorin the Department of Computer Science and Electrical Engineering. His currentresearch interests include ultrafast optics, solid-state lasers, optical communi-cations, and nonlinear optics.
Curtis R. Menyuk (SM’88–F’98) was born inMarch 26, 1954. He received the B.S. and M.S.degrees from Massachusetts Institute of Technology(MIT), Cambridge, in 1976, and the Ph.D. degreefrom the University of California Los Angeles(UCLA), Los Angeles, in 1981.
He was a Research Associate at the University ofMaryland, College Park, and at Science ApplicationsInternational Corporation, McLean, VA. In 1986, hebecame an Associate Professor in the Departmentof Electrical Engineering, University of Maryland
Baltimore County (UMBC), Baltimore, where he was promoted to a Professorin 1993 and was a former Presidential Research Professor. He was the foundingmember of the Department of Electrical Engineering, UMBC. From Fall1996 until Fall 2002, he was on partial leave from UMBC. From 1996 to2001, he worked part time at the Department of Defense, DoD Laboratoryfor Telecommunications Sciences, Adelphi, MD, where he codirected theOptical Networking Program from 1999 to 2001. During 2001–2002, he wasa Chief Scientist at PhotonEx Corporation. He is engaged in research ontheoretical and computational studies of lasers, nonlinear optics, and fiber opticcommunications for the last 18 years. He has authored or coauthored more than200 archival journal publications as well as numerous other publications andpresentations, and has also edited three books.
Prof. Menyuk is a member of the Society for Industrial and Applied Mathe-matics and the American Physical Society. He is a Fellow of the Optical Societyof America.
Gary M. Carter, photograph and biography not available at the time ofpublication.
Authorized licensed use limited to: University of Maryland Baltimore Cty. Downloaded on January 24, 2010 at 06:45 from IEEE Xplore. Restrictions apply.