Embed Size (px)
Citation preview
Mangrove Estates Site Mixed Use Development EIR Section 4.11 Transportation and Circulation
City of Los Angeles4.11-1
4.11 TRANSPORTATION AND CIRCULATION
This section analyzes onsite development’s impacts to the local transportation and circulation system. The analysis is based upon the traffic study prepared by KOA Corporation (January 2010). The study is included in its entirety in Appendix G.
4.11.1 Setting
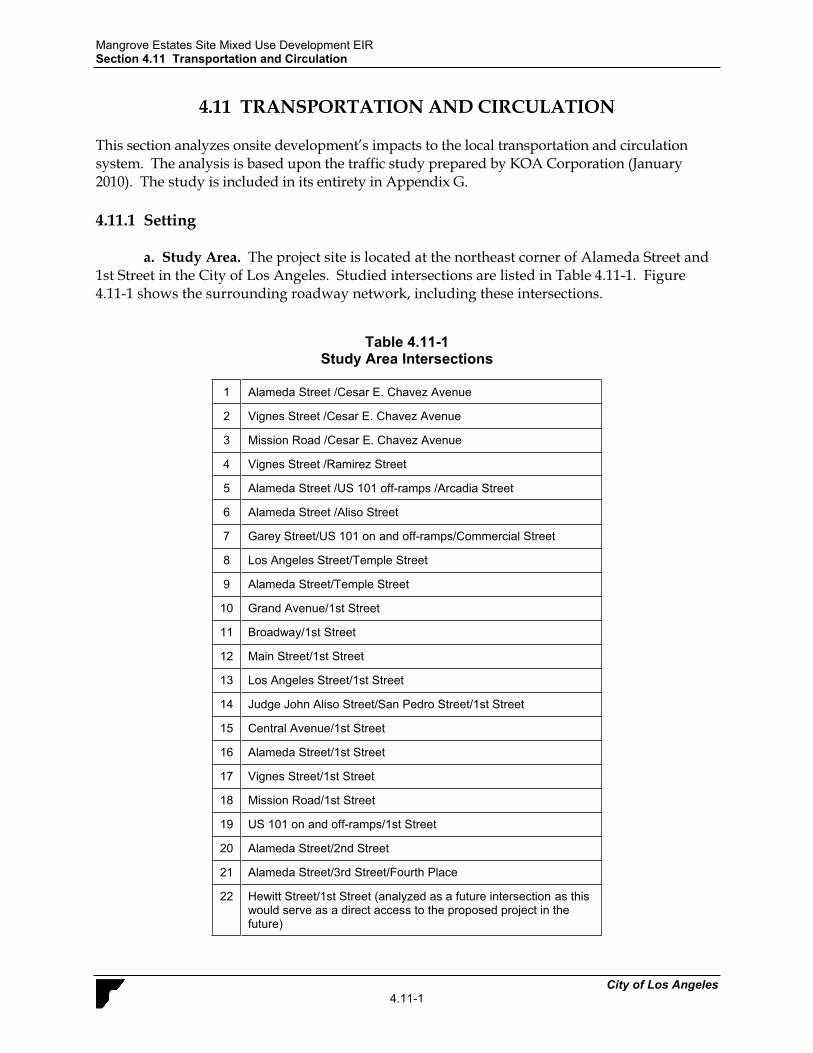
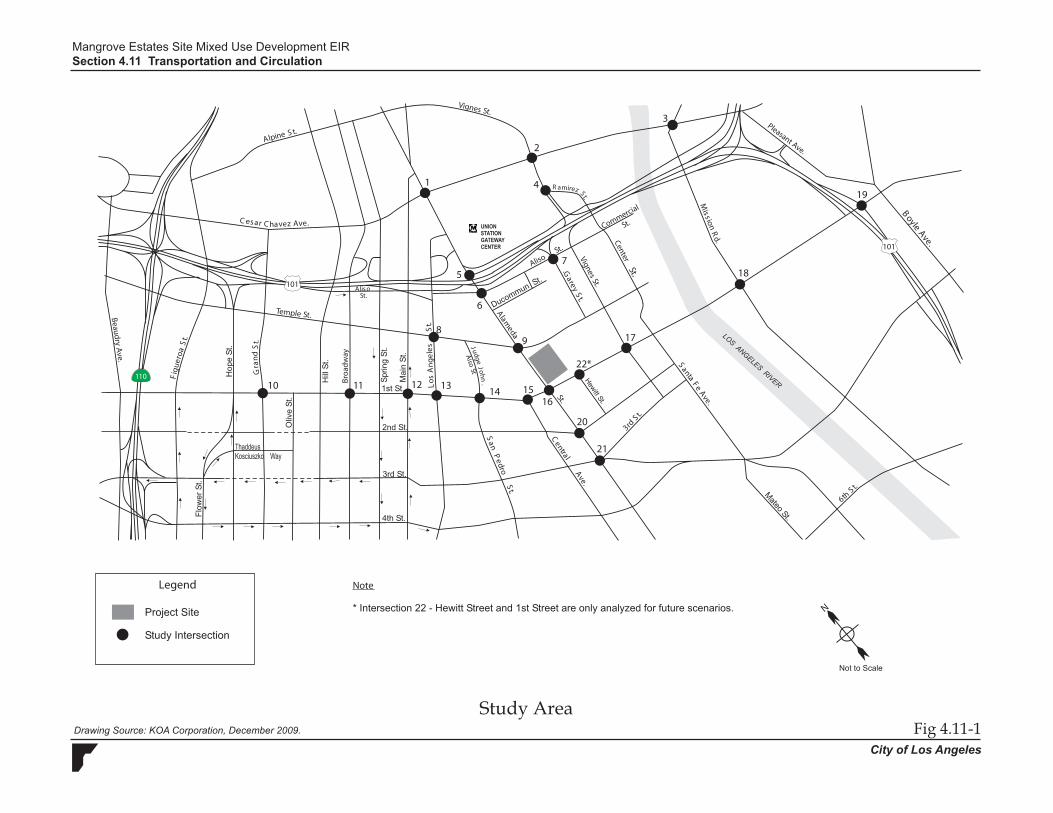
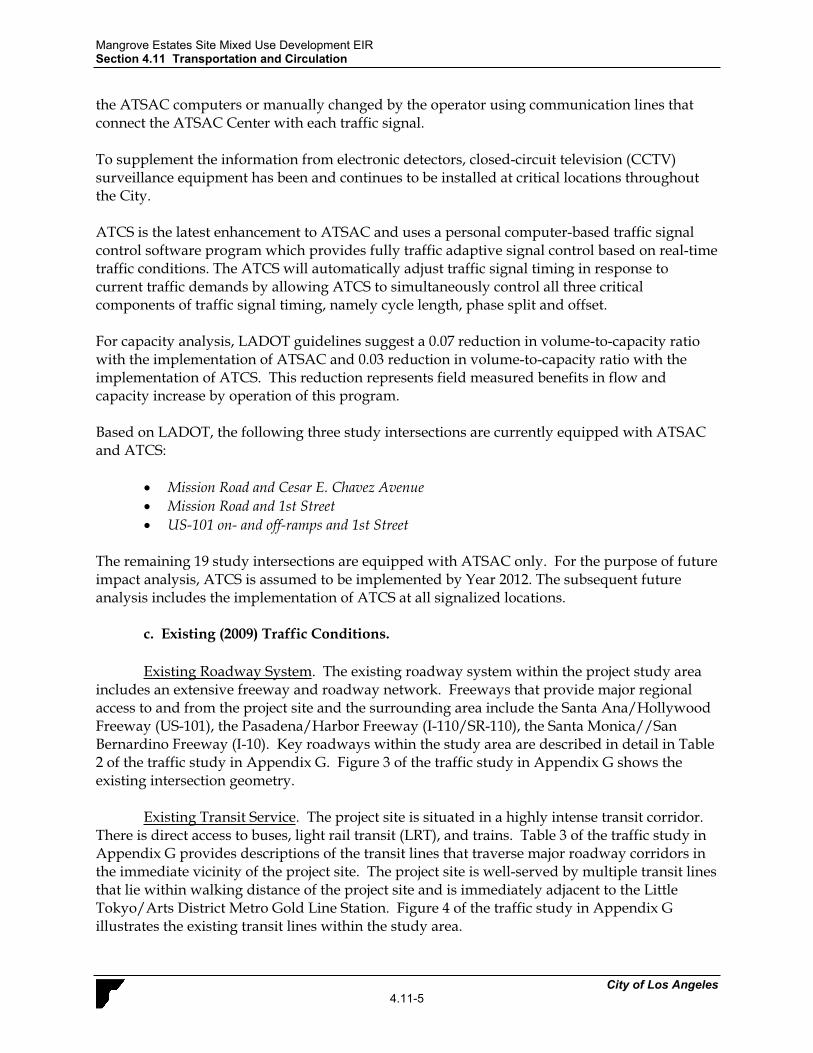
a. Study Area. The project site is located at the northeast corner of Alameda Street and 1st Street in the City of Los Angeles. Studied intersections are listed in Table 4.11-1. Figure 4.11-1 shows the surrounding roadway network, including these intersections.
Table 4.11-1 Study Area Intersections
1 Alameda Street /Cesar E. Chavez Avenue
2 Vignes Street /Cesar E. Chavez Avenue
3 Mission Road /Cesar E. Chavez Avenue
4 Vignes Street /Ramirez Street
5 Alameda Street /US 101 off-ramps /Arcadia Street
6 Alameda Street /Aliso Street
7 Garey Street/US 101 on and off-ramps/Commercial Street
8 Los Angeles Street/Temple Street
9 Alameda Street/Temple Street
10 Grand Avenue/1st Street
11 Broadway/1st Street
12 Main Street/1st Street
13 Los Angeles Street/1st Street
14 Judge John Aliso Street/San Pedro Street/1st Street
15 Central Avenue/1st Street
16 Alameda Street/1st Street
17 Vignes Street/1st Street
18 Mission Road/1st Street
19 US 101 on and off-ramps/1st Street
20 Alameda Street/2nd Street
21 Alameda Street/3rd Street/Fourth Place
22 Hewitt Street/1st Street (analyzed as a future intersection as this would serve as a direct access to the proposed project in the future)
R amirez St.
N
Garey
St.
.
Vignes St.
VignesSt.
UNIONSTATIONGATEWAYCENTER
Legend
Temple St.
Thaddeus
Cesar Chavez Ave.
BeaudryAve.
Figue
roaSt.
Broa
dway
Grand
St.
LosAng
eles
St.
S
t.
a
S
nPedro
Alameda
St.
osilA
Aliso
St.
Comme
rcial
St.
101
101
110
St.
Central
Ave.
S antaFe
Ave.
CenterSt.
Alpine S t.
Mission
Rd.
BoyleAve.
Pleasant Ave.
6thSt.
3rdSt.
JudgeJohn
.
Aiso
St
1
2
3
4
5
6
7
9
10 11 12 13
8
14 1516
17
22*
18
19
20
21
Note
Drawing Source: KOA Corporation, December 2009.
Mangrove Estates Site Mixed Use Development EIRSection 4.11 Transportation and Circulation
Fig 4.11-1City of Los Angeles
Study Area
Mangrove Estates Site Mixed Use Development EIR Section 4.11 Transportation and Circulation
City of Los Angeles4.11-3
b. Traffic Analysis Methodology. Guidelines defined by LADOT’s “Guidelines for Traffic Impact Analysis Reports - August 2003” were utilized to develop this traffic study.
Project Traffic Volumes. Existing (Year 2009) traffic volumes along 1st Street are not representative of normal conditions since Metro Gold Line construction, along with the current economic downturn, are currently altering normal traffic patterns in the construction area. Therefore, the basis for future analysis would inaccurately reflect daily traffic conditions along intersections on 1st Street, including:
Grand Avenue and 1st Street Broadway and 1st Street Main Street and 1st Street Los Angeles Street and 1st Street Judge John Aliso Street/San Pedro Street and 1st Street Central Avenue and 1st Street Alameda Street and 1st Street Vignes Street and 1st Street Mission Road and 1st Street U.S. 101 on/off ramps and 1st Street
The following assumptions were utilized in the preparation of this traffic study:
Existing (Year 2009) Conditions – the Year 2009 traffic volumes would be utilized as the existing conditions with noted construction activities. Future (Year 2015) Without Project Conditions – traffic volumes from previous traffic studies in 2004 (Proposition Q and F Civic Center Public Safety Facilities Traffic and Parking Study; East Los Angeles Area New High School No.1) and 2005 (Grand Avenue Project EIR Traffic Study) would be used as the adjusted Year 2009 base with the inclusion of 0.5% adjustment every year between 2004/2005 to 2009, and then an annual growth rate of 1.0% in addition to related projects would be applied to forecast Year 2015 conditions. Future (Year 2015) with Project Conditions – would include the Future (Year 2015) Without Project conditions plus the project.
Future Year 2015 without Project Conditions. In order to acknowledge regional traffic growth that would affect operations at the study intersections during the project opening year of 2015, an ambient/background traffic growth rate was applied. Per LADOT guidelines, an annual rate of 1.0% was utilized to estimate Year 2015 traffic conditions.
In addition to future ambient growth, traffic from area related projects (approved and pending developments) was also included as part of the Year 2015 analysis (see Table 3-1 in Section 3.0, Environmental Setting, for a list of related projects). KOA researched information from LADOT pertaining to area projects that would add measurable volumes to the study area intersections.
Level-of-Service Methodology. For analysis of Level of Service (LOS) at signalized intersections, LADOT has designated the Circular 212 Planning methodology as the desired tool. The concept of roadway level of service under the Circular 212 method is calculated as the
Mangrove Estates Site Mixed Use Development EIR Section 4.11 Transportation and Circulation
City of Los Angeles4.11-4
volume of vehicles that pass through the facility divided by the capacity of that facility. A facility is “at capacity” (V/C of 1.00 or greater) where extreme congestion occurs. This volume/capacity ratio value is a function of hourly volumes signal phasing, and approach lane configuration on each leg of the intersection.
Level of service (LOS) values range from LOS A to LOS F. LOS A indicates excellent operating conditions with little delay to motorists, whereas LOS F represents congested conditions with excessive vehicle delay. LOS E is typically defined as the operating “capacity” of a roadway. Table 4.11-2 defines the level-of-service criteria.
Table 4.11-2 Level-of-Service Definitions
LOS Interpretation
Signalized Intersection
Volume to Capacity Ratio (CMA)
A
Excellent operation. All approaches to the intersection appear quite open, turning movements are easily made, and nearly all drivers find freedom of operation.
0.000 - 0.600
B
Very good operation. Many drivers begin to feel somewhat restricted within platoons of vehicles. This represents stable flow. An approach to an intersection may occasionally be fully utilized and traffic queues start to form.
0.601 - 0.700
CGood operation. Occasionally backups may develop behind turning vehicles. Most drivers feel somewhat restricted.
0.701 - 0.800
DFair operation. There are no long-standing traffic queues. This level is typically associated with design practice for peak periods.
0.801 - 0.900
E Poor operation. Some long standing vehicular queues develop on critical approaches. 0.901 - 1.000
F
Forced flow. Represents jammed conditions. Backups from locations downstream or on the cross street may restrict or prevent movements of vehicles out of the intersection approach lanes; therefore, volumes carried are not predictable. Potential for stop and go type traffic flow.
Over 1.000
Source: Highway Capacity Manual, Special Report 209, Transportation Research Board, Washington D.C., 2000 and Interim Materials on Highway Capacity, NCHRP Circular 212, 1982
Automated Traffic Surveillance and Control (ATSAC) Project and Adaptive Traffic Control System (ATCS). ATSAC is a computer-based traffic signal control system whereby engineers monitor traffic conditions and system performance, selects appropriate signal timing (control) strategies, and performs equipment diagnostics and alert functions. Sensors in the street detect the passage of vehicles, vehicle speed, and the level of congestion. This information is received on a second-by-second (real-time) basis and is analyzed on a minute-by-minute basis at the ATSAC Operations Center to determine if better traffic flow can be achieved by changing the signal timing. If required, the signal timing is either automatically changed by
Mangrove Estates Site Mixed Use Development EIR Section 4.11 Transportation and Circulation
City of Los Angeles4.11-5
the ATSAC computers or manually changed by the operator using communication lines that connect the ATSAC Center with each traffic signal.
To supplement the information from electronic detectors, closed-circuit television (CCTV) surveillance equipment has been and continues to be installed at critical locations throughout the City.
ATCS is the latest enhancement to ATSAC and uses a personal computer-based traffic signal control software program which provides fully traffic adaptive signal control based on real-time traffic conditions. The ATCS will automatically adjust traffic signal timing in response to current traffic demands by allowing ATCS to simultaneously control all three critical components of traffic signal timing, namely cycle length, phase split and offset.
For capacity analysis, LADOT guidelines suggest a 0.07 reduction in volume-to-capacity ratio with the implementation of ATSAC and 0.03 reduction in volume-to-capacity ratio with the implementation of ATCS. This reduction represents field measured benefits in flow and capacity increase by operation of this program.
Based on LADOT, the following three study intersections are currently equipped with ATSAC and ATCS:
Mission Road and Cesar E. Chavez Avenue Mission Road and 1st Street US-101 on- and off-ramps and 1st Street
The remaining 19 study intersections are equipped with ATSAC only. For the purpose of future impact analysis, ATCS is assumed to be implemented by Year 2012. The subsequent future analysis includes the implementation of ATCS at all signalized locations.
c. Existing (2009) Traffic Conditions.
Existing Roadway System. The existing roadway system within the project study area includes an extensive freeway and roadway network. Freeways that provide major regional access to and from the project site and the surrounding area include the Santa Ana/Hollywood Freeway (US-101), the Pasadena/Harbor Freeway (I-110/SR-110), the Santa Monica//San Bernardino Freeway (I-10). Key roadways within the study area are described in detail in Table 2 of the traffic study in Appendix G. Figure 3 of the traffic study in Appendix G shows the existing intersection geometry.
Existing Transit Service. The project site is situated in a highly intense transit corridor. There is direct access to buses, light rail transit (LRT), and trains. Table 3 of the traffic study in Appendix G provides descriptions of the transit lines that traverse major roadway corridors in the immediate vicinity of the project site. The project site is well-served by multiple transit lines that lie within walking distance of the project site and is immediately adjacent to the Little Tokyo/Arts District Metro Gold Line Station. Figure 4 of the traffic study in Appendix G illustrates the existing transit lines within the study area.
Mangrove Estates Site Mixed Use Development EIR Section 4.11 Transportation and Circulation
City of Los Angeles4.11-6
In addition to the bus and LRT transit service, Union Station provides access to Amtrak and Metrolink train services. Amtrak operates as intercity rail service to the Central Coast and Central Valley and long distance service to the Pacific Northwest, Midwest, and Eastern United States. Metrolink operates as a commuter rail which links Los Angeles with other parts of Los Angeles County, Orange County, Riverside County, and San Bernardino County.
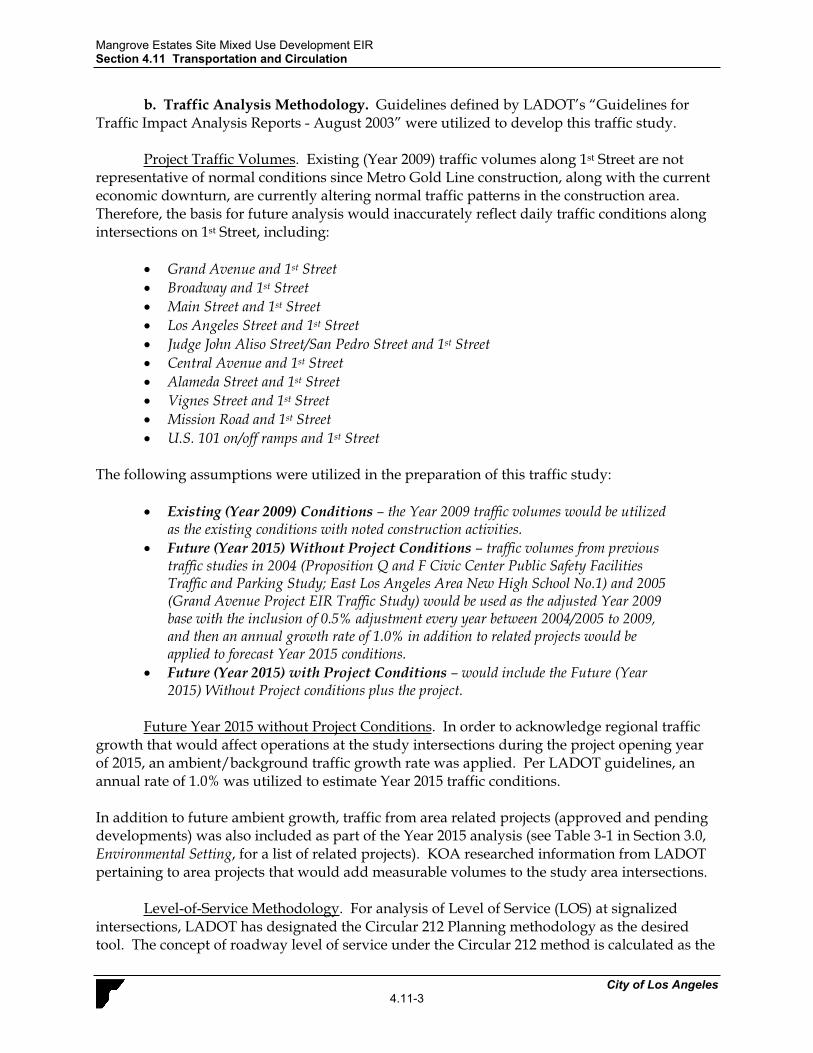
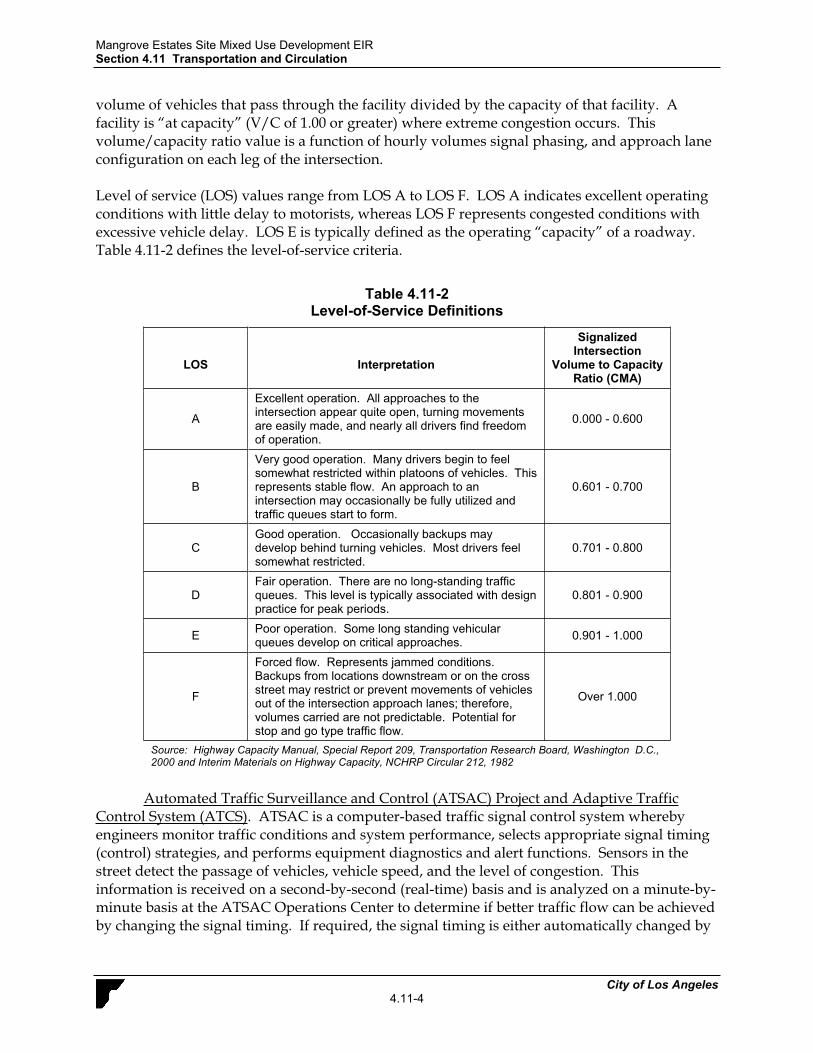
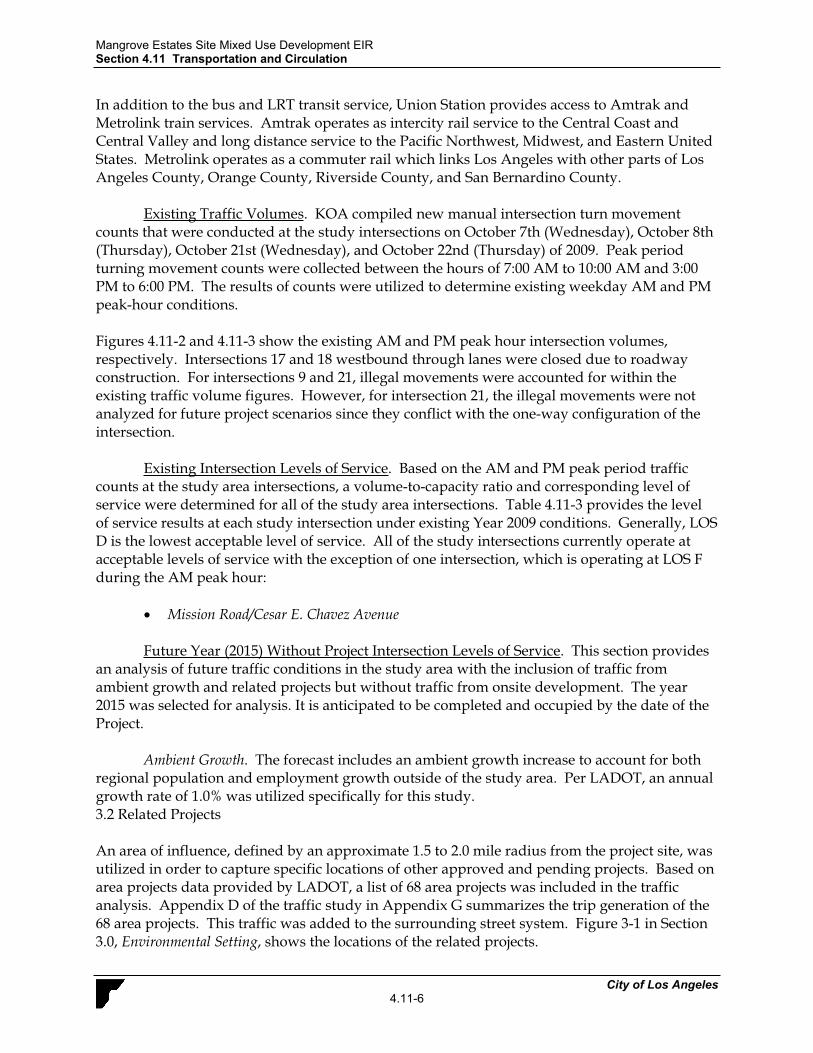
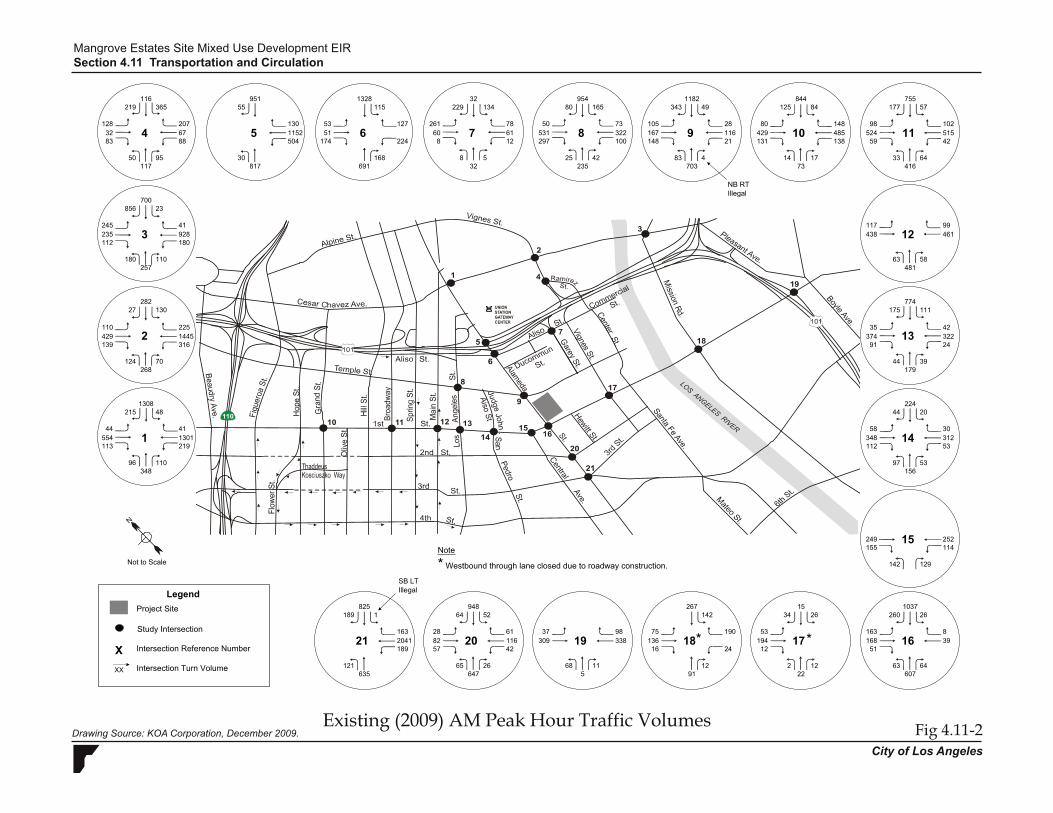
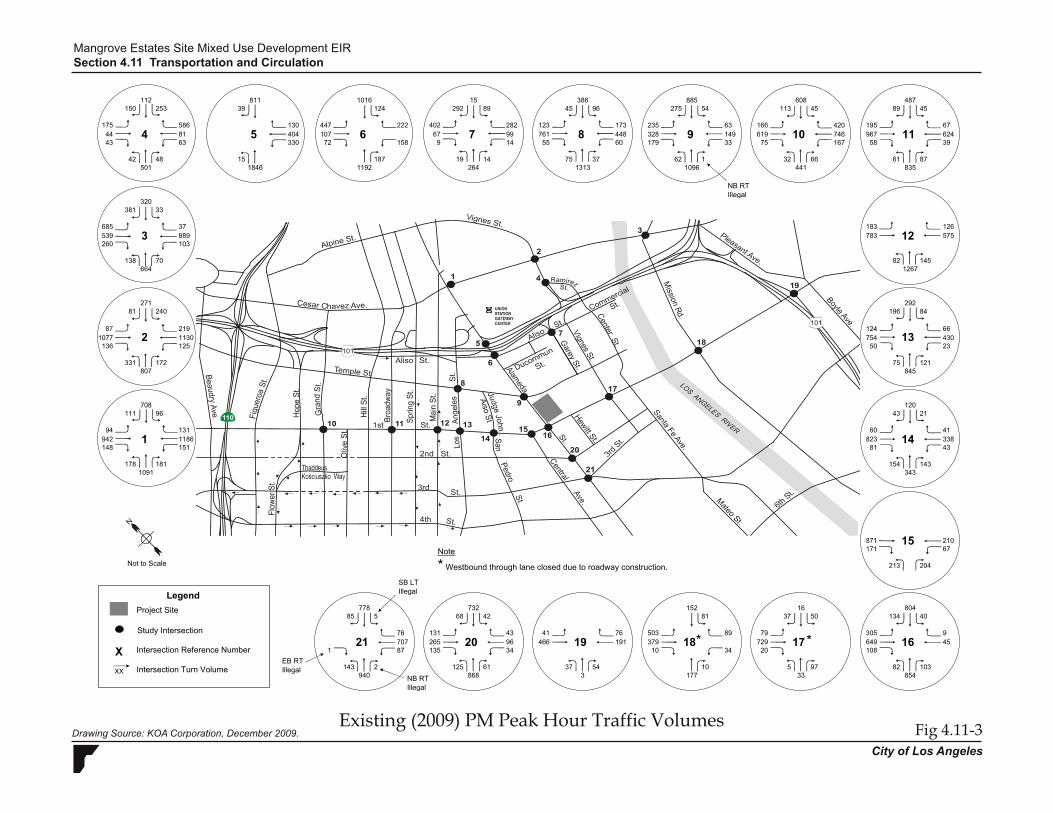
Existing Traffic Volumes. KOA compiled new manual intersection turn movement counts that were conducted at the study intersections on October 7th (Wednesday), October 8th (Thursday), October 21st (Wednesday), and October 22nd (Thursday) of 2009. Peak period turning movement counts were collected between the hours of 7:00 AM to 10:00 AM and 3:00 PM to 6:00 PM. The results of counts were utilized to determine existing weekday AM and PM peak-hour conditions.
Figures 4.11-2 and 4.11-3 show the existing AM and PM peak hour intersection volumes, respectively. Intersections 17 and 18 westbound through lanes were closed due to roadway construction. For intersections 9 and 21, illegal movements were accounted for within the existing traffic volume figures. However, for intersection 21, the illegal movements were not analyzed for future project scenarios since they conflict with the one-way configuration of the intersection.
Existing Intersection Levels of Service. Based on the AM and PM peak period traffic counts at the study area intersections, a volume-to-capacity ratio and corresponding level of service were determined for all of the study area intersections. Table 4.11-3 provides the level of service results at each study intersection under existing Year 2009 conditions. Generally, LOS D is the lowest acceptable level of service. All of the study intersections currently operate at acceptable levels of service with the exception of one intersection, which is operating at LOS F during the AM peak hour:
Mission Road/Cesar E. Chavez Avenue
Future Year (2015) Without Project Intersection Levels of Service. This section provides an analysis of future traffic conditions in the study area with the inclusion of traffic from ambient growth and related projects but without traffic from onsite development. The year 2015 was selected for analysis. It is anticipated to be completed and occupied by the date of the Project.
Ambient Growth. The forecast includes an ambient growth increase to account for both regional population and employment growth outside of the study area. Per LADOT, an annual growth rate of 1.0% was utilized specifically for this study. 3.2 Related Projects
An area of influence, defined by an approximate 1.5 to 2.0 mile radius from the project site, was utilized in order to capture specific locations of other approved and pending projects. Based on area projects data provided by LADOT, a list of 68 area projects was included in the traffic analysis. Appendix D of the traffic study in Appendix G summarizes the trip generation of the 68 area projects. This traffic was added to the surrounding street system. Figure 3-1 in Section 3.0, Environmental Setting, shows the locations of the related projects.
121 0635
1630 20410 189
825189 1
0
57 42
65 26
28 6182 116
5
94864 52
647
0
68 11
37
0
309 33824160
0
0 0
75136
98
22
2670 142
0 1291
12194
190
0
2 12
4232224
0
112 53
97 53
22444 20
91
17944 39
374
0
481
0
63 58
774175 111
35
99438 461
0 0
117
0
59 42
98
33 64416
524102515
755177 57
7141438
13821
148
73
28116
7861
131
80105167148
429 485
1182343 49
844125 84
25 42703
297
235
80 165
73
100322
32
50531
954
12
8 5
13432
229
8174 224
0 168
245235
0
856
44
928
429139
55441
113
112 180
257
130848215
282
180 110
53
0
504
130
817
0 1152
30
316
2191301
1328
51
691
348
83 8832 67
225
13027
11096
95155 0
0128 207
268124 70
11750 95
1101445
116219
41
70023
0563
601270
261
115
58 30348 312
156
00 0
1534 26
53 0
0
0 0249 252155 114
142 129
1037260 26
163 8168 39
607
51 0
63 64
1
Study Intersection
Intersection Reference Number
XX Intersection Turn Volume
X
Legend
2
3
4 5 6 7 8 9 10 11
12
13
Project Site
14
15
161718192021
Not to Scale
NB RT Illegal
Note
* Westbound through lane closed due to roadway construction.
**
SB LT Illegal
Drawing Source: KOA Corporation, December 2009.
Mangrove Estates Site Mixed Use Development EIRSection 4.11 Transportation and Circulation
Fig 4.11-2City of Los Angeles
Existing (2009) AM Peak Hour Traffic Volumes
143 2940
760 7071 87
77885 5
0
135 34
125 61
131 43265 96
3
73268 42
868
0
37 54
41
0
466 19134100
0
0 0
503379
76
33
1520 81
0 10177
20729
89
0
5 97
6643023
0
81 43
154 143
12043 21
50
84575 121
754
0
1267
0
82 145
292196 84
124
126783 575
0 0
183
0
58 39
195
61 87835
96767624
48789 45
6623126
16733
420
441
63149
28299
75
166235328179
746
885275 54
608113 45
1096
55
1313
619173
60448
75 37
8915
54292
123761
386
14
96
158
0 187264
19 14
685539
0
381
94
889
1077136
138 70
125
942131
148
260 103
664
70896111
271
447
0
330
130
72
1846
0 404
15
1511186
1016
107
1192
81139 0
0
0
1091
43 6344 81
219
24081
181178
175 586
807331 172
50142 48
871130
112150
37
32033
421352
60 41823 338
672220
402
9
343
00 0
1637 50
79 0
0
0 0871 210171 67
213 204
804134 40
305 9649 45
854
108 0
82 103
1
Study Intersection
Intersection Reference Number
XX Intersection Turn Volume
X
Legend
2
3
4 5 6 7 8 9 10 11
12
13
Project Site
14
15
161718192021
Not to Scale
NB RT Illegal
Note
* Westbound through lane closed due to roadway construction.
**
SB LT Illegal
EB RT Illegal
NB RT Illegal
Drawing Source: KOA Corporation, December 2009.
Mangrove Estates Site Mixed Use Development EIRSection 4.11 Transportation and Circulation
Fig 4.11-3City of Los Angeles
Existing (2009) PM Peak Hour Traffic Volumes
Mangrove Estates Site Mixed Use Development EIR Section 4.11 Transportation and Circulation
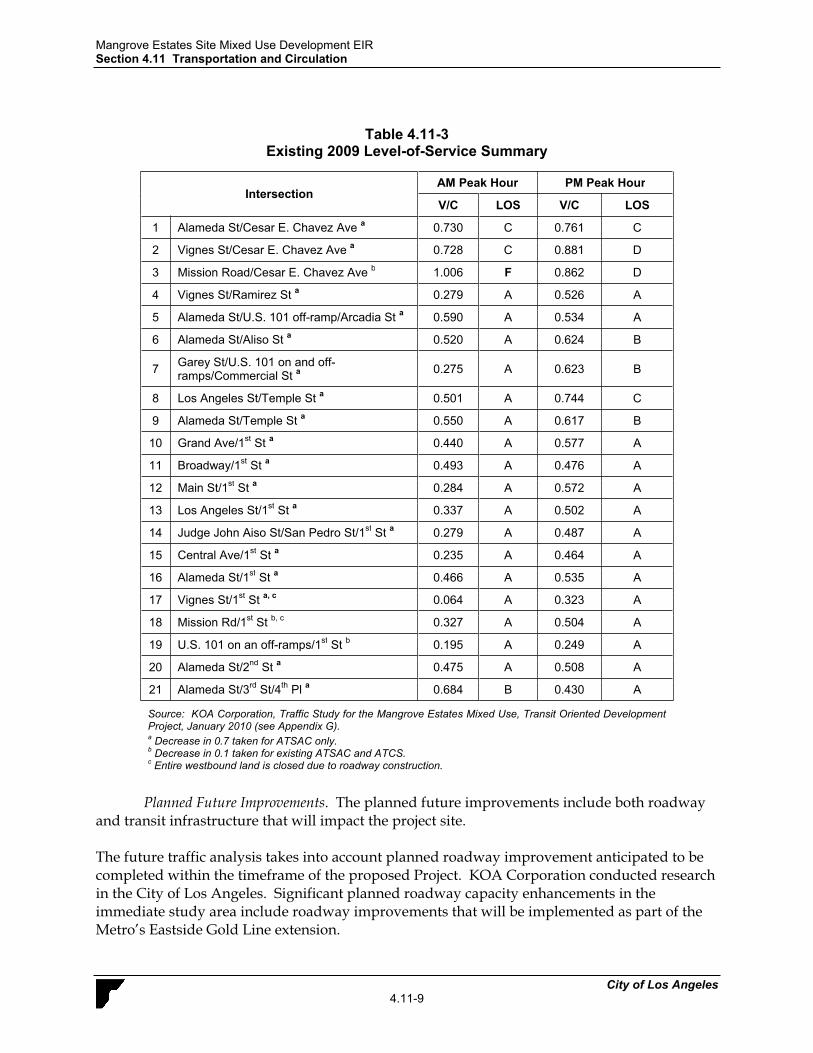
City of Los Angeles4.11-9
Table 4.11-3 Existing 2009 Level-of-Service Summary
Intersection AM Peak Hour PM Peak Hour
V/C LOS V/C LOS
1 Alameda St/Cesar E. Chavez Ave a 0.730 C 0.761 C
2 Vignes St/Cesar E. Chavez Ave a 0.728 C 0.881 D
3 Mission Road/Cesar E. Chavez Ave b 1.006 F 0.862 D
4 Vignes St/Ramirez St a 0.279 A 0.526 A
5 Alameda St/U.S. 101 off-ramp/Arcadia St a 0.590 A 0.534 A
6 Alameda St/Aliso St a 0.520 A 0.624 B
7 Garey St/U.S. 101 on and off-ramps/Commercial St a 0.275 A 0.623 B
8 Los Angeles St/Temple St a 0.501 A 0.744 C
9 Alameda St/Temple St a 0.550 A 0.617 B
10 Grand Ave/1st St a 0.440 A 0.577 A
11 Broadway/1st St a 0.493 A 0.476 A
12 Main St/1st St a 0.284 A 0.572 A
13 Los Angeles St/1st St a 0.337 A 0.502 A
14 Judge John Aiso St/San Pedro St/1st St a 0.279 A 0.487 A
15 Central Ave/1st St a 0.235 A 0.464 A
16 Alameda St/1st St a 0.466 A 0.535 A
17 Vignes St/1st St a, c 0.064 A 0.323 A
18 Mission Rd/1st St b, c 0.327 A 0.504 A
19 U.S. 101 on an off-ramps/1st St b 0.195 A 0.249 A
20 Alameda St/2nd St a 0.475 A 0.508 A
21 Alameda St/3rd St/4th Pl a 0.684 B 0.430 A
Source: KOA Corporation, Traffic Study for the Mangrove Estates Mixed Use, Transit Oriented Development Project, January 2010 (see Appendix G). a Decrease in 0.7 taken for ATSAC only. b Decrease in 0.1 taken for existing ATSAC and ATCS. c Entire westbound land is closed due to roadway construction.
Planned Future Improvements. The planned future improvements include both roadway and transit infrastructure that will impact the project site.
The future traffic analysis takes into account planned roadway improvement anticipated to be completed within the timeframe of the proposed Project. KOA Corporation conducted research in the City of Los Angeles. Significant planned roadway capacity enhancements in the immediate study area include roadway improvements that will be implemented as part of the Metro’s Eastside Gold Line extension.
Mangrove Estates Site Mixed Use Development EIR Section 4.11 Transportation and Circulation
City of Los Angeles4.11-10
The following summarizes the planned roadway improvements within the study area:
Hewitt Boulevard and 1st Street: On the northbound approach, the intersection would have a separate left turn lane and a shared through-right turn lane; on the southbound approach, the intersection would have a left turn lane, a through lane and an exclusive right turn lane. There would not be any changes in the eastbound and westbound approaches.
Vignes Street and 1st Street: On the westbound approach, the intersection would have a shared through-left turn lane and a shared through-right turn lane. There would not be any changes in the northbound, southbound, eastbound approaches.
Mission Road and 1st Street: On the northbound approach, the intersection would have a separate left turn lane and a shared through-right turn lane; on the southbound approach, the intersection would have a left turn lane, a through lane and an exclusive right turn lane; on the eastbound and westbound approaches, the intersection would have a left turn lane and a shared through-right turn lane.
Figure 8 of the traffic study in Appendix G summarizes the improvements graphically.
Two large infrastructure projects in the vicinity of the Project site that will provide the public with greater mobility in the region include the California High Speed Rail Project and the Metro Regional Connector Transit Corridor Project.
The California High Speed Rail Project would bring high-speed train service to California with service from San Francisco to Los Angeles. Lines would also connect Los Angeles to San Diego and provide service to Sacramento. Los Angeles would be linked via existing rail corridors into a station in the vicinity of Los Angeles Union Station. An Environmental Impact Report/Environmental Impact Statement (EIR/EIS) is currently being prepared for the Los Angeles to Anaheim segment and at least two alternatives for station location and alignments are being studied. The proposed project may include a parking facility south of the US-101 Freeway near Hewitt Street and Garey Street just north of the project site. The earliest operation date for the project is estimated at the Year 2020. Therefore, the project was not analyzed within this study since the impacts of the project will occur after the 2015 buildout year.
The Metro Regional Connector would directly connect the Metro Gold Line, Metro Expo Line, and Metro Blue Line. Metro is currently preparing an EIR/EIS to study a number of project alternatives that include below grade and at-grade alignments. A Regional Connector station is proposed to be located in the vicinity of the project site. One alternative that is being explored may require that additional public right-of-way be acquired from the south side of the project site to accommodate a four-track configuration east of the 1st Street and Alameda intersection. This alternative would likely have additional impact on turn movements along 1st Street and may affect the future operations of Hewitt Street; as a result, additional project-level environmental review will likely be required to study the impacts of such an alignment on site ingress and egress. While the exact impact of Metro’s Regional Connector project on the project site is unknown at this time, it is anticipated that the site will still be able to accommodate the same level of development. Regardless of the alternative selected the project site will continue to be served by a Metro light rail station. Since the Regional Connector project will not be
Mangrove Estates Site Mixed Use Development EIR Section 4.11 Transportation and Circulation
City of Los Angeles4.11-11
operational until 2018, after the timeframe of this EIR, this project was not included for analysis in this study.
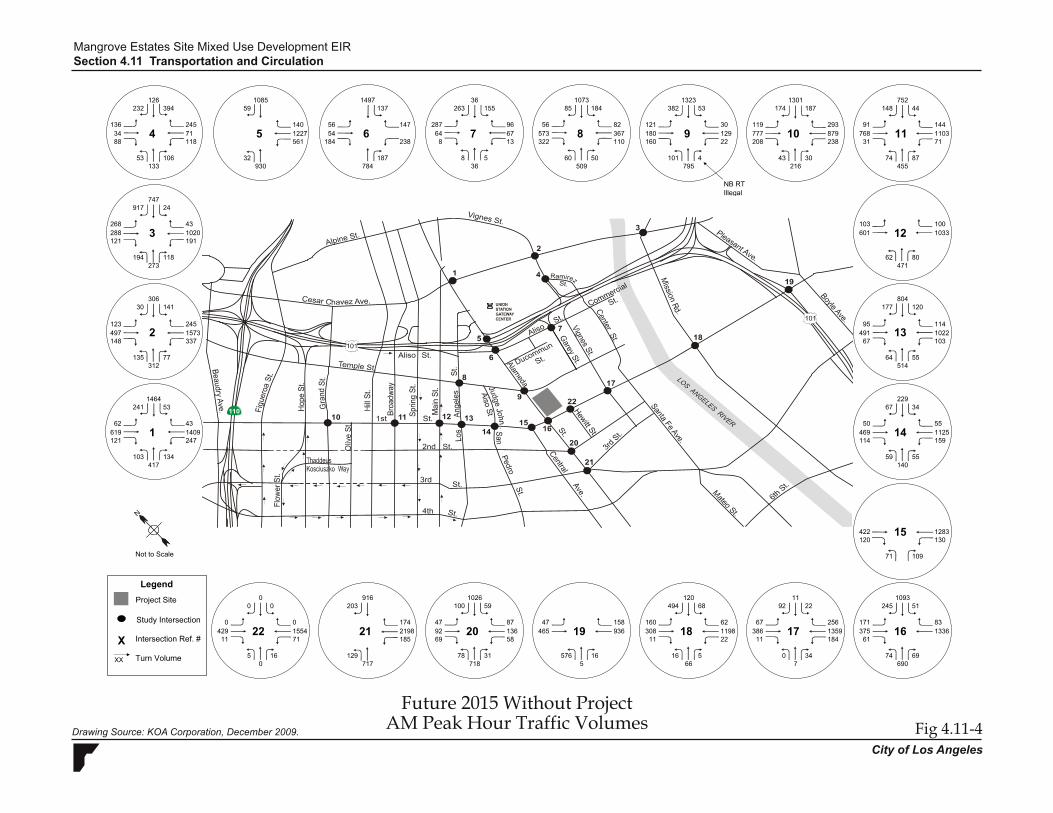
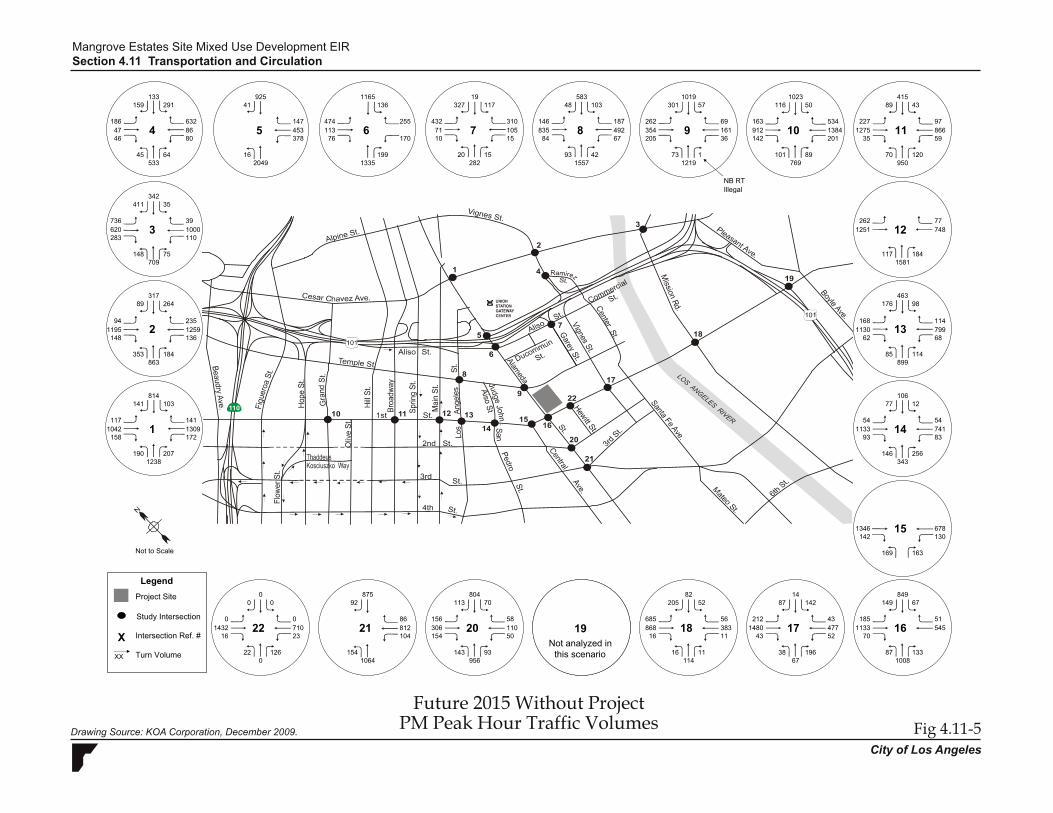
Future without Project Traffic Volumes. Based on the forecast parameters discussed in this section in addition to the adjusted year 2009 base volumes discussed in the analysis methodology in the introduction, future year 2015 without project traffic forecasts were conducted. For the U.S. 101 on and off-ramps and 1st Street, adjusted year 2009 based PM counts were not available; therefore, the intersection could not be analyzed during the PM peak period.
Figures 4.11-4 and 4.11-5 show the year 2015 future without project AM and PM peak hour intersection traffic volumes, respectively.
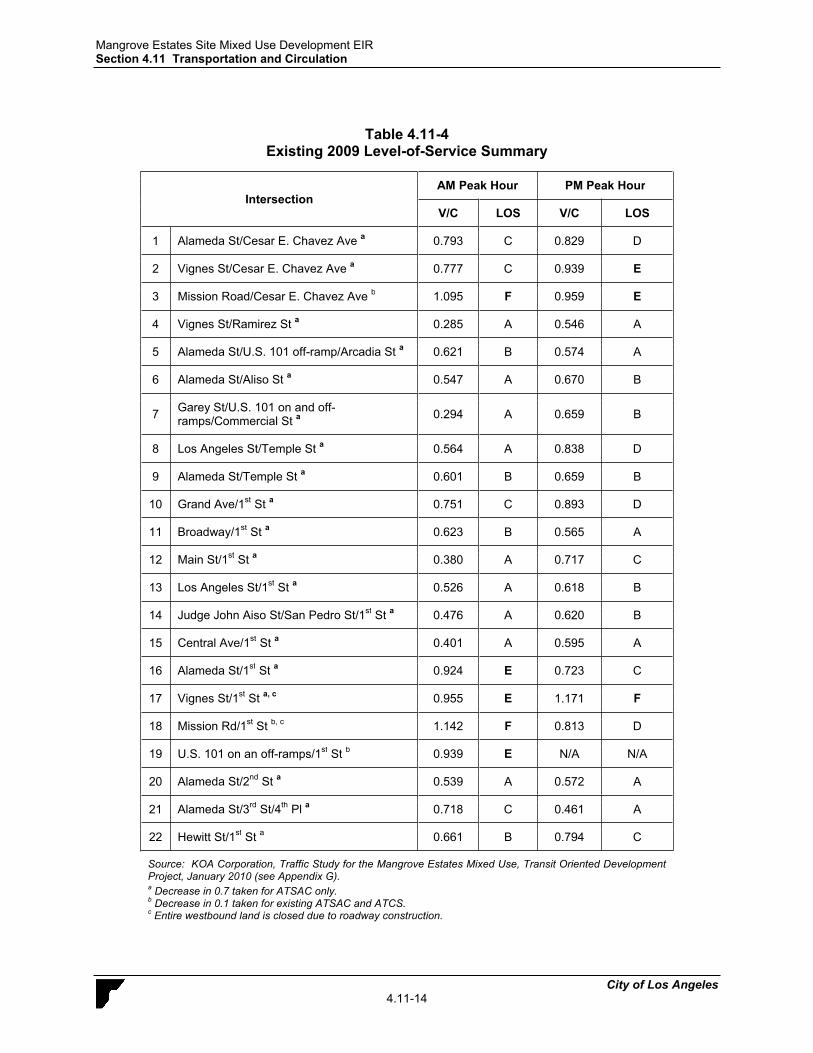
Year 2015 without Project Peak Hour Intersection Level of Service. Based on the traffic forecast parameters discussed, a future year 2015 without project peak hour level-of-service analysis was conducted at the 22 study intersections. Table 4.11-4 on page 4.11-14 summarizes the results of the level-of-service analysis for this scenario.
As shown in Table 4.11-4, 16 of the 22 study intersections are expected to LOS D or better during both the AM and PM peak hours. The following six study intersections are expected to operate at LOS E or F during one or both AM and PM peak periods:
Vignes Street and Cesar E. Chavez Avenue – LOS E during the PM peak period Mission Road and Cesar E. Chavez Avenue – LOS F during the AM peak period and LOS E during the PM peak period Alameda Street and 1st Street – LOS E during the AM peak period Vignes Street and 1st Street – LOS E during the AM peak period and LOS F during the PM peak period Mission Road and 1st Street – LOS F during the AM peak period US-101 on/off-ramps and 1st Street – LOS E during the AM peak period
4.9.2 Impact Analysis
a. Methodology and Significance Thresholds. The traffic impact analysis was conducted using the Los Angeles Department of Transportation (LADOT) methodologies. Weekday A.M. and P.M. peak hour traffic operations were evaluated at the 22 study intersections considering the following traffic scenarios:
Existing (2009) conditions Future (2015) without project Future (2015) with proposed project
Project Traffic Projections. The traffic projections for onsite development were developed using the following three steps: 1) estimating the trip generation of the project; 2) determining trip distribution; and 3) assigning the project traffic to the roadway system.
83375 1336
690
61 0
74 69
1093245 51
171256
0
0 0422 1283120 130
71 109
1192 22
67
140
00 0
137
50 55469 1125
641470
287
8
126232
43
74724
394
136 245
312135 77
13353 106
1231573
417
88 11834 71
245
14130
134103
2471409
1497
54
784
108559 0
0
0
930
0 1227
32
56
0
561
140
184
61943
121
121 191
273
146453241
306
62
1020
497148
194 118
337
268288
0
917
238
0 18736
8 5
56573
1073
13
18415536
58362
82
110367
60 50795
322
509
777 879
1323382 53
1301174 187
216
30129
9667
208
119121180160
752148 44
03344101
23822
293
0
31 71
91
74 87455
7681441103
100601 1033
0 0
103
491
0
471
0
62 80
804177 120
95
67
51464 55
55
22967 34
184
0 34
1141022103
1359
114 159
59
7
120494 68
16 566
11386
62
0 0
160308
158465 936
22111198
0
5
1026100 59
718
0
576 16
47
0
47 8792 13669 58
78 31
916203 0
00 21980 185
129 0717
174
00 0
0429 155411 71
5 160
0
1
Study Intersection
Intersection Ref. #
XX Turn Volume
X
Legend
2
3
4 5 6 7 8 9 10 11
12
13
Project Site
14
15
161718192021
Not to Scale
22
NB RT Illegal
Drawing Source: KOA Corporation, December 2009.
Mangrove Estates Site Mixed Use Development EIRSection 4.11 Transportation and Circulation
Fig 4.11-4City of Los Angeles
Future 2015 Without ProjectAM Peak Hour Traffic Volumes
22 1260
01432 710
16 23
00 0
0
154 01064
860 8120 104
87592 0
0
154 50
143 93
156 58306 110
804113 70
956
1116383
685868
67
82205 52
16 11114
431480
56
52
38 196
11479968
477
93 83
146 256
10677 12
62
89985 114
1130
0
1581
0
117 184
463176 98
168
771251 748
0 0
262
0
35 59
227
70 120950
127597866
41589 43
98101137
20136
534
769
69161
310105
142
163262354205
1384
1019301 57
1023116 50
1219
84
1557
912187
67492
93 42
11719
84723
146835
583
15
103
170
0 199282
20 15
736620
0
411
117
1000
1195148
148 75
136
1042141
158
283 110
709
814103141
317
474
0
378
147
76
2049
0 453
16
1721309
1165
113
1335
92541 0
0
0
1238
46 8047 86
235
26489
207190
186 632
863353 184
53345 64
941259
133159
39
34235
631192
54 541133 741
712550
432
10
343
00 0
1487 142
212 43
0
0 01346 678142 130
169 163
849149 67
185 511133 545
1008
70 0
87 133
1
Study Intersection
Intersection Ref. #
XX Turn Volume
X
Legend
2
3
4 5 6 7 8 9 10 11
12
13
Project Site
14
15
161718192021
Not to Scale
22
NB RT Illegal
19Not analyzed in
this scenario
Drawing Source: KOA Corporation, December 2009.
Mangrove Estates Site Mixed Use Development EIRSection 4.11 Transportation and Circulation
Fig 4.11-5City of Los Angeles
Future 2015 Without ProjectPM Peak Hour Traffic Volumes
Mangrove Estates Site Mixed Use Development EIR Section 4.11 Transportation and Circulation
City of Los Angeles4.11-14
Table 4.11-4 Existing 2009 Level-of-Service Summary
Intersection AM Peak Hour PM Peak Hour
V/C LOS V/C LOS
1 Alameda St/Cesar E. Chavez Ave a 0.793 C 0.829 D
2 Vignes St/Cesar E. Chavez Ave a 0.777 C 0.939 E
3 Mission Road/Cesar E. Chavez Ave b 1.095 F 0.959 E
4 Vignes St/Ramirez St a 0.285 A 0.546 A
5 Alameda St/U.S. 101 off-ramp/Arcadia St a 0.621 B 0.574 A
6 Alameda St/Aliso St a 0.547 A 0.670 B
7 Garey St/U.S. 101 on and off-ramps/Commercial St a 0.294 A 0.659 B
8 Los Angeles St/Temple St a 0.564 A 0.838 D
9 Alameda St/Temple St a 0.601 B 0.659 B
10 Grand Ave/1st St a 0.751 C 0.893 D
11 Broadway/1st St a 0.623 B 0.565 A
12 Main St/1st St a 0.380 A 0.717 C
13 Los Angeles St/1st St a 0.526 A 0.618 B
14 Judge John Aiso St/San Pedro St/1st St a 0.476 A 0.620 B
15 Central Ave/1st St a 0.401 A 0.595 A
16 Alameda St/1st St a 0.924 E 0.723 C
17 Vignes St/1st St a, c 0.955 E 1.171 F
18 Mission Rd/1st St b, c 1.142 F 0.813 D
19 U.S. 101 on an off-ramps/1st St b 0.939 E N/A N/A
20 Alameda St/2nd St a 0.539 A 0.572 A
21 Alameda St/3rd St/4th Pl a 0.718 C 0.461 A
22 Hewitt St/1st St a 0.661 B 0.794 C
Source: KOA Corporation, Traffic Study for the Mangrove Estates Mixed Use, Transit Oriented Development Project, January 2010 (see Appendix G). a Decrease in 0.7 taken for ATSAC only. b Decrease in 0.1 taken for existing ATSAC and ATCS. c Entire westbound land is closed due to roadway construction.
Mangrove Estates Site Mixed Use Development EIR Section 4.11 Transportation and Circulation
City of Los Angeles4.11-15
Project Trip Generation. Forecast trip generation associated with onsite development was based on the Institute of Transportation Engineers (ITE) publication Trip Generation, 7th Edition.The assumptions utilized for project trip distribution are discussed in the “future with project” section of this report.
Project Trip Distribution. Trip distribution is the process of assigning the amount of traffic to and from a project site. Trip distribution is dependent upon the land use characteristics of the project and the general locations of land uses to which project trips would originate or terminate. Project trip distribution was based on the geographic distribution of population from which project trips would originate or terminate as well as knowledge of development trends in the area, local and sub-regional traffic routes, and regional traffic flows.
Project Trip Assignment. The final product of the trip assignment process is a full accounting of project trips, by direction and turning movement at the study intersections. The project trips were assigned based on the trip generation and distribution assumptions discussed above.
Significance Criteria. The significance criteria used to assess the impacts of onsite development are described below.
Intersection Criteria. A significant impact is typically identified if project-related traffic will cause service levels to deteriorate beyond a threshold limit specified by the overseeing agency. Impacts can also be significant if an intersection is already operating below the poorest acceptable level of service and project traffic will cause a further decline below a certain threshold.
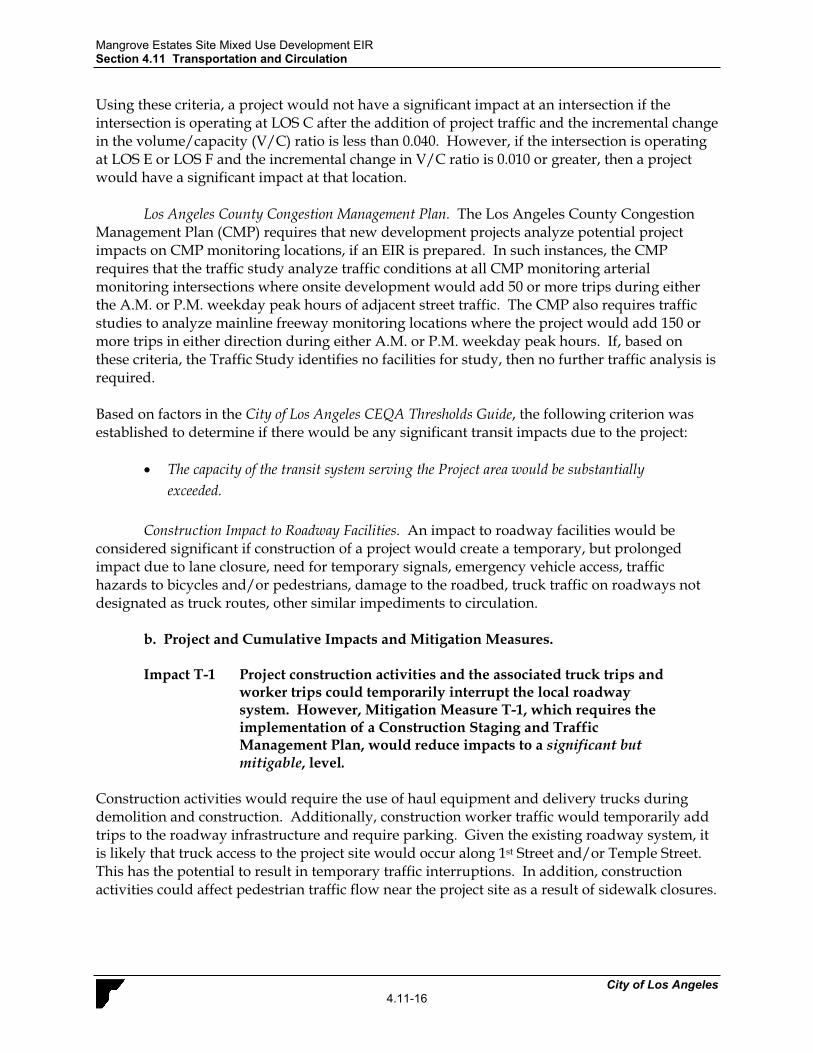
LADOT has established criteria to determine whether project impacts are significant at an intersection. As set forth in the City of Los Angeles CEQA Thresholds Guide, a project would normally have a significant impact on intersection capacity if the addition of project traffic causes an increase in the V/C ratio for a given intersection’s operating condition, as identified in Table 4.11-5.
Table 4.11-5 Definition of Significant Impact at Intersection
With Project Traffic Project-Related Increase in V/C Ratio
LOS V/C Ratio
C 0.701 - 0.800 Equal to or greater than 0.040
D 0.801 - 0.900 Equal to or greater than 0.020
E or F > 0.900 Equal to or greater than 0.010
Source: City of Los Angeles, City of Los Angeles CEQA Thresholds Guide, 2006.
Mangrove Estates Site Mixed Use Development EIR Section 4.11 Transportation and Circulation
City of Los Angeles4.11-16
Using these criteria, a project would not have a significant impact at an intersection if the intersection is operating at LOS C after the addition of project traffic and the incremental change in the volume/capacity (V/C) ratio is less than 0.040. However, if the intersection is operating at LOS E or LOS F and the incremental change in V/C ratio is 0.010 or greater, then a project would have a significant impact at that location.
Los Angeles County Congestion Management Plan. The Los Angeles County Congestion Management Plan (CMP) requires that new development projects analyze potential project impacts on CMP monitoring locations, if an EIR is prepared. In such instances, the CMP requires that the traffic study analyze traffic conditions at all CMP monitoring arterial monitoring intersections where onsite development would add 50 or more trips during either the A.M. or P.M. weekday peak hours of adjacent street traffic. The CMP also requires traffic studies to analyze mainline freeway monitoring locations where the project would add 150 or more trips in either direction during either A.M. or P.M. weekday peak hours. If, based on these criteria, the Traffic Study identifies no facilities for study, then no further traffic analysis is required.
Based on factors in the City of Los Angeles CEQA Thresholds Guide, the following criterion was established to determine if there would be any significant transit impacts due to the project:
The capacity of the transit system serving the Project area would be substantially exceeded.
Construction Impact to Roadway Facilities. An impact to roadway facilities would be considered significant if construction of a project would create a temporary, but prolonged impact due to lane closure, need for temporary signals, emergency vehicle access, traffic hazards to bicycles and/or pedestrians, damage to the roadbed, truck traffic on roadways not designated as truck routes, other similar impediments to circulation.
b. Project and Cumulative Impacts and Mitigation Measures.
Impact T-1 Project construction activities and the associated truck trips and worker trips could temporarily interrupt the local roadway system. However, Mitigation Measure T-1, which requires the implementation of a Construction Staging and Traffic Management Plan, would reduce impacts to a significant but mitigable, level.
Construction activities would require the use of haul equipment and delivery trucks during demolition and construction. Additionally, construction worker traffic would temporarily add trips to the roadway infrastructure and require parking. Given the existing roadway system, it is likely that truck access to the project site would occur along 1st Street and/or Temple Street. This has the potential to result in temporary traffic interruptions. In addition, construction activities could affect pedestrian traffic flow near the project site as a result of sidewalk closures.
Mangrove Estates Site Mixed Use Development EIR Section 4.11 Transportation and Circulation
City of Los Angeles4.11-17
Delivery haul routes would be developed to use the freeway system, exiting to major arterials, and ending at the project site. Export haul routes would utilize the same routes as delivery haul routes to the extent feasible.
Although no street closures are anticipated to occur during construction of the project, it is anticipated that construction activity may temporarily displace on-street parking located along Temple Street near the project site. Any lane closure requests or requests to displace on-street parking would be submitted to the City for prior approval in accordance with City policies and procedures. The site developer would be responsible or all costs associated with signage and lane closure equipment and also responsible for providing flagging as necessary or requested by the City, to ensure the safe operation and movement of traffic during periods of lane closures or on-street parking displacement. The developer would also be required to provide temporary sidewalks or alternative pedestrian passage for pedestrians should existing sidewalks be closed during construction.
Mandatory City policies and procedures address impacts to the local roadway system during construction activities. These City requirements would partially reduce impacts related to traffic and pedestrian flow and temporary parking impacts during construction. Nevertheless, onsite construction activity has the potential to adversely affect the local roadway system, pedestrian flow and parking during temporary construction activities. Therefore, impacts would be potentially significant unless mitigation is incorporated.
Mitigation Measures. The following mitigation measure is required to reduce impacts to the local roadway system resulting from construction traffic and construction activities associated with the proposed project.
T-1 Construction Staging and Traffic Management Plan. The developer shall prepare and submit for approval to the City of Los Angeles a Construction Staging and Traffic Management Plan that includes designated haul routes and staging areas, traffic control procedures, emergency access provisions and construction crew parking, to mitigate traffic impacts during construction. The plan shall also require appropriate signage to restrict construction traffic from traveling or parking on the surrounding residential streets, appropriate signage to guide the construction traffic to the main entrance of the site and signage to warn the general traffic of trucks entering and exiting the project site.In addition, the plan shall require that temporary sidewalks or alternative pedestrian passage be provided should sidewalks be closed during construction.
The applicant shall submit required documentation and achieve approval of the management plan from the City of Los Angeles prior to issuance of a grading permit.
Significance After Mitigation. With implementation of Mitigation Measure T-1, impacts related to temporary construction traffic would be reduced to a less than significant level.
Mangrove Estates Site Mixed Use Development EIR Section 4.11 Transportation and Circulation
City of Los Angeles4.11-18
Impact T-2 Onsite development would generate an estimated 10,806 net average weekday daily trips, including 771 A.M. peak hour trips and 1,146 P.M. peak hour trips. This traffic increase would cause exceedances of City of Los Angeles significance thresholds at 9 of 22 study intersections. Mitigation is available that would reduce impacts at 4 of the 9 intersections to below a level of significance. However, because mitigation would not reduce impacts to below thresholds at the other 5 intersections, impacts would be unavoidably significant.
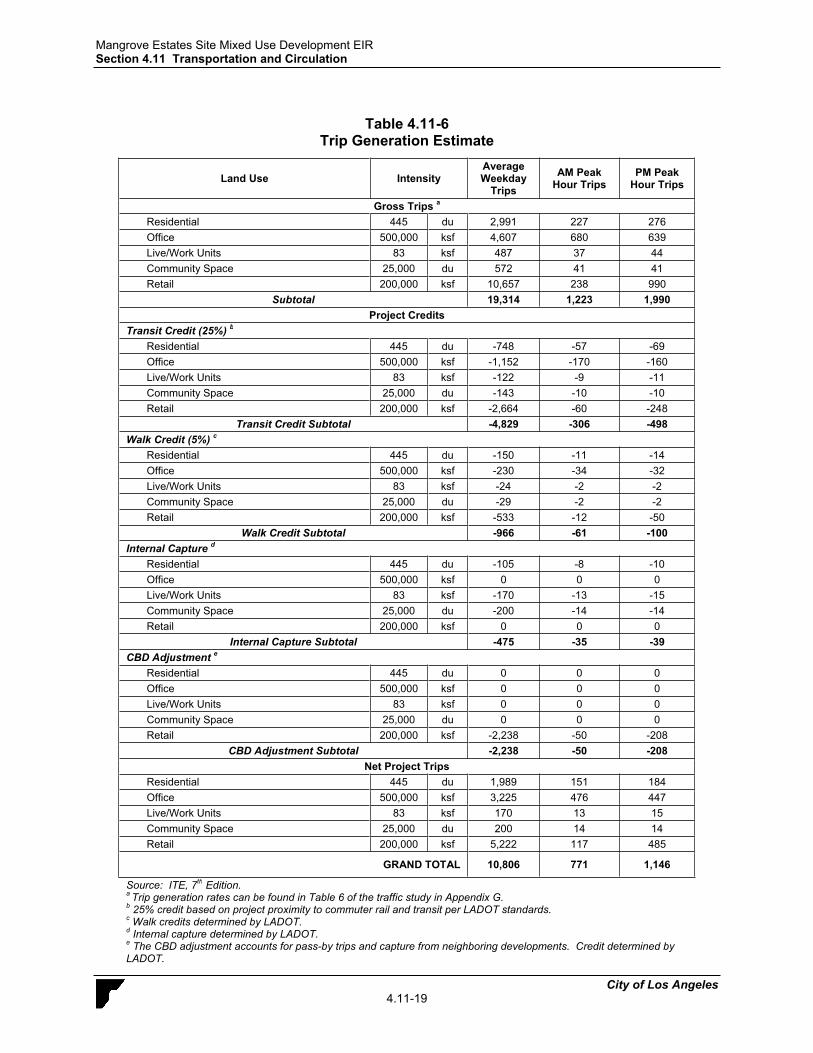
Trip Generation. Based on ITE Trip Generation rates, trip generation associated with onsite development was estimated. Onsite development would generate 19,314 weekday daily trips, 1,223 weekday AM peak hour trips and 1,990 weekday PM peak hour trips. Table 4.11-6 on the following page summarizes the trip generation estimates after accounting for trip adjustments, which include the following:
Transit Reduction takes into account the mode shift that is expected to occur as a result of the operation of the Metro Gold Line rail system and bus transit. A 25% transit reduction was applied. This reduction factor is consistent with the planning guidelines of both the Metro and LADOT and are documented in the Metro 2004 "Congestion Management Program for Los Angeles County - Appendix B" and LADOT August 2003 "Traffic Study Policies and Procedures."
Walk Adjustment takes into account walking trips associated with pedestrian activity to and from the Project site and neighboring land uses. The project site is located in a area with a variety of uses which include retail, restaurants, offices, government facilities, and residential. A walk adjustment of 5% was applied for all uses (office, residential, live/work, community space, and retail) within the Project.
Internal Capture takes into account internal trip making between residential, commercial and office uses. A common example of this internal trip-making occurs at a multi-use development containing offices and shopping/service area. Some of the trips made by office workers to shops, to restaurants, or to banks may occur on site. These type of trips are defined as internal (i.e., "captured" within) the multi-use site. An internal trip capture of 5% for residential and 50% for live/work units and community space were applied as credit.
CBD Adjustment takes into account pass-by trips and capture from adjacent developments. These trips are existing trips passing by the site and would not be adding trips to the area. They would only be affecting project driveways. An adjustment of 30% was applied to retail.
Onsite development, with the internal trip reduction and transit credit reduction, would generate an estimated 10,806 net weekday daily trips, including 771 net weekday AM peak hour trips and 1,146 net weekday PM peak hour trips.
Mangrove Estates Site Mixed Use Development EIR Section 4.11 Transportation and Circulation
City of Los Angeles4.11-19
Table 4.11-6 Trip Generation Estimate
Land Use Intensity Average Weekday
Trips AM Peak
Hour Trips PM Peak
Hour Trips
Gross Trips a
Residential 445 du 2,991 227 276 Office 500,000 ksf 4,607 680 639 Live/Work Units 83 ksf 487 37 44 Community Space 25,000 du 572 41 41 Retail 200,000 ksf 10,657 238 990
Subtotal 19,314 1,223 1,990 Project Credits
Transit Credit (25%) b
Residential 445 du -748 -57 -69 Office 500,000 ksf -1,152 -170 -160 Live/Work Units 83 ksf -122 -9 -11 Community Space 25,000 du -143 -10 -10 Retail 200,000 ksf -2,664 -60 -248
Transit Credit Subtotal -4,829 -306 -498 Walk Credit (5%) c
Residential 445 du -150 -11 -14 Office 500,000 ksf -230 -34 -32 Live/Work Units 83 ksf -24 -2 -2 Community Space 25,000 du -29 -2 -2 Retail 200,000 ksf -533 -12 -50
Walk Credit Subtotal -966 -61 -100 Internal Capture d
Residential 445 du -105 -8 -10 Office 500,000 ksf 0 0 0 Live/Work Units 83 ksf -170 -13 -15 Community Space 25,000 du -200 -14 -14 Retail 200,000 ksf 0 0 0
Internal Capture Subtotal -475 -35 -39 CBD Adjustment e
Residential 445 du 0 0 0 Office 500,000 ksf 0 0 0 Live/Work Units 83 ksf 0 0 0 Community Space 25,000 du 0 0 0 Retail 200,000 ksf -2,238 -50 -208
CBD Adjustment Subtotal -2,238 -50 -208 Net Project Trips
Residential 445 du 1,989 151 184 Office 500,000 ksf 3,225 476 447 Live/Work Units 83 ksf 170 13 15 Community Space 25,000 du 200 14 14 Retail 200,000 ksf 5,222 117 485
GRAND TOTAL 10,806 771 1,146
Source: ITE, 7th Edition. a Trip generation rates can be found in Table 6 of the traffic study in Appendix G. b 25% credit based on project proximity to commuter rail and transit per LADOT standards. c Walk credits determined by LADOT. d Internal capture determined by LADOT. e The CBD adjustment accounts for pass-by trips and capture from neighboring developments. Credit determined by LADOT.
Mangrove Estates Site Mixed Use Development EIR Section 4.11 Transportation and Circulation
City of Los Angeles4.11-20
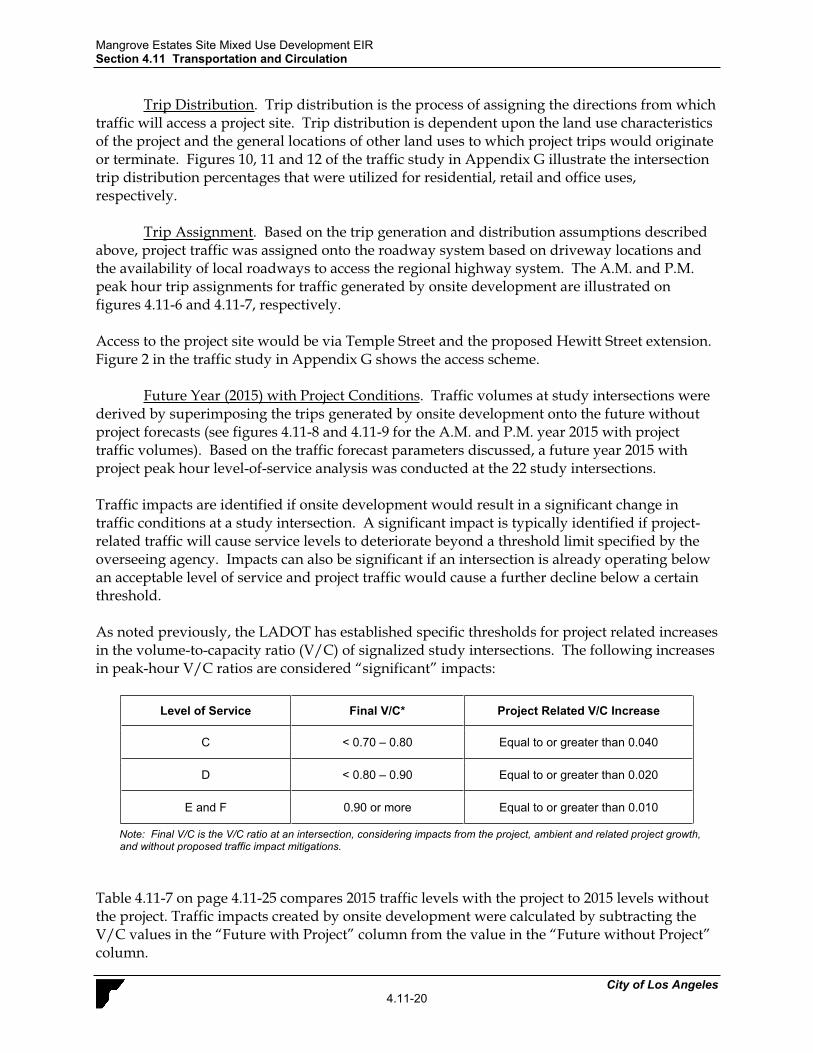
Trip Distribution. Trip distribution is the process of assigning the directions from which traffic will access a project site. Trip distribution is dependent upon the land use characteristics of the project and the general locations of other land uses to which project trips would originate or terminate. Figures 10, 11 and 12 of the traffic study in Appendix G illustrate the intersection trip distribution percentages that were utilized for residential, retail and office uses, respectively.
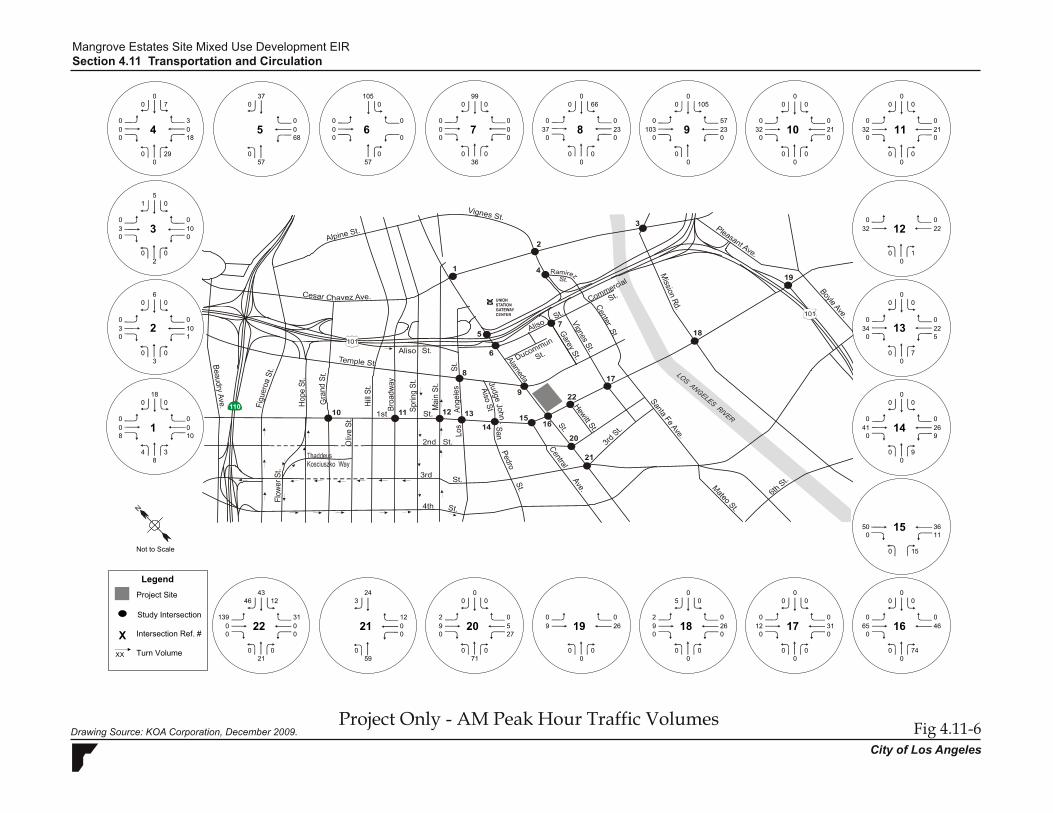
Trip Assignment. Based on the trip generation and distribution assumptions described above, project traffic was assigned onto the roadway system based on driveway locations and the availability of local roadways to access the regional highway system. The A.M. and P.M. peak hour trip assignments for traffic generated by onsite development are illustrated on figures 4.11-6 and 4.11-7, respectively.
Access to the project site would be via Temple Street and the proposed Hewitt Street extension. Figure 2 in the traffic study in Appendix G shows the access scheme.
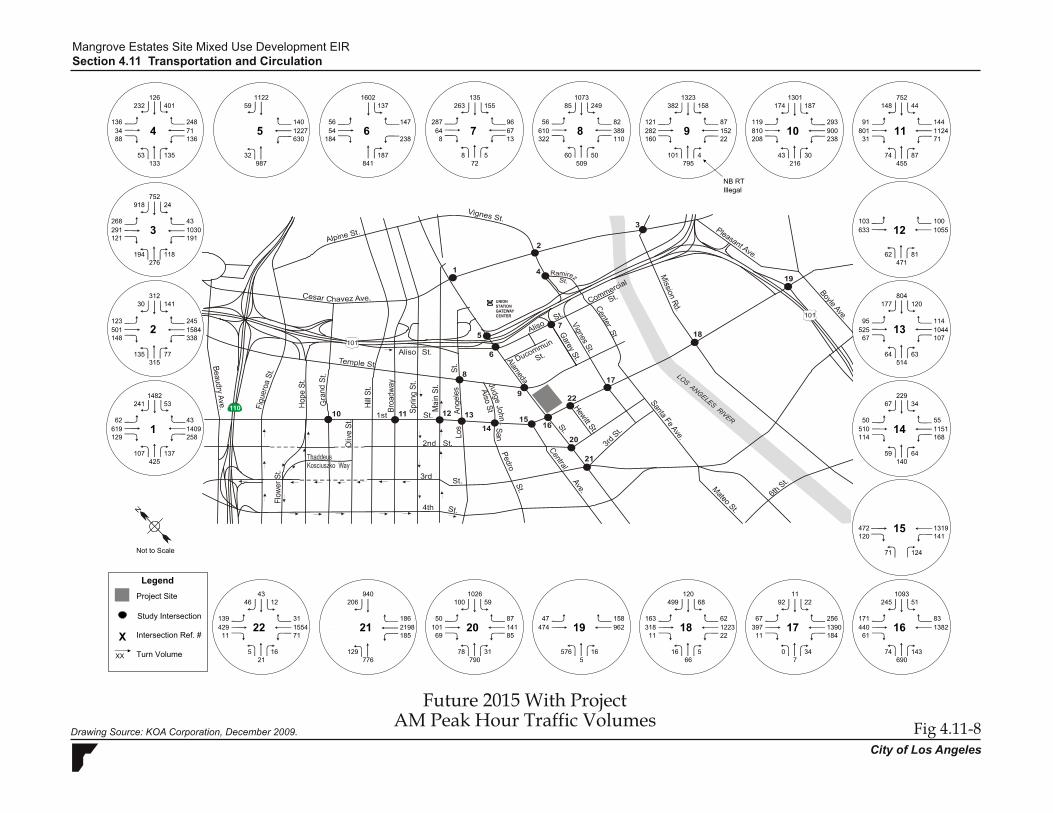
Future Year (2015) with Project Conditions. Traffic volumes at study intersections were derived by superimposing the trips generated by onsite development onto the future without project forecasts (see figures 4.11-8 and 4.11-9 for the A.M. and P.M. year 2015 with project traffic volumes). Based on the traffic forecast parameters discussed, a future year 2015 with project peak hour level-of-service analysis was conducted at the 22 study intersections.
Traffic impacts are identified if onsite development would result in a significant change in traffic conditions at a study intersection. A significant impact is typically identified if project-related traffic will cause service levels to deteriorate beyond a threshold limit specified by the overseeing agency. Impacts can also be significant if an intersection is already operating below an acceptable level of service and project traffic would cause a further decline below a certain threshold.
As noted previously, the LADOT has established specific thresholds for project related increases in the volume-to-capacity ratio (V/C) of signalized study intersections. The following increases in peak-hour V/C ratios are considered “significant” impacts:
Level of Service Final V/C* Project Related V/C Increase
C < 0.70 – 0.80 Equal to or greater than 0.040
D < 0.80 – 0.90 Equal to or greater than 0.020
E and F 0.90 or more Equal to or greater than 0.010
Note: Final V/C is the V/C ratio at an intersection, considering impacts from the project, ambient and related project growth, and without proposed traffic impact mitigations.
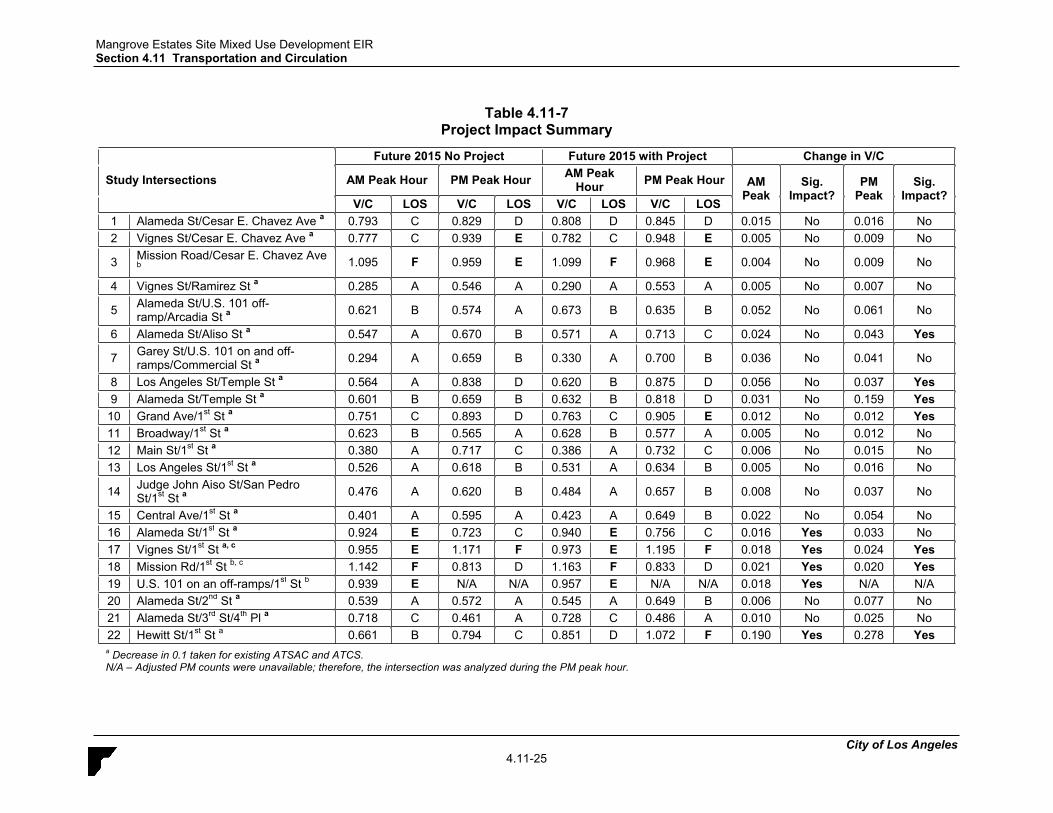
Table 4.11-7 on page 4.11-25 compares 2015 traffic levels with the project to 2015 levels without the project. Traffic impacts created by onsite development were calculated by subtracting the V/C values in the “Future with Project” column from the value in the “Future without Project” column.
065 46
0
0 0
0 74
00 0
00
0
0 050 360 11
0 15
00 0
0
0
00 0
0
0 041 26
000
0
0
00
0
50
7
0 3
30 0
00 29
010
8
0 180 0
0
00
34
100
105
0
57
370 0
0
0
57
0 0
0
0
0
68
0
0
00
8
0 0
2
1800
6
0
10
30
0 0
1
03
0
1
0
0 036
0 0
037
0
0
66099
00
0
023
0 00
0
0
32 21
00 105
00 0
0
5723
00
0
00103
0
00 0
0000
00
0
0
0 0
0
0 00
32021
032 22
0 0
0
34
0
0
0
0 1
00 0
0
0
00 7
9
00 0
0
0 0
0225
31
0 9
0
0
05 0
0 00
012
0
0 0
29
09 26
0026
0
0
00 0
71
0
0 0
0
0
2 09 50 27
0 0
243 0
00 00 0
0 059
12
4346 12
1390 00 0
0 021
31
1
Study Intersection
Intersection Ref. #
XX Turn Volume
X
Legend
2
3
4 5 6 7 8 9 10 11
12
13
Project Site
14
15
161718192021
Not to Scale
22
Drawing Source: KOA Corporation, December 2009.
Mangrove Estates Site Mixed Use Development EIRSection 4.11 Transportation and Circulation
Fig 4.11-6City of Los Angeles
Project Only - AM Peak Hour Traffic Volumes

095 114
0
0 0
0 62
00 0
00
0
0 073 870 26
0 22
00 0
0
0
00 0
0
0 056 70
000
0
0
00
0
60
8
0 11
100 1
00 18
08
29
0 520 0
0
00
1317
80
83
0
181
420 0
0
0
181
0 0
0
0
0
41
0
0
00
14
0 0
8
2000
7
0
8
130
0 0
1
113
0
1
0
0 0111
0 0
043
0
0
33050
00
0
056
0 00
0
0
41 52
00 83
00 0
0
18156
00
0
00760
00 0
0000
00
0
0
0 0
0
0 00
41052
041 57
0 0
0
45
0
0
0
0 5
00 0
0
0
00 10
17
00 0
0
0 0
05713
25
0 18
0
0
06 0
0 00
042
0
0 0
834
034 20
0020
0
0
00 0
60
0
0 0
0
0
2 09 170 80
0 0
7010 0
00 00 0
0 051
8
134114 42
1570 00 0
0 027
26
1
Study Intersection
Intersection Ref. #
XX Turn Volume
X
Legend
2
3
4 5 6 7 8 9 10 11
12
13
Project Site
14
15
161718192021
Not to Scale
22
Drawing Source: KOA Corporation, December 2009.
Mangrove Estates Site Mixed Use Development EIRSection 4.11 Transportation and Circulation
Fig 4.11-7City of Los Angeles
Project Only - PM Peak Hour Traffic Volumes
83440 1382
690
61 0
74 143
1093245 51
171256
0
0 0472 1319120 141
71 124
1192 22
67
140
00 0
137
50 55510 1151
641470
287
8
126232
43
75224
401
136 248
315135 77
13353 135
1231584
425
88 13634 71
245
14130
137107
2581409
1602
54
841
112259 0
0
0
987
0 1227
32
56
0
630
140
184
61943
129
121 191
276
148253241
312
62
1030
501148
194 118
338
268291
0
918
238
0 18772
8 5
56610
1073
13
249155135
58362
82
110389
60 50795
322
509
810 900
1323382 158
1301174 187
216
87152
9667
208
119121282160
752148 44
03344101
23822
293
0
31 71
91
74 87455
8011441124
100633 1055
0 0
103
525
0
471
0
62 81
804177 120
95
67
51464 63
64
22967 34
184
0 34
1141044107
1390
114 168
59
7
120499 68
16 566
11397
62
0 0
163318
158474 962
22111223
0
5
1026100 59
790
0
576 16
47
0
50 87101 14169 85
78 31
940206 0
00 21980 185
129 0776
186
4346 12
139429 155411 71
5 1621
31
1
Study Intersection
Intersection Ref. #
XX Turn Volume
X
Legend
2
3
4 5 6 7 8 9 10 11
12
13
Project Site
14
15
161718192021
Not to Scale
22
NB RT Illegal
Drawing Source: KOA Corporation, December 2009.
Mangrove Estates Site Mixed Use Development EIRSection 4.11 Transportation and Circulation
Fig 4.11-8City of Los Angeles
Future 2015 With ProjectAM Peak Hour Traffic Volumes

511228 658
1008
70 0
87 195
849149 67
18543
0
0 01419 765142 157
169 186
1487 142
212
343
00 0
136
54 541189 811
712550
432
10
133159
39
34735
299
186 643
873353 186
53345 81
941266
1266
46 13347 86
235
26489
220207
1801309
1248
113
1517
96641 0
0
0
2230
0 453
16
474
0
419
147
76
1042141
172
283 110
717
834103141
324
117
1007
1208148
148 75
137
737633
0
412
170
0 199394
20 15
146877
583
15
13711769
84723
187
67548
93 421219
84
1557
952 1436
1019301 140
1023116 50
769
250218
310105
142
163262430205
41589 43
98101137
20136
534
0
35 59
227
70 120950
131597917
771292 805
0 0
262
1175
0
1581
0
117 189
463176 98
168
62
89985 124
273
10677 12
52
38 196
11485581
503
93 101
146
67
82211 52
16 11114
431522
56693901
1116403
804113 70
1015
159 58315 127154 129
143 93
945102 0
00 8120 104
154 01115
95
134114 42
1571432 710
16 23
22 12627
26
1
Study Intersection
Intersection Ref. #
XX Turn Volume
X
Legend
2
3
4 5 6 7 8 9 10 11
12
13
Project Site
14
15
161718192021
Not to Scale
22
NB RT Illegal
19Not analyzed in
this scenario
Drawing Source: KOA Corporation, December 2009.
Mangrove Estates Site Mixed Use Development EIRSection 4.11 Transportation and Circulation
Fig 4.11-9City of Los Angeles
Future 2015 With ProjectPM Peak Hour Traffic Volumes
Mangrove Estates Site Mixed Use Development EIR Section 4.11 Transportation and Circulation
City of Los Angeles4.11-25
Table 4.11-7 Project Impact Summary
Study Intersections
Future 2015 No Project Future 2015 with Project Change in V/C
AM Peak Hour PM Peak Hour AM Peak Hour PM Peak Hour AM
Peak Sig.
Impact? PM
Peak Sig.
Impact? V/C LOS V/C LOS V/C LOS V/C LOS
1 Alameda St/Cesar E. Chavez Ave a 0.793 C 0.829 D 0.808 D 0.845 D 0.015 No 0.016 No 2 Vignes St/Cesar E. Chavez Ave a 0.777 C 0.939 E 0.782 C 0.948 E 0.005 No 0.009 No
3 Mission Road/Cesar E. Chavez Ave b 1.095 F 0.959 E 1.099 F 0.968 E 0.004 No 0.009 No
4 Vignes St/Ramirez St a 0.285 A 0.546 A 0.290 A 0.553 A 0.005 No 0.007 No
5 Alameda St/U.S. 101 off-ramp/Arcadia St a 0.621 B 0.574 A 0.673 B 0.635 B 0.052 No 0.061 No
6 Alameda St/Aliso St a 0.547 A 0.670 B 0.571 A 0.713 C 0.024 No 0.043 Yes
7 Garey St/U.S. 101 on and off-ramps/Commercial St a 0.294 A 0.659 B 0.330 A 0.700 B 0.036 No 0.041 No
8 Los Angeles St/Temple St a 0.564 A 0.838 D 0.620 B 0.875 D 0.056 No 0.037 Yes9 Alameda St/Temple St a 0.601 B 0.659 B 0.632 B 0.818 D 0.031 No 0.159 Yes
10 Grand Ave/1st St a 0.751 C 0.893 D 0.763 C 0.905 E 0.012 No 0.012 Yes11 Broadway/1st St a 0.623 B 0.565 A 0.628 B 0.577 A 0.005 No 0.012 No 12 Main St/1st St a 0.380 A 0.717 C 0.386 A 0.732 C 0.006 No 0.015 No 13 Los Angeles St/1st St a 0.526 A 0.618 B 0.531 A 0.634 B 0.005 No 0.016 No
14 Judge John Aiso St/San Pedro St/1st St a 0.476 A 0.620 B 0.484 A 0.657 B 0.008 No 0.037 No
15 Central Ave/1st St a 0.401 A 0.595 A 0.423 A 0.649 B 0.022 No 0.054 No 16 Alameda St/1st St a 0.924 E 0.723 C 0.940 E 0.756 C 0.016 Yes 0.033 No 17 Vignes St/1st St a, c 0.955 E 1.171 F 0.973 E 1.195 F 0.018 Yes 0.024 Yes18 Mission Rd/1st St b, c 1.142 F 0.813 D 1.163 F 0.833 D 0.021 Yes 0.020 Yes19 U.S. 101 on an off-ramps/1st St b 0.939 E N/A N/A 0.957 E N/A N/A 0.018 Yes N/A N/A 20 Alameda St/2nd St a 0.539 A 0.572 A 0.545 A 0.649 B 0.006 No 0.077 No 21 Alameda St/3rd St/4th Pl a 0.718 C 0.461 A 0.728 C 0.486 A 0.010 No 0.025 No 22 Hewitt St/1st St a 0.661 B 0.794 C 0.851 D 1.072 F 0.190 Yes 0.278 Yesa Decrease in 0.1 taken for existing ATSAC and ATCS. N/A – Adjusted PM counts were unavailable; therefore, the intersection was analyzed during the PM peak hour.
Mangrove Estates Site Mixed Use Development EIR Section 4.11 Transportation and Circulation
City of Los Angeles4.11-26
Based on LADOT’s criteria for significant impacts, onsite development would create significant traffic impacts at the following nine study intersections:
Alameda Street and Aliso Street Los Angeles Street and Temple Street Alameda Street and Temple Street Grand Avenue and 1st Street Alameda Street and 1st Street Vignes Street and 1st Street Mission Road and 1st Street US-101 on and off-ramps and 1st Street Hewitt Street and 1st Street
Mitigation Measures. The mitigation measures that have been identified include potential Transportation Demand Management (TDM) measures and traffic signal upgrades to adjacent traffic signals.
Transportation Demand Management. Potential TDM strategies can be applied as mitigation measures to the traffic related impacts. The goal of a TDM program is to help mitigate the traffic impacts of a project by reducing the number of automobile trips to/from the site. Typical measures include, but are not limited to, carpools, vanpools, public transit, walking and bicycles. There is no single, definitive recipe for success. The same strategies do not always work at different sites. The location of the site and the characteristics of the area can strongly influence the effectiveness and ultimate success of a TDM program. Similarly, the effort or vigor with which the program is operated can also affect its success or lack thereof. Studies have shown the most successful TDM programs are those that are tied to specific incentives and program elements, as opposed to the provision of general information on commuting alternatives. In addition, for these programs to succeed, they need to be “funded” for their duration. In addition to funding, successful programs are linked with aesthetically pleasing features such as “safe” pedestrian walkways, bike racks that are not located in faraway dark corners and information kiosks that are easily accessible and up to date. In sum, the most successful and effective programs appear to be those whereby financial incentives are offered with aesthetic amenities. It is generally accepted and understood that TDM programs are difficult to attach to mixed-use commercial centers and residential developments because of the nature of their operations.
T-2(a) TDM Strategies. The developer shall implement an onsite transportation demand management (TDM) program that achieves at least a 20% reduction in peak hour traffic to and from the project site as compared to the trip generation rates used in this analysis (154 A.M. peak period trips and 229 P.M. peak period trips). This plan shall be subject to review and approval by the LADOT. The following measure shall be included in the TDM program:
Site Improvements - The design and operation of the site to the extent feasible shall be designed into the project to emphasize:
Mangrove Estates Site Mixed Use Development EIR Section 4.11 Transportation and Circulation
City of Los Angeles4.11-27
o Integrated Mobility Hub – Project developer shall provide a financial contribution and rent-free space needed to implement a new integrated mobility hub kiosk that is open and clearly visible to the public. The purpose of the kiosk is to attract new transit users and provide current transit users with more connectivity options for the first/last segment of a trip with bike parking, bike and car sharing, etc. This integrated mobility hub shall be part of the project’s design. This could be incorporated into a publicly accessible plaza located on the project site, near transit portals at 1st Street and Alameda Street and/or Temple Street and Alameda Street.
o Preferential loading and unloading for taxis, HOV and carpools make it more convenient and attractive to passengers.
o Wayfinding signage guides and directs people to and from loading and unloading zones and different elements of a site.
o Car pool parking should be closest to the entrance of a building or on the first floor of a garage or structure to reward participants.
o Bicycle parking should be convenient, plentiful, well lit and secure.
o Shower and locker facilities should be provided as they are an important part of the decision for an employee to bike to work.
o Enhanced pedestrian and bicycle pathways for convenient, direct and secure connections.
It must be emphasized that integrating non-auto oriented improvements into the heart of the site rather than off to the side or in a remote corner are paramount to their success. Parking for bicycles should be at the center of activities or near the front door to facilities and be plentiful and well lit. Taxi stands and passenger drop off areas should be convenient. There should be more than one and they should provide lighting, shelter and benches.
Car-Sharing and Short-Term Car Rental – The project shall include on demand access to a fleet of cars for short duration or unexpected trips for residents and employees of the project site. This program would reduce the need for individual to own a car or perhaps a second one. It would enhance the transit oriented nature of the site because it would allow individuals living, working and shopping at the site to rely on transit with the knowledge that an automobile is available with relative ease for those trips where transit or other modes are impractical. In addition, this program would save costs to individuals and businesses and could reduce the parking requirements of onsite development.
Mangrove Estates Site Mixed Use Development EIR Section 4.11 Transportation and Circulation
City of Los Angeles4.11-28
Transportation Coordinator (TC) - A transportation coordinator (TC) shall be provided onsite. A TC is a permanent onsite staff position assigned to administer the requirements of a TDM program. Under this strategy, a transportation management association (TMA) would be formed on-site or the project could become a part of an existing TMA in the area that would help in promoting awareness of the available TDM strategies and creating Transportation Management Plans (TMP) for the employees and patrons of the site.
Transportation Information Center (TIC) - A TIC shall be provided onsite. A TIC is a centrally-located commuter information center where both the employees and visitors can obtain information regarding commute programs, and individuals can obtain real-time information for planning travel without using an automobile. Strategically placed kiosks can provide trip planning and real time bus and train arrival information for users.
Trip Monitoring and Reporting Program – A periodic trip monitoring and reporting program shall be developed that sets trip-reduction milestones and a monitoring program to ensure effective participation and compliance with the TDM goals. Non-compliance with the trip-reduction goals would lead to financial penalties or may require the implementation of physical transportation improvements.
Other potential TDM strategies that may be implemented include, but are not limited to the following:
Transit, Bike and Walk Promotions and Information Materials - This would include a commuter information packet (CIP), a commuter benefits brochure that contains complete information about various transportation benefits available to individuals, transportation/transit options, HOV programs and discounts, bicycling amenities, transportation subsidies, and other elements that may be available. The CIP should be written in multiple languages including English, Japanese and Spanish. The CIP would be distributed to tenants, employees, and, other building workers and occupants and at promotional events.
Tenant Participation - Under this strategy the transportation coordinator would facilitate tenant and employee awareness and participation in the TMP by distributing the information to tenants at least once each year.
Rideshare Matching Opportunities - This strategy would coordinate ridesharing programs among various building tenants and their employees, provide ride-match services within the building or engage other ride-match facilitators (such as its
Mangrove Estates Site Mixed Use Development EIR Section 4.11 Transportation and Circulation
City of Los Angeles4.11-29
tenants) to provide this service. It could be applied two different ways. One method is to make available “on the spot” ridesharing. This strategy maximizes trip flexibility for the individual because they do not need to make long-term plans and commitments. There are a number of internet based programs that could be used to match the mobility needs of travelers with drivers. The more traditional method would be to have the TMA provide an online daily and/or long-term commute rideshare matching service to match interested patrons with carpools and vanpools. The rideshare matching services could also be extended to other employers in close proximity to the project site.
Guaranteed Ride Home Program - This strategy provides a guaranteed ride home program for (occupants/employees) who use a commute mode other than driving. Employers may establish their own program or contract this service with a public agency or private contractor.
Transit Pass Sales - Under this strategy employers or a central management operator can contract with the Metro to become authorized to directly sell transit passes to their onsite employees. In addition they could provide transportation subsidies to building occupants, residential tenants and employees who commute via non-motorized or non-single occupancy vehicle (SOV) modes.
Commuter Benefits – This strategy pursuant to Internal Revenue Code Section 132 (f), states that employers should arrange pre-tax dollar transit commute expense accounts to provide transportation fringe benefits to eligible employees.
Flexible/Alternative Work Schedules and Telecommuting Programs – With this strategy, employers would allow employees to work flexible and alternative work schedules so that their arrival and departure to the site varies to reduce trips during peak periods. Telecommuting would eliminate any trips to the site since the employee would be working off site.
Expanded DASH Service – This strategy would provide additional service and/or capacity to the DASH downtown system via new routes to the Mangrove Estates site. Contributions could be in the form of the purchase of new DASH vehicles or subsidy of service for a fixed period of time.
Taxi Services – Taxis provide on-demand mobility for short and medium length trips. Expanding the City’s “hail-a-taxi” demonstration program to the Project site and surrounding area would provide convenient mobility alternatives for unscheduled or quick trips. In addition taxis could and should be equipped to accept regional transit fare cards such as Metro TAP smart card technology. A single method of fare payment would greatly
Mangrove Estates Site Mixed Use Development EIR Section 4.11 Transportation and Circulation
City of Los Angeles4.11-30
enhance non-auto oriented trip choices. Taxi services can also complement the guaranteed ride home program.
Potential Traffic Signal Upgrades. Additional mitigation efforts include potential traffic signal upgrades. Per LADOT:
The traffic signals at many of the intersections within the City of Los Angeles currently operate using older Type 170 traffic signal controller. Newer Model 2070 controllers provide for enhanced and real-time operation of the traffic signal timing. Type 2070 controllers allow DOT to provide instant adjustments to the signal’s timing parameters based on real-time traffic conditions. The upgrade of the controllers, when supplemented by the installation of strategically placed closed-circuit television (CCTV) cameras and additional vehicle detector loops, is expected to reduce the volume-to-capacity (V/C) ratio of an intersection by a minimum of 0.01. These traffic signal hardware upgrades are needed to provide for enhanced operation of the City’s ATSAC signal system, and to allow DOT to manage traffic in direct response to real-time traffic flow. The strategic placement of a CCTV camera affords DOT with the ability to monitor vehicles and buses, and respond to incidents that cause excessive delays. If any of these traffic signal upgrades are proposed as a mitigation to offset the significant traffic impacts of a development project, DOT may require that not only the impacted intersections, but also any intersections in the immediate vicinity as determined by DOT, be upgraded by the developer to qualify for the intersection V/C reduction of 0.01.
To potentially mitigate impacted study intersections, traffic signal upgrades are recommended at locations adjacent to significantly impacted intersections, per Mitigation Measure TC-1(b) below. Based on the location of the recommended upgrades, it was determined that four study intersections could apply the 0.01 reduction due to their proximity to the upgrade location.Although the intersection may not be directly mitigated, the overall enhancement of the system allows for the reduction.
T-2(b) Traffic Signal Upgrades. Prior to occupancy, the developer shall upgrade the traffic signals at the following locations to allow for enhanced and real-time operation of the traffic signal timing and allow DOT to provide instant adjustments to the signal’s timing parameters based on real-time traffic conditions:
Study Intersections
1. 3rd St. and Alameda St. (2070 controller upgrade only) 2. 2nd St. and Alameda St. (2070 controller upgrade and installation
of system loops on all approaches) 3. 1st St. and Central Ave. (2070 controller upgrade and installation
of system loops on all approaches) 4. 1st St. and San Pedro St. (2070 controller upgrade and installation
of system loops on all approaches)
Mangrove Estates Site Mixed Use Development EIR Section 4.11 Transportation and Circulation
City of Los Angeles4.11-31
Non Study Intersections
1. 1st St. between San Pedro St. and Central Ave. (2070 controller upgrade only)
2. 1st St. and Hill St. (2070 controller upgrade only) 3. Judge John Aiso St. and Temple Ave. (2070 controller upgrade
and installation of system loops on all approaches) 4. 2nd St. and San Pedro St. (2070 controller upgrade and
installation of system loops on all approaches) 5. 2nd St. and Central Ave. (2070 controller upgrade and
installation of system loops on all approaches) 6. 3rd St. and Los Angeles St. (2070 controller upgrade only)
“Study Intersections” are those within the project study area and for which project impacts have been identified. “Non Study Intersections” are outside the study area and have not been identified as having significant project impacts; however, signal improvements at these locations may improve the overall operation of the roadway system.
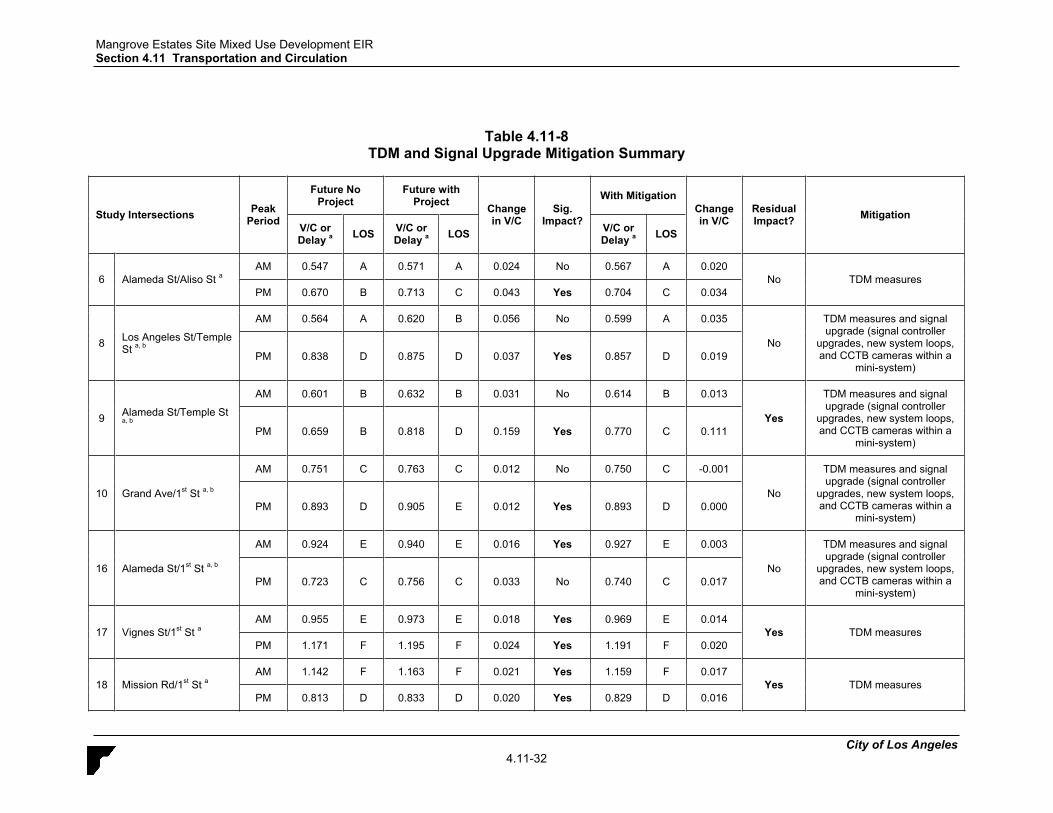
Significance after Mitigation. Table 4.11-8 presents the effects of the TDM measures and intersection signal upgrades at intersections that would have significant impacts due to traffic generated by onsite development. Implementation of TDM strategies would mitigate the impact at one of the nine significantly impacted study intersections: Alameda Street and Aliso Street. With the TDM strategies, the Alameda Street/Aliso Street intersection V/C would improve to 0.704 from 0.713.
With the addition of the traffic signal upgrades as recommended by LADOT, three additional intersections would be mitigated. Overall, four of the nine impacted intersections could be mitigated by the proposed measures. The three intersections would operate as follows:
Los Angeles Street and Temple Street: During the PM peak period, the V/C would improve to 0.865 from 0.875.
Grand Avenue and 1st Street: During the PM peak period, the V/C would improve to 0.895 from 0.905.
Alameda Street and 1st Street: During AM peak period, the V/C would improve to 0.930 from 0.940.
TDM strategies would reduce impacts at the other five study intersections to the degree feasible. However, additional mitigation that would reduce impacts at the following intersections to below a level of significance is not available:
Alameda Street/Temple Street Vignes Street/1st Street Mission Road/1st Street
U.S. 101 on and off-ramps/1st Street Hewitt Street/1st Street
Impacts at these five locations would be unavoidably significant.
Mangrove Estates Site Mixed Use Development EIR Section 4.11 Transportation and Circulation
City of Los Angeles4.11-32
Table 4.11-8 TDM and Signal Upgrade Mitigation Summary
Study Intersections PeakPeriod
Future No Project
Future with Project Change
in V/C Sig.
Impact?
With Mitigation Change in V/C
Residual Impact? Mitigation
V/C or Delay a LOS V/C or
Delay a LOS V/C or Delay a LOS
6 Alameda St/Aliso St aAM 0.547 A 0.571 A 0.024 No 0.567 A 0.020
No TDM measures PM 0.670 B 0.713 C 0.043 Yes 0.704 C 0.034
8 Los Angeles St/Temple St a, b
AM 0.564 A 0.620 B 0.056 No 0.599 A 0.035
No
TDM measures and signal upgrade (signal controller
upgrades, new system loops, and CCTB cameras within a
mini-system) PM 0.838 D 0.875 D 0.037 Yes 0.857 D 0.019
9 Alameda St/Temple St a, b
AM 0.601 B 0.632 B 0.031 No 0.614 B 0.013
Yes
TDM measures and signal upgrade (signal controller
upgrades, new system loops, and CCTB cameras within a
mini-system) PM 0.659 B 0.818 D 0.159 Yes 0.770 C 0.111
10 Grand Ave/1st St a, b
AM 0.751 C 0.763 C 0.012 No 0.750 C -0.001
No
TDM measures and signal upgrade (signal controller
upgrades, new system loops, and CCTB cameras within a
mini-system) PM 0.893 D 0.905 E 0.012 Yes 0.893 D 0.000
16 Alameda St/1st St a, b
AM 0.924 E 0.940 E 0.016 Yes 0.927 E 0.003
No
TDM measures and signal upgrade (signal controller
upgrades, new system loops, and CCTB cameras within a
mini-system) PM 0.723 C 0.756 C 0.033 No 0.740 C 0.017
17 Vignes St/1st St aAM 0.955 E 0.973 E 0.018 Yes 0.969 E 0.014
Yes TDM measures PM 1.171 F 1.195 F 0.024 Yes 1.191 F 0.020
18 Mission Rd/1st St aAM 1.142 F 1.163 F 0.021 Yes 1.159 F 0.017
Yes TDM measures PM 0.813 D 0.833 D 0.020 Yes 0.829 D 0.016
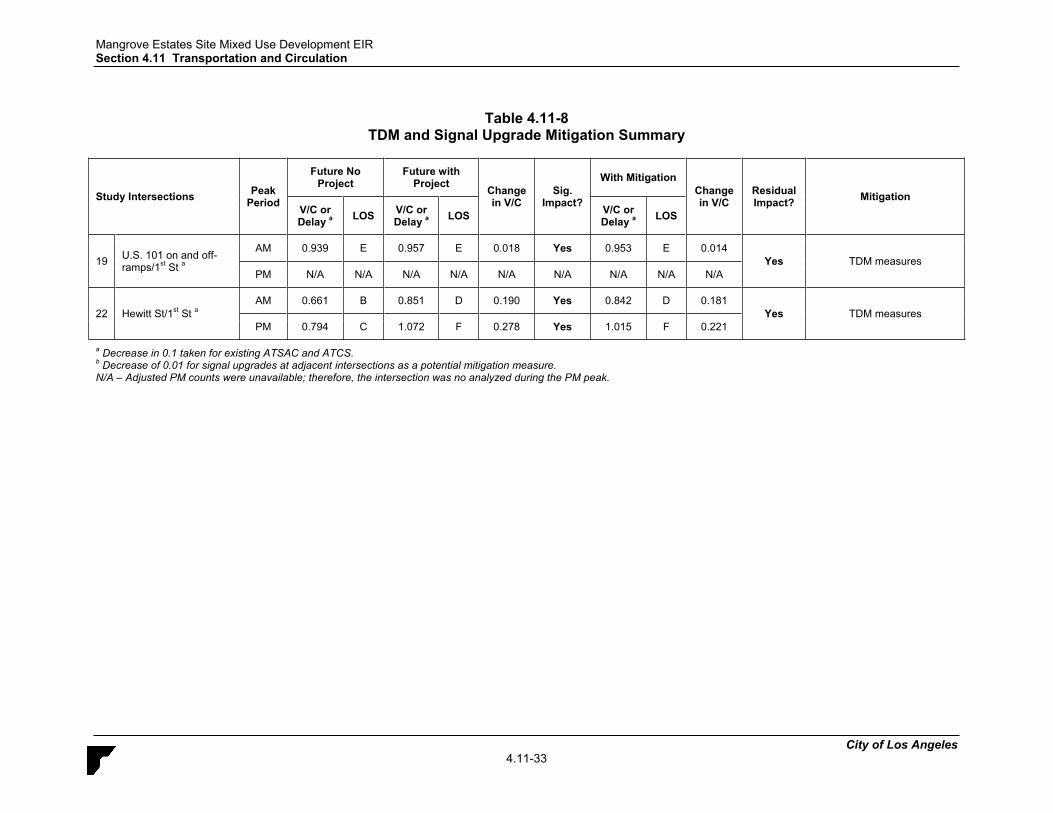
Mangrove Estates Site Mixed Use Development EIR Section 4.11 Transportation and Circulation
City of Los Angeles4.11-33
Table 4.11-8 TDM and Signal Upgrade Mitigation Summary
Study Intersections PeakPeriod
Future No Project
Future with Project Change
in V/C Sig.
Impact?
With Mitigation Change in V/C
Residual Impact? Mitigation
V/C or Delay a LOS V/C or
Delay a LOS V/C or Delay a LOS
19 U.S. 101 on and off-ramps/1st St a
AM 0.939 E 0.957 E 0.018 Yes 0.953 E 0.014 Yes TDM measures
PM N/A N/A N/A N/A N/A N/A N/A N/A N/A
22 Hewitt St/1st St aAM 0.661 B 0.851 D 0.190 Yes 0.842 D 0.181
Yes TDM measures PM 0.794 C 1.072 F 0.278 Yes 1.015 F 0.221
a Decrease in 0.1 taken for existing ATSAC and ATCS. b Decrease of 0.01 for signal upgrades at adjacent intersections as a potential mitigation measure. N/A – Adjusted PM counts were unavailable; therefore, the intersection was no analyzed during the PM peak.
Mangrove Estates Site Mixed Use Development EIR Section 4.11 Transportation and Circulation
City of Los Angeles4.11-34
Impact T-3 Traffic generated by onsite development would incrementally increase traffic at the CMP intersection of Alameda Street and Washington Boulevard as well as at nearby CMP freeway monitoring locations. However, traffic would be less than CMP thresholds. Therefore, impacts related to CMP consistency would be less than significant.
The County of Los Angeles Congestion Management Program (CMP) was created statewide because of Proposition 111 and was implemented locally by the Los Angeles County Metropolitan Transportation Authority (Metro). The CMP for Los Angeles County requires that the traffic impact of individual development projects of potential regional significance be analyzed. A specific system of arterial roadways plus all freeways comprises the CMP system. Per CMP Transportation Impact Analysis (TIA) Guidelines, a traffic impact analysis is conducted where:
The project would add 50 or more vehicle trips during either AM or PM weekday peak hours at CMP arterial monitoring intersections, including freeway on-ramps or off-rampsThe project would add 150 or more trips, in either direction, during the either the AM or PM weekday peak hours at CMP mainline freeway monitoring locations
The CMP arterial monitoring intersection nearest to the project site is:
Alameda Street and Washington Boulevard.
Based on the trip generation/distribution for onsite development and the distance of this CMP route from the study intersections, it is not expected that 50 or more new trips per hour would be added to this location. Therefore, no further analysis of potential CMP impacts is required for arterial monitoring intersections.
The CMP freeway monitoring locations nearest to the project site are:
U.S. 101 north of Vignes Street I-110 south of US-101 SR-110 at Alpine Street
Based on the trip generation/distribution for onsite development and the distance of these CMP monitoring locations from the study intersections, it is not expected that 150 or more new trips per hour would be added to these locations. Therefore, no further analysis of potential CMP impacts is required for freeway monitoring locations.
Mitigation Measures. Mitigation is not required as impacts to CMP monitoring locations would be less than significant.
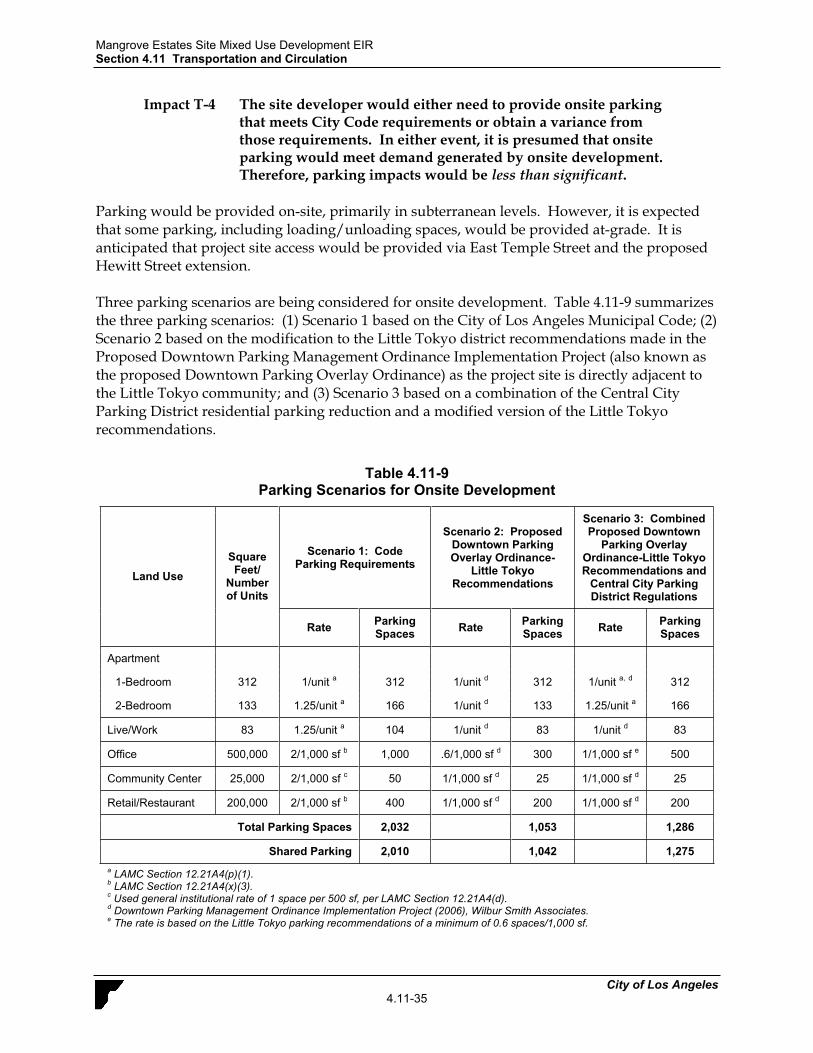
Mangrove Estates Site Mixed Use Development EIR Section 4.11 Transportation and Circulation
City of Los Angeles4.11-35
Impact T-4 The site developer would either need to provide onsite parking that meets City Code requirements or obtain a variance from those requirements. In either event, it is presumed that onsite parking would meet demand generated by onsite development. Therefore, parking impacts would be less than significant.
Parking would be provided on-site, primarily in subterranean levels. However, it is expected that some parking, including loading/unloading spaces, would be provided at-grade. It is anticipated that project site access would be provided via East Temple Street and the proposed Hewitt Street extension.
Three parking scenarios are being considered for onsite development. Table 4.11-9 summarizes the three parking scenarios: (1) Scenario 1 based on the City of Los Angeles Municipal Code; (2) Scenario 2 based on the modification to the Little Tokyo district recommendations made in the Proposed Downtown Parking Management Ordinance Implementation Project (also known as the proposed Downtown Parking Overlay Ordinance) as the project site is directly adjacent to the Little Tokyo community; and (3) Scenario 3 based on a combination of the Central City Parking District residential parking reduction and a modified version of the Little Tokyo recommendations.
Table 4.11-9 Parking Scenarios for Onsite Development
Land Use Square Feet/
Number of Units
Scenario 1: Code Parking Requirements
Scenario 2: Proposed Downtown Parking Overlay Ordinance-
Little Tokyo Recommendations
Scenario 3: Combined Proposed Downtown
Parking Overlay Ordinance-Little Tokyo Recommendations and
Central City Parking District Regulations
Rate ParkingSpaces Rate Parking
Spaces Rate ParkingSpaces
Apartment
1-Bedroom 312 1/unit a 312 1/unit d 312 1/unit a, d 312
2-Bedroom 133 1.25/unit a 166 1/unit d 133 1.25/unit a 166
Live/Work 83 1.25/unit a 104 1/unit d 83 1/unit d 83
Office 500,000 2/1,000 sf b 1,000 .6/1,000 sf d 300 1/1,000 sf e 500
Community Center 25,000 2/1,000 sf c 50 1/1,000 sf d 25 1/1,000 sf d 25
Retail/Restaurant 200,000 2/1,000 sf b 400 1/1,000 sf d 200 1/1,000 sf d 200
Total Parking Spaces 2,032 1,053 1,286
Shared Parking 2,010 1,042 1,275a LAMC Section 12.21A4(p)(1). b LAMC Section 12.21A4(x)(3). c Used general institutional rate of 1 space per 500 sf, per LAMC Section 12.21A4(d). d Downtown Parking Management Ordinance Implementation Project (2006), Wilbur Smith Associates. e The rate is based on the Little Tokyo parking recommendations of a minimum of 0.6 spaces/1,000 sf.
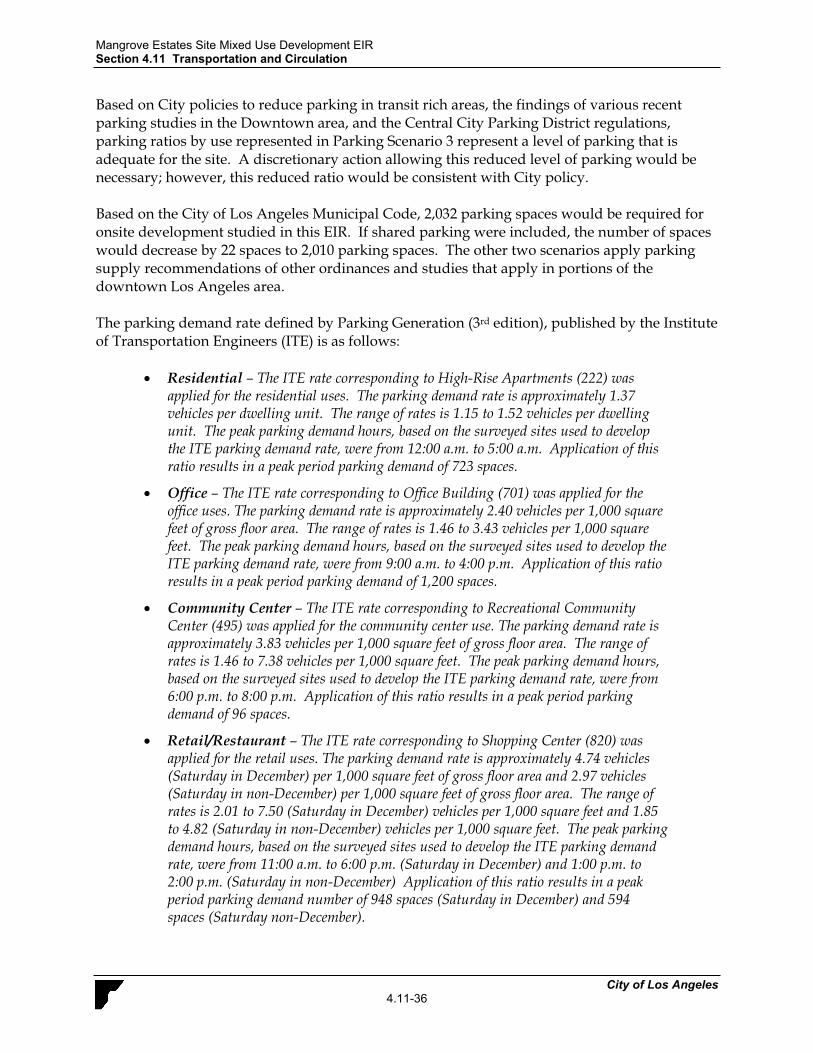
Mangrove Estates Site Mixed Use Development EIR Section 4.11 Transportation and Circulation
City of Los Angeles4.11-36
Based on City policies to reduce parking in transit rich areas, the findings of various recent parking studies in the Downtown area, and the Central City Parking District regulations, parking ratios by use represented in Parking Scenario 3 represent a level of parking that is adequate for the site. A discretionary action allowing this reduced level of parking would be necessary; however, this reduced ratio would be consistent with City policy.
Based on the City of Los Angeles Municipal Code, 2,032 parking spaces would be required for onsite development studied in this EIR. If shared parking were included, the number of spaces would decrease by 22 spaces to 2,010 parking spaces. The other two scenarios apply parking supply recommendations of other ordinances and studies that apply in portions of the downtown Los Angeles area.
The parking demand rate defined by Parking Generation (3rd edition), published by the Institute of Transportation Engineers (ITE) is as follows:
Residential – The ITE rate corresponding to High-Rise Apartments (222) was applied for the residential uses. The parking demand rate is approximately 1.37 vehicles per dwelling unit. The range of rates is 1.15 to 1.52 vehicles per dwelling unit. The peak parking demand hours, based on the surveyed sites used to develop the ITE parking demand rate, were from 12:00 a.m. to 5:00 a.m. Application of this ratio results in a peak period parking demand of 723 spaces.
Office – The ITE rate corresponding to Office Building (701) was applied for the office uses. The parking demand rate is approximately 2.40 vehicles per 1,000 square feet of gross floor area. The range of rates is 1.46 to 3.43 vehicles per 1,000 square feet. The peak parking demand hours, based on the surveyed sites used to develop the ITE parking demand rate, were from 9:00 a.m. to 4:00 p.m. Application of this ratio results in a peak period parking demand of 1,200 spaces.
Community Center – The ITE rate corresponding to Recreational Community Center (495) was applied for the community center use. The parking demand rate is approximately 3.83 vehicles per 1,000 square feet of gross floor area. The range of rates is 1.46 to 7.38 vehicles per 1,000 square feet. The peak parking demand hours, based on the surveyed sites used to develop the ITE parking demand rate, were from 6:00 p.m. to 8:00 p.m. Application of this ratio results in a peak period parking demand of 96 spaces.
Retail/Restaurant – The ITE rate corresponding to Shopping Center (820) was applied for the retail uses. The parking demand rate is approximately 4.74 vehicles (Saturday in December) per 1,000 square feet of gross floor area and 2.97 vehicles (Saturday in non-December) per 1,000 square feet of gross floor area. The range of rates is 2.01 to 7.50 (Saturday in December) vehicles per 1,000 square feet and 1.85 to 4.82 (Saturday in non-December) vehicles per 1,000 square feet. The peak parking demand hours, based on the surveyed sites used to develop the ITE parking demand rate, were from 11:00 a.m. to 6:00 p.m. (Saturday in December) and 1:00 p.m. to 2:00 p.m. (Saturday in non-December) Application of this ratio results in a peak period parking demand number of 948 spaces (Saturday in December) and 594 spaces (Saturday non-December).
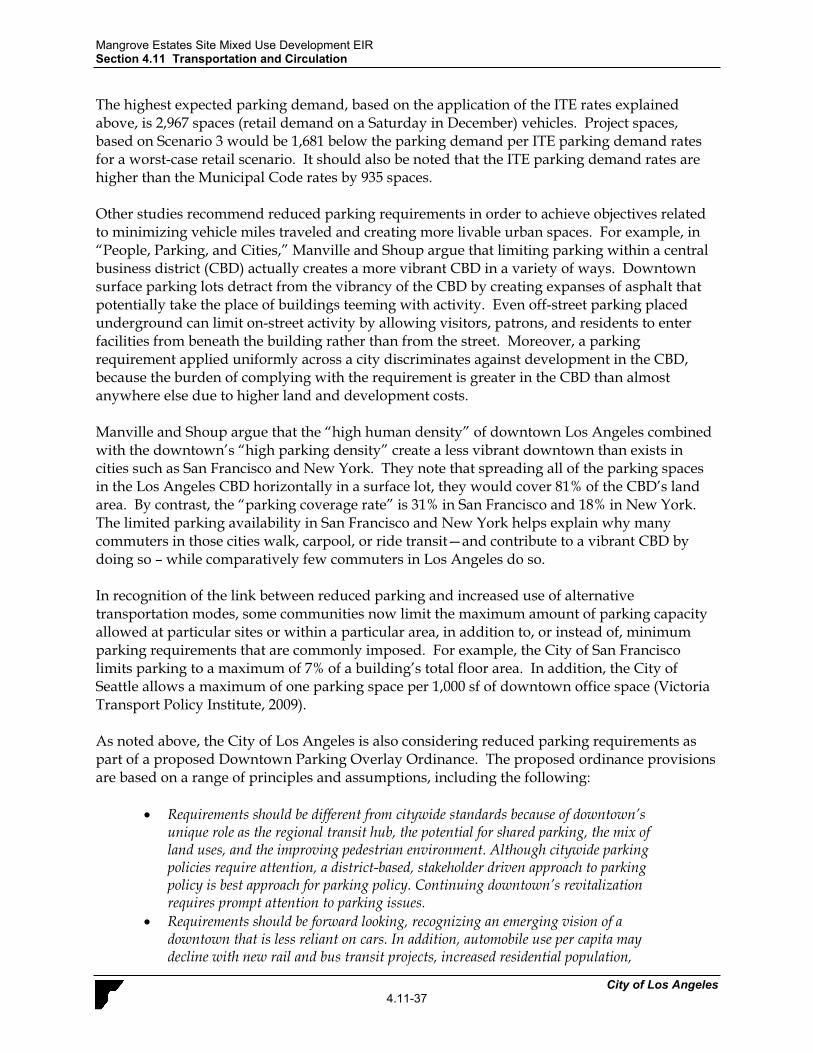
Mangrove Estates Site Mixed Use Development EIR Section 4.11 Transportation and Circulation
City of Los Angeles4.11-37
The highest expected parking demand, based on the application of the ITE rates explained above, is 2,967 spaces (retail demand on a Saturday in December) vehicles. Project spaces, based on Scenario 3 would be 1,681 below the parking demand per ITE parking demand rates for a worst-case retail scenario. It should also be noted that the ITE parking demand rates are higher than the Municipal Code rates by 935 spaces.
Other studies recommend reduced parking requirements in order to achieve objectives related to minimizing vehicle miles traveled and creating more livable urban spaces. For example, in “People, Parking, and Cities,” Manville and Shoup argue that limiting parking within a central business district (CBD) actually creates a more vibrant CBD in a variety of ways. Downtown surface parking lots detract from the vibrancy of the CBD by creating expanses of asphalt that potentially take the place of buildings teeming with activity. Even off-street parking placed underground can limit on-street activity by allowing visitors, patrons, and residents to enter facilities from beneath the building rather than from the street. Moreover, a parking requirement applied uniformly across a city discriminates against development in the CBD, because the burden of complying with the requirement is greater in the CBD than almost anywhere else due to higher land and development costs.
Manville and Shoup argue that the “high human density” of downtown Los Angeles combined with the downtown’s “high parking density” create a less vibrant downtown than exists in cities such as San Francisco and New York. They note that spreading all of the parking spaces in the Los Angeles CBD horizontally in a surface lot, they would cover 81% of the CBD’s land area. By contrast, the “parking coverage rate” is 31% in San Francisco and 18% in New York.The limited parking availability in San Francisco and New York helps explain why many commuters in those cities walk, carpool, or ride transit—and contribute to a vibrant CBD by doing so – while comparatively few commuters in Los Angeles do so.
In recognition of the link between reduced parking and increased use of alternative transportation modes, some communities now limit the maximum amount of parking capacity allowed at particular sites or within a particular area, in addition to, or instead of, minimum parking requirements that are commonly imposed. For example, the City of San Francisco limits parking to a maximum of 7% of a building’s total floor area. In addition, the City of Seattle allows a maximum of one parking space per 1,000 sf of downtown office space (Victoria Transport Policy Institute, 2009).
As noted above, the City of Los Angeles is also considering reduced parking requirements as part of a proposed Downtown Parking Overlay Ordinance. The proposed ordinance provisions are based on a range of principles and assumptions, including the following:
Requirements should be different from citywide standards because of downtown’s unique role as the regional transit hub, the potential for shared parking, the mix of land uses, and the improving pedestrian environment. Although citywide parking policies require attention, a district-based, stakeholder driven approach to parking policy is best approach for parking policy. Continuing downtown’s revitalization requires prompt attention to parking issues. Requirements should be forward looking, recognizing an emerging vision of a downtown that is less reliant on cars. In addition, automobile use per capita may decline with new rail and bus transit projects, increased residential population,
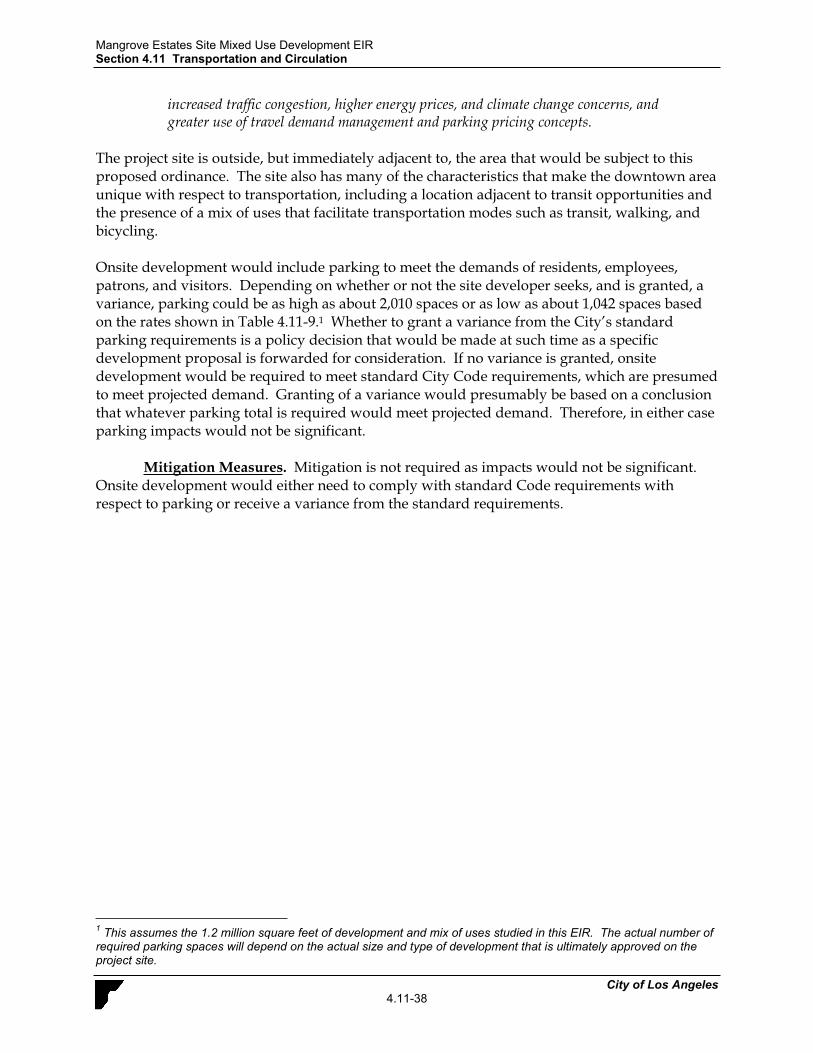
Mangrove Estates Site Mixed Use Development EIR Section 4.11 Transportation and Circulation
City of Los Angeles4.11-38
increased traffic congestion, higher energy prices, and climate change concerns, and greater use of travel demand management and parking pricing concepts.
The project site is outside, but immediately adjacent to, the area that would be subject to this proposed ordinance. The site also has many of the characteristics that make the downtown area unique with respect to transportation, including a location adjacent to transit opportunities and the presence of a mix of uses that facilitate transportation modes such as transit, walking, and bicycling.
Onsite development would include parking to meet the demands of residents, employees, patrons, and visitors. Depending on whether or not the site developer seeks, and is granted, a variance, parking could be as high as about 2,010 spaces or as low as about 1,042 spaces based on the rates shown in Table 4.11-9.1 Whether to grant a variance from the City’s standard parking requirements is a policy decision that would be made at such time as a specific development proposal is forwarded for consideration. If no variance is granted, onsite development would be required to meet standard City Code requirements, which are presumed to meet projected demand. Granting of a variance would presumably be based on a conclusion that whatever parking total is required would meet projected demand. Therefore, in either case parking impacts would not be significant.
Mitigation Measures. Mitigation is not required as impacts would not be significant. Onsite development would either need to comply with standard Code requirements with respect to parking or receive a variance from the standard requirements.
1 This assumes the 1.2 million square feet of development and mix of uses studied in this EIR. The actual number of required parking spaces will depend on the actual size and type of development that is ultimately approved on the project site.


![Mai 2016 [4.11 MB]](https://img.pdfslide.us/doc/110x75/5891b7ba1a28abc1698b6faf/mai-2016-411-mb.jpg)