Embed Size (px)
Citation preview
CHAPTER 4. RESULTS
52
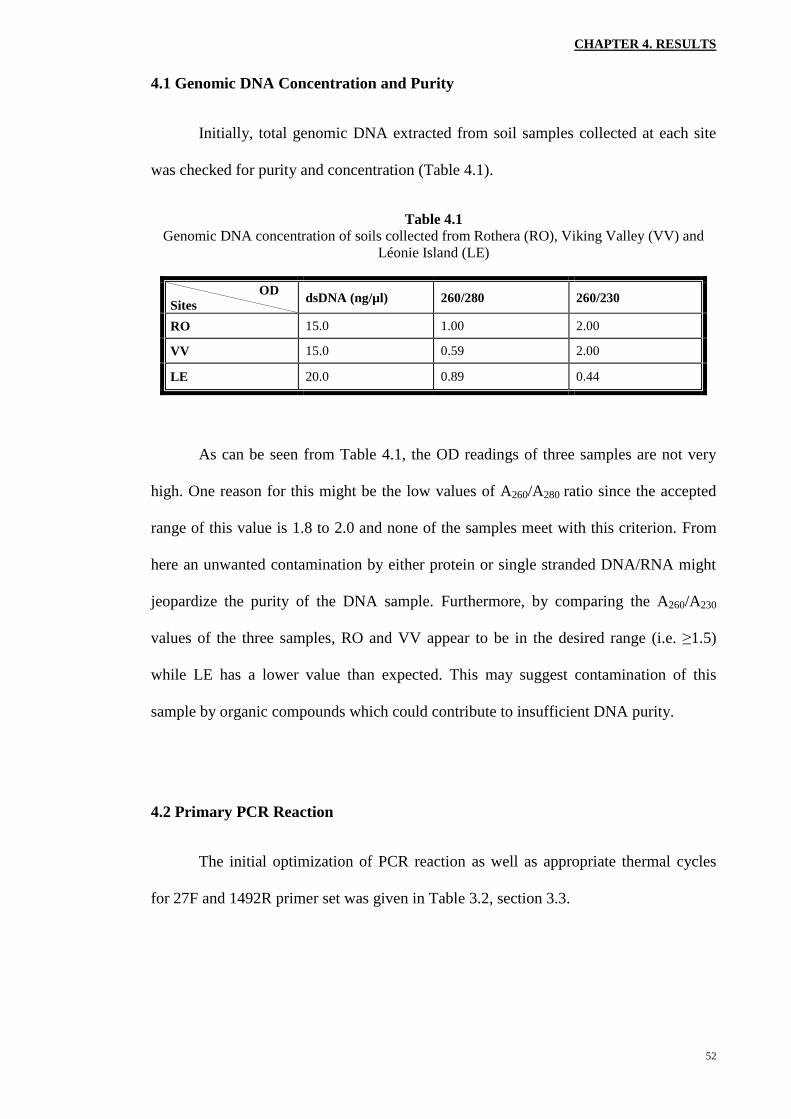
4.1 Genomic DNA Concentration and Purity
Initially, total genomic DNA extracted from soil samples collected at each site
was checked for purity and concentration (Table 4.1).
Table 4.1 Genomic DNA concentration of soils collected from Rothera (RO), Viking Valley (VV) and
Léonie Island (LE)
OD
Sites dsDNA (ng/µl) 260/280 260/230
RO 15.0 1.00 2.00
VV 15.0 0.59 2.00
LE 20.0 0.89 0.44
As can be seen from Table 4.1, the OD readings of three samples are not very
high. One reason for this might be the low values of A260/A280 ratio since the accepted
range of this value is 1.8 to 2.0 and none of the samples meet with this criterion. From
here an unwanted contamination by either protein or single stranded DNA/RNA might
jeopardize the purity of the DNA sample. Furthermore, by comparing the A260/A230
values of the three samples, RO and VV appear to be in the desired range (i.e. ≥1.5)
while LE has a lower value than expected. This may suggest contamination of this
sample by organic compounds which could contribute to insufficient DNA purity.
4.2 Primary PCR Reaction
The initial optimization of PCR reaction as well as appropriate thermal cycles
for 27F and 1492R primer set was given in Table 3.2, section 3.3.
CHAPTER 4. RESULTS
53
4.2.1 Template
Total genomic DNA extracted from soil samples at different locations in
maritime Antarctica was inspected for bacterial SSU ribosomal gene. The DNA samples
to be used as template in PCR amplification needed to be diluted with dH2O before each
round of PCR. This is a crucial step since it helps to dilute out certain impurities present
in samples such as humic compounds, decreasing the level of any unwanted
components that might interfere with PCR amplification (Volossiouk et al., 1995).
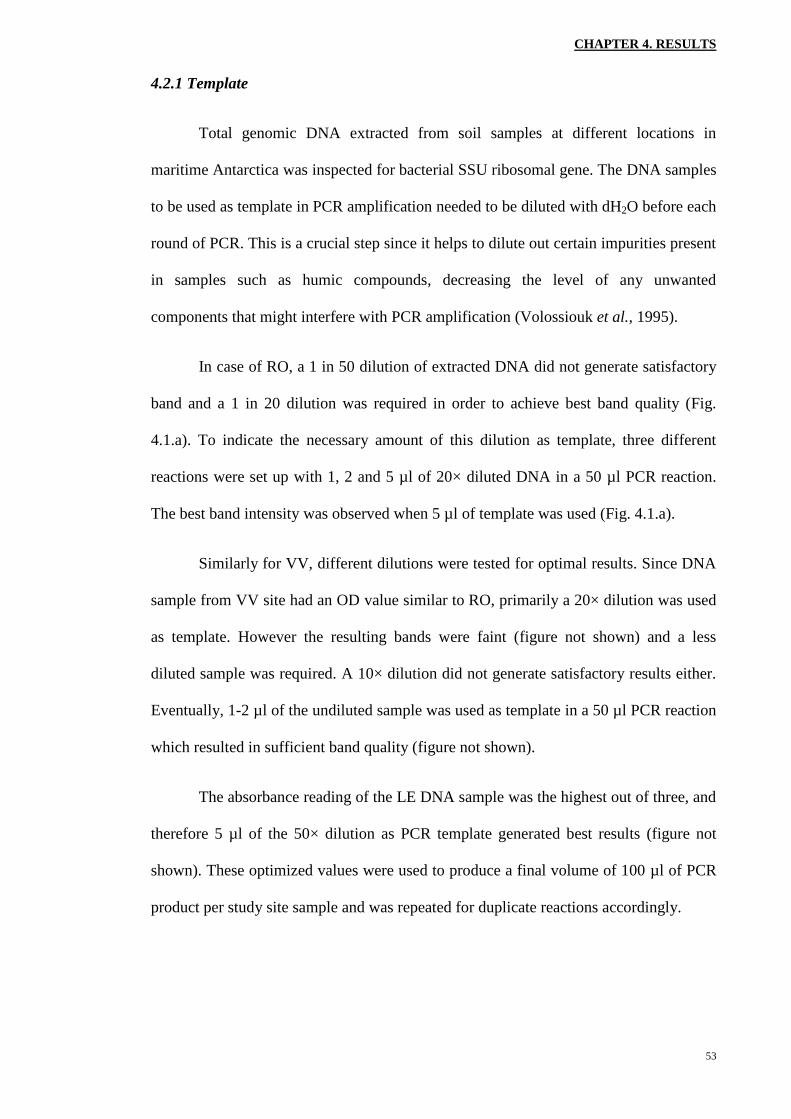
In case of RO, a 1 in 50 dilution of extracted DNA did not generate satisfactory
band and a 1 in 20 dilution was required in order to achieve best band quality (Fig.
4.1.a). To indicate the necessary amount of this dilution as template, three different
reactions were set up with 1, 2 and 5 µl of 20× diluted DNA in a 50 µl PCR reaction.
The best band intensity was observed when 5 µl of template was used (Fig. 4.1.a).
Similarly for VV, different dilutions were tested for optimal results. Since DNA
sample from VV site had an OD value similar to RO, primarily a 20× dilution was used
as template. However the resulting bands were faint (figure not shown) and a less
diluted sample was required. A 10× dilution did not generate satisfactory results either.
Eventually, 1-2 µl of the undiluted sample was used as template in a 50 µl PCR reaction
which resulted in sufficient band quality (figure not shown).
The absorbance reading of the LE DNA sample was the highest out of three, and
therefore 5 µl of the 50× dilution as PCR template generated best results (figure not
shown). These optimized values were used to produce a final volume of 100 µl of PCR
product per study site sample and was repeated for duplicate reactions accordingly.
CHAPTER 4. RESULTS
54
a.
b.
Figure 4.1 Primary PCR amplification of RO site DNA sample a. Resulting bands after 50×
(left) and 20× dilutions (right). The lanes are marked according to the volume of template used;
no band is observed in negative control b. Purified DNA. All bands are 1,500 bp in size as
indicated by HyperLadder weight marker.
4.3 PCR Purification
The desired PCR products were purified before being cloned into corresponding
vectors. The PCR purifications were carried out to remove excess salt (MgCl2) present
in PCR reagents and the primer dimers resulting from self-annealing during PCR
reactions. These impurities were removed as they may interfere with the ligation step in
cloning process.
CHAPTER 4. RESULTS
55
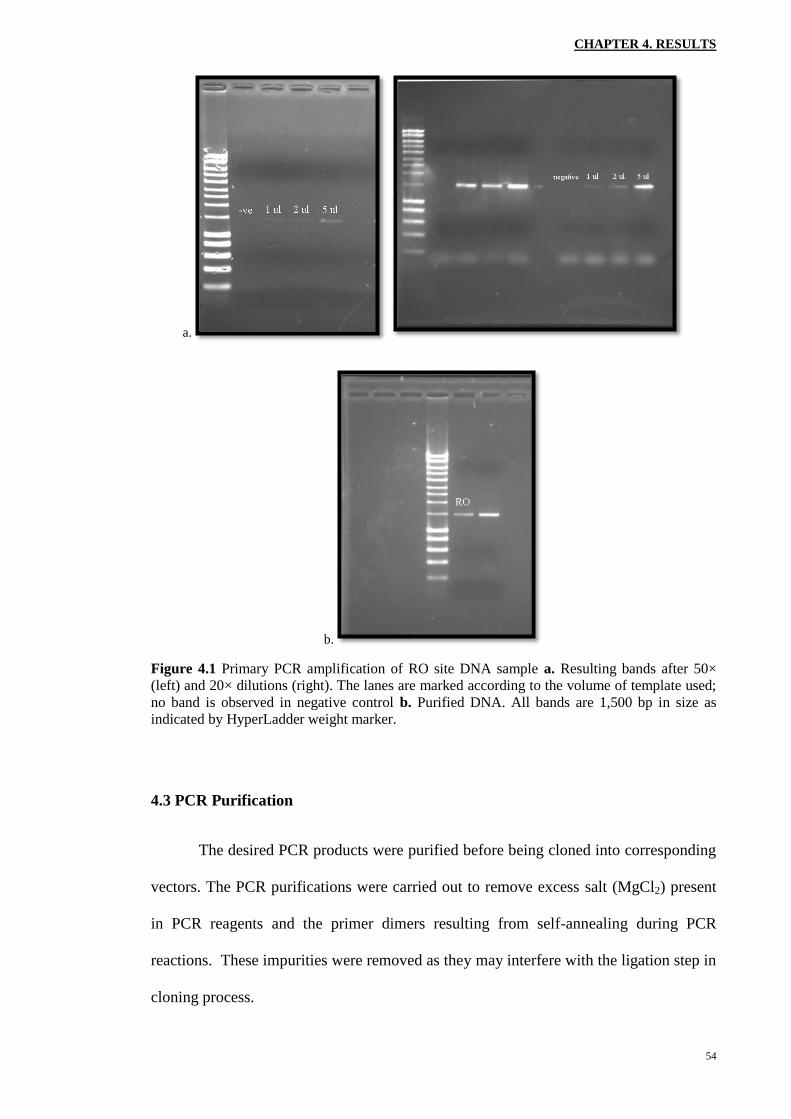
For each clone library construction, a total of 100 µl DNA was produced by
PCR amplification prior to cloning. The products were purified as described (refer to
chapter 3, section 3.5) provided that no band was observed in the negative control
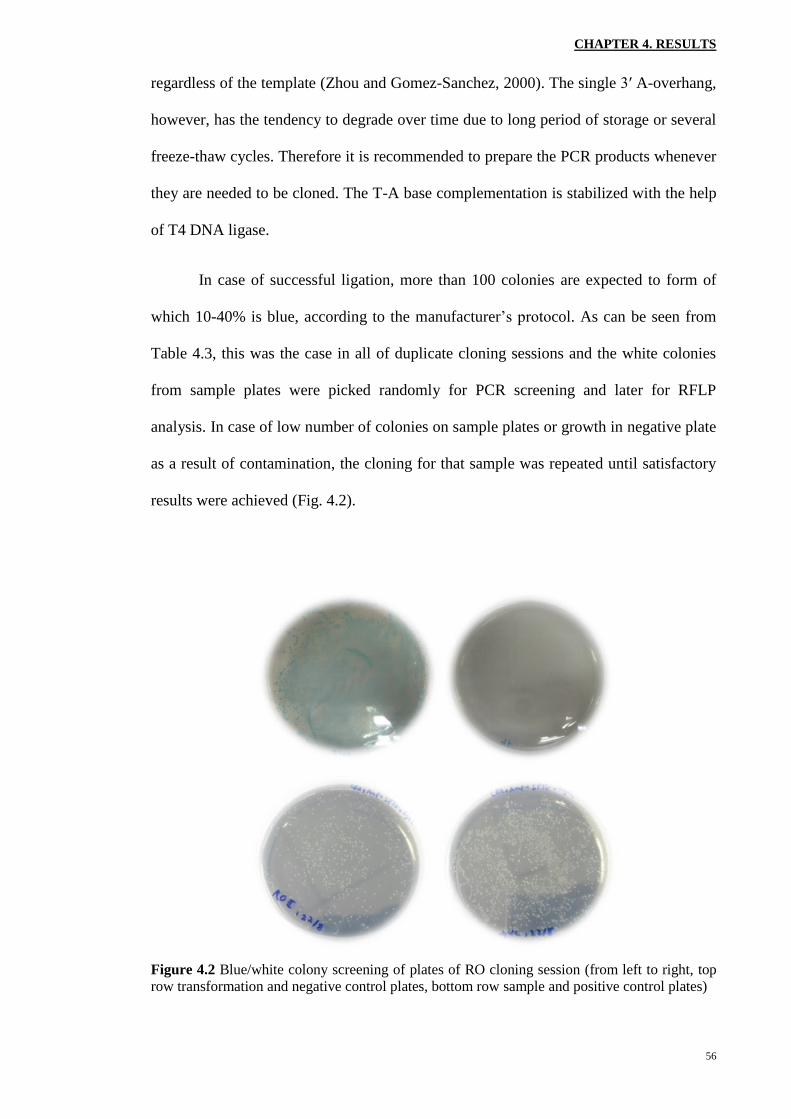
reaction (Fig. 4.1). Once confirmed by gel electrophoresis, the concentration of the
purified samples was measured by spectrophotometry (Table 4.2) in order to specify the
amount of DNA for ligation process. The calculated volume needed for ligation for each
DNA sample is listed in Table 4.2 (refer to section 3.6.2 for calculations).
Table 4.2
Purified DNA concentration post PCR amplification and calculated amount of DNA required
for ligation reaction for each cloning session (duplicates carried out for each site indicated by
Roman numerals)
Site OD (ng/µl) Volume for ligation (µl)
ROI
ROII
17.5
33.7
3
1.5
VVI
VVII
22.5
32.9
2.2
1.5
LEI
LEII
47.9
47.9
1
1
4.4 Cloning
Clone libraries were constructed concerning bacterial 16S rRNA gene from total
community DNA extracted directly from soil from three different sites in Antarctica
using pGEM®-T Easy Vector System (Fig. 3.3; see section 3.6). For each cloning
reaction, freshly prepared PCR products were used in the TA Cloning® process.
As can be seen in Fig. 3.3, the vector is linearized with a single 3ʹ T-overhang at
both ends. This will greatly improve the ligation efficiency of the insert into the vector
by offering a compatible overhang for the PCR product that has an additional 3ʹ A-
overhang. This in turn, is made possible by the basic concept of transferase activity of
most DNA polymerases which lack 5ʹ→3ʹ proofreading ability, such as Taq
polymerase, adding a single adenosine base to the 3ʹ-ends of double stranded DNA
CHAPTER 4. RESULTS
56
regardless of the template (Zhou and Gomez-Sanchez, 2000). The single 3ʹ A-overhang,
however, has the tendency to degrade over time due to long period of storage or several
freeze-thaw cycles. Therefore it is recommended to prepare the PCR products whenever
they are needed to be cloned. The T-A base complementation is stabilized with the help
of T4 DNA ligase.
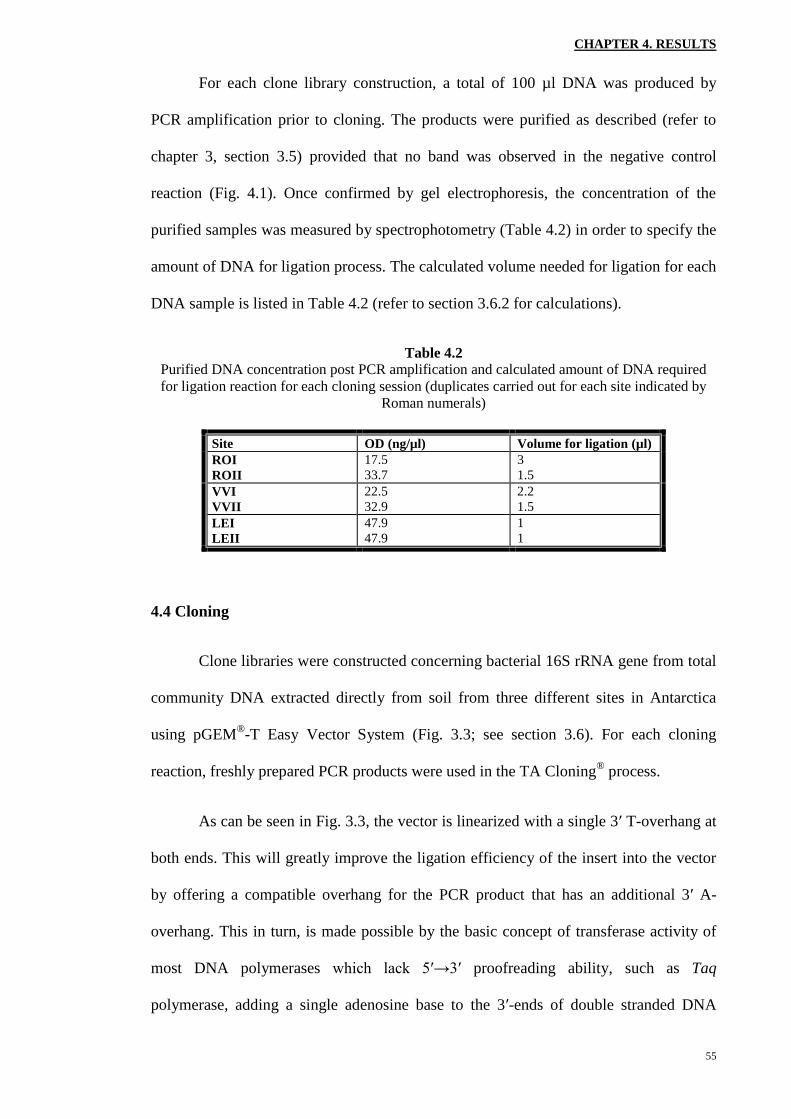
In case of successful ligation, more than 100 colonies are expected to form of
which 10-40% is blue, according to the manufacturer’s protocol. As can be seen from
Table 4.3, this was the case in all of duplicate cloning sessions and the white colonies
from sample plates were picked randomly for PCR screening and later for RFLP
analysis. In case of low number of colonies on sample plates or growth in negative plate
as a result of contamination, the cloning for that sample was repeated until satisfactory
results were achieved (Fig. 4.2).
Figure 4.2 Blue/white colony screening of plates of RO cloning session (from left to right, top
row transformation and negative control plates, bottom row sample and positive control plates)

CHAPTER 4. RESULTS
57
Table 4.3 Colony count of duplicate cloning sessions, number of white colonies and blue colonies for both
sample and positive control plates
Plates White Blue
Sample Positive Sample Positive
ROI
ROII
167
258
617
750+
24
65
83
127
VVI
VVII
192
235
688
780+
46
94
95
186
LEI
LEII
253
203
700+
674
89
57
159
140
Using vector-specific primers regarding Sp6 and T7 promoters, the selected
colonies were screened for correct insert. The sequence of the promoter as well as the
MCS of the vector is shown in Fig. 4.3.a. From there the total size of the amplified
region including the 16S rRNA gene is apparent to be around 1,680 bp (1502 bp insert
DNA + 78 bp T7+ 101 bp SP6). This is confirmed by agarose gel electrophoresis for all
PCR products. The samples showing bands of unwanted sizes or no band at all (in case
they persisted after repetition) were discarded (Fig. 4.3.b). The rest was chosen for
further RFLP analysis.
a.
Figure 4.3 a. The promoter and MCS of pGEM®-T Easy Vector (Technical Manual for
pGEM®-T and pGEM
®-T Easy Vector Systems; retrieved from:
http://www.promega.com/tbs/tm042/tm042.pdf, on May 30, 2010)

CHAPTER 4. RESULTS
58
b.
Figure 4.3 b. Colony PCR of cloned cells from RO cloning session; all bands showing the
correct size except one (pointed out with arrow)
4.5 RFLP Analysis
All the PCR products showing the positive insert from clone libraries were
screened for similarity by RFLP analysis. For this purpose, two restriction enzymes,
HaeIII (source organism: Haemophilus aegypticus) and HhaI (from: Haemophilus
haemolyticus) were employed. By using a two enzyme system rather than just one, the
chances of obtaining undisputed fingerprints increases with better likelihood of each
unique pattern corresponding to one certain species. The buffer system C was used with
100% activity for both enzymes (Promega, Madison, WI, USA).
The suggested amount of DNA for best results according to the manufacturer’s
guide is 1 µg. However, judging by the band quality of PCR products from all amplicon
libraries, a volume of 5-10 µl was used for majority of samples whereby adequate band
resolution was observed (Fig. 4.4). In case the original PCR product proved to be less
concentrated, 15 µl was added to the RE reaction (refer to section 3.8). The resulting
bands were inspected by 1.5% (w/v) agarose gel electrophoresis (Fig. 4.4).

CHAPTER 4. RESULTS
59
Figure 4.4 An overview of RFLP analysis corresponding to ROI clone library with examples of
some of the patterns. Lambda DNA (image to the right) was used as a control for monitoring
enzyme digestion.
The main challenge with RFLP fingerprints is to correctly relate and group all
the patterns (phylotypes). For the current work, total of 548 clones were screened by
restriction fragment length polymorphism. All the documented RE gel pictures were
uploaded to the GelComparII software for categorization (refer to section 3.8.2). Each
cluster of similar RFLP pattern was considered a phylotype and was further inspected to
double-check the proper matching of all individuals lying within that collection. A few
samples needed to be manually matched to the existing groups due to either incorrect
band configuration by the software or ambiguity.
The clones grouped within 25-35 phylotype patterns per clone library with some
of them being rare and site-specific (Table 2S, Appendix B). However, many instances
of community-dominant (CD) phylotypes (i.e. those that occurred ≥3 times) were
observed in each clone library, especially in clones from RO site sample (Table 4.4).
The most occurring phylotype in all three clone libraries belonged to fingerprint type A.
CHAPTER 4. RESULTS
60
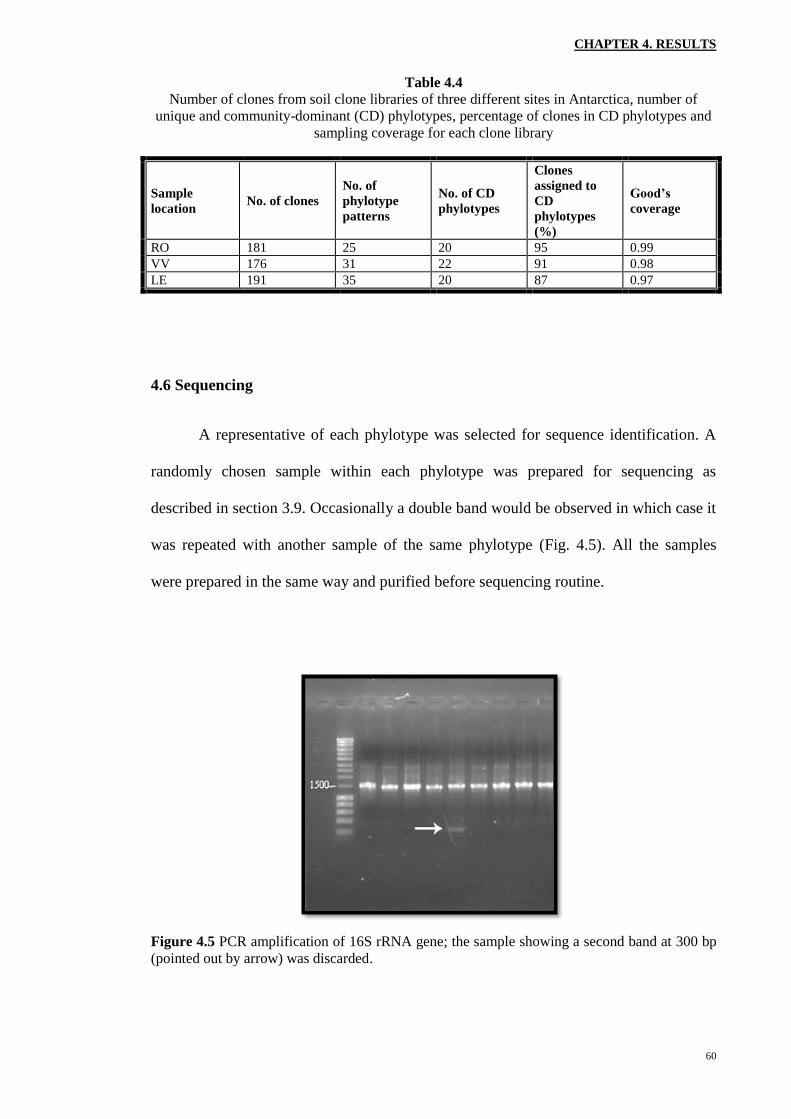
Table 4.4 Number of clones from soil clone libraries of three different sites in Antarctica, number of
unique and community-dominant (CD) phylotypes, percentage of clones in CD phylotypes and
sampling coverage for each clone library
Sample
location No. of clones
No. of
phylotype
patterns
No. of CD
phylotypes
Clones
assigned to
CD
phylotypes
(%)
Good’s
coverage
RO 181 25 20 95 0.99
VV 176 31 22 91 0.98
LE 191 35 20 87 0.97
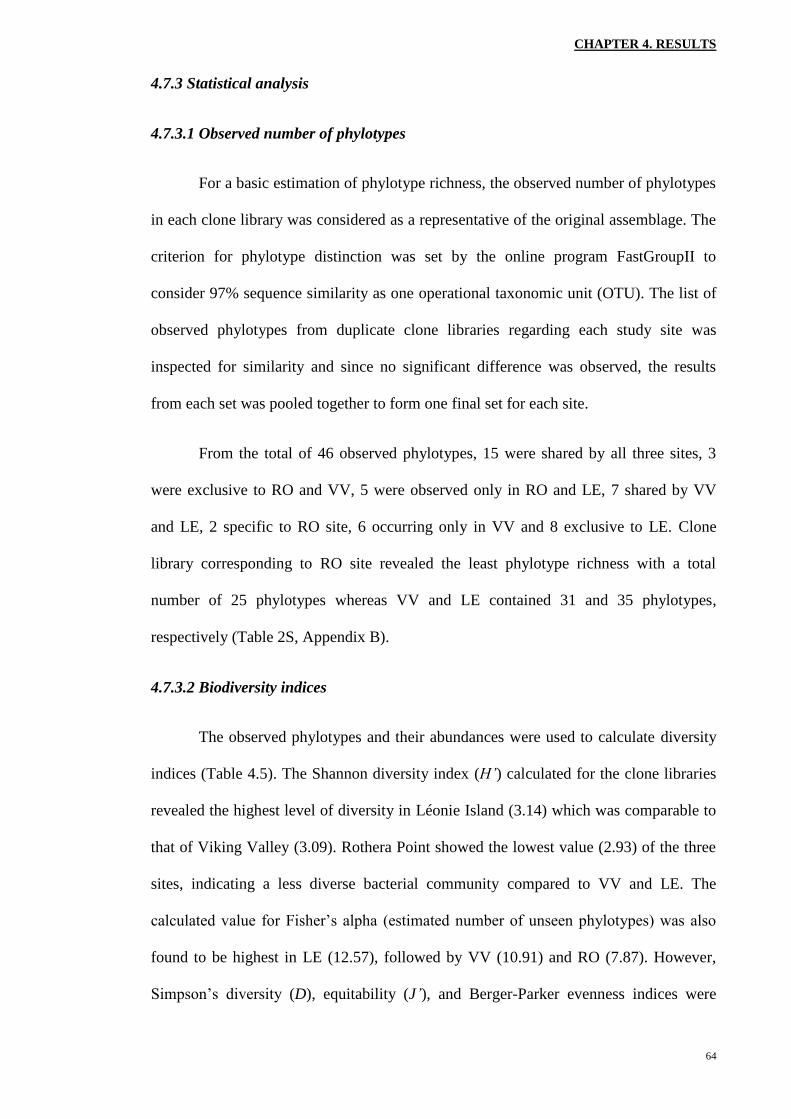
4.6 Sequencing
A representative of each phylotype was selected for sequence identification. A
randomly chosen sample within each phylotype was prepared for sequencing as
described in section 3.9. Occasionally a double band would be observed in which case it
was repeated with another sample of the same phylotype (Fig. 4.5). All the samples
were prepared in the same way and purified before sequencing routine.
Figure 4.5 PCR amplification of 16S rRNA gene; the sample showing a second band at 300 bp
(pointed out by arrow) was discarded.

CHAPTER 4. RESULTS
61
All the chromatogram files of the sequence results were checked individually by
Sequence Scanner version 1.0 (Applied Biosystems, 2005) to ensure maximum quality
of the sequences. Most of the results showed reasonable signal peak strength and no
mixed signals throughout majority of the sequence length, in which case further
sequence analysis was carried out (Fig. 1S, Appendix C).
4.7 Data Analysis
4.7.1 16S rRNA gene sequences
Over 50 DNA sequences were submitted to NCBI website for nucleotide
BLAST (BLASTn) search. The sequences showing maximum identity score in a pair-
wise alignment were copied along with percentage identity and accession number
(Table 2S, Appendix B).
4.7.2 Phylogenetic analysis
Total of 144 sequences including the subject data were studied for homology by
constructing a multiple sequence alignment. A final set of about 637 nucleotides was
found to be shared unambiguously by all sequences. The online grouping of the
trimmed sequences revealed a total of 46 independent groups of OTUs (Table 2S,
Appendix B). None of the sequences showed any significant anomaly as suggested by
the Pintail tool. Neighbor-Joining (NJ) phylogenetic tree was constructed (refer to
section 3.10) to show the phylogenetic affiliations of sample sequences (Fig. 2S,
Appendix E). Closely related individuals clustering together were considered belonging
to the same phylum after confirmation by the RDP Classifier tool (Table 3S, Appendix
D). The observed phyla and their corresponding phylotype relative abundance in each
site are presented in Fig. 4.6.

CHAPTER 4. RESULTS
62
Figure 4.6 Bar charts of clone library composition at phylum level for Rothera (RO), Viking
Valley (VV), and Léonie Island (LE) samples.
The dominant phylum in all three studied locations was Bacteroidetes, with a
total of 13 phylotypes, followed by Proteobacteria with 11 phylotypes (8 assigned to
Betaproteobacteria, 2 to Alphaproteobacteria and 1 to the Gammaproteobacteria).
Seven phylotypes were grouped within the Acidobacteria, 3 in each of the
Verrucomicrobia, Cyanobacteria, and the TM7, 2 within the Actinobacteria, and 1 in
the Gemmatimonadetes, Chloroflexi, Firmicutes, and Unclassified Bacteria each. In
general, most of the phyla were observed in all three sites except for Actinobacteria,
Cyanobacteria and Unclassified Bacteria which were missing from Viking Valley. In
turn, Firmicutes phylum was exclusive to VV site whereas Chloroflexi was present in
both Viking Valley and Léonie Island but not in Rothera (Fig. 4.6).
Overall, no significant difference between the classification obtained from RDP
Classifier and the NJ method of all the cloned 16S rDNA sequences was observed.
Clones belonging to phylotype A, which showed close relationship to Gemmatimonas,
0.0
5.0
10.0
15.0
20.0
25.0
30.0
35.0
40.0
45.0
Percen
tag
e o
f se
qu
en
ces
in c
lon
e l
ibra
ry
Observed phyla
RO
VV
LE

CHAPTER 4. RESULTS
63
assembled about 16-18% of all clone libraries, making them the single most dominant
taxa undisputedly.
The Bacteroidetes dominant in all three soil samples were closely related to the
genera Terrimonas (phylotypes F, G and AQ), Ferruginibacter (W and Y), Segetibacter
(AJ), Niabella (K) or Lacibacter (S) of family Chitinophagaceae. In addition,
Phylotypes D and E showed close affiliation to genus Pedobacter belonging to the
family Sphingobacteriaceae. Phylotype B showed 64% similarity to genus
Haliscomenobacter in the family Saprospiraceae, and was prevalent in Rothera Point
and Viking Valley soil but absent from the Léonie Island. For a complete list of
phylogenetic classification of all phylotypes obtained from RDP Classifier, refer to
Table 3S in Appendix D.
Not all phylotypes were able to show considerable similarity to finest taxonomic
levels (in this case, the finest taxonomic resolution was down to genera level). A few
were unable to be assigned to any known phylum; e.g. Phylotype I, which showed 29%
similarity to the Proteobacteria group in RDP Classifier, formed an independent branch
under Unclassified Bacteria in the NJ tree showing moderate affiliation to Fibrobacter
and distant relation to Cytophagales/green sulfur bacterium. Another unclassified
phylotype, phylotype AI showed 43% homology to Chloroflexi group and was clustered
closely with uncultured bacterium clone UMABcl83 and to a lesser extent to uncultured
Chloroflexi bacterium clone T5P2B_22.
CHAPTER 4. RESULTS
64
4.7.3 Statistical analysis
4.7.3.1 Observed number of phylotypes
For a basic estimation of phylotype richness, the observed number of phylotypes
in each clone library was considered as a representative of the original assemblage. The
criterion for phylotype distinction was set by the online program FastGroupII to
consider 97% sequence similarity as one operational taxonomic unit (OTU). The list of
observed phylotypes from duplicate clone libraries regarding each study site was
inspected for similarity and since no significant difference was observed, the results
from each set was pooled together to form one final set for each site.
From the total of 46 observed phylotypes, 15 were shared by all three sites, 3
were exclusive to RO and VV, 5 were observed only in RO and LE, 7 shared by VV
and LE, 2 specific to RO site, 6 occurring only in VV and 8 exclusive to LE. Clone
library corresponding to RO site revealed the least phylotype richness with a total
number of 25 phylotypes whereas VV and LE contained 31 and 35 phylotypes,
respectively (Table 2S, Appendix B).
4.7.3.2 Biodiversity indices
The observed phylotypes and their abundances were used to calculate diversity
indices (Table 4.5). The Shannon diversity index (H’) calculated for the clone libraries
revealed the highest level of diversity in Léonie Island (3.14) which was comparable to
that of Viking Valley (3.09). Rothera Point showed the lowest value (2.93) of the three
sites, indicating a less diverse bacterial community compared to VV and LE. The
calculated value for Fisher’s alpha (estimated number of unseen phylotypes) was also
found to be highest in LE (12.57), followed by VV (10.91) and RO (7.87). However,
Simpson’s diversity (D), equitability (J’), and Berger-Parker evenness indices were
CHAPTER 4. RESULTS
65
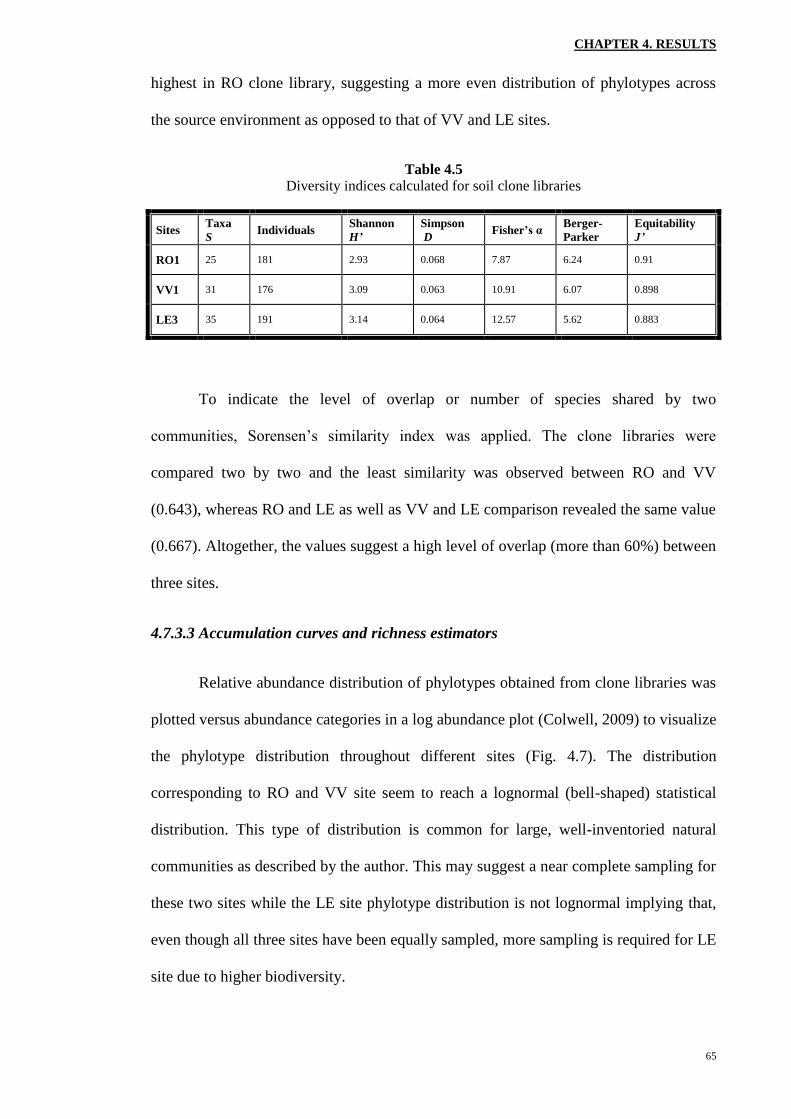
highest in RO clone library, suggesting a more even distribution of phylotypes across
the source environment as opposed to that of VV and LE sites.
Table 4.5 Diversity indices calculated for soil clone libraries
Sites Taxa
S Individuals
Shannon
H’
Simpson
D Fisher’s α
Berger-
Parker
Equitability
J’
RO1 25 181 2.93 0.068 7.87 6.24 0.91
VV1 31 176 3.09 0.063 10.91 6.07 0.898
LE3 35 191 3.14 0.064 12.57 5.62 0.883
To indicate the level of overlap or number of species shared by two
communities, Sorensen’s similarity index was applied. The clone libraries were
compared two by two and the least similarity was observed between RO and VV
(0.643), whereas RO and LE as well as VV and LE comparison revealed the same value
(0.667). Altogether, the values suggest a high level of overlap (more than 60%) between
three sites.
4.7.3.3 Accumulation curves and richness estimators
Relative abundance distribution of phylotypes obtained from clone libraries was
plotted versus abundance categories in a log abundance plot (Colwell, 2009) to visualize
the phylotype distribution throughout different sites (Fig. 4.7). The distribution
corresponding to RO and VV site seem to reach a lognormal (bell-shaped) statistical
distribution. This type of distribution is common for large, well-inventoried natural
communities as described by the author. This may suggest a near complete sampling for
these two sites while the LE site phylotype distribution is not lognormal implying that,
even though all three sites have been equally sampled, more sampling is required for LE
site due to higher biodiversity.

CHAPTER 4. RESULTS
66
Figure 4.7 Log abundance plots of observed phylotypes considering their relative abundance in
each clone library
Another way of assessing sampling effort and whether or not it has been done
exhaustively is by plotting number of phylotypes observed versus number of clones
identified in an accumulation curve (aka collector’s curve) (Kemp & Aller, 2004).
Using the EstimateS software and the data from each clone library (duplicates
combined), the Sobs (Mao Tau) against the number of clones characterized was plotted
for each data set (Fig. 4.8.a). Additionally, Cole Rarefaction curve corresponding to
each data set was plotted against sampling effort for that clone library which was found
to be identical to the accumulation curve for respective samples (data not shown) and
thus analyzed in the same manner.
By looking at the curves separately, it is apparent that the one corresponding to
RO site is reaching an asymptote first. The next curvilinear plot belongs to VV samples
while LE accumulation curve is the last to slowly approach an asymptote. Though when
considering the 95% confidence intervals (data not shown), VV and LE curves overlap
almost entirely, suggesting that the observed difference between the phylotype richness
of these two sites at current sampling effort was due to chance. On the other hand, since
the curve corresponding to LE site is not completely asymptotic yet, the phylotype
0
2
4
6
8
10
12
14
16
1 2-3 4-7 8-15 16-31
Nu
mb
er o
f p
hy
loty
pes
Abundance category
RO
VV
LE
CHAPTER 4. RESULTS
67
richness in the source environment is underestimated and richness estimation must not
be overinterpreted (Kemp and Aller, 2004).
With that in mind, it is perhaps safe to assume that sampling effort for RO site
has been done exhaustively and few additional phylotypes will be recovered by extra
sampling beyond the current library size. On the other hand, more sampling might
reveal more unique phylotypes in either of VV and LE sites with better differentiation
between the two environments (Kemp and Aller, 2004).
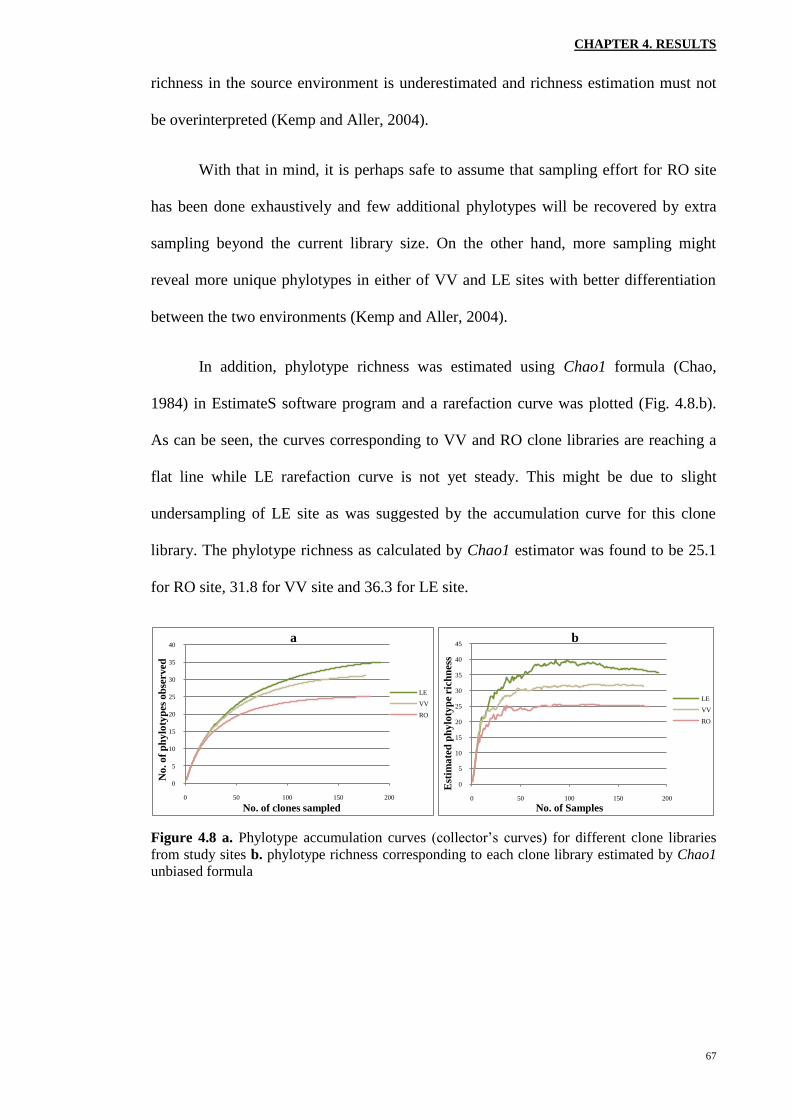
In addition, phylotype richness was estimated using Chao1 formula (Chao,
1984) in EstimateS software program and a rarefaction curve was plotted (Fig. 4.8.b).
As can be seen, the curves corresponding to VV and RO clone libraries are reaching a
flat line while LE rarefaction curve is not yet steady. This might be due to slight
undersampling of LE site as was suggested by the accumulation curve for this clone
library. The phylotype richness as calculated by Chao1 estimator was found to be 25.1
for RO site, 31.8 for VV site and 36.3 for LE site.
Figure 4.8 a. Phylotype accumulation curves (collector’s curves) for different clone libraries
from study sites b. phylotype richness corresponding to each clone library estimated by Chao1
unbiased formula
0
5
10
15
20
25
30
35
40
0 50 100 150 200
No
. o
f p
hy
loty
pes
ob
served
No. of clones sampled
a
LE
VV
RO
0
5
10
15
20
25
30
35
40
45
0 50 100 150 200
Est
ima
ted
ph
ylo
typ
e r
ich
ness
No. of Samples
b
LE
VV
RO
CHAPTER 4. RESULTS
68
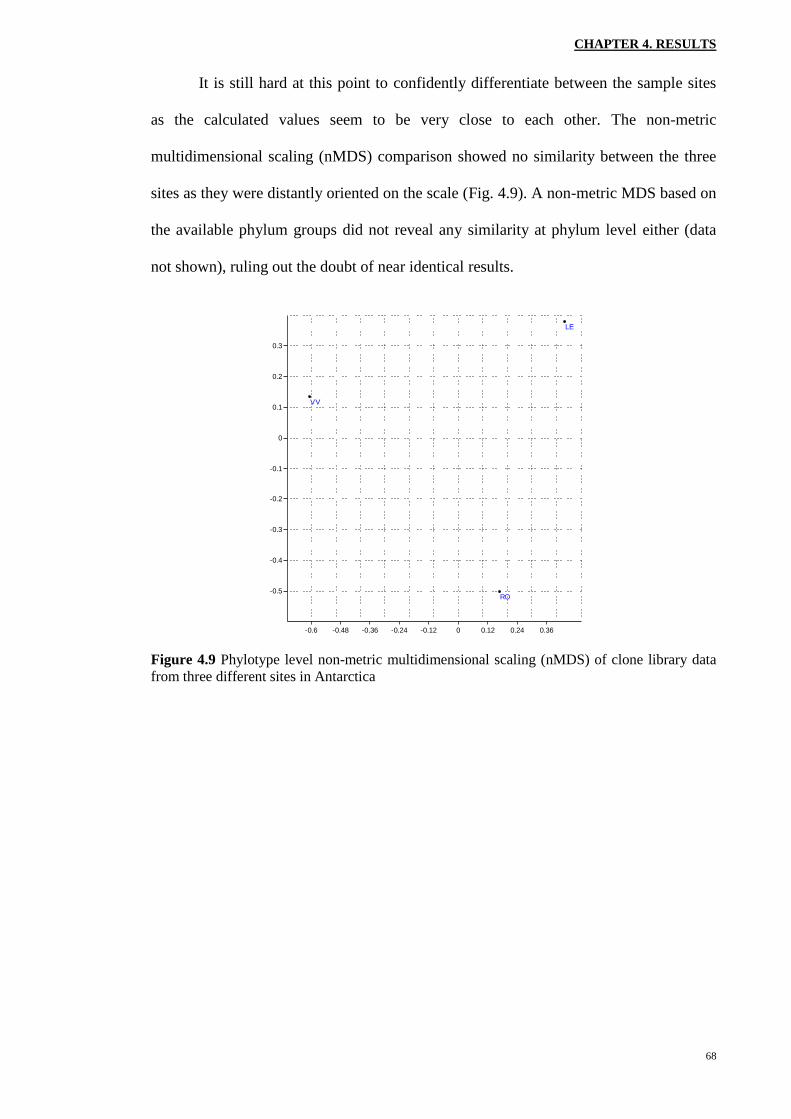
It is still hard at this point to confidently differentiate between the sample sites
as the calculated values seem to be very close to each other. The non-metric
multidimensional scaling (nMDS) comparison showed no similarity between the three
sites as they were distantly oriented on the scale (Fig. 4.9). A non-metric MDS based on
the available phylum groups did not reveal any similarity at phylum level either (data
not shown), ruling out the doubt of near identical results.
Figure 4.9 Phylotype level non-metric multidimensional scaling (nMDS) of clone library data
from three different sites in Antarctica
RO
VV
LE
-0.6 -0.48 -0.36 -0.24 -0.12 0 0.12 0.24 0.36
Coordinate 1
-0.5
-0.4
-0.3
-0.2
-0.1
0
0.1
0.2
0.3
Coord
inate
2