Embed Size (px)
Citation preview
Organochlorine Compounds TMDLs Staff Report
39
4.0 SOURCE ANALYSIS AND EXISTING LOADS
This section describes point, nonpoint, and background sources of legacy pesticides and PCBs in the Newport Bay/San Diego Creek watershed. Pollutant reservoirs (sources) and potential pathways by which these contaminants can enter receiving waters are shown below in a conceptual model of the watershed (Figure 4-1). 4.1 Physicochemical Properties and Historic Uses The physical and chemical properties of the organochlorine pollutants influence their fate and transport in the environment. Some of the properties that are common to all of the OC pollutants include the following:
• They are persistent in the environment and resistant to degradation, with half-lives on the order of decades;
• They have low water solubility (i.e., hydrophobic), with high log Kow; • They are primarily associated with organic matter and fine sediments, and
do not tend to migrate into ground water; • They are semivolatile, with potential for volatilization from soils decreasing
with increasing sorption to particulates and mixing in the soil; • They bioaccumulate in the fatty tissues of biological organisms.
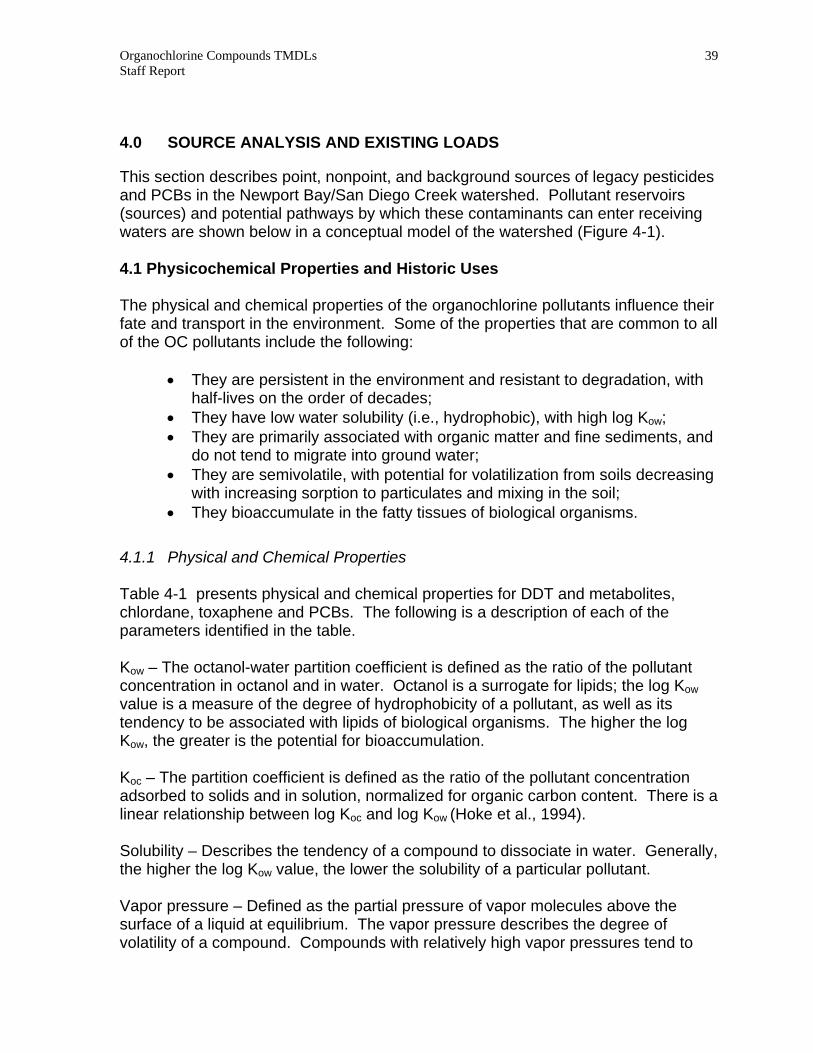
4.1.1 Physical and Chemical Properties Table 4-1 presents physical and chemical properties for DDT and metabolites, chlordane, toxaphene and PCBs. The following is a description of each of the parameters identified in the table. Kow – The octanol-water partition coefficient is defined as the ratio of the pollutant concentration in octanol and in water. Octanol is a surrogate for lipids; the log Kow value is a measure of the degree of hydrophobicity of a pollutant, as well as its tendency to be associated with lipids of biological organisms. The higher the log Kow, the greater is the potential for bioaccumulation. Koc – The partition coefficient is defined as the ratio of the pollutant concentration adsorbed to solids and in solution, normalized for organic carbon content. There is a linear relationship between log Koc and log Kow (Hoke et al., 1994). Solubility – Describes the tendency of a compound to dissociate in water. Generally, the higher the log Kow value, the lower the solubility of a particular pollutant. Vapor pressure – Defined as the partial pressure of vapor molecules above the surface of a liquid at equilibrium. The vapor pressure describes the degree of volatility of a compound. Compounds with relatively high vapor pressures tend to
Organochlorine Compounds TMDLs Staff Report
40
Table 4-1 Physical and Chemical Properties of Organochlorine Pesticides and PCBs.
Pollutant
Molecular
Weight
Log Kow
Log Koc
a
BCFk
Solubility
Vapor Pressure
Henry’s Law Constantl
(atm·m3 mole-1) p,p’-DDT p,p’-DDE p,p’-DDD
354.5 319 321
6.610c
6.956d
6.217e
6.498 6.838 6.111
363,000
<1.2 ppb – 25 ppb (pp’-DDT) 26-85 ppb (op’-DDT)b
1.9 x 10⁻⁷ mmHgb
at 25° C (pp’) 5.5 x 10⁻⁶ mmHg at 30° C (op’)
8.10E-06 2.10E-05 4.00E-06
Chlordane
409.8
6.32e
6.21
37,800
1.850 ppm f
2.2 x 10⁻⁵ mgHg (cis; supercooled liquid) 2.9 x 10⁻⁵mmHg (trans; super-cooled liquid)f
4.86E-05
Toxaphene
414
5.5h
5.4
52,000
6.00E-06
PCBs
200.7-453
6.261i
6.15
270,000
2.7 – 250 ppb, for various Aroclorsj
4.06 x 10⁻⁴ mmHg to 4.05 x 10⁻⁵ mmHg, for various Aroclorsj
4.0E-04
a Log Koc values were calculated from log Kow values, using the equation from Hoke et al. (1994) Log Koc = 0.00028 – log Kow(0.983)
b Solubility and vapor pressure values from Ambient Water Quality Criteria for DDT (USEPA, 1980) c Mean of two values cited in USGS (2001): one value from de Bruijn et al. (1989) and one value from Brooke et al. (1990) d USGS (2001) from de Bruijn et al. (1989) e from de Bruijn et al. (1989) f Solubility and vapor pressure values from Toxicological Profile for Chlordane (U.S. Department of Health and Human Services (1994) h “Southerland” EPA Report i Mean of 20 congener values cited for PCBs in de Bruijn et al. (1989) j Solubility and vapor pressure values from Ambient Water Quality Criteria for Polychlorinated Biphenyls (USEPA, 1980) k BCF value for DDT from EPA Ambient Water Quality Criteria – DDT (Common Shiner – Notropis cornutus); for chlordane from EPA Ambient Water Quality Criteria – Chlordane (fat head minnow – Pimephales promelas); for PCBs from EPA Ambient Water Quality Criteria – PCB (Aroclor 1260 – fathead minnow [female] – Pimephales promelas); for toxaphene from EPA Bioaccumulation Testing and Interpretation for the Purpose of Sediment Quality Assessment – fathead minnow (Pimephales promelas) l from Syracuse Research Corporation, http://www.syrres.com/esc/chemfate.htm; except PCBs from Burkhard et al., 1985
Organochlorine Compounds TMDLs Staff Report
41
readily evaporate. For comparison, the vapor pressure of water at 25°C is 23.8 mmHg. BCF – The Bioconcentration Factor is defined as the ratio of the concentration of a pollutant in the tissues of an organism to the concentration in water, at equilibrium. It describes the potential for an organism to bioaccumulate a pollutant when the only mode of entry into that organism is via absorption from water. 4.1.2 Historical Uses and Environmental Fate Because the OC pesticides and PCBs are no longer being actively used in the watershed and there is no record of historic pesticide applications, the following discussion is primarily qualitative. Information for each pollutant was largely obtained from the Toxicological Profiles developed by the U.S. Department of Health and Human Services, Public Health Service, Agency for Toxic Substances and Disease Registry (ATSDR). DDT. The use of DDT (2,2-bis(p-chlorophenyl)-1,1,1-trichloroethane) began in the 1930s to control disease-causing insects and agricultural pests. Its use peaked in the early 1960s when it was used in over 300 agricultural commodities. In California, DDT uses included agricultural and urban pest control (see Table 4.2; Mischke et al., 1985); specific uses and application rates in the San Diego Creek-Newport Bay watershed are not known. Because of its adverse environmental effects, USEPA banned all uses in 1972, except for control of emergency public health problems. Technical grade DDT is a mixture of isomers: predominantly p,p’-DDT and o,p’-DDT. DDT is persistent in the environment, with a reported half-life of as long as 30 years (ATSDR, 2002). DDT degrades primarily to DDE under aerobic conditions and to dichlorodiphenyldichloroethane (DDD) in anaerobic conditions. Microbial dehydrodechlorination of DDD produces 1-chloro-2,2-bis(4-chlorophenyl)ethylene (DDMU), a key biomarker for in situ biodegradation (Masters and Inman, 2002). Currently, the primary route of exposure to humans is via dietary intake. Produce contaminated with DDT may originate in countries outside of the U.S. where DDT is still being actively used, or DDT species may be present in fish. DDT concentrations in the atmosphere are not considered to be high enough to pose a substantial human health risk (ATSDR, 2002). Human health effects that have been attributed to DDT include nervous system dysfunction, reproductive effects due to the estrogen-like properties of DDT, hepatic effects and cancer. Adverse biological effects of DDT to plants and wildlife have been well-documented, and are summarized in reports from the National Irrigation and Water Quality Program (NIWQP, 1998) and USEPA (2000). The NIWQP report cites reduced growth and unusual morphology in the green alga, Chlorella, at a DDT concentration
Organochlorine Compounds TMDLs Staff Report
42
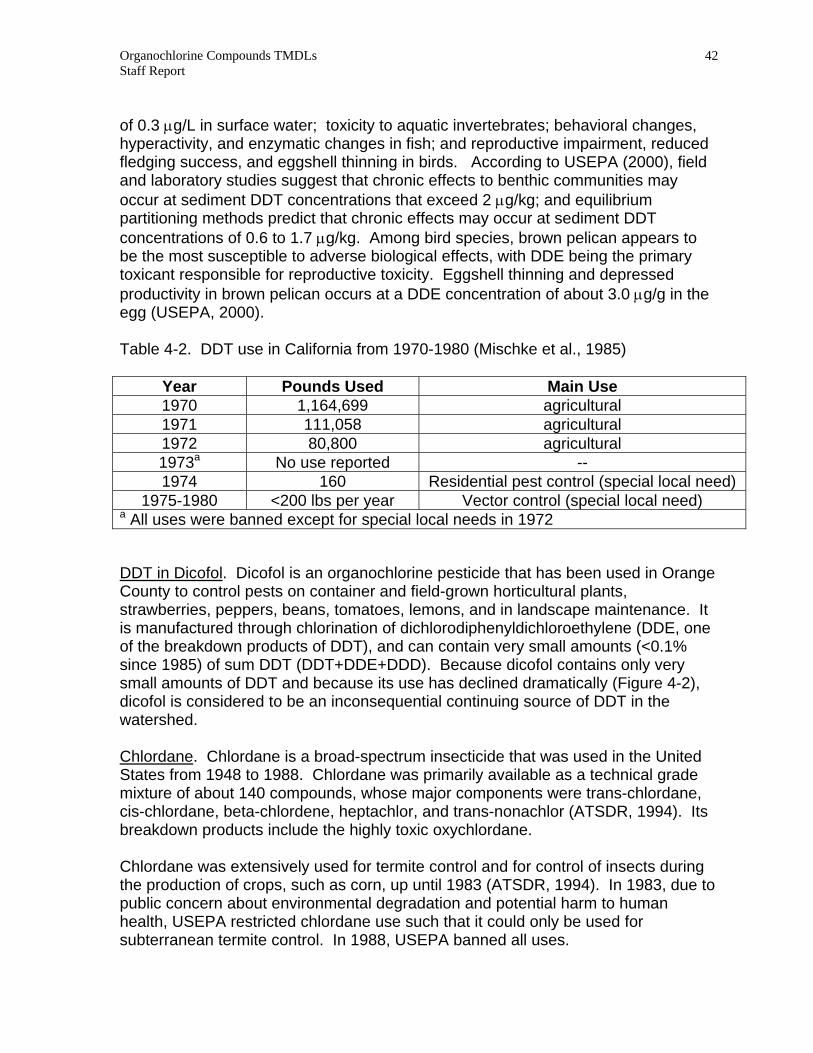
of 0.3 μg/L in surface water; toxicity to aquatic invertebrates; behavioral changes, hyperactivity, and enzymatic changes in fish; and reproductive impairment, reduced fledging success, and eggshell thinning in birds. According to USEPA (2000), field and laboratory studies suggest that chronic effects to benthic communities may occur at sediment DDT concentrations that exceed 2 μg/kg; and equilibrium partitioning methods predict that chronic effects may occur at sediment DDT concentrations of 0.6 to 1.7 μg/kg. Among bird species, brown pelican appears to be the most susceptible to adverse biological effects, with DDE being the primary toxicant responsible for reproductive toxicity. Eggshell thinning and depressed productivity in brown pelican occurs at a DDE concentration of about 3.0 μg/g in the egg (USEPA, 2000). Table 4-2. DDT use in California from 1970-1980 (Mischke et al., 1985)
Year Pounds Used Main Use 1970 1,164,699 agricultural 1971 111,058 agricultural 1972 80,800 agricultural 1973a No use reported -- 1974 160 Residential pest control (special local need)
1975-1980 <200 lbs per year Vector control (special local need) a All uses were banned except for special local needs in 1972
DDT in Dicofol. Dicofol is an organochlorine pesticide that has been used in Orange County to control pests on container and field-grown horticultural plants, strawberries, peppers, beans, tomatoes, lemons, and in landscape maintenance. It is manufactured through chlorination of dichlorodiphenyldichloroethylene (DDE, one of the breakdown products of DDT), and can contain very small amounts (<0.1% since 1985) of sum DDT (DDT+DDE+DDD). Because dicofol contains only very small amounts of DDT and because its use has declined dramatically (Figure 4-2), dicofol is considered to be an inconsequential continuing source of DDT in the watershed. Chlordane. Chlordane is a broad-spectrum insecticide that was used in the United States from 1948 to 1988. Chlordane was primarily available as a technical grade mixture of about 140 compounds, whose major components were trans-chlordane, cis-chlordane, beta-chlordene, heptachlor, and trans-nonachlor (ATSDR, 1994). Its breakdown products include the highly toxic oxychlordane. Chlordane was extensively used for termite control and for control of insects during the production of crops, such as corn, up until 1983 (ATSDR, 1994). In 1983, due to public concern about environmental degradation and potential harm to human health, USEPA restricted chlordane use such that it could only be used for subterranean termite control. In 1988, USEPA banned all uses.
Organochlorine Compounds TMDLs Staff Report
43
Chlordane volatilizes from both soil and water. In soils, volatization rates are greater in coarse textured soils with low organic matter content, compared to clayey soils with high organic matter content. Residual chlordane can remain in soils, however, for as long as 20 years after application. In lakes, streams, and embayments, chlordane will partition to bed sediments or suspended particulates; the extent of partitioning is correlated with organic carbon content. Chlordane bioaccumulates in freshwater and marine aquatic life, and biomagnifies in predator species. It is taken up from both water and sediment by aquatic vascular plants (ATSDR, 1994). Like the other OCs, chlordane may be transported long distances in the atmosphere, either in the vapor phase or adsorbed to airborne particulates, and then deposited via wet or dry deposition. In the vapor phase, chlordane degrades by photolysis and hydroxyl radical reaction. Toxaphene. Toxaphene is a complex mixture of about 670 chlorinated compounds, or congeners (67-69% chlorine by weight), and is produced by reacting chlorine gas with camphene. In 1972, toxaphene was the most heavily manufactured insecticide in the United States, with a production of 23,000 tons (ATSDR, 1996). Global use between 1950-1993 has been estimated to be greater than 1.3 million tons. It was one of the most heavily used insecticides in the United States until 1982, when it was banned for most uses. All uses were banned in 1990. Toxaphene has been used as an insecticide in the production of cotton, corn, fruit, vegetables, and small grains. Because it is not phytotoxic, has low toxicity to bees and is persistent, it was desirable for treating flowering plants. It was also used to control parasites on livestock and to eradicate fish in lakes and streams. Toxaphene was often mixed with other pesticides because toxaphene solutions apparently helped solubilize other hydrophobic insecticides; it was frequently applied with DDT (ATSDR, 1996). Under anaerobic conditions, toxaphene is biotransformed rapidly in soils and sediments, with a half-life on the order of weeks to months (ATSDR, 1996). However, under aerobic conditions, toxaphene is relatively resistant to biotransformation, with a half-life on the order of years. Toxaphene strongly sorbs to soils and will persist for long periods of time. Erosion of soils from lands that previously received applications of toxaphene can lead to receiving water inputs of toxaphene (and other pollutants) sorbed to particulates. Toxaphene can volatilize to the atmosphere following releases to water or soil and long-distance atmospheric transport has been documented at a number of locations, including the Great Lakes. It is known to bioconcentrate in aquatic organisms and biomagnify in food webs, although food web biomagnification is not as dramatic as with DDT (ATSDR, 1996). It has been difficult to evaluate the fate and transport of toxaphene because of its chemical complexity. Each of its more than 670 components varies in vapor pressure and potential for degradation. Consequently, toxaphene breakdown products found in waters and/or aquatic life may differ dramatically from the technical toxaphene originally applied to soils or waters.
Organochlorine Compounds TMDLs Staff Report
44
PCBs. Polychlorinated biphenyls (PCBs) are a class of chemical compounds in which between 2 and 10 chlorine atoms are attached to a biphenyl molecule. There are up to 209 possible compounds depending on degree of chlorination, and these compounds are referred to as congeners. PCBs are categorized based on degree of chlorination; all PCB compounds containing the same degree of chlorination are referred to as homologs. Homologs can have varying substitution patterns (e.g., substitutions on meta-, ortho-, and para- positions in the molecule), and these are referred to as isomers (ATSDR, 2000). The two benzene rings in the PCB structure can rotate about the bond that connects them in two extreme configurations: the two benzene rings can be planar; that is, occurring in the same plane. Or, the benzene rings can be coplanar; that is, at a 90º angle to each other. Between 1930 and 1977, the Monsanto Corporation was the major manufacturer of PCBs and marketed various PCB mixtures under the trade name Aroclor. Aroclors can be identified by their 4-digit numbering code. The first two numbers of the code describe the type of mixture, and the last two digits indicate the approximate percentage of chlorine by weight. For example, Aroclor 1242 is a chlorinated biphenyl mixture with varying amounts of mono- through heptachlorinated homologs, with an average chlorine content of 42% (ATSDR, 2000). An important property of PCBs is their general inertness: they resist both acids and alkalis and have thermal stability. This made them useful in a wide variety of applications, including dielectric fluids in transformers and capacitors, heat transfer fluids, and lubricants. In general, PCBs are relatively insoluble in water and the solubility decreases with increasing chlorination. PCBs, however, are readily soluble in nonpolar organic solvents and in biological lipids. Photolysis is the more significant process of degradation than hydrolysis or oxidation. Degradation can occur under both aerobic and anaerobic conditions. The greater the chlorine content of the PCB, the longer the half-life, ranging from days to years.
Although it is now illegal to manufacture, distribute, or use PCBs, these synthetic oils were extensively used for many years as insulating fluids in electrical transformers and in other products, such as cutting oils. In 1976, the manufacture of PCBs was prohibited because of evidence they build up in the environment and can cause harmful health effects. Products made before 1977 that may contain PCBs include old fluorescent lighting fixtures and electrical devices containing PCB capacitors, and old microscope and hydraulic oils. Historically, PCBs have been introduced into the environment through discharges from point sources and through spills and accidental releases. Although point source contributions are now controlled, nonpoint sources may still exist. For example, refuse sites, abandoned facilities, and electrical transformers may still contribute PCBs to the environment. PCBs can volatilize from both soil and water; in the atmosphere, they can occur in the vapor phase or be sorbed to particulates. They are globally redistributed via
Organochlorine Compounds TMDLs Staff Report
45
atmospheric transport. Biphenyls with 1-4 chlorine atoms tend to migrate toward polar latitudes, those with 4-8 chlorine atoms tend remain in mid-latitudes, and higher chlorinated PCBs tend to stay near the contamination source (ATSDR, 2000). From the water column, PCBs may partition to sediments or be volatilized; higher chlorinated PCBs tend to be adsorbed, while lower chlorinated PCBs are more readily volatilized. Biologic organisms can accumulate PCBs in their lipids and levels of PCBs in organisms can biomagnify within a foodweb, depending on the congener and lipid content of the organism. Consumption of PCB-contaminated fish is a major pathway for human exposure. Human health effects that have been reported due to PCB exposure include liver, thyroid, dermal and ocular changes, immunological alterations, neurodevelopmental changes, reduced birth weight, reproductive toxicity, and cancer (ATSDR, 2000). 4.2 Sources The organochlorine pollutants are no longer being actively used and all sources are related to historic applications of organochlorine pesticides and releases of PCBs. Therefore, this source analysis will be primarily qualitative. Monitoring data show that a “reservoir” of historically-deposited organochlorine compounds exists in terrestrial soils and that erosion of these soils continues to contribute low levels of contaminants to San Diego Creek and Newport Bay. Once contaminated sediments enter Newport Bay, tidal action influences pollutant spatial distribution. Historic uses of the organochlorine pesticides were predominantly urban and agricultural (see above discussion). Their high log Kow values predict that they have low water solubility, and, therefore, will be associated predominantly with fine, organic-rich particulates and largely confined to surface soils (i.e., will not migrate to ground water). Soils to which these pollutants were applied in the past and that have been exposed and subjected to erosion in the watershed are believed to be primary sources. Masters and Inman (2002) hypothesized that the source of pesticide-contaminated sediments into San Diego Creek and ultimately Newport Bay was from soils that were eroded from agricultural operations and urban areas. The predominant urban source is most likely active construction sites. Construction activities in the watershed expose soils that were previously associated with agricultural land use, while developed lands have a large percentage of impervious surfaces and landscaping that reduces the potential for erosion and sedimentation. Releases of PCBs in the watershed have occurred on the El Toro and Tustin military bases, and also possibly as the result of industrial activities in proximity to the Rhine Channel. (TMDLs for the Rhine Channel are being developed independently of those for Upper and Lower Newport Bay.) The following paragraphs describe, in qualitative terms, the relative contribution of point sources, nonpoint sources, and background loading. To further elucidate
Organochlorine Compounds TMDLs Staff Report
46
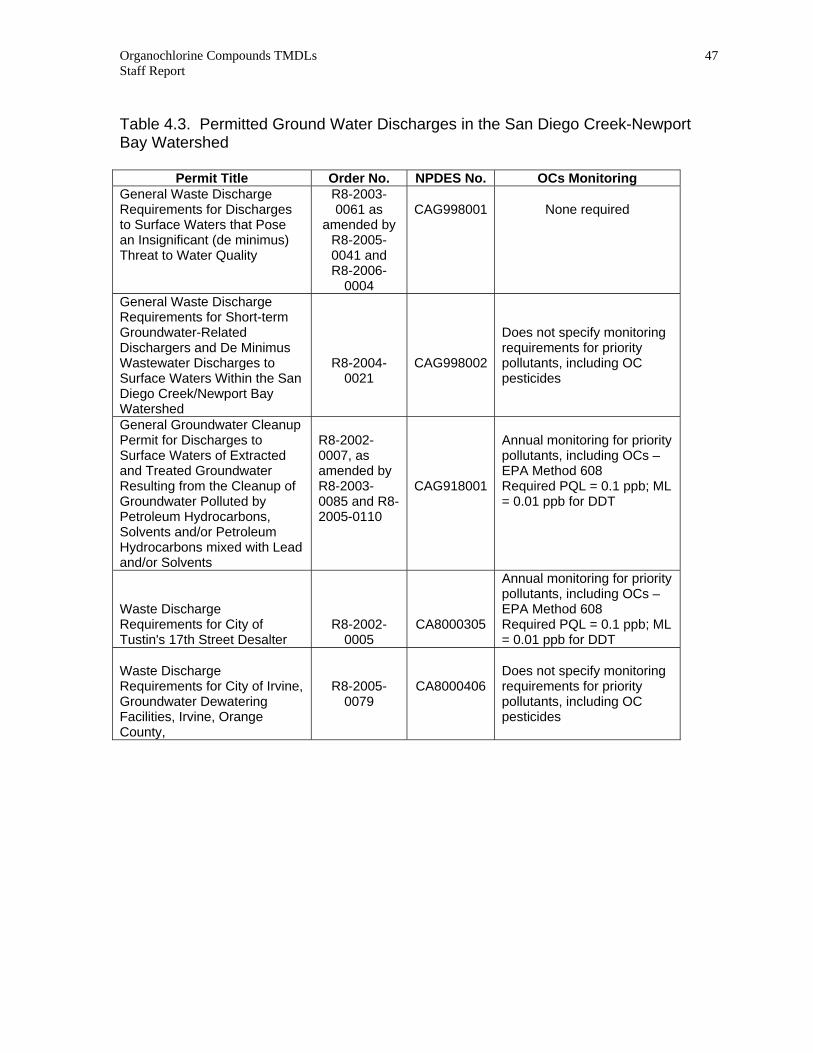
sources, two studies are being conducted by the County of Orange and the Southern California Water Research Project (SCCWRP) that should lead to a better understanding of the relative pollutant contributions from different land uses. 4.2.1 Point Sources Storm Sewer Discharges. Apart from sewered sanitary waste discharges, all discharges from urbanized areas in the watershed eventually enter the municipal separate storm sewer system (MS4). Discharges from the MS4 are considered to be point source discharges, but they include nonpoint source discharges that originate from agricultural operations and open space. A National Pollutant Discharge Elimination System (NPDES) permit (the MS4 Permit) regulates discharges from the MS4; the County of Orange is the primary permittee and the incorporated cities in the watershed are co-permittees under the permit. The MS4 permit currently requires annual monitoring of storm water and semi-annual monitoring of sediments in San Diego Creek (and tributaries) and Newport Bay. OC pollutant concentrations measured in sediments as part of the storm water monitoring program (1995-2004), are shown in Appendix A. Average total DDT concentrations (1995-2004) at about 18 monitoring locations in San Diego Creek and tributaries are shown in Figure 4-3. Total DDT concentrations in sediments from San Diego Creek and its tributaries varied by year, ranging from nondetectable concentrations to 480 ppb dry weight (Lane Channel in 1996); chlordane concentrations were as high as 20 ppb dry weight (Agua Chinon Wash in 2002, San Diego Creek at Campus Drive in 2002). These data suggest that substantial discharges of the legacy pollutants may still be occurring into the MS4. Groundwater Dewatering and Remediation. Groundwater discharges to surface waters that result from dewatering and pollutant remediation operations in the watershed are regulated under waste discharge requirements (WDRs) and NPDES permits. Relevant permits and their requirements for monitoring for OC pollutants are listed in Table 4.3. No monitoring data for the OC pesticides or PCBs were available from the permitted ground water discharge records. However, other ground water monitoring has shown that OC pesticides are present. For example, results of ground water monitoring performed in January 2006 in support of the City of Irvine’s Lane Channel improvement project, showed total DDT concentrations in ground water ranging from nondetectable to 0.021 μg/L, exceeding the CTR chronic criterion for DDT of 0.001 μg/L. None of the other OC pesticides or PCBs were detected in ground water. Because rising ground water in San Diego Creek and some tributaries enters the storm drain channels, creeks and channels via leaky pipes, weep holes and other avenues, ground water could be a substantial source of OCs loading to San Diego Creek and Newport Bay, even if the OCs are present in very low concentrations.
Organochlorine Compounds TMDLs Staff Report
47
Table 4.3. Permitted Ground Water Discharges in the San Diego Creek-Newport Bay Watershed
Permit Title Order No. NPDES No. OCs Monitoring General Waste Discharge Requirements for Discharges to Surface Waters that Pose an Insignificant (de minimus) Threat to Water Quality
R8-2003-0061 as
amended by R8-2005-0041 and R8-2006-
0004
CAG998001
None required
General Waste Discharge Requirements for Short-term Groundwater-Related Dischargers and De Minimus Wastewater Discharges to Surface Waters Within the San Diego Creek/Newport Bay Watershed
R8-2004-0021
CAG998002
Does not specify monitoring requirements for priority pollutants, including OC pesticides
General Groundwater Cleanup Permit for Discharges to Surface Waters of Extracted and Treated Groundwater Resulting from the Cleanup of Groundwater Polluted by Petroleum Hydrocarbons, Solvents and/or Petroleum Hydrocarbons mixed with Lead and/or Solvents
R8-2002-0007, as amended by R8-2003-0085 and R8-2005-0110
CAG918001
Annual monitoring for priority pollutants, including OCs – EPA Method 608 Required PQL = 0.1 ppb; ML = 0.01 ppb for DDT
Waste Discharge Requirements for City of Tustin's 17th Street Desalter
R8-2002-0005
CA8000305
Annual monitoring for priority pollutants, including OCs – EPA Method 608 Required PQL = 0.1 ppb; ML = 0.01 ppb for DDT
Waste Discharge Requirements for City of Irvine, Groundwater Dewatering Facilities, Irvine, Orange County,
R8-2005-0079
CA8000406
Does not specify monitoring requirements for priority pollutants, including OC pesticides
Organochlorine Compounds TMDLs Staff Report
48
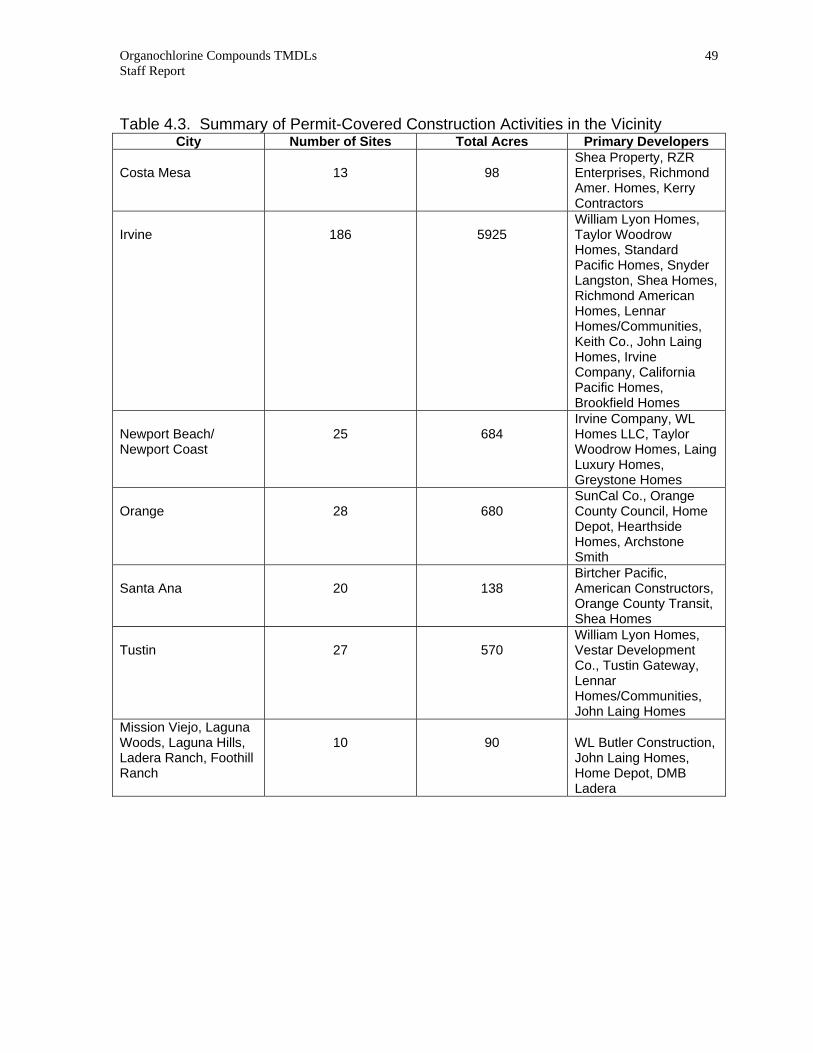
Ground water as a potential continuing source of OC pesticides and PCBs will be evaluated during implementation of these TMDLs. Discharges from Roadways. Discharges from highways would be expected to be associated primarily with construction activities within Caltrans rights-of-way, if organochlorine pesticides/PCBs were previously applied/spilled to soils in those areas. Storm water and nonstorm water discharges from areas under Caltrans jurisdiction are regulated through a NPDES permit. Data were not available to quantify loading from this source. Construction Activities. Construction discharges have the potential to carry sediment-bound, legacy pesticides because most construction activities in the watershed occur on land that was previously in agricultural uses. Erosion and sedimentation from construction sites can be substantial, as grading and other earth-moving activities can expose large areas of soil that are subject to erosion and transport off-site during large storm events. Order No. 99-08-DWQ, NPDES General Permit No. CAS000002, Waste Discharge Requirements (WDRs) for Discharges of Storm Water Runoff Associated with Construction Activity (the General Permit), regulates storm water and non-storm water discharges from construction sites. This statewide general permit requires that best management practices (BMPs) be implemented that use best available technology economically achievable (i.e., BAT/BCT standard) to achieve an effective combination of erosion and sediment control; however, during extremely intense storms or storms of long duration, routine BMPs are not always effective in controlling sediment discharges. For example, in 2005, Regional Board staff issued Notices of Violation (NOVs) for lack of an effective combination of erosion and sediment controls and other violations of the General Permit at two large construction sites in the City of Irvine. The NOVs stated that because of inadequate BMPs, sediment-laden storm water flowed into the storm drain system and adjacent drainages. Because these sites are being developed on lands previously in agricultural land use, it is likely that the transported sediments carried with them a certain amount of adsorbed legacy OC pesticides. According to the State’s database of construction activities covered under the General Permit as of February 2006, there are up to 8185 acres of land currently under construction in the watershed and vicinity (Table 4.3); this number is probably somewhat high since only portions of some cities where construction activities are taking place are in the Newport Bay/San Diego Creek watershed.
Organochlorine Compounds TMDLs Staff Report
49
Table 4.3. Summary of Permit-Covered Construction Activities in the Vicinity City Number of Sites Total Acres Primary Developers
Costa Mesa
13
98
Shea Property, RZR Enterprises, Richmond Amer. Homes, Kerry Contractors
Irvine
186
5925
William Lyon Homes, Taylor Woodrow Homes, Standard Pacific Homes, Snyder Langston, Shea Homes, Richmond American Homes, Lennar Homes/Communities, Keith Co., John Laing Homes, Irvine Company, California Pacific Homes, Brookfield Homes
Newport Beach/ Newport Coast
25
684
Irvine Company, WL Homes LLC, Taylor Woodrow Homes, Laing Luxury Homes, Greystone Homes
Orange
28
680
SunCal Co., Orange County Council, Home Depot, Hearthside Homes, Archstone Smith
Santa Ana
20
138
Birtcher Pacific, American Constructors, Orange County Transit, Shea Homes
Tustin
27
570
William Lyon Homes, Vestar Development Co., Tustin Gateway, Lennar Homes/Communities, John Laing Homes
Mission Viejo, Laguna Woods, Laguna Hills, Ladera Ranch, Foothill Ranch
10
90
WL Butler Construction, John Laing Homes, Home Depot, DMB Ladera
Organochlorine Compounds TMDLs Staff Report
50
Historic Spills/Military Base Cleanup. PCBs loading to San Diego Creek and Newport Bay may include PCBs originating from spills that occurred on the former Marine Corps Air Station (MCAS) Tustin and MCAS El Toro. Both bases have been closed and re-use plans include residential and commercial development. MCAS El Toro This 4,471-acre military base was originally commissioned in 1943 as a Marine Corps pilot fleet operation training facility (Bechtel National, Inc., 1997). It was later a master jet station and center for aviation on the west coast, and supported the operations and combat readiness of Pacific Fleet Marine Forces. Activities on the base included aircraft maintenance and repair. Pollutants generated by these activities included construction debris, municipal waste, batteries, waste oils, hydraulic fluids, paint residues, transformers, and waste solvents. In 1990, the base was listed on the National Priorities List under CERCLA (Superfund), and pollutants of concern included OC pesticides and PCBs. The MCAS El Toro marine base was closed in 1999. Site assessments identified a total of 1,032 environmental locations of concern (LOCs) on the base, 117 of which required further action. An LOC is any identified location that may be contaminated or is a potential source of contamination, based on activities that are known to have occurred at the site. LOCs are identified during the site assessment/remedial investigation by several means, including but not limited to, anomalies on aerial photographs, records of locations of storage tanks, pesticide and PCB storage areas, and areas with PCB transformers. Directed site investigations identify potential release locations (PRLs) and installation restoration program (IRP) sites. Within the areas of concern on the base, there were 124 PCB transformers, 2 PCB storage areas, and 2 pesticide storage areas. PCB transformers were removed or replaced in 1997. Remediation and achievement of target cleanup goals for PCBs in soils were finalized in 2005. Remediation of PCB-contaminated soil involved soil removal at PCB spill sites and former storage areas. For example, at one site (Site 11) 560 tons of contaminated soil were recently removed and disposed of at the Kettleman Hills Disposal Facility. Prior to remediation, the maximum PCB (Aroclor 1260) concentration in one composite sample of soil was 5.2 ppm (Accord Engineering, Inc. and Earth Tech, Inc., 2005). Two known PCB spill sites were within about 1000 feet of Bee Canyon Wash or Agua Chinon Wash; in the past, the sites may have contributed PCBs to surface waters if erosion of contaminated soils occurred. It should be noted that remediation goals in soils may be much higher than TMDL sediment targets. For example, according to USEPA Region 9 PRG Tables (2004), the preliminary remediation goal (PRG) for PCBs in residential soils (noncancer risk; unspecified mixture, low risk, e.g. Aroclor 1016), is 3.9 ppm; the PCB sediment target for San Diego Creek, on the other hand, is about 34 ppb, two orders of magnitude lower than the PRG. This implies that if erosion and sediment transport to surface waters from remediated spill sites occur, the residual pollutant
Organochlorine Compounds TMDLs Staff Report
51
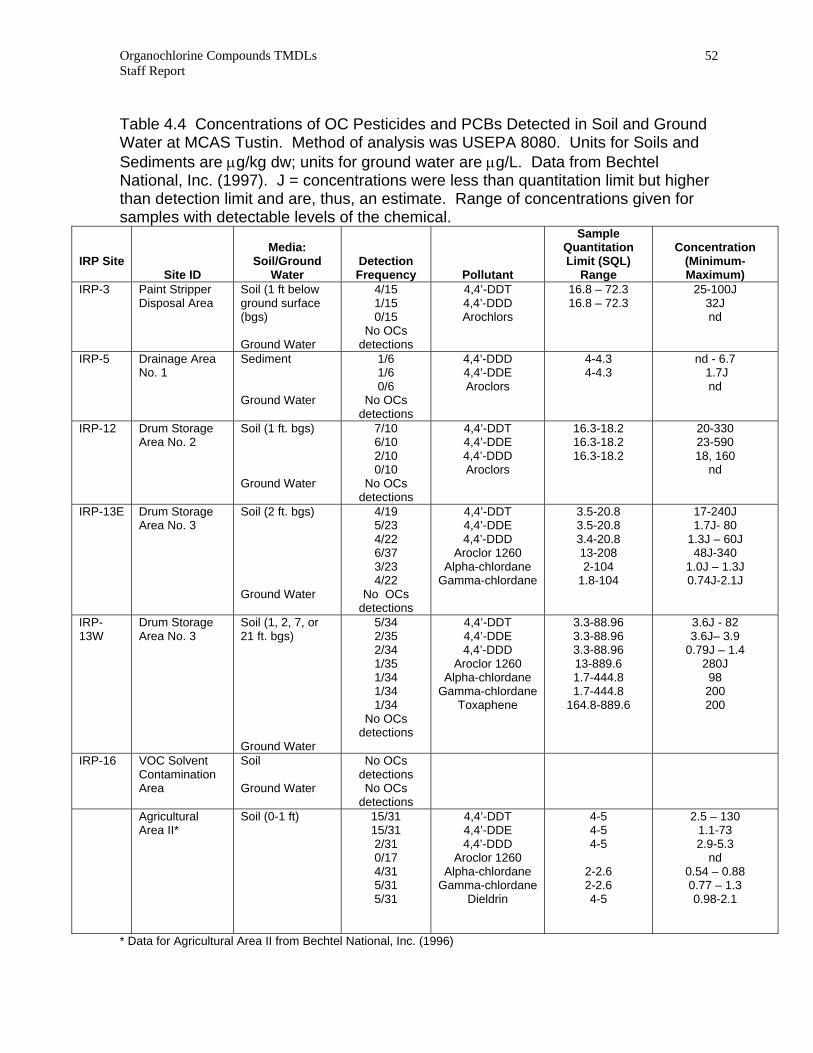
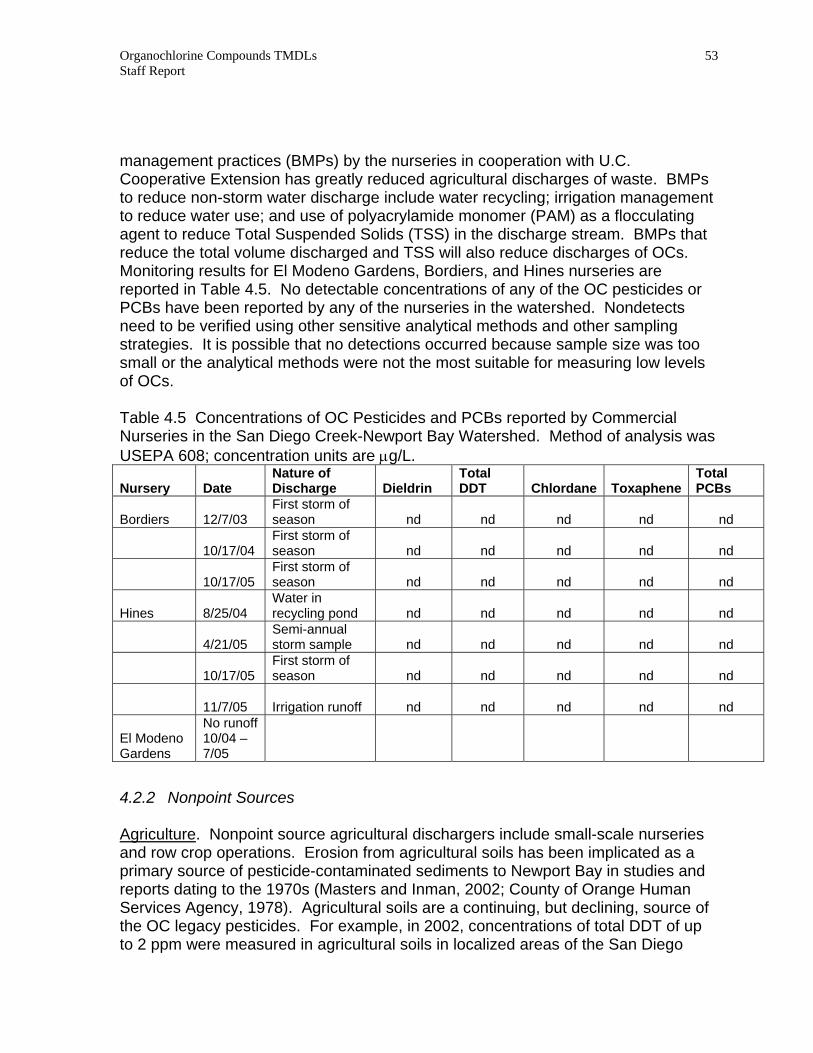
concentrations in discharged sediments may be high enough to pose a substantial threat to water quality, even after cleanup goals for particular sites have been met. MCAS Tustin. The 1600-acre MCAS Tustin was initially established as a Navy Lighter-than-Air (LTA) base to support blimp patrols for submarines off the California Coast during World War II (Bechtel National, Inc., 1997). Base operations were supported by more than 200 structures, including a 3000-foot long runway, aircraft parking aprons, and aircraft maintenance shops. About 530 acres of land on the base were leased for commercial farming. In 1997, the base supported about 4,000 active duty military and civilian personnel whose responsibilities included maintaining the operation of 12 helicopter squadrons, totaling 170 rotary-wing aircraft. Six Installation Restoration Program (IRP) sites (i.e., sites with known contamination) were identified on the base during various site investigations. The primary contaminants at the sites were diesel fuel, oils, lubricants, cleaning solvents, gasoline, paint stripper, battery acids. Table 4.4, below, summarizes the magnitude of OC pesticides and PCBs in soil and ground water that were reported by Bechtel National, Inc. (1997) in their Draft Final Remedial Investigation Report. No further action recommendations, in terms of OC pesticides or PCBs, were made for soils on IRP-3, IRP-5, IRP-12, IRP-13E, and IRP-16; thus, the levels shown in Table 4-4 reflect a reservoir of OC pollutants that likely exists at these sites and that may become mobilized as the sites are developed for urban uses. For example, total DDT concentrations at site IRP-12, a no further action site, are about 1 ppm in some locations. If soils are eroded and discharged to surface waters from this site, adverse impacts to water quality may occur. PCB cleanup at IRP-13W was required since PCB (Aroclor 1260) concentration at a depth of 6 inches was as high as 13 ppm. In 1997, soil in a 220 x 80 foot area was excavated to a depth of 2 feet and disposed of. Clean-up of all contaminated PCB sites at MCAS Tustin has been completed, target goals achieved, and ownership of the sites transferred. Again, cleanup goals are risk-based concentrations that are developed by conducting site-specific, human health and wildlife risk assessments. The goals do not consider human health or ecological impacts that could occur if soils are eroded and transported to surface waters. No other PCB spills in the San Diego Creek watershed are known to have occurred other than those reported at these military bases. Both former military bases, including former agricultural areas on MCAS Tustin, are currently being developed for commercial and residential urban uses. Commercial Nursery Production. Commercial nursery production is the primary agricultural operation remaining in the watershed. Discharges from four large nurseries in the watershed are regulated by Waste Discharge Requirements (WDRs) and are managed as point source dischargers. Implementation of effective best
Organochlorine Compounds TMDLs Staff Report
52
Table 4.4 Concentrations of OC Pesticides and PCBs Detected in Soil and Ground Water at MCAS Tustin. Method of analysis was USEPA 8080. Units for Soils and Sediments are μg/kg dw; units for ground water are μg/L. Data from Bechtel National, Inc. (1997). J = concentrations were less than quantitation limit but higher than detection limit and are, thus, an estimate. Range of concentrations given for samples with detectable levels of the chemical.
IRP Site
Site ID
Media:
Soil/Ground Water
Detection Frequency
Pollutant
Sample Quantitation Limit (SQL)
Range
Concentration
(Minimum-Maximum)
IRP-3 Paint Stripper Disposal Area
Soil (1 ft below ground surface (bgs) Ground Water
4/15 1/15 0/15
No OCs detections
4,4’-DDT 4,4’-DDD Arochlors
16.8 – 72.3 16.8 – 72.3
25-100J 32J nd
IRP-5 Drainage Area No. 1
Sediment Ground Water
1/6 1/6 0/6
No OCs detections
4,4’-DDD 4,4’-DDE Aroclors
4-4.3 4-4.3
nd - 6.7 1.7J nd
IRP-12 Drum Storage Area No. 2
Soil (1 ft. bgs) Ground Water
7/10 6/10 2/10 0/10
No OCs detections
4,4’-DDT 4,4’-DDE 4,4’-DDD Aroclors
16.3-18.2 16.3-18.2 16.3-18.2
20-330 23-590 18, 160
nd
IRP-13E Drum Storage Area No. 3
Soil (2 ft. bgs) Ground Water
4/19 5/23 4/22 6/37 3/23 4/22
No OCs detections
4,4’-DDT 4,4’-DDE 4,4’-DDD
Aroclor 1260 Alpha-chlordane
Gamma-chlordane
3.5-20.8 3.5-20.8 3.4-20.8 13-208 2-104
1.8-104
17-240J 1.7J- 80
1.3J – 60J 48J-340
1.0J – 1.3J 0.74J-2.1J
IRP-13W
Drum Storage Area No. 3
Soil (1, 2, 7, or 21 ft. bgs) Ground Water
5/34 2/35 2/34 1/35 1/34 1/34 1/34
No OCs detections
4,4’-DDT 4,4’-DDE 4,4’-DDD
Aroclor 1260 Alpha-chlordane
Gamma-chlordane Toxaphene
3.3-88.96 3.3-88.96 3.3-88.96 13-889.6 1.7-444.8 1.7-444.8
164.8-889.6
3.6J - 82 3.6J– 3.9
0.79J – 1.4 280J 98 200 200
IRP-16 VOC Solvent Contamination Area
Soil Ground Water
No OCs detections No OCs
detections
Agricultural Area II*
Soil (0-1 ft) 15/31 15/31 2/31 0/17 4/31 5/31 5/31
4,4’-DDT 4,4’-DDE 4,4’-DDD
Aroclor 1260 Alpha-chlordane
Gamma-chlordane Dieldrin
4-5 4-5 4-5
2-2.6 2-2.6 4-5
2.5 – 130 1.1-73 2.9-5.3
nd 0.54 – 0.88 0.77 – 1.3 0.98-2.1
* Data for Agricultural Area II from Bechtel National, Inc. (1996)
Organochlorine Compounds TMDLs Staff Report
53
management practices (BMPs) by the nurseries in cooperation with U.C. Cooperative Extension has greatly reduced agricultural discharges of waste. BMPs to reduce non-storm water discharge include water recycling; irrigation management to reduce water use; and use of polyacrylamide monomer (PAM) as a flocculating agent to reduce Total Suspended Solids (TSS) in the discharge stream. BMPs that reduce the total volume discharged and TSS will also reduce discharges of OCs. Monitoring results for El Modeno Gardens, Bordiers, and Hines nurseries are reported in Table 4.5. No detectable concentrations of any of the OC pesticides or PCBs have been reported by any of the nurseries in the watershed. Nondetects need to be verified using other sensitive analytical methods and other sampling strategies. It is possible that no detections occurred because sample size was too small or the analytical methods were not the most suitable for measuring low levels of OCs. Table 4.5 Concentrations of OC Pesticides and PCBs reported by Commercial Nurseries in the San Diego Creek-Newport Bay Watershed. Method of analysis was USEPA 608; concentration units are μg/L. Nursery
Date
Nature of Discharge
Dieldrin
Total DDT
Chlordane
Toxaphene
Total PCBs
Bordiers
12/7/03
First storm of season
nd
nd
nd
nd
nd
10/17/04
First storm of season
nd
nd
nd
nd
nd
10/17/05
First storm of season
nd
nd
nd
nd
nd
Hines
8/25/04
Water in recycling pond
nd
nd
nd
nd
nd
4/21/05
Semi-annual storm sample
nd
nd
nd
nd
nd
10/17/05
First storm of season
nd
nd
nd
nd
nd
11/7/05
Irrigation runoff
nd
nd
nd
nd
nd
El Modeno Gardens
No runoff 10/04 – 7/05
4.2.2 Nonpoint Sources Agriculture. Nonpoint source agricultural dischargers include small-scale nurseries and row crop operations. Erosion from agricultural soils has been implicated as a primary source of pesticide-contaminated sediments to Newport Bay in studies and reports dating to the 1970s (Masters and Inman, 2002; County of Orange Human Services Agency, 1978). Agricultural soils are a continuing, but declining, source of the OC legacy pesticides. For example, in 2002, concentrations of total DDT of up to 2 ppm were measured in agricultural soils in localized areas of the San Diego
Organochlorine Compounds TMDLs Staff Report
54
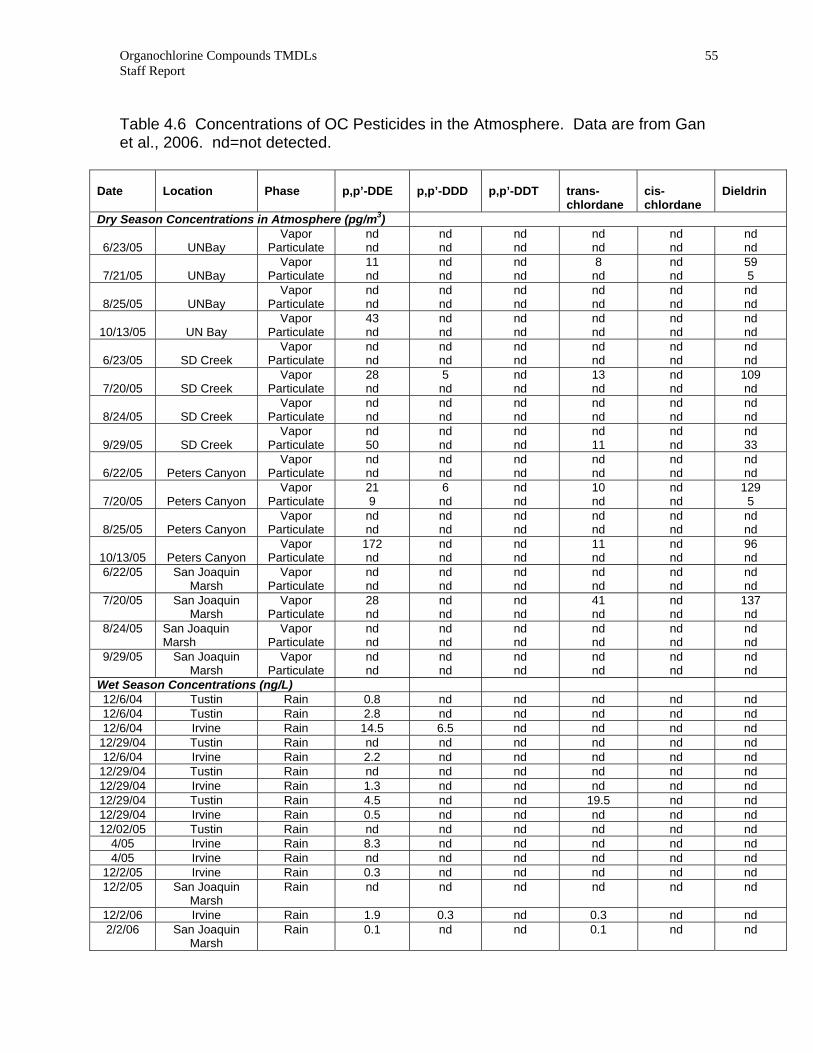
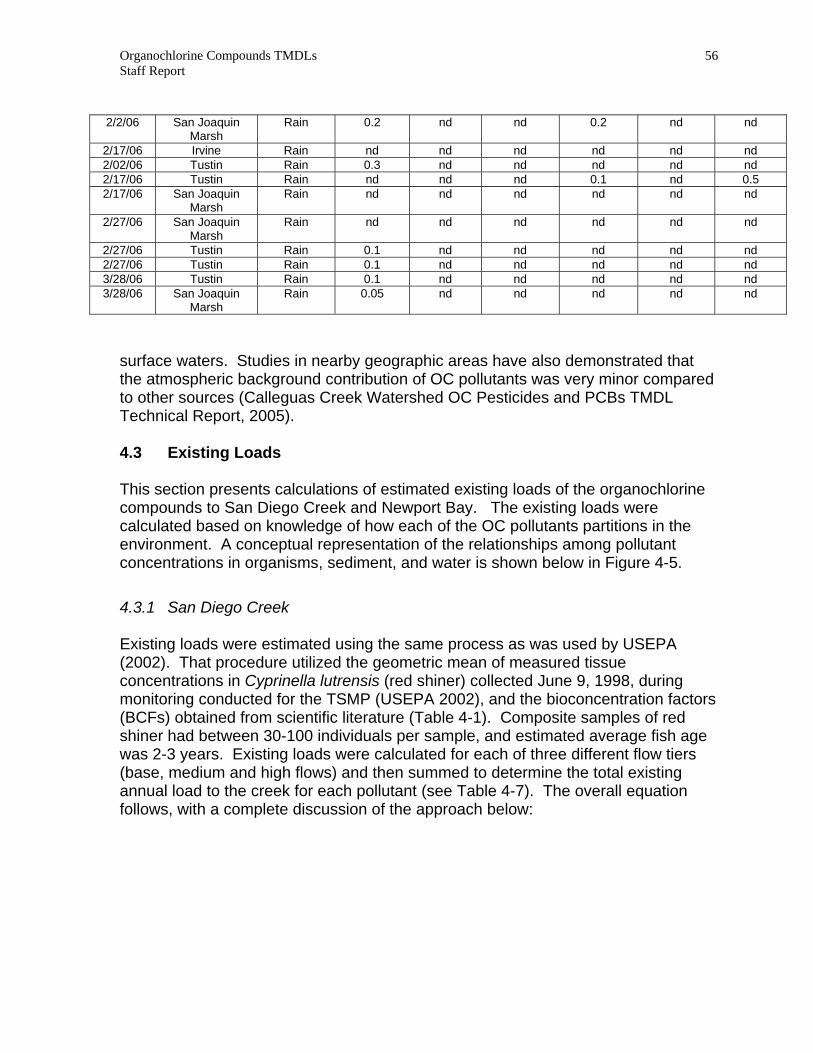
Creek watershed (data provided by the Irvine Company). Many of these areas of concern have now been converted to residential land use, and agricultural land use now occupies only about 3% of the total watershed area. Figure 4-2 shows the decline of agriculture between the 1970s and the present, on lands owned by The Irvine Company. Small amounts of DDT may continue to enter the environment through the use of dicofol, another organochlorine pesticide (miticide) that is structurally similar and contains a small amount (less than 0.1%) DDT (USDOI, 1998). Use of dicofol is extremely limited in the watershed, and this continuing source is considered to be inconsequential. For example, in 2002 there were only about 31 pounds of dicofol (equating to less than 1 ounce of DDT) applied in landscaping maintenance and container plant production activities in 15 separate applications over a total of 33 acres in the entire county (Pesticide Use Report, Orange County California, 2002). Upon build-out of the watershed, which is expected in the next 10 years, agriculture will be largely replaced by urban land uses and this source is expected to be substantially reduced, if not eliminated. Open Space. Because open space lands may contribute a substantial amount of sediment to San Diego Creek and Newport Bay, they are potential sources of organochlorine pesticides and/or PCBs if pesticides were applied or PCBs were used/spilled in the past. No data were available with which to quantify pollutant loads from this source, and this potential source will be evaluated as an implementation task. 4.2.3 Background Sources Low level background loading of organochlorine pesticides and PCBs may occur in the watershed through wet and dry deposition processes. Studies are underway in the watershed to measure atmospheric concentrations of pesticides, including the OC pesticides (both in the vapor phase and associated with particulates). Gan et al. (2006) found none of the OCs in dry deposition (dust). In rain, however, p,p’-DDE was found in 65% of samples. Assuming 15 inches of annual rainfall, about 17 g of p,p’-DDE could be deposited directly to the bay via wet deposition; the overall contribution of DDE to surface waters would likely be higher since runoff from terrestrial surfaces would contribute to the load. DDE, trans-chlordane and dieldrin were frequently detected in air, predominantly in the vapor phase (Table 4.6). In the gas phase, pesticides can partition into or out of surface waters; more information, however, is needed to predict the actual exchange flux for the OCs (Gan et al., 2006). It appears that in the San Diego Creek/Newport Bay watershed, atmospheric deposition accounts for only a very minor portion of the OCs loading to
Organochlorine Compounds TMDLs Staff Report
55
Table 4.6 Concentrations of OC Pesticides in the Atmosphere. Data are from Gan et al., 2006. nd=not detected.
Date
Location
Phase
p,p’-DDE
p,p’-DDD
p,p’-DDT
trans-chlordane
cis-chlordane
Dieldrin
Dry Season Concentrations in Atmosphere (pg/m3)
6/23/05
UNBay Vapor
Particulate nd nd
nd nd
nd nd
nd nd
nd nd
nd nd
7/21/05
UNBay
Vapor Particulate
11 nd
nd nd
nd nd
8 nd
nd nd
59 5
8/25/05
UNBay
Vapor Particulate
nd nd
nd nd
nd nd
nd nd
nd nd
nd nd
10/13/05
UN Bay
Vapor Particulate
43 nd
nd nd
nd nd
nd nd
nd nd
nd nd
6/23/05
SD Creek
Vapor Particulate
nd nd
nd nd
nd nd
nd nd
nd nd
nd nd
7/20/05
SD Creek
Vapor Particulate
28 nd
5 nd
nd nd
13 nd
nd nd
109 nd
8/24/05
SD Creek
Vapor Particulate
nd nd
nd nd
nd nd
nd nd
nd nd
nd nd
9/29/05
SD Creek
Vapor Particulate
nd 50
nd nd
nd nd
nd 11
nd nd
nd 33
6/22/05
Peters Canyon
Vapor Particulate
nd nd
nd nd
nd nd
nd nd
nd nd
nd nd
7/20/05
Peters Canyon
Vapor Particulate
21 9
6 nd
nd nd
10 nd
nd nd
129 5
8/25/05
Peters Canyon
Vapor Particulate
nd nd
nd nd
nd nd
nd nd
nd nd
nd nd
10/13/05
Peters Canyon
Vapor Particulate
172 nd
nd nd
nd nd
11 nd
nd nd
96 nd
6/22/05 San Joaquin Marsh
Vapor Particulate
nd nd
nd nd
nd nd
nd nd
nd nd
nd nd
7/20/05 San Joaquin Marsh
Vapor Particulate
28 nd
nd nd
nd nd
41 nd
nd nd
137 nd
8/24/05 San Joaquin Marsh
Vapor Particulate
nd nd
nd nd
nd nd
nd nd
nd nd
nd nd
9/29/05 San Joaquin Marsh
Vapor Particulate
nd nd
nd nd
nd nd
nd nd
nd nd
nd nd
Wet Season Concentrations (ng/L) 12/6/04 Tustin Rain 0.8 nd nd nd nd nd 12/6/04 Tustin Rain 2.8 nd nd nd nd nd 12/6/04 Irvine Rain 14.5 6.5 nd nd nd nd
12/29/04 Tustin Rain nd nd nd nd nd nd 12/6/04 Irvine Rain 2.2 nd nd nd nd nd
12/29/04 Tustin Rain nd nd nd nd nd nd 12/29/04 Irvine Rain 1.3 nd nd nd nd nd 12/29/04 Tustin Rain 4.5 nd nd 19.5 nd nd 12/29/04 Irvine Rain 0.5 nd nd nd nd nd 12/02/05 Tustin Rain nd nd nd nd nd nd
4/05 Irvine Rain 8.3 nd nd nd nd nd 4/05 Irvine Rain nd nd nd nd nd nd
12/2/05 Irvine Rain 0.3 nd nd nd nd nd 12/2/05 San Joaquin
Marsh Rain nd nd nd nd nd nd
12/2/06 Irvine Rain 1.9 0.3 nd 0.3 nd nd 2/2/06 San Joaquin
Marsh Rain 0.1 nd nd 0.1 nd nd
Organochlorine Compounds TMDLs Staff Report
56
2/2/06 San Joaquin Marsh
Rain 0.2 nd nd 0.2 nd nd
2/17/06 Irvine Rain nd nd nd nd nd nd 2/02/06 Tustin Rain 0.3 nd nd nd nd nd 2/17/06 Tustin Rain nd nd nd 0.1 nd 0.5 2/17/06 San Joaquin
Marsh Rain nd nd nd nd nd nd
2/27/06 San Joaquin Marsh
Rain nd nd nd nd nd nd
2/27/06 Tustin Rain 0.1 nd nd nd nd nd 2/27/06 Tustin Rain 0.1 nd nd nd nd nd 3/28/06 Tustin Rain 0.1 nd nd nd nd nd 3/28/06 San Joaquin
Marsh Rain 0.05 nd nd nd nd nd
surface waters. Studies in nearby geographic areas have also demonstrated that the atmospheric background contribution of OC pollutants was very minor compared to other sources (Calleguas Creek Watershed OC Pesticides and PCBs TMDL Technical Report, 2005). 4.3 Existing Loads This section presents calculations of estimated existing loads of the organochlorine compounds to San Diego Creek and Newport Bay. The existing loads were calculated based on knowledge of how each of the OC pollutants partitions in the environment. A conceptual representation of the relationships among pollutant concentrations in organisms, sediment, and water is shown below in Figure 4-5. 4.3.1 San Diego Creek Existing loads were estimated using the same process as was used by USEPA (2002). That procedure utilized the geometric mean of measured tissue concentrations in Cyprinella lutrensis (red shiner) collected June 9, 1998, during monitoring conducted for the TSMP (USEPA 2002), and the bioconcentration factors (BCFs) obtained from scientific literature (Table 4-1). Composite samples of red shiner had between 30-100 individuals per sample, and estimated average fish age was 2-3 years. Existing loads were calculated for each of three different flow tiers (base, medium and high flows) and then summed to determine the total existing annual load to the creek for each pollutant (see Table 4-7). The overall equation follows, with a complete discussion of the approach below:
Organochlorine Compounds TMDLs Staff Report
57
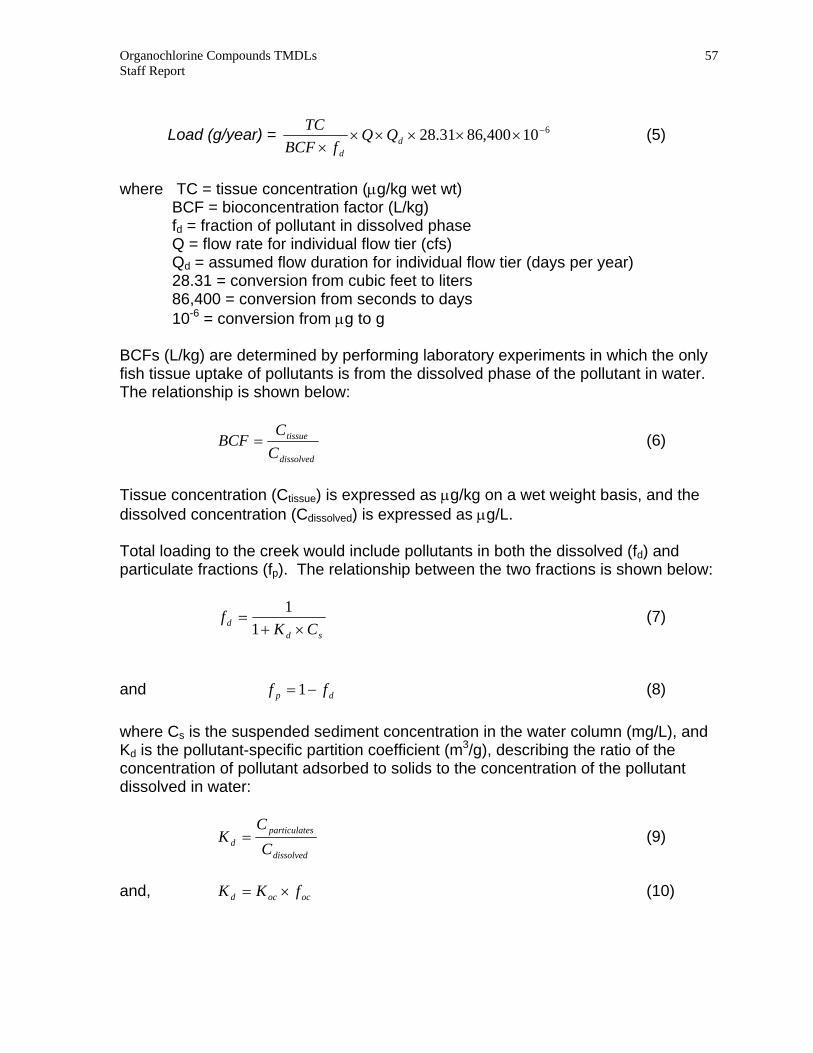
Load (g/year) = 610400,8631.28 −×××××× d
d
QQfBCF
TC (5)
where TC = tissue concentration (μg/kg wet wt) BCF = bioconcentration factor (L/kg) fd = fraction of pollutant in dissolved phase Q = flow rate for individual flow tier (cfs) Qd = assumed flow duration for individual flow tier (days per year) 28.31 = conversion from cubic feet to liters 86,400 = conversion from seconds to days 10-6 = conversion from μg to g BCFs (L/kg) are determined by performing laboratory experiments in which the only fish tissue uptake of pollutants is from the dissolved phase of the pollutant in water. The relationship is shown below:
dissolved
tissue
CC
BCF = (6)
Tissue concentration (Ctissue) is expressed as μg/kg on a wet weight basis, and the dissolved concentration (Cdissolved) is expressed as μg/L. Total loading to the creek would include pollutants in both the dissolved (fd) and particulate fractions (fp). The relationship between the two fractions is shown below:
sd
d CKf
×+=
11 (7)
and dp ff −= 1 (8) where Cs is the suspended sediment concentration in the water column (mg/L), and Kd is the pollutant-specific partition coefficient (m3/g), describing the ratio of the concentration of pollutant adsorbed to solids to the concentration of the pollutant dissolved in water:
dissolved
esparticulatd C
CK = (9)
and, (10) ococd fKK ×=
Organochlorine Compounds TMDLs Staff Report
58
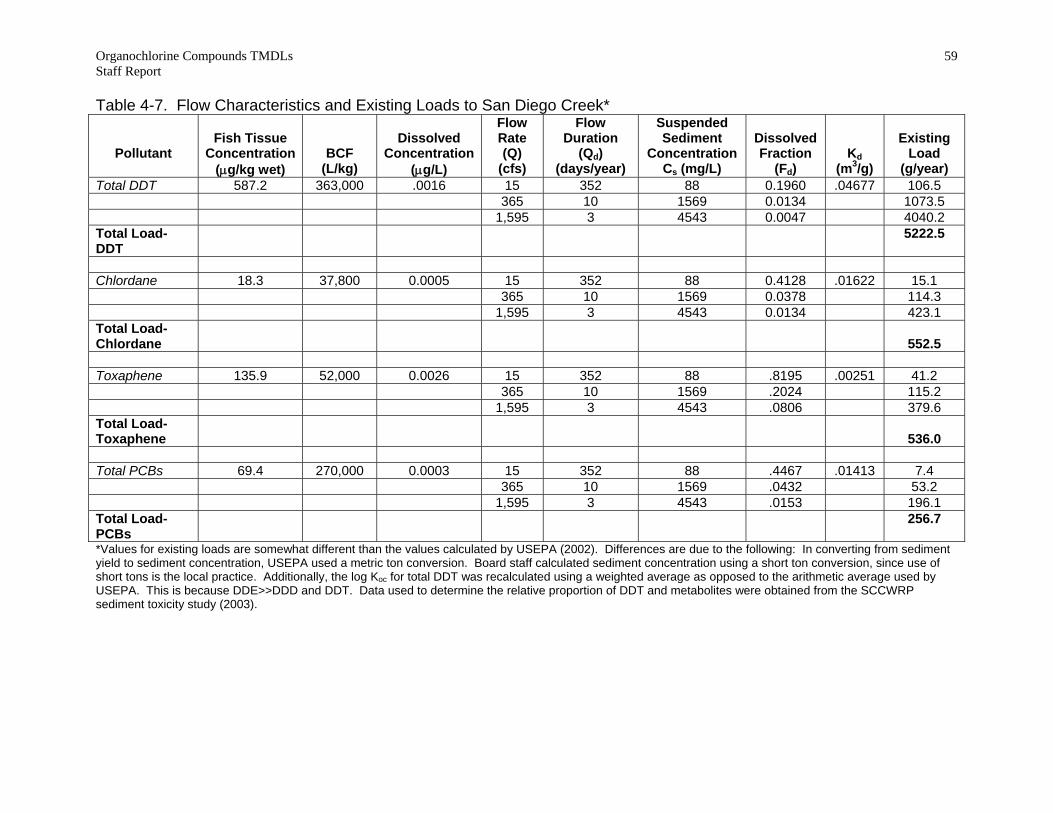
where Koc is the partition coefficient that describes the ratio of pollutant adsorbed to solids versus in solution, but is normalized to organic carbon content (foc). The organic carbon fraction was assumed to be 1 percent (foc = 0.01). Suspended sediment concentrations (Cs) were determined for three different flow tiers within San Diego Creek: low flows, medium flows, and high flows. The selected flow tiers were based upon about 20 years of daily flow records within the creek at Campus Drive (1977 through 1997) where there is a United States Geological Survey (USGS) stream gaging station. During the past 20 years, flow rates have varied at this site from 8 to 15 cfs during dry weather, to between 800 and 9,000 cfs during wet weather. The flows that were selected to represent low (<181 cfs), medium (181 to 814 cfs), and high flows (>814 cfs) were the median values for those flow ranges. A comprehensive discussion of the freshwater flow analysis is provided in Part B of USEPA's TMDL for Toxic Pollutants (2002). Flow characteristics at San Diego Creek at Campus Drive are assumed to reflect the cumulative influence of all discharges to San Diego Creek and, ultimately, to Upper Newport Bay. RMA Associates, Inc. used the logarithmic relationship between flows and suspended particulates in the water column at this location to model amounts of sediments entering Newport Bay and their subsequent spatial distribution (RMA, 1997) (see Equation 11). The RMA model was important in the development of the USACOE Upper Newport Bay Ecosystem Restoration Feasibility Study (USACOE, 2000) and is commonly used in other TMDL projects in the watershed as well (e.g., nutrients). ( ) ( ) 96.1log24.2log09.0log 2 −+−= xxy (11) where y = the sediment yield (tons/day) and x = flow (cfs) The selected flow rates corresponding to low, medium, and high flow tiers and the corresponding suspended sediment concentrations expected for these flows are provided in Table 4-7. 4.3.2 Upper and Lower Newport Bay Pollutant loading to Newport Bay was estimated based on the amount and distribution of sediment deposited as modeled by RMA for the USACOE (1997, 1998). The model assumes that sediment is supplied to the bay primarily during storm events. Then, during dry weather, intertidal flows cause sediments to be resuspended and redistributed throughout the bay. Daily average flows in San Diego Creek at Campus Drive (assumed to provide 95% of the flows to the bay) were used in conjunction with the functional relationship between flows and suspended sediment concentrations (Equation 11) to estimate annual sediment loading to the bay. Based on their calculations, the average annual sediment load
Organochlorine Compounds TMDLs Staff Report
59
Table 4-7. Flow Characteristics and Existing Loads to San Diego Creek*
Pollutant
Fish Tissue
Concentration (μg/kg wet)
BCF (L/kg)
Dissolved
Concentration(μg/L)
Flow Rate (Q)
(cfs)
Flow Duration
(Qd) (days/year)
Suspended Sediment
Concentration Cs (mg/L)
Dissolved Fraction
(Fd)
Kd(m3/g)
Existing
Load (g/year)
Total DDT 587.2 363,000 .0016 15 352 88 0.1960 .04677 106.5 365 10 1569 0.0134 1073.5 1,595 3 4543 0.0047 4040.2 Total Load-DDT
5222.5
Chlordane 18.3 37,800 0.0005 15 352 88 0.4128 .01622 15.1 365 10 1569 0.0378 114.3 1,595 3 4543 0.0134 423.1 Total Load-Chlordane
552.5
Toxaphene 135.9 52,000 0.0026 15 352 88 .8195 .00251 41.2 365 10 1569 .2024 115.2 1,595 3 4543 .0806 379.6 Total Load-Toxaphene
536.0
Total PCBs 69.4 270,000 0.0003 15 352 88 .4467 .01413 7.4 365 10 1569 .0432 53.2 1,595 3 4543 .0153 196.1 Total Load-PCBs
256.7
*Values for existing loads are somewhat different than the values calculated by USEPA (2002). Differences are due to the following: In converting from sediment yield to sediment concentration, USEPA used a metric ton conversion. Board staff calculated sediment concentration using a short ton conversion, since use of short tons is the local practice. Additionally, the log Koc for total DDT was recalculated using a weighted average as opposed to the arithmetic average used by USEPA. This is because DDE>>DDD and DDT. Data used to determine the relative proportion of DDT and metabolites were obtained from the SCCWRP sediment toxicity study (2003).
Organochlorine Compounds TMDLs Staff Report
60
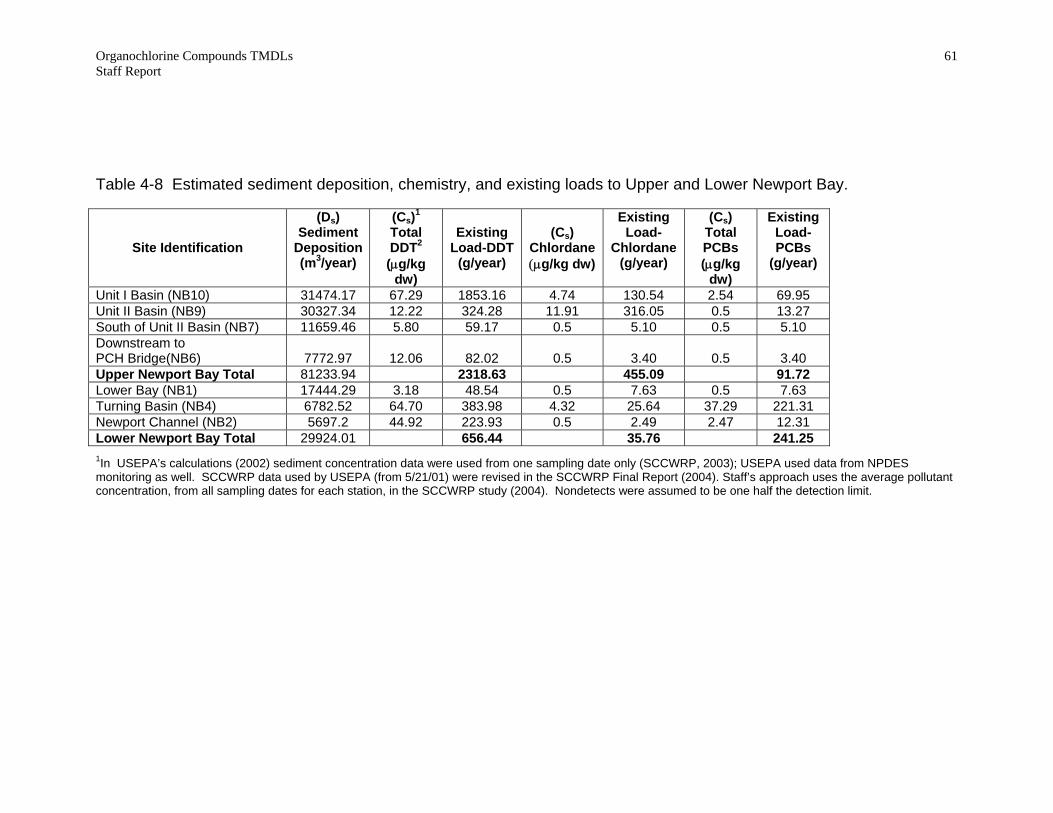
during the model calibration period (1985-1997) was over 100,000 tons of sediment per year. For comparison, the sediment TMDL allowable load for Newport Bay is 62,500 tons of sediment per year. The RMA model also estimated sediment distribution within the bay. The quantities of deposited sediment at several critical areas, coupled with the average concentrations of OC pollutants measured for the SCCWRP Sediment Toxicity Study (2004), provide an estimate for existing loading of OC pollutants to the Upper Bay and Lower Bay. Upper Newport Bay is defined as that area of the bay north of the Pacific Coast Highway Bridge, and Lower Bay is that area between the bridge and the bay entrance. The following equation was used to calculate existing loads (g/year) for the Bay: ( ) 6101 −×−×××= ssss PDCadExistingLo ρ (12) where Cs = measured concentration of OC pollutant (from Bay et al., 2004) Ds = sediment deposition (m3/year) ρs = particle density (2500 kg/m3) Ps = porosity (assumed to be 0.65) 10-6 = conversion from μg to g Table 4-8 shows the quantities of sediments deposited at each of the critical areas within the bay, sediment chemistry results, and estimated annual loads. Where sediment chemistry results showed nondetects, one-half the detection limit was used in the calculations. Loads for each geographic area within Upper and Lower Newport Bay were summed to determine the total existing load
Organochlorine Compounds TMDLs Staff Report
61
Table 4-8 Estimated sediment deposition, chemistry, and existing loads to Upper and Lower Newport Bay.
1In USEPA’s calculations (2002) sediment concentration data were used from one sampling date only (SCCWRP, 2003); USEPA used data from NPDES monitoring as well. SCCWRP data used by USEPA (from 5/21/01) were revised in the SCCWRP Final Report (2004). Staff’s approach uses the average pollutant concentration, from all sampling dates for each station, in the SCCWRP study (2004). Nondetects were assumed to be one half the detection limit.
(Ds) Sediment
Deposition(m3/year)
(Cs)1
Total DDT2 (μg/kg
dw)
Existing Load-
Chlordane (g/year)
(Cs) Total PCBs (μg/kg
dw)
Existing Load- PCBs
(Cs)
Chlordane Existing
Load-DDT Site Identification (g/year) (μg/kg dw) (g/year)
Unit I Basin (NB10) 31474.17 67.29 1853.16 4.74 130.54 2.54 69.95 Unit II Basin (NB9) 30327.34 12.22 324.28 11.91 316.05 0.5 13.27 South of Unit II Basin (NB7) 11659.46 5.80 59.17 0.5 5.10 0.5 5.10 Downstream to
12.06
82.02
3.40
0.5
PCH Bridge(NB6) 7772.97 0.5 3.40 Upper Newport Bay Total 81233.94 2318.63 455.09 91.72 Lower Bay (NB1) 17444.29 3.18 48.54 0.5 7.63 0.5 7.63 Turning Basin (NB4) 6782.52 64.70 383.98 4.32 25.64 37.29 221.31 Newport Channel (NB2) 5697.2 44.92 223.93 0.5 2.49 2.47 12.31 Lower Newport Bay Total 29924.01 656.44 35.76 241.25

Organochlorine Compounds TMDLs Staff Report
62
This page intentionally left blank.