Embed Size (px)
Citation preview
U R a P – T T W N o r t h S y d n e y P D S – T r a f f i c M a n a g e m e n t P l a n . . .
- 41 -
4.0 ROUTE NETWORK STRATEGY 4.1 Design Principles and Methodology
The assessment of existing land use, traffic flows and the forecast land use developments has been made to establish a framework for evaluation of future scenarios for the road network system in the study area. The future traffic flows are estimated for the future road network by developing a trip matrix. This information is obtained from land use zoning maps, RTA Guidelines and/or from available O-D surveys. These have provided a basis for development of a traffic trip matrix/assignment model. The road network scenarios are assessed using EMME/2 program. The coordinated intersections analyses are carried out using SCATES program. Forecast trip tables are obtained from Department of Planning Transport’s Strategic Travel Model. In summary the traffic modelling has included: linkage of surrounding suburbs and test its accuracy provision of traffic model for the entire North Sydney Centre provision of traffic model for AM peak hour in accordance to RTA’s
strategic model Other modelling issues that have been taken into consideration are as follows: Local population and employment growth Proportion of workers within the additional 12,500 Anticipated car ownership for the additional population Number of new jobs for the additional population “locally”
U R a P – T T W N o r t h S y d n e y P D S – T r a f f i c M a n a g e m e n t P l a n . . .
- 42 -
Anticipated centres or locations of remaining jobs for the additional population/developments
Regional population and employment growth NSW government population and employment forecasts
Regional transport infrastructure changes Parramatta Rail Link (PRL) East Gore Hill Tunnel Lane Cove Tunnel Unsworth Bus Review
Local transport/traffic changes As identified in PDS and during study process
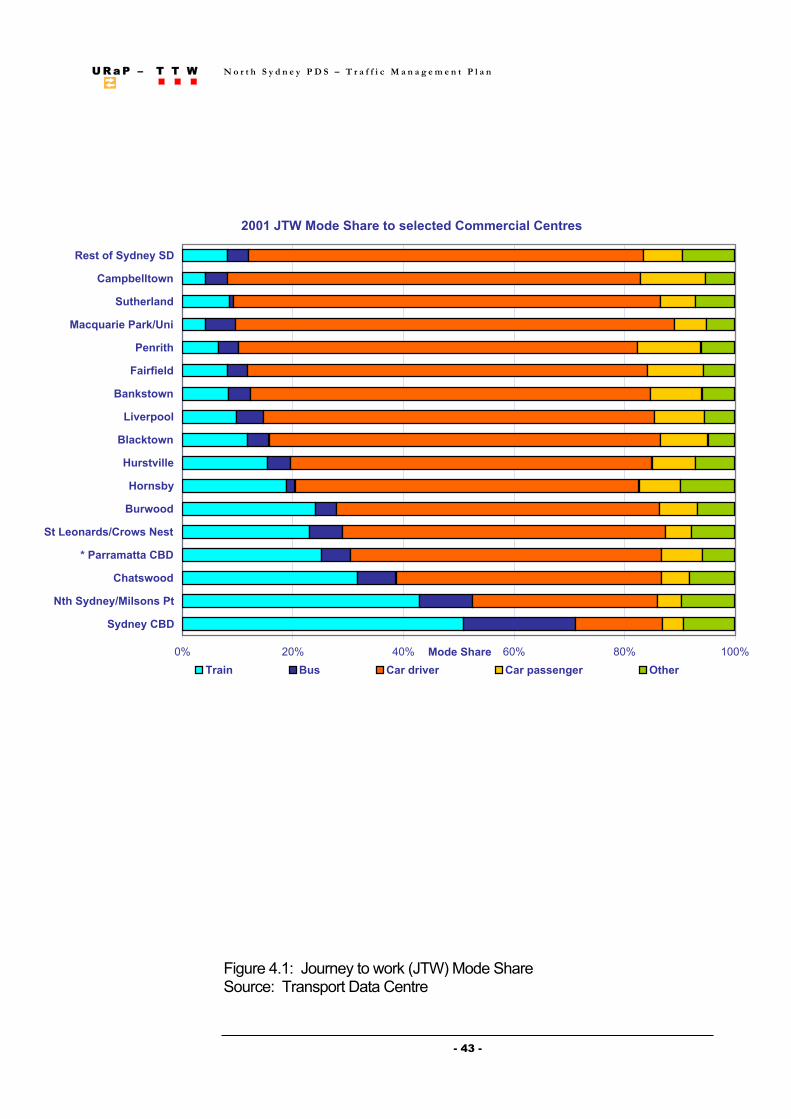
One of the main objectives of the PDS is to encourage more use of public (i.e. train, bus and ferry) and active (walk and bicycle) transport among users of NSC. This initiative is and will be supported by appropriate policy and planning instruments. Therefore, a lower use of car (by 10%) as a mode of transport to and from NSC would be an achievable task as part of a transport strategy for North Sydney Centre. The current travel pattern for North Sydney is as follows (TDC, JTW Data 2001, shown in Figure 4.1): 43% Train 10% Bus 33% Car Driver 4% Car Passenger 10% Other
UU RR aa PP –– TT TT WW N o r t h S y d n e y P D S – T r a f f i c M a n a g e m e n t P l a n.. .. ..
- 43 -
Figure 4.1: Journey to work (JTW) Mode Share Source: Transport Data Centre
%001%08%06%04%02%0
DBC yendyS
tP snosliM/yendyS htN
doowstahC
DBC attamarraP *
tseN sworC/sdranoeL tS
doowruB
ybsnroH
ellivtsruH
nwotkcalB
loopreviL
nwotsknaB
dleifriaF
htirneP
inU/kraP eirauqcaM
dnalrehtuS
nwotllebpmaC
DS yendyS fo tseR
erahS edoMniarT suB revird raC regnessap raC rehtO
sertneC laicremmoC detceles ot erahS edoM WTJ 1002
U R a P – T T W N o r t h S y d n e y P D S – T r a f f i c M a n a g e m e n t P l a n . . .
- 44 -
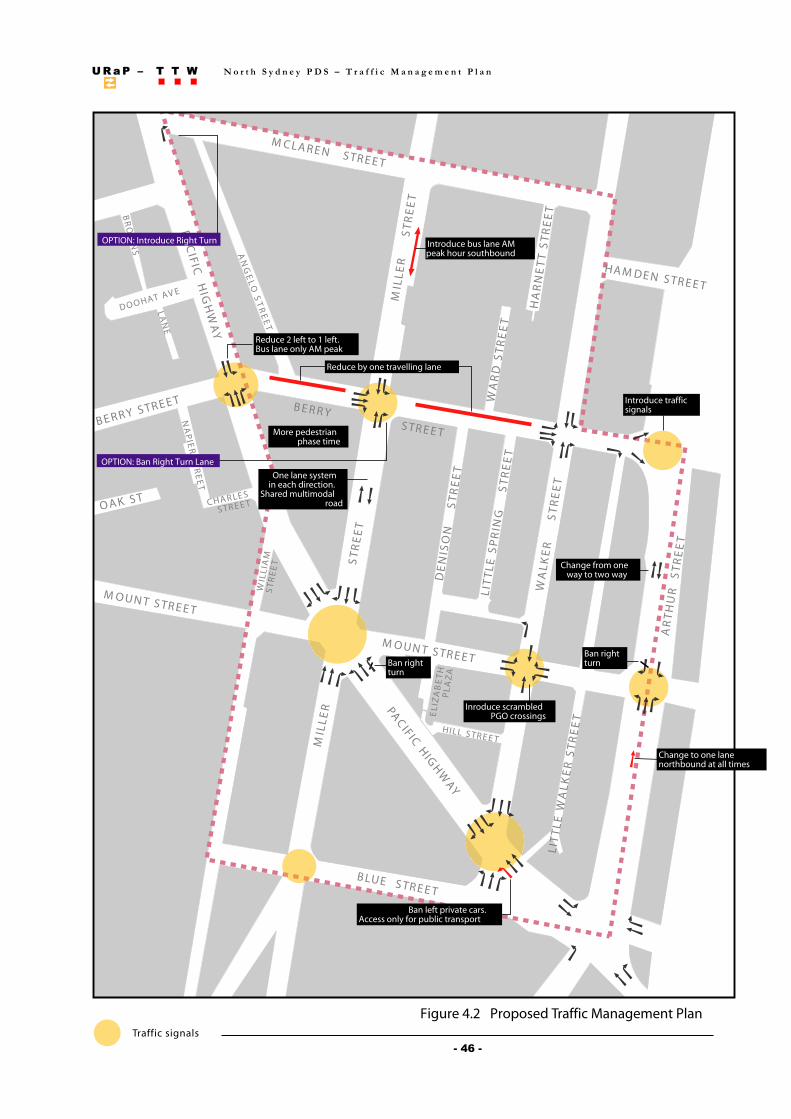
4.2 Route Network Scenarios The assessment of traffic movements for the Centre has been carried out in consideration to future growth and increased level of vehicular traffic within Sydney Metropolitan area and public domain strategies for NSC. As part of this exercise four scenarios were considered (using strategic modelling network Emme/2): Step 1: Impact of the modified route network on the existing situation 1. Existing: 2006 base case (existing road network – “Do Nothing”) 2. Proposed: 2006 base case with the proposed measures Step 2: Overall assessment of future situation 2021 3. Future “Do Nothing”: 2021 base case, as existing road network 4. Future Proposed : 2021 base case with proposed measures Based on technical investigations during the course of the study, a number of traffic management measures are proposed in order to achieve the objectives of the PDS while providing a balanced traffic management system for the area. The proposed vehicular traffic management measures for street system within the Centre include (see Figure 4.2): To reduce vehicular traffic along Miller Street by:
a) banning right turn movements from Pacific Highway onto Miller Street; b) introduction of one lane traffic movements in each direction along Miller Street (by footpath widening).
U R a P – T T W N o r t h S y d n e y P D S – T r a f f i c M a n a g e m e n t P l a n . . .
- 45 -
Ban left turn for private cars only from Pacific Highway onto Blue Street to prohibit any unsafe weaving movements along Pacific Highway and improve Blue Street environment.
Reduce the two left turn lanes from Pacific Highway (southbound)
onto Berry Street to one “Bus Only “lane (with 50% enforcement) to encourage better use of freeway at Falcon Street.
Reduce one lane of traffic along Berry Street to protect its civic and
commercial environment and needs.
Rationalisation of Pacific Highway, Arthur and High Street intersection to promote more use of Arthur Street with two right turns facility from High Street onto Arthur Street.
Establish a permanent one way traffic movement, northbound, along
Arthur Street between Pacific Highway and Mount Street.
Introduction of two way traffic system along Arthur Street between Mount and Berry Streets.
Ban southbound right turn from Arthur Street onto Mount Street to
facilitate intersection operation at Mount and Arthur Street. Installation of traffic signals at intersection of Berry and Arthur
Streets.
UU RR aa PP –– TT TT WW N o r t h S y d n e y P D S – T r a f f i c M a n a g e m e n t P l a n.. .. ..
- 46 -
TEERTS NERALCM
YA
WH
GIH
CI
FIC
AP
YAW
HGI
H CI
FIC
AP
TEERTS YRREB
TEERTS TNUOM
TEERTS EULB
TEERTS NEDMAH
TE
ER
TS
RU
HT
RA
TE
ER
TS
RE
KL
AW
EL
TTI
LT
EE
RT
S R
EK
LA
W
TE
ER
TS
GNI
RP
S E
LT
TIL
TE
ER
TS
NO
SIN
ED
TE
ER
TS
RE
LLI
M
TE
ER
TS
DR
AW
TE
ER
TS
OL
EG
NA
EVA TAHOOD
TEERTS YRREB
TS KAOSELRAHC TEERTS
TE
ER
TS
REI
PA
N
SN
WO
RB T
EE
RT
S T
TE
NR
AH
TE
ER
TS
TEERTS TNUOM
TEERTS LLIH
HT
EB
AZI
LE
AZ
AL
P
EN
AL
MAI
LLI
W
TE
ER
TS
RE
LLI
M
Figure 4.2 Proposed Traffic Management Plan
Reduce 2 left to 1 left.Bus lane only AM peak
More pedestrianphase time
Introduce bus lane AMpeak hour southbound
Introduce trafficsignals
Inroduce scrambledPGO crossings
Change from oneway to two way
Change to one lanenorthbound at all times
Ban left private cars.Access only for public transport
Ban rightturn
One lane systemin each direction.
Shared multimodalroad
Reduce by one travelling lane
Traffic signals
Ban rightturn
OPTION: Ban Right Turn Lane
OPTION: Introduce Right Turn
U R a P – T T W N o r t h S y d n e y P D S – T r a f f i c M a n a g e m e n t P l a n . . .
- 47 -
4.3 Assessments The study area has been examined at two levels
1. Macro level: using strategic transport modeling to assess the impact of the proposed measures on the route network.
2. Micro level: to examine and test the operational characteristics
of the internal road network within the Centre as a result of proposed changes and findings from the strategic model.
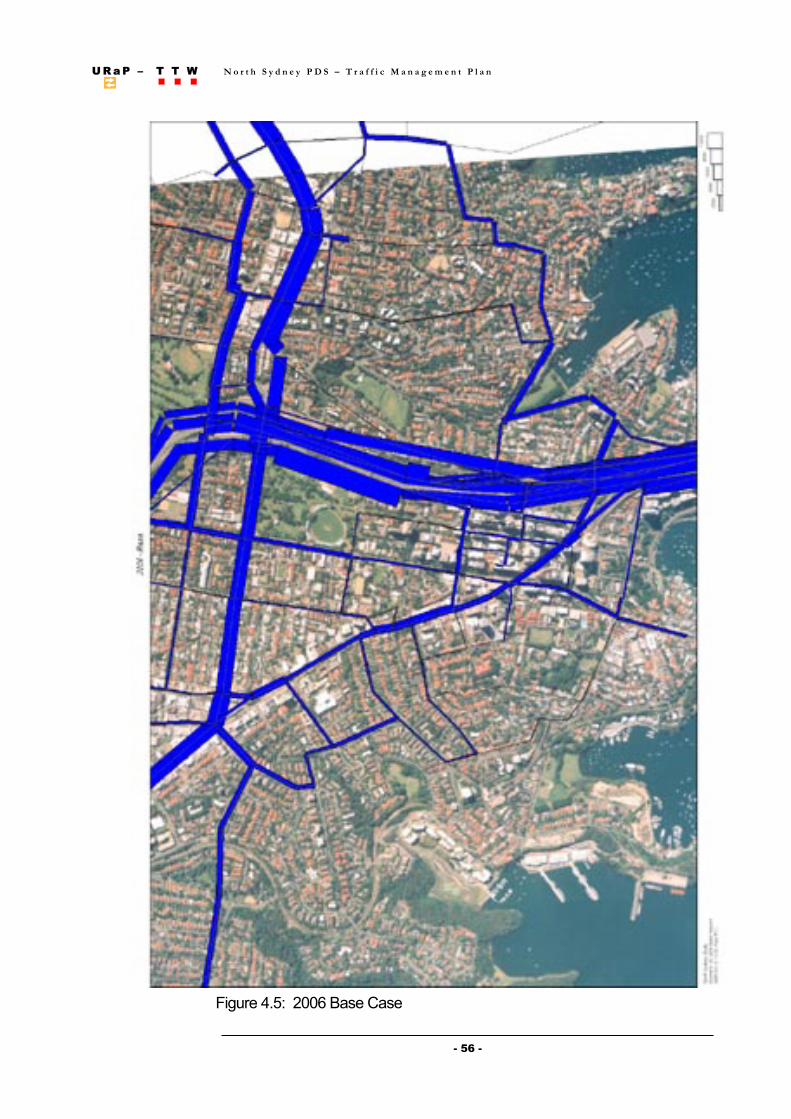
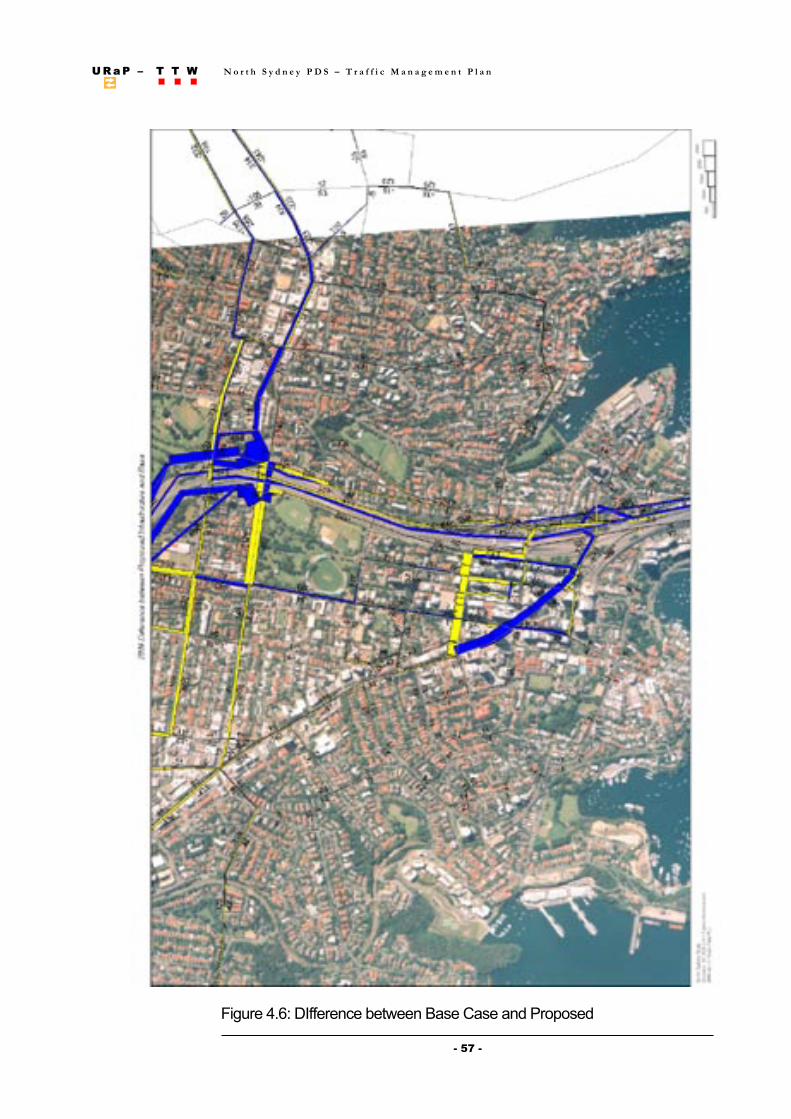
The strategic modeling has examined four scenarios (as described in 4.1) for North Sydney Centre with respect to traffic analysis. The results of traffic models indicate that once delays are experienced on a travel route, drivers tend to use alternative routes. For example, southbound traffic along Pacific Highway will experience higher traffic volumes in the proposed scenario in comparison to the existing situation. This is due to the high congestion on Falcon Street ramps to Freeway which diverts traffic along Pacific Highway. The traffic analyses also indicate that the road network under the proposed scenario operates with more efficiency in terms of travel time savings and level of pollution. The strategic modeling involved using EMME2 software while micro assessment was carried out by the SCATES program for the following sections of the route network within the Centre.
Along Pacific Highway including its intersections with Arthur/High Streets, Walker Street, Miller Street and Berry Streets
Along Berry Street including its intersections with Pacific
Highway, Miller, Walker and Arthur Streets
U R a P – T T W N o r t h S y d n e y P D S – T r a f f i c M a n a g e m e n t P l a n . . .
- 48 -
Along Arthur Street including its intersections with Pacific Highway, Mount and Berry Streets
This exercise examined the operation of intersections along the above routes by providing an overview of their operations with consideration to proposed changes. It is also acknowledged that further assessment should be made considering a larger area of road network, once a more detailed conceptual plan for the area has been adopted.
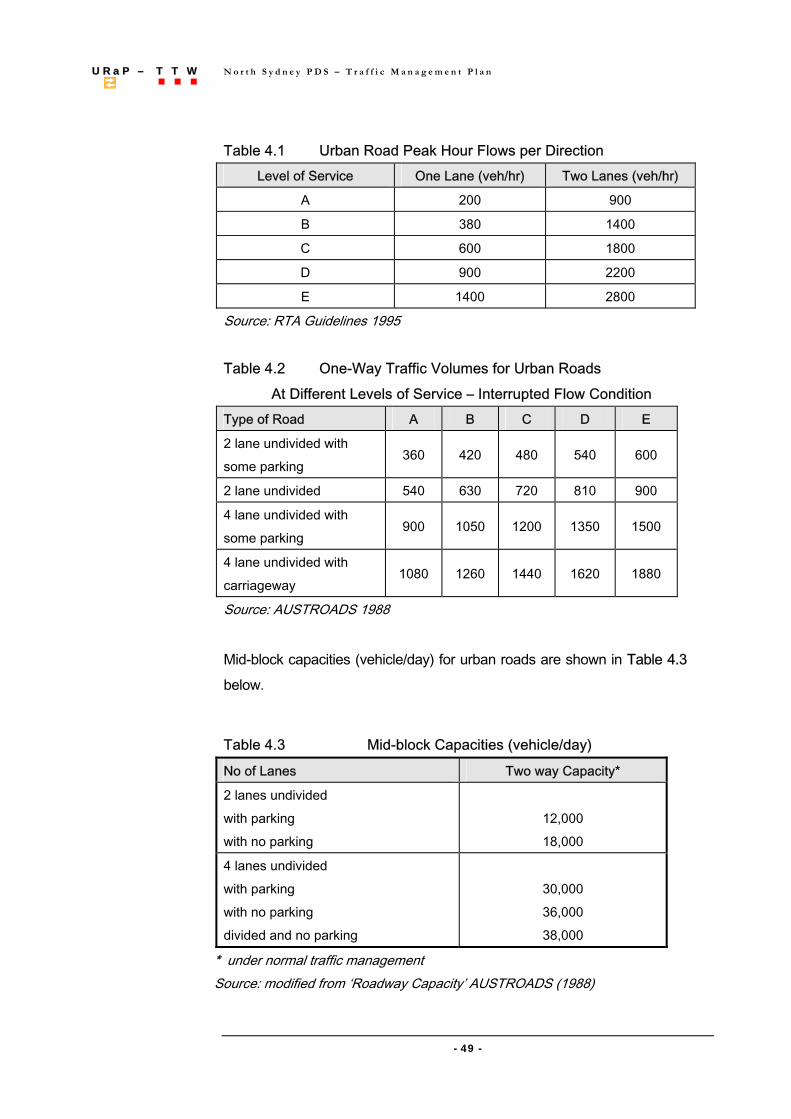
Road Capacity The term “level of service” has been defined by AUSTROADS as: A qualitative measure describing operational conditions within a traffic stream and their perception by motorists and or passengers. A level of service definition generally describes these conditions in terms of factors such as speed and travel time, freedom to manoeuvre, traffic interruptions, comfort, convenience and safety. In general there are six levels of service designated from A to F, with level of service A representing the best operating conditions (i.e. free flow) and level of service F the worst (i.e. forced or breakdown flow) . This study has adopted the RTA’s recommendations for Level of Service criteria as set out in its Guide to Traffic Generating Developments (1995) (which is based on the AUSTROADS Guide to Traffic Engineering Practice – Part 2). One-way hourly volumes during peak hours for urban and rural roads and recommended levels of service are shown in Tables 4.1 and 4.2, respectively.
U R a P – T T W N o r t h S y d n e y P D S – T r a f f i c M a n a g e m e n t P l a n . . .
- 49 -
Table 4.1 Urban Road Peak Hour Flows per Direction
Level of Service One Lane (veh/hr) Two Lanes (veh/hr)
A 200 900
B 380 1400
C 600 1800
D 900 2200
E 1400 2800
Source: RTA Guidelines 1995
Table 4.2 One-Way Traffic Volumes for Urban Roads At Different Levels of Service – Interrupted Flow Condition Type of Road A B C D E
2 lane undivided with some parking
360 420 480 540 600
2 lane undivided 540 630 720 810 900
4 lane undivided with some parking
900 1050 1200 1350 1500
4 lane undivided with carriageway
1080 1260 1440 1620 1880
Source: AUSTROADS 1988 Mid-block capacities (vehicle/day) for urban roads are shown in Table 4.3 below.
Table 4.3 Mid-block Capacities (vehicle/day)
No of Lanes Two way Capacity*
2 lanes undivided with parking with no parking
12,000 18,000
4 lanes undivided with parking with no parking divided and no parking
30,000 36,000 38,000
* under normal traffic management Source: modified from ‘Roadway Capacity’ AUSTROADS (1988)
UU RR aa PP –– TT TT WW N o r t h S y d n e y P D S – T r a f f i c M a n a g e m e n t P l a n.. .. ..
- 50 -
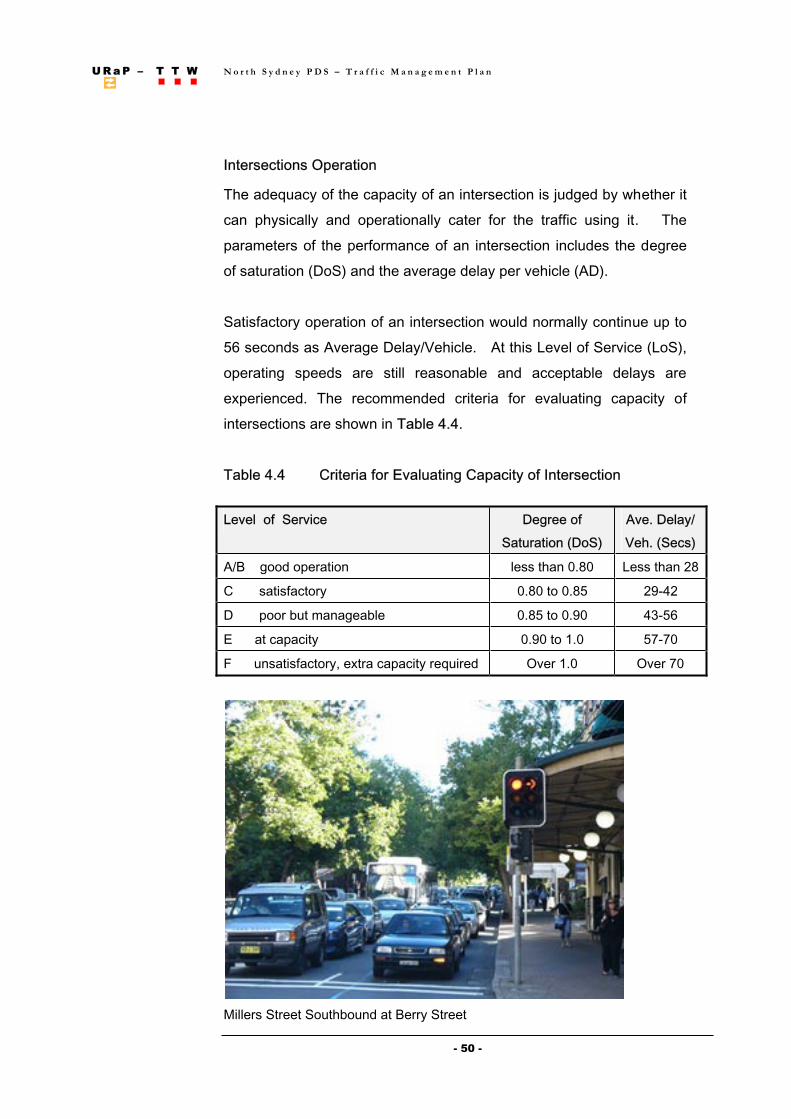
IInntteerrsseeccttiioonnss OOppeerraattiioonn
The adequacy of the capacity of an intersection is judged by whether it can physically and operationally cater for the traffic using it. The parameters of the performance of an intersection includes the degree of saturation (DoS) and the average delay per vehicle (AD).
Satisfactory operation of an intersection would normally continue up to 56 seconds as Average Delay/Vehicle. At this Level of Service (LoS), operating speeds are still reasonable and acceptable delays are experienced. The recommended criteria for evaluating capacity of intersections are shown in TTaabbllee 44..44.. TTaabbllee 44..44 CCrriitteerriiaa ffoorr EEvvaalluuaattiinngg CCaappaacciittyy ooff IInntteerrsseeccttiioonn
LLeevveell ooff SSeerrvviiccee DDeeggrreeee ooff SSaattuurraattiioonn ((DDooSS))
AAvvee.. DDeellaayy// VVeehh.. ((SSeeccss))
A/B good operation less than 0.80 Less than 28
C satisfactory 0.80 to 0.85 29-42
D poor but manageable 0.85 to 0.90 43-56
E at capacity 0.90 to 1.0 57-70
F unsatisfactory, extra capacity required Over 1.0 Over 70
Millers Street Southbound at Berry Street
U R a P – T T W N o r t h S y d n e y P D S – T r a f f i c M a n a g e m e n t P l a n . . .
- 51 -
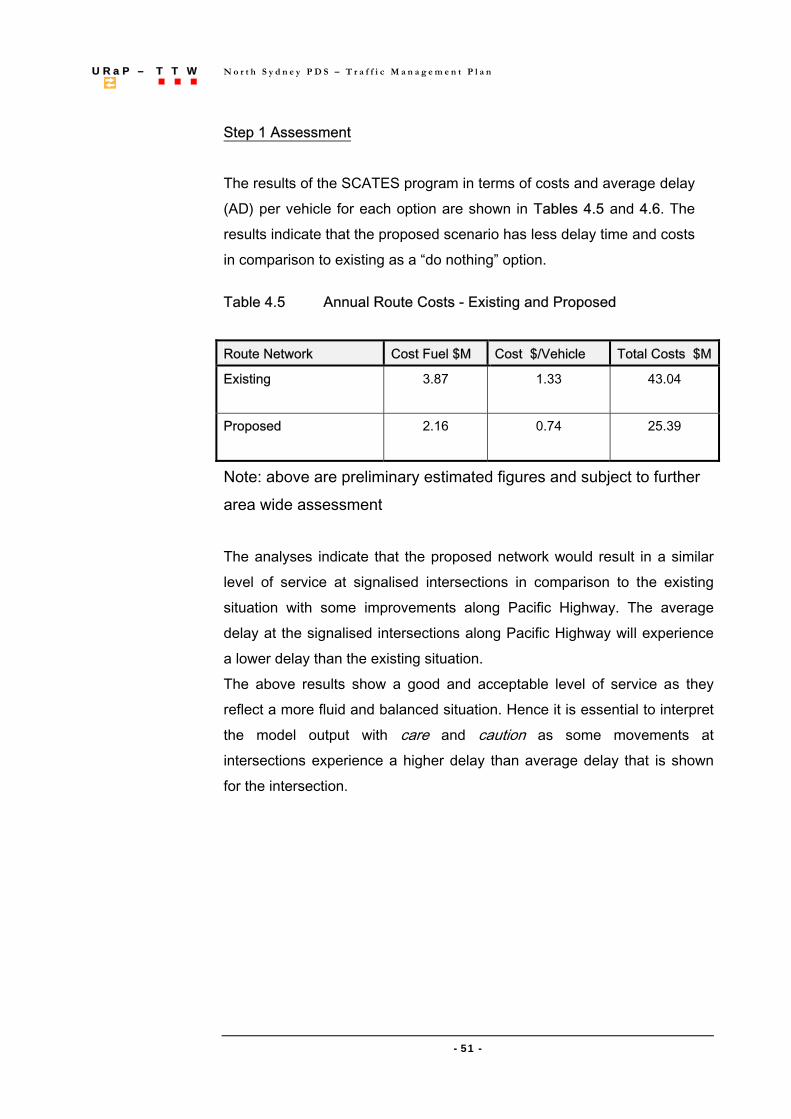
Step 1 Assessment The results of the SCATES program in terms of costs and average delay (AD) per vehicle for each option are shown in Tables 4.5 and 4.6. The results indicate that the proposed scenario has less delay time and costs in comparison to existing as a “do nothing” option.
Table 4.5 Annual Route Costs - Existing and Proposed
Route Network Cost Fuel $M Cost $/Vehicle Total Costs $M
Existing 3.87 1.33
43.04
Proposed
2.16 0.74 25.39
Note: above are preliminary estimated figures and subject to further area wide assessment The analyses indicate that the proposed network would result in a similar level of service at signalised intersections in comparison to the existing situation with some improvements along Pacific Highway. The average delay at the signalised intersections along Pacific Highway will experience a lower delay than the existing situation. The above results show a good and acceptable level of service as they reflect a more fluid and balanced situation. Hence it is essential to interpret the model output with care and caution as some movements at intersections experience a higher delay than average delay that is shown for the intersection.
U R a P – T T W N o r t h S y d n e y P D S – T r a f f i c M a n a g e m e n t P l a n . . .
- 52 -
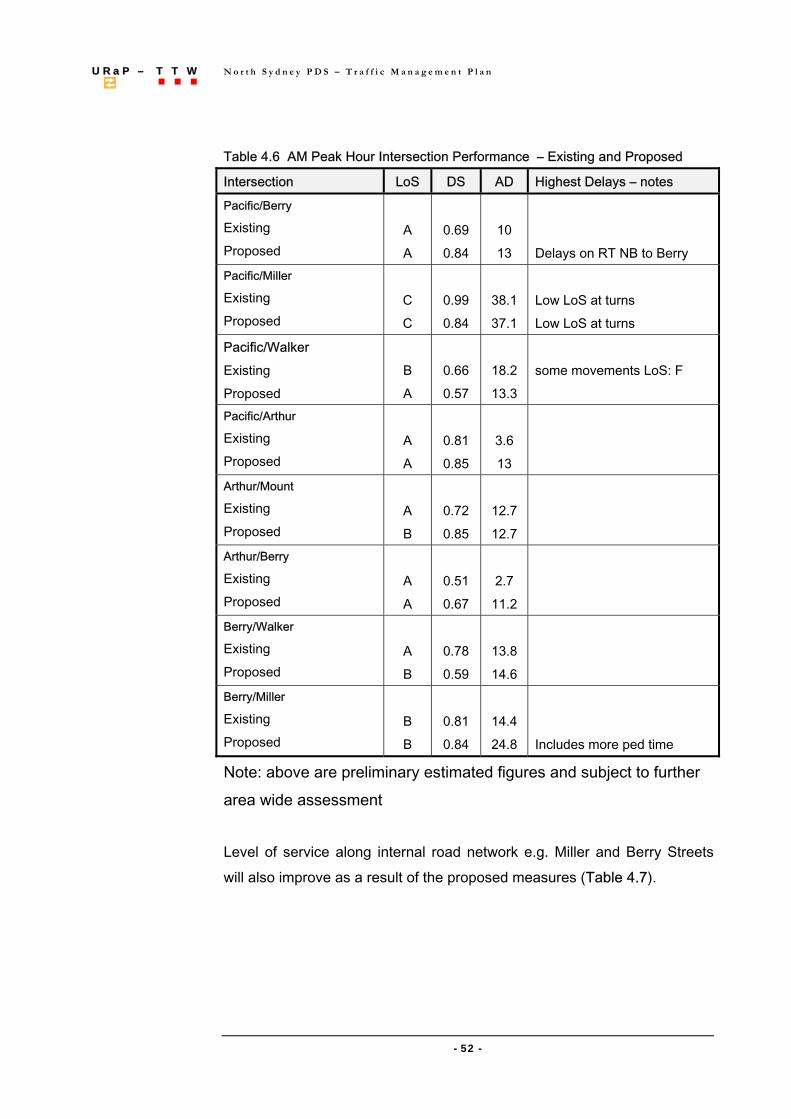
Table 4.6 AM Peak Hour Intersection Performance – Existing and Proposed
Intersection LoS DS AD Highest Delays – notes
Pacific/Berry
Existing Proposed
A A
0.69 0.84
10 13
Delays on RT NB to Berry
Pacific/Miller
Existing Proposed
C C
0.99 0.84
38.1 37.1
Low LoS at turns Low LoS at turns
Pacific/Walker Existing Proposed
B A
0.66 0.57
18.2 13.3
some movements LoS: F
Pacific/Arthur
Existing Proposed
A A
0.81 0.85
3.6 13
Arthur/Mount
Existing Proposed
A B
0.72 0.85
12.7 12.7
Arthur/Berry
Existing Proposed
A A
0.51 0.67
2.7
11.2
Berry/Walker
Existing Proposed
A B
0.78 0.59
13.8 14.6
Berry/Miller
Existing Proposed
B B
0.81 0.84
14.4 24.8
Includes more ped time
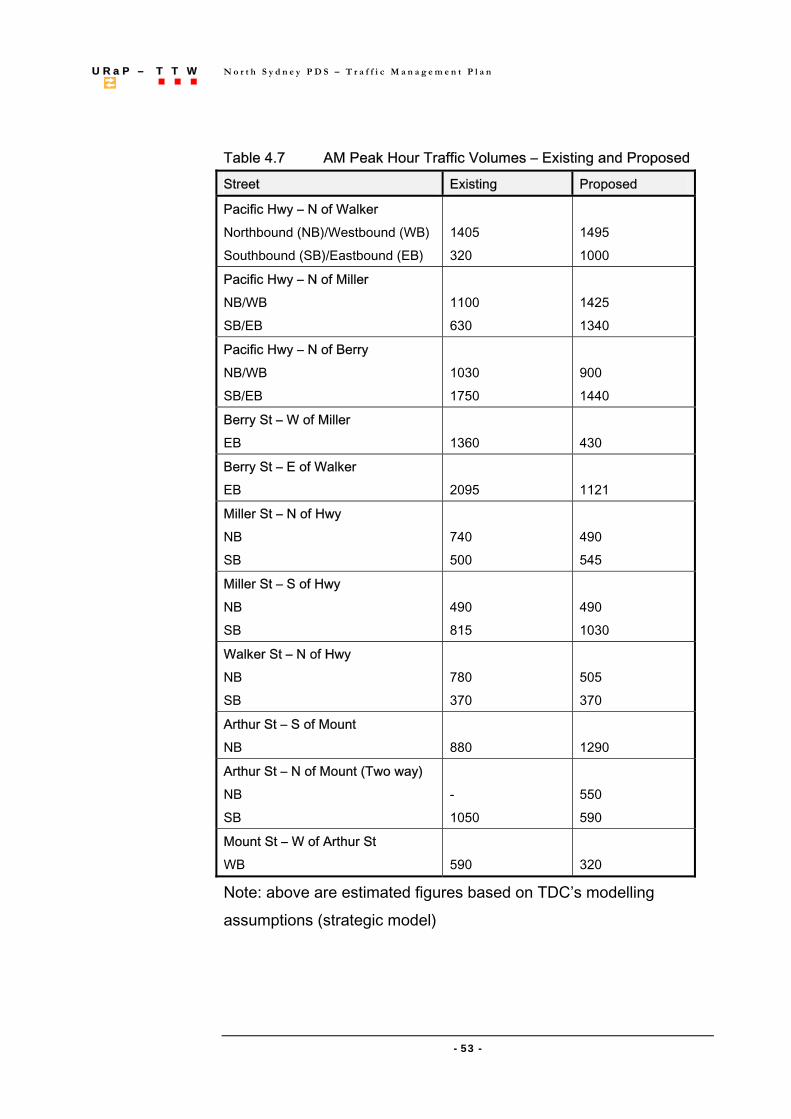
Note: above are preliminary estimated figures and subject to further area wide assessment Level of service along internal road network e.g. Miller and Berry Streets will also improve as a result of the proposed measures (Table 4.7).
U R a P – T T W N o r t h S y d n e y P D S – T r a f f i c M a n a g e m e n t P l a n . . .
- 53 -
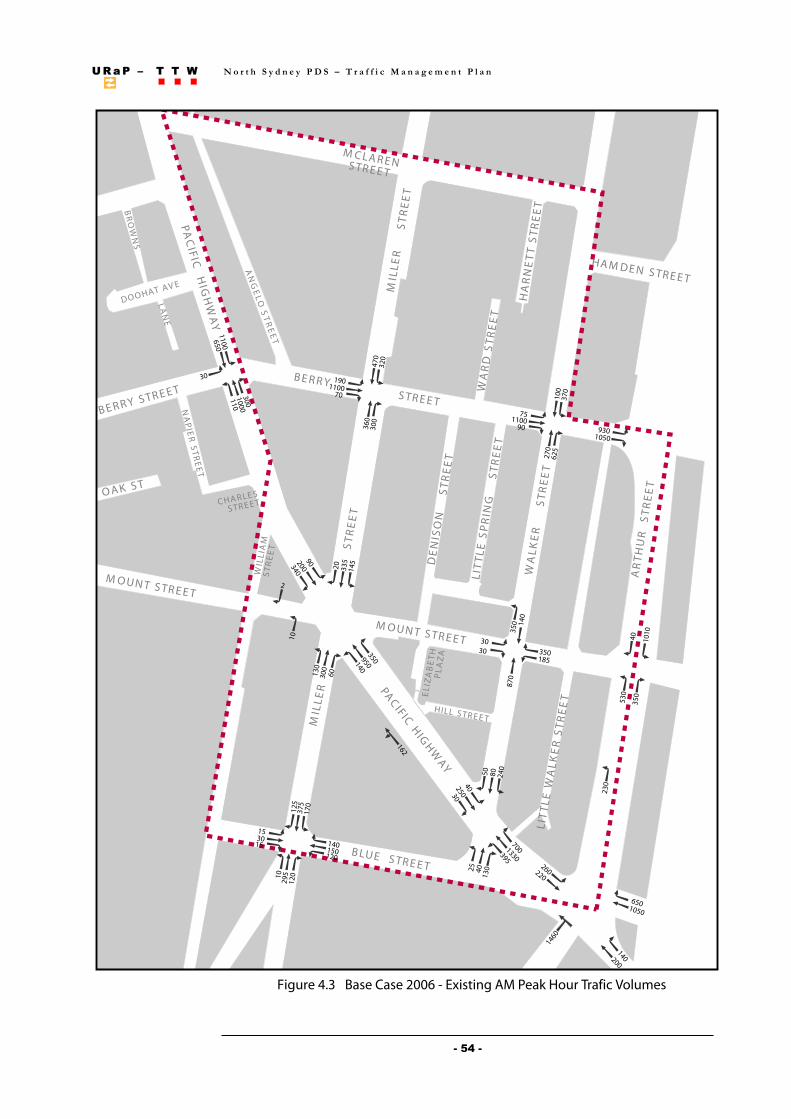
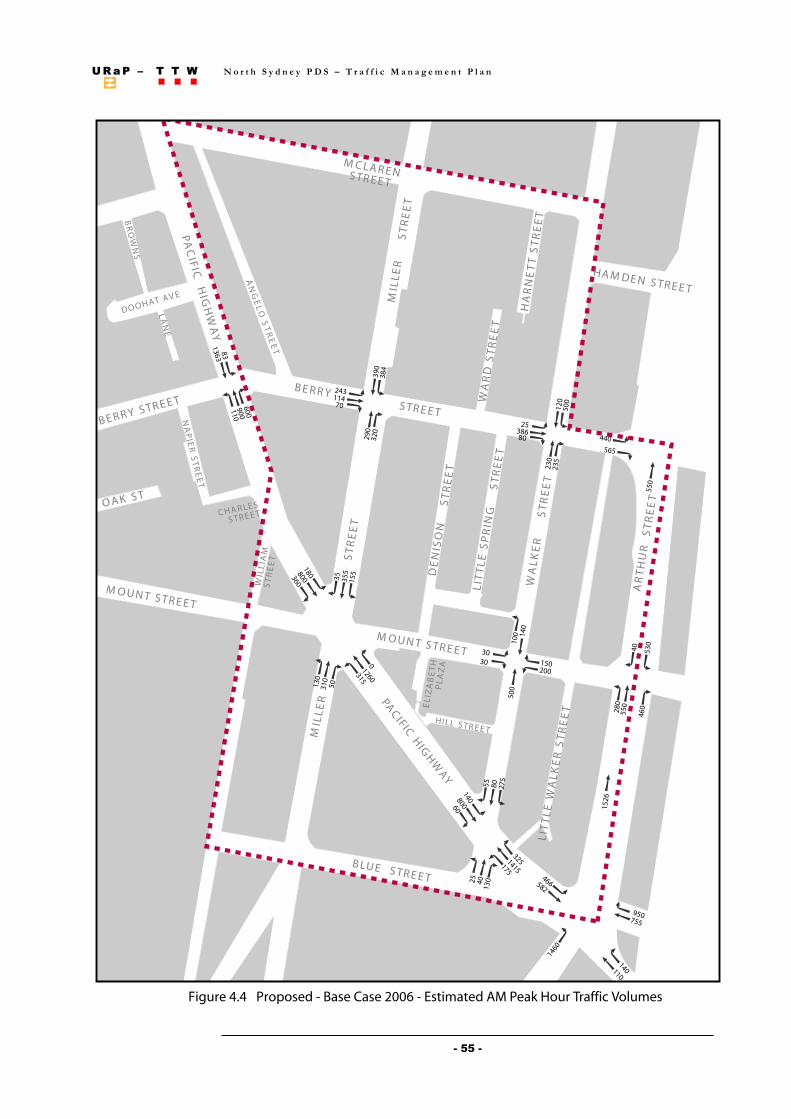
Table 4.7 AM Peak Hour Traffic Volumes – Existing and Proposed
Street Existing Proposed
Pacific Hwy – N of Walker Northbound (NB)/Westbound (WB) Southbound (SB)/Eastbound (EB)
1405 320
1495 1000
Pacific Hwy – N of Miller NB/WB SB/EB
1100 630
1425 1340
Pacific Hwy – N of Berry NB/WB SB/EB
1030 1750
900 1440
Berry St – W of Miller EB
1360
430
Berry St – E of Walker EB
2095
1121
Miller St – N of Hwy NB SB
740 500
490 545
Miller St – S of Hwy NB SB
490 815
490 1030
Walker St – N of Hwy NB SB
780 370
505 370
Arthur St – S of Mount NB
880
1290
Arthur St – N of Mount (Two way) NB SB
- 1050
550 590
Mount St – W of Arthur St WB
590
320
Note: above are estimated figures based on TDC’s modelling assumptions (strategic model)
UU RR aa PP –– TT TT WW N o r t h S y d n e y P D S – T r a f f i c M a n a g e m e n t P l a n.. .. ..
- 54 -
NERALCM
TEERTS
YA
WH
GIH
CI
FIC
AP
YAW
HGI
H CI
FIC
APTEERTS YRREB
TEERTS TNUOM
TEERTS EULB
TEERTS NEDMAH
TE
ER
TS
RU
HT
RA
TE
ER
TS
RE
KL
AW
EL
TTI
LT
EE
RT
S R
EK
LA
W
TE
ER
TS
GNI
RP
S E
LT
TIL
TE
ER
TS
NO
SIN
ED
TE
ER
TS
RE
LLI
M
TE
ER
TS
DR
AW
TE
ER
TS
OL
EG
NA
EVA TAHOOD
TEERTS YRREB
TS KAO SELRAHC TEERTS
TE
ER
TS
REI
PA
N
SN
WO
RB T
EE
RT
S T
TE
NR
AH
TE
ER
TS
TEERTS TNUOM
TEERTS LLIH
HT
EB
AZI
LE
AZ
AL
P
EN
AL
MAI
LLI
W
TE
ER
TS
RE
LLI
M
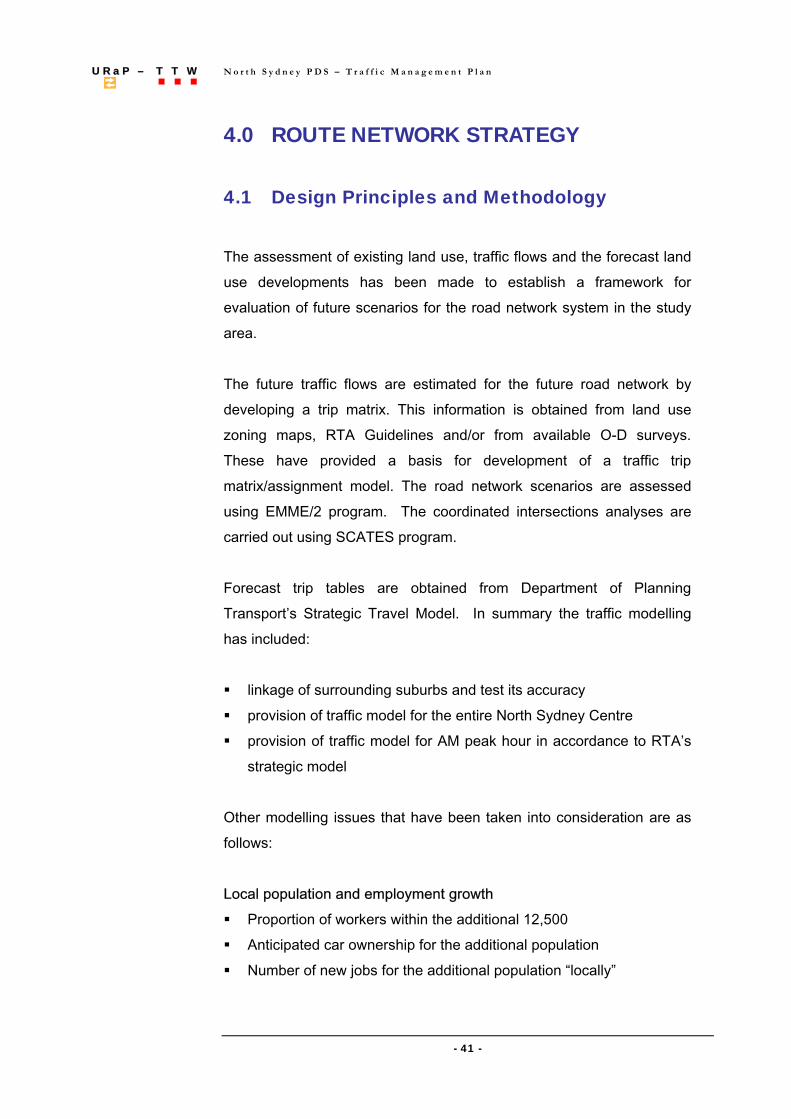
Figure 4.3 Base Case 2006 - Existing AM Peak Hour Trafic Volumes
533541
02
001073
526072
570011
09
041
0303
078
053581
053 0101
04035
053
032
074023
003063
0910011
07
056
0011
03
011
0001 00
3
002 09
043
05904
1 053
003
01
06
031
08042
05
0331593
007
04 031
52
052 04
03
261
573071
021592
510351
521
01
051021
041
0501056
041002
0641
022 062
2
9301050
UU RR aa PP –– TT TT WW N o r t h S y d n e y P D S – T r a f f i c M a n a g e m e n t P l a n.. .. ..
- 55 -
NERALCM
TEERTS
YA
WH
GIH
CI
FIC
AP
YAW
HGI
H CI
FIC
APTEERTS YRREB
TEERTS TNUOM
TEERTS EULB
TEERTS NEDMAH
TE
ER
TS
RU
HT
RA
TE
ER
TS
RE
KL
AW
EL
TTI
LT
EE
RT
S R
EK
LA
W
TE
ER
TS
GNI
RP
S E
LT
TIL
TE
ER
TS
NO
SIN
ED
TE
ER
TS
RE
LLI
M
TE
ER
TS
DR
AW
TE
ER
TS
OL
EG
NA
EVA TAHOOD
TEERTS YRREB
TS KAO SELRAHC TEERTS
TE
ER
TS
REI
PA
N
SN
WO
RB T
EE
RT
S T
TE
NR
AH
TE
ER
TS
TEERTS TNUOM
TEERTS LLIH
HT
EB
AZI
LE
AZ
AL
P
EN
AL
MAI
LLI
W
TE
ER
TS
RE
LLI
M
Figure 4.4 Proposed - Base Case 2006 - Estimated AM Peak Hour Traffic Volumes
553551
53
021005
532032
52683
08
041
0303
005
051002
001 035
04
082 064
6251
093483
023092
342411
07
3631
38
011
009
006
008 08
106
3
062151
3
0
01305
031
08572
55
5141571
523
04 031
52
008 04
106
557950
041011
0641
285 664
044
565
055
055
UU RR aa PP –– TT TT WW N o r t h S y d n e y P D S – T r a f f i c M a n a g e m e n t P l a n.. .. ..
- 56 -
Figure 4.5: 2006 Base Case
UU RR aa PP –– TT TT WW N o r t h S y d n e y P D S – T r a f f i c M a n a g e m e n t P l a n.. .. ..
- 57 -
Figure 4.6: DIfference between Base Case and Proposed
U R a P – T T W N o r t h S y d n e y P D S – T r a f f i c M a n a g e m e n t P l a n . . .
- 58 -
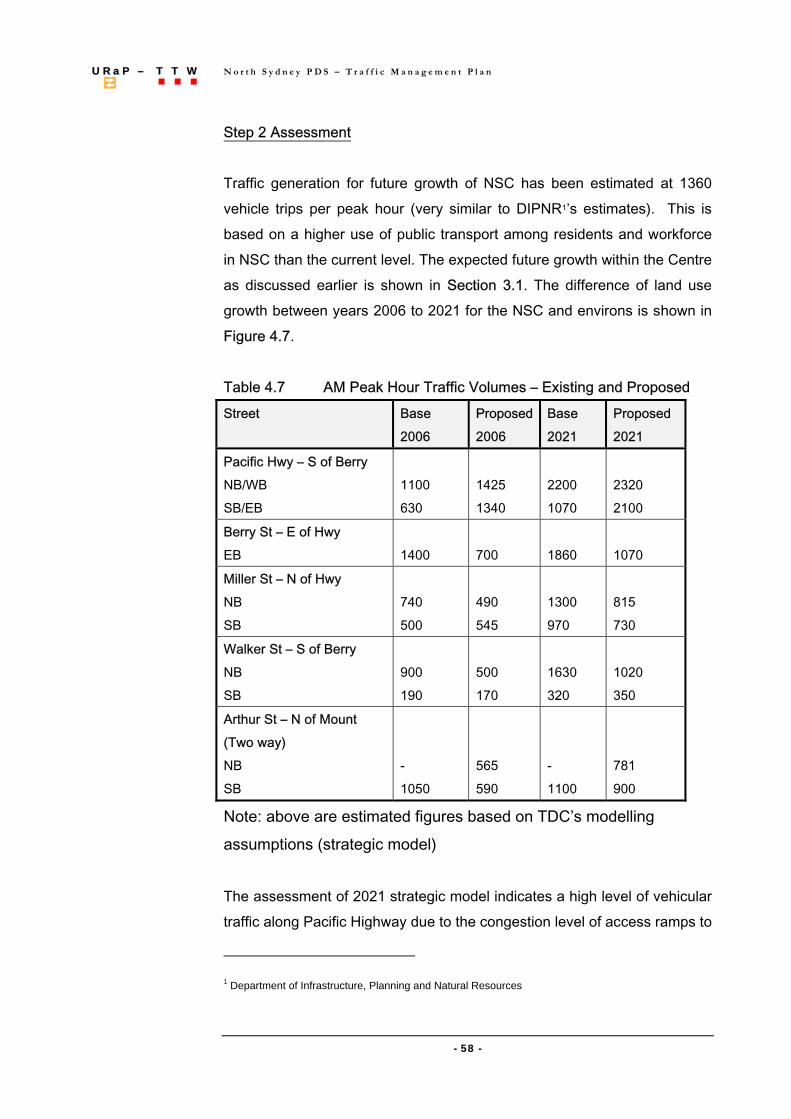
Step 2 Assessment Traffic generation for future growth of NSC has been estimated at 1360 vehicle trips per peak hour (very similar to DIPNR1’s estimates). This is based on a higher use of public transport among residents and workforce in NSC than the current level. The expected future growth within the Centre as discussed earlier is shown in Section 3.1. The difference of land use growth between years 2006 to 2021 for the NSC and environs is shown in Figure 4.7. Table 4.7 AM Peak Hour Traffic Volumes – Existing and Proposed
Street Base 2006
Proposed2006
Base 2021
Proposed 2021
Pacific Hwy – S of Berry NB/WB SB/EB
1100 630
1425 1340
2200 1070
2320 2100
Berry St – E of Hwy EB
1400
700
1860
1070
Miller St – N of Hwy NB SB
740 500
490 545
1300 970
815 730
Walker St – S of Berry NB SB
900 190
500 170
1630 320
1020 350
Arthur St – N of Mount (Two way) NB SB
- 1050
565 590
- 1100
781 900
Note: above are estimated figures based on TDC’s modelling assumptions (strategic model) The assessment of 2021 strategic model indicates a high level of vehicular traffic along Pacific Highway due to the congestion level of access ramps to
1 Department of Infrastructure, Planning and Natural Resources
UU RR aa PP –– TT TT WW N o r t h S y d n e y P D S – T r a f f i c M a n a g e m e n t P l a n.. .. ..
- 59 -
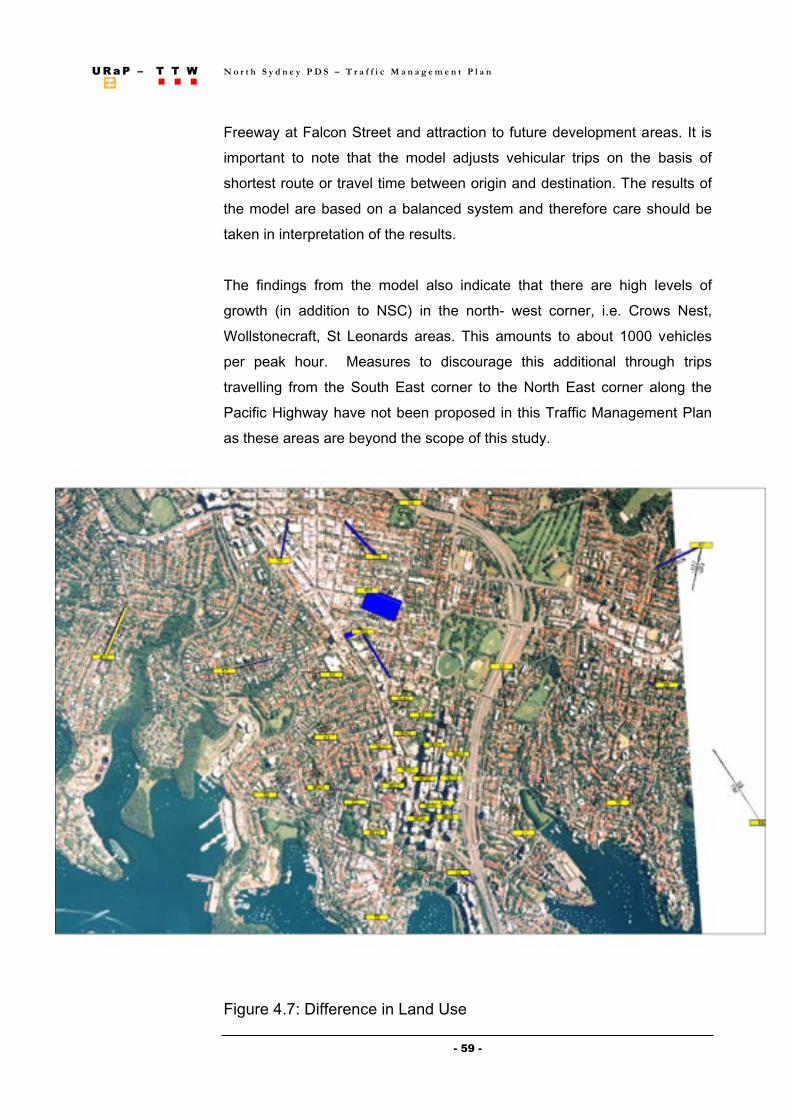
Freeway at Falcon Street and attraction to future development areas. It is important to note that the model adjusts vehicular trips on the basis of shortest route or travel time between origin and destination. The results of the model are based on a balanced system and therefore care should be taken in interpretation of the results. The findings from the model also indicate that there are high levels of growth (in addition to NSC) in the north- west corner, i.e. Crows Nest, Wollstonecraft, St Leonards areas. This amounts to about 1000 vehicles per peak hour. Measures to discourage this additional through trips travelling from the South East corner to the North East corner along the Pacific Highway have not been proposed in this Traffic Management Plan as these areas are beyond the scope of this study.
Figure 4.7: Difference in Land Use
UU RR aa PP –– TT TT WW N o r t h S y d n e y P D S – T r a f f i c M a n a g e m e n t P l a n.. .. ..
- 60 -
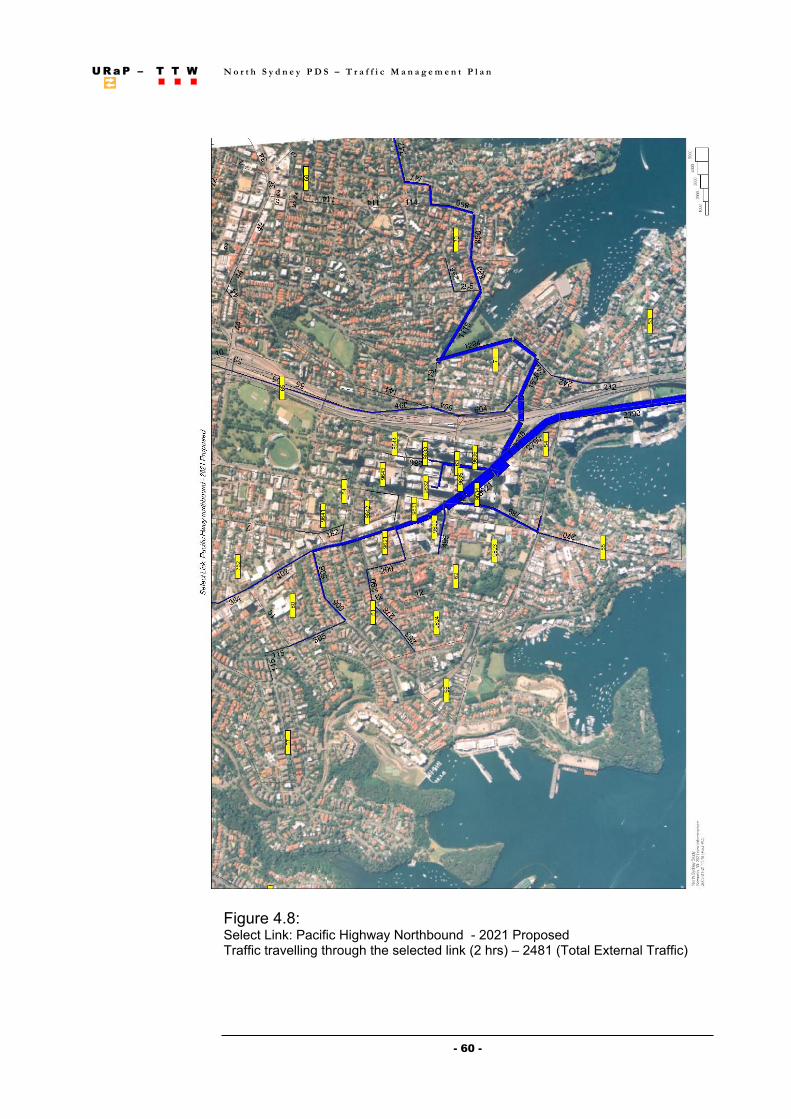
Figure 4.8:Select Link: Pacific Highway Northbound - 2021 Proposed Traffic travelling through the selected link (2 hrs) – 2481 (Total External Traffic)
UU RR aa PP –– TT TT WW N o r t h S y d n e y P D S – T r a f f i c M a n a g e m e n t P l a n.. .. ..
- 61 -
Overview
“In 1996, the population distribution in Sydney was 1.8 million people east of Parramatta (48%), 1.7million west of Parramatta (45%) and 260,000 on the Central Coast (7%). By 2021, with a forecast total Sydney Region population of 5 million people, the distribution would have shifted, with 2.25 million people east of Parramatta (45%), 2.35 million west of Parramatta (47%) and 400,000 on the Central Coast (8%).
The distribution of centres-based employment will also change. Employment in Parramatta could reach 100,000. In the east, over the next 40 years employment in North Sydney could reach 50,000, St Leonards 40,000, Chatswood 30,000 and the Airport/ former Central Industrial Area 90,000. In the west, Blacktown, Penrith and Liverpool could each reach 50,000 and Campbelltown, Castle Hill and Rouse Hill could range between 30,000 and 50,000 people”. (extract from a report on Traffic Growth in National Highway Corridor, 2003; based on data from TDC, DIPNR)
The above report also that “identifies longer term rail infrastructure enhancements to passenger (and freight) services may also be required to service growth beyond 2011 and this could include a new rail link through the Sydney CBD and North Sydney, between Eveleigh and St Leonards, to provide essential capacity relief for services on the entire suburban and inner city rail network.”
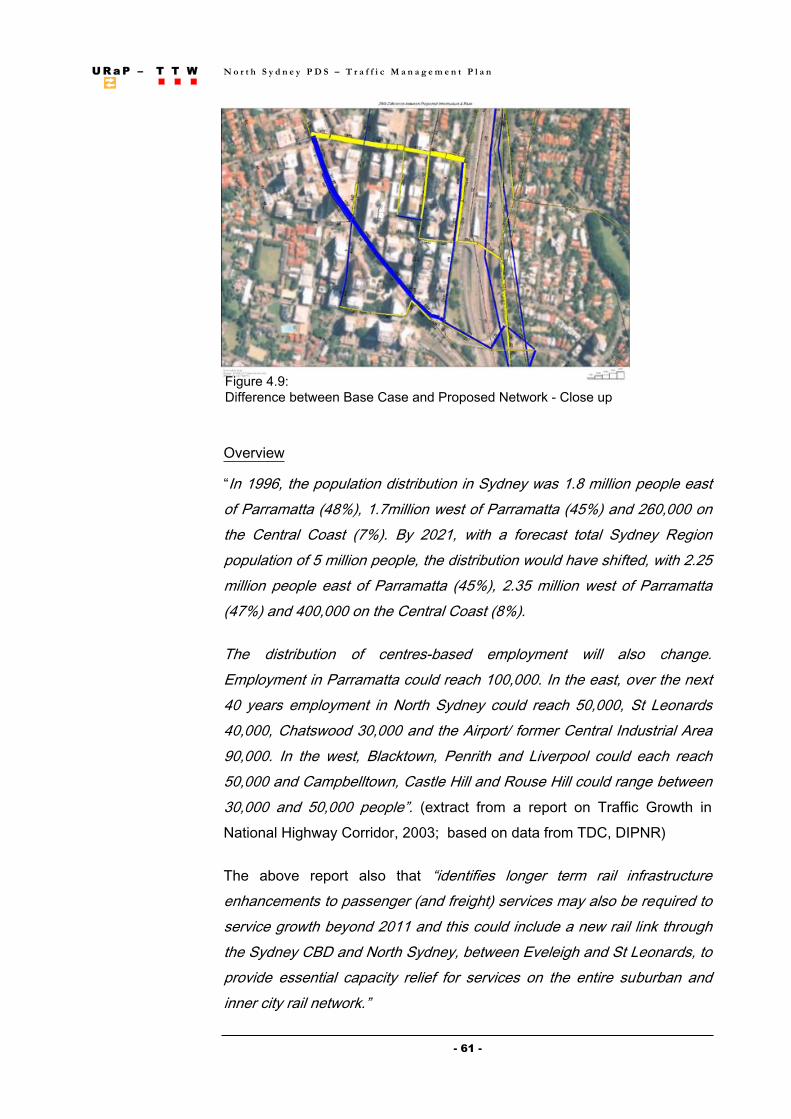
Figure 4.9:Difference between Base Case and Proposed Network - Close up
UU RR aa PP –– TT TT WW N o r t h S y d n e y P D S – T r a f f i c M a n a g e m e n t P l a n.. .. ..
- 62 -
4.4 Points of Consideration The following design issues have been investigated as part of the traffic management measures and are subject to further technical examination. Preliminary concept plans of these schemes are shown in AAppppeennddiixx AA. Option Analysis Further assessments of the road network have been carried out to analyse the impact of banning the existing right turn from Miller Street onto Berry Street. The results of these analyses indicate that while such ban could be accommodated, a lower level of service on some movements (e.g. right turns from Miller Street onto Pacific Highway) will be experienced. An option has also been explored to introduce a right turn from Pacific Highway onto McLaren Street with no right turns from Miller Street onto Berry Street. The implementation of this measure appears to be viable with minimal impact on intersection operation, considering a queue length of 50m for right turns from Pacific Highway (about 200 vph) onto McLaren Street would be provided. Pacific Highway/Arthur Street/High Street (signalised) Due to the proposed traffic management changes and to encourage more use of Arthur Street, provision of two right turns from High Street (from east to north) onto Arthur Street and one though lane from High Street to Pacific Highway is considered. The existing two left turns from Pacific Highway onto Arthur Street including a bus lane will be maintained. Mount and Arthur Streets Intersections (signalised) Introduction of two way traffic movements along Arthur Street between Mount and Berry Streets will require re-arrangement/design of the intersection at
U R a P – T T W N o r t h S y d n e y P D S – T r a f f i c M a n a g e m e n t P l a n . . .
- 63 -
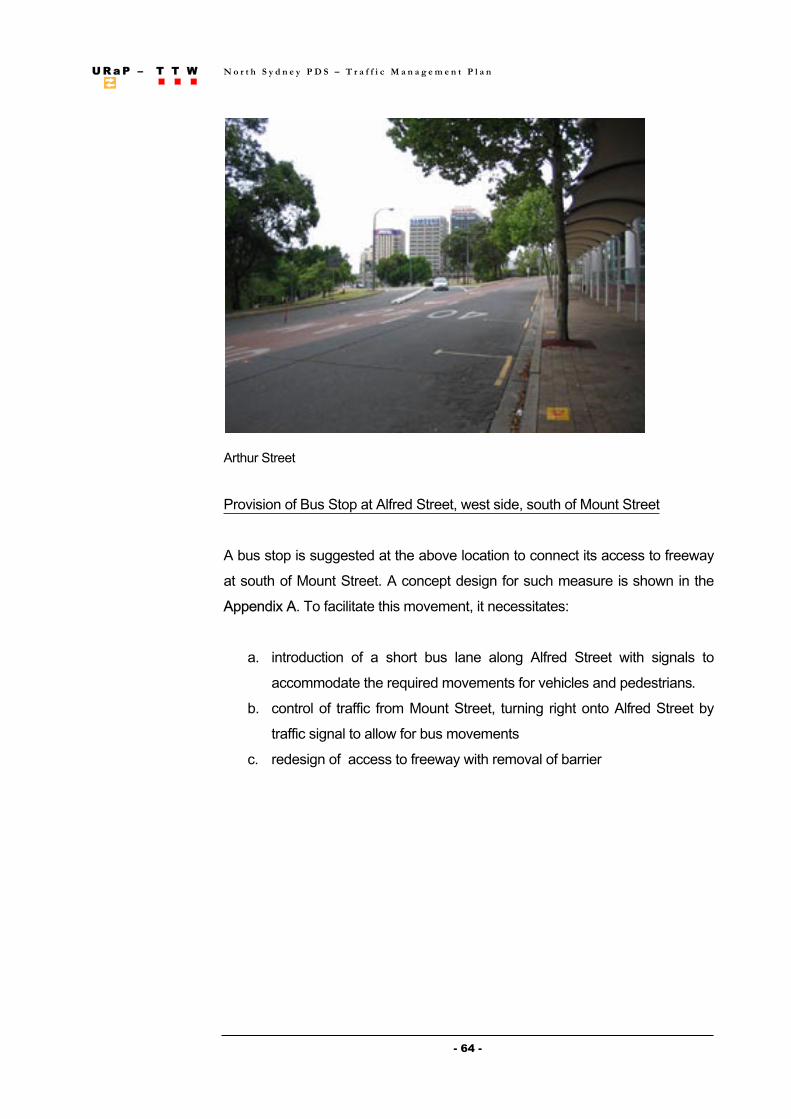
Mount and Arthur Streets. As part of this proposal, four lanes of traffic (northbound) along Arthur Street between Pacific Highway and Mount Street will be established. Three of these lanes will turn right at Mount Street (bridge over Freeway) including one far eastern lane turning right onto the ramp and one for bus lane (AM Peak only). A lane for through and left turn movements will be provided. Arthur Street, between Berry and Mount Streets will comprise of three traffic lanes; one lane for northbound traffic movements with green time at all the time with the exception of pedestrian phase when activated and two southbound lanes turning left onto Mount Street (bridge over Freeway). Berry and Arthur Streets Intersection Signalisation of this intersection will accommodate the introduction of northbound traffic from Arthur Street onto Freeway. The area on eastern section of this intersection will facilitate the provision of this measure. Traffic lanes (eastbound) from Berry Street (east of Walker Street) will continue to have similar configuration as the existing situation. Provision of Bus Stop at Arthur Street Introduction of a bus stop on Arthur Street, north of Pacific Highway has been investigated. This measure could be accommodated by use/indent of a section of the traffic island at intersection of Arthur Street with Pacific Highway. The main safety issue at this location is close proximity of the proposed bus stop to vehicular traffic coming from Pacific Highway (southbound) turning left onto Arthur Street. Further, design investigation is required to ascertain the proposed concept design as shown in Appendix A. Another bus stop location along Arthur Street, south of Berry Street has also been introduced for further design investigation.
UU RR aa PP –– TT TT WW N o r t h S y d n e y P D S – T r a f f i c M a n a g e m e n t P l a n.. .. ..
- 64 -
Arthur Street Provision of Bus Stop at Alfred Street, west side, south of Mount Street A bus stop is suggested at the above location to connect its access to freeway at south of Mount Street. A concept design for such measure is shown in the AAppppeennddiixx AA. To facilitate this movement, it necessitates:
a. introduction of a short bus lane along Alfred Street with signals to
accommodate the required movements for vehicles and pedestrians. b. control of traffic from Mount Street, turning right onto Alfred Street by
traffic signal to allow for bus movements c. redesign of access to freeway with removal of barrier
U R a P – T T W N o r t h S y d n e y P D S – T r a f f i c M a n a g e m e n t P l a n . . .
- 65 -
4.5 Summary The preliminary assessment of road network within the NSC indicates that the proposed traffic management measures are feasible and also have a positive impact on the operation of the road network. A more detailed analysis would be required to fully assess the proposed measures in a wider road network environment. The proposed traffic management plan for NSC: Provides better facilities and routes for bus services.
Saves travel time for bus travellers in order of $160,000 per annum (based
on one hour peak time, bus stop frequencies on weekdays only). Reduces the level of vehicular traffic along streets within the Centre.
Reduces the level of pollution and fuel consumption.
Produces economic benefits for the community by providing better traffic
management system. Reduces level of vehicle kilometres travelled in comparison to the existing
traffic management system. Ensures pedestrian facilities and amenities within the Centre’s route
system.