Embed Size (px)
Citation preview
65
4.0 RESULTS AND DISCUSSION
4.1 Introduction
This chapter describes in detail the test results of thermal stability, surface morphology,
fire protection performance and bonding strength of the intumescent samples by using
TGA, SEM, FESEM, Bunsen burner test, furnace test and Instron microtester as
mentioned in the previous chapter. All the sections in this chapter are arranged
according to the process of formulation and characterization of the intumescent samples.
4.2 Investigation of Flame Retardant Additives
Based on the literature review in chapter two, flame retardant additives such as
polyphosphate, boric acid, tri(3,4-epoxycyclohexylmethyl) phosphate (TECP), urea
phosphate tributyl phosphate, guanidine and chlorinated paraffins were used to prepare
the intumescent fire protective coatings to protect the underlying substrate in the event
of a fire (Rains, 1994; Wang et al., 2009). In this research, the combination of three
main environmentally friendly and halogen-free flame retardant additives i.e. (i)
ammonium polyphosphate phase II (APP II), (ii) pentaerythritol (PER) and (iii)
melamine (MEL) with different composition ratios were adopted. TGA test was
conducted to investigate the thermal stability of the selected flame retardant additives.
4.2.1 Thermal Stability of AMP System
Four formulations of AMP systems were studied in this research study i.e. (i) A1, (ii)
A2, (iii) A3 and (iv) A4. APP II acts as an acid source, MEL acts as a blowing agent
and PER acts as a carbon source. The intumescent coatings which contain APP II
will start to decompose when exposed to an accidental fire or heat, commonly into
66
polymeric phosphoric acid and ammonia (NH3). Additions of synergetic products
like PER and MEL derivatives will significantly improve the flame retardant
performance of APP II.
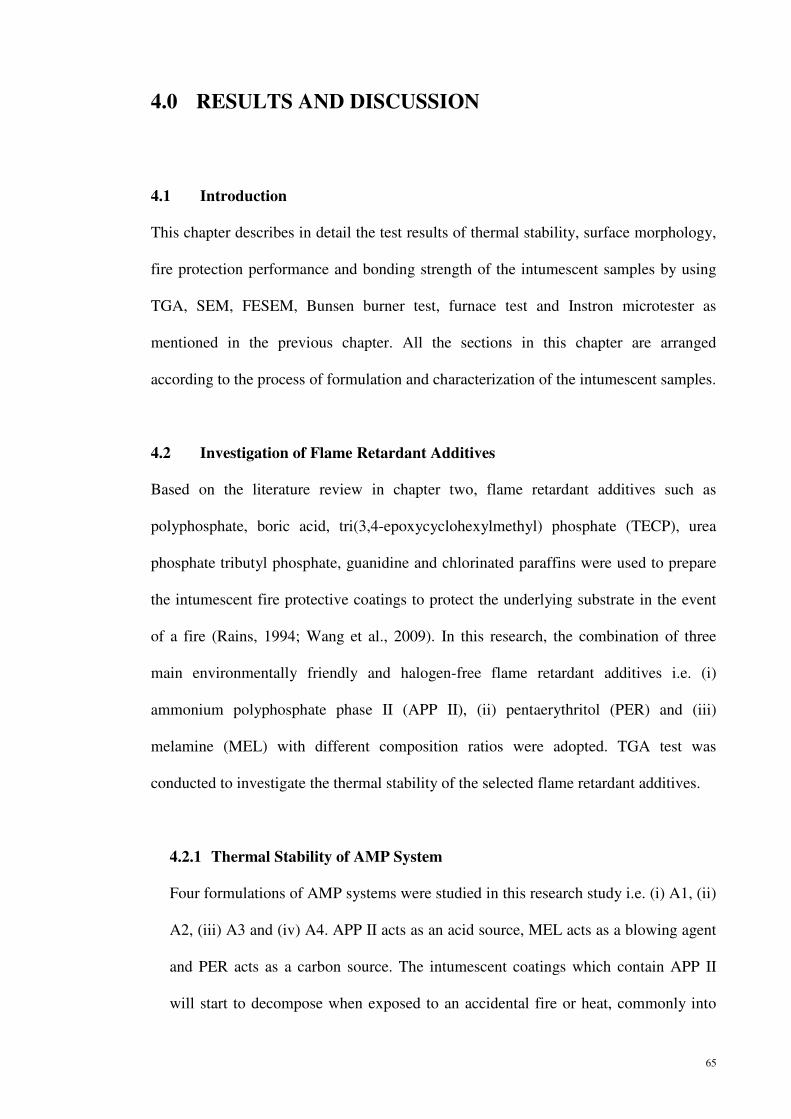
The TGA curves of the four AMP systems showed similar profiles (as shown in
Figure 4.1). When the temperature exceeds 215°C, there was a sharp decrease in
residual weight.
Figure 4.1 TGA curves of the AMP system
The decomposition of all samples occurred between temperatures of 215°C to 640°C.
In this study, only the sample with the highest thermal stability was selected and its
chemical and physical mechanism studied. The highest residual weight of sample A2
indicated that the formulation had the best anti-oxidation and highest thermal
stability under air flow compared to the other samples. The detailed chemical and
Res
idu
al
wei
gh
t (w
t%)
Temperature (°C)
67
physical mechanism of sample A2 is explained based on the decomposition
temperature of each flame retardant agent.
The thermal stability characteristics of sample A2 are presented in Table 4.1. The
thermal degradation of sample A2 occurs in three main steps: the first step between
215°C and 310°C, corresponding to a residual weight of 90 wt.%. In the first step, 10
wt.% mass loss was due to dehydration and fusion of PER. The first step of
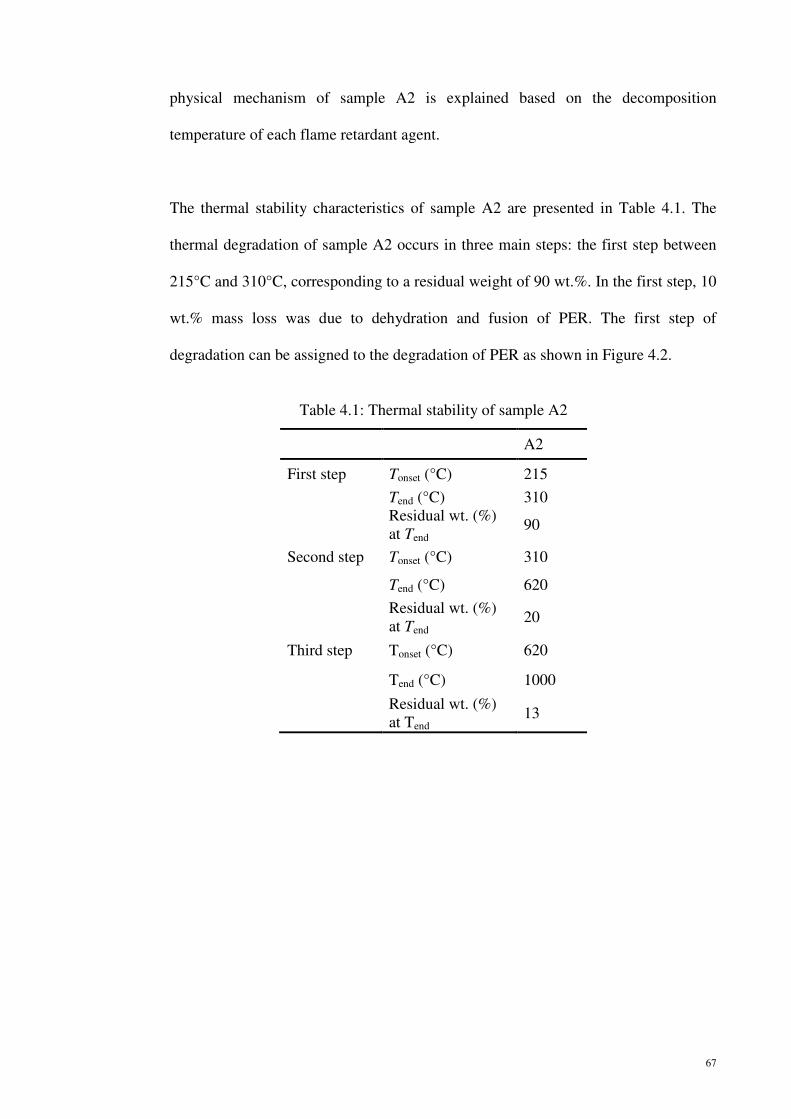
degradation can be assigned to the degradation of PER as shown in Figure 4.2.
Table 4.1: Thermal stability of sample A2
A2
First step Tonset (°C) 215
Tend (°C) 310
Residual wt. (%)
at Tend 90
Second step Tonset (°C) 310
Tend (°C) 620
Residual wt. (%)
at Tend 20
Third step Tonset (°C) 620
Tend (°C) 1000
Residual wt. (%)
at Tend 13
68
Figure 4.2 TGA curve of pentaerythritol
The second step occurs between 310°C and 600°C corresponding to a residual
weight of 20 wt.%. This step may partly correspond to the polyphosphate
decomposing to phosphoric acid, ammonia (NH3) and water (H2O) resulting in char
formation (Bourbigot et al., 1995; Kandola and Horrocks, 1996; Richard et al.,
1996). There is also the possibility of polyphosphoric acid formation from
phosphoric acid with the release of H2O vapour and NH3 from the APP II (Horrocks
et al., 2005). In fact, APP II begins to lose NH3 at a temperature slightly above
300°C (as shown in Figure 4.3), resulting in a highly condensed polyphosphoric acid
(Camino et al., 1991). This step also corresponds to the degradation of the coating
agent of the APP II derivative, which contains nitrogenous and carbonaceous species.

69
Figure 4.3 TGA curve of ammonium polyphosphate phase II
Then, a thermally stable material is formed that degrades from 600°C up to 800°C in
the third step and results in a residue of about 13 wt.%. APP II forms a
phosphocarbon structure that is thermally stable. This stabilized residue acts as a
protective thermal barrier during the intumescent fire retardancy process. MEL, the
third constituent of the intumescent formulation which acts as a blowing agent starts
releasing NH3 at temperature 300°C and this continues up to 400°C as shown in
Figure 4.4. As a result, swelling of the intumescent coating takes place.
Figure 4.4 TGA curve of melamine
70
4.3 Investigation of Flame Retardant Fillers
Presently, intumescent coating industries use alumina trihydrate (ATH), titanium
dioxide (TiO2) or magnesium hydroxide Mg(OH)2 as flame retardant fillers. Particulate
fillers can strongly influence the combustion characteristics of intumescent coatings,
including its resistance to ignition, and the extent and nature of smoke and toxic gas
emission products. This may result from simple dilution of the combustible fuel source,
slowing down the diffusion rate of oxygen and flammable pyrolysis products and
changing the melt rheology of the coatings, thereby affecting its tendency to drip.
However, depending on the nature of the filler, the heat capacity, thermal conductivity
and emissivity of the intumescent composition may also change, giving rise to heat
transfer and thermal reflectivity effects, which can also slow the rate of burning.
Bellayer and his coworkers (2009) have been investigated the intumescent behaviour of
linear low-density polyethylene (LLDPE) containing calcium carbonate (CaCO3) (chalk)
as mineral filler treated by stearic acid. CES is an industrial byproduct containing 95 %
CaCO3, and its disposal constitutes a serious environmental hazard (Toro et al., 2007).
Recycling useful industrial by-products such as CES helps to prevent accumulation of
wastes, thus decreasing land pollution. Using an aviculture by-product CES as flame
retardant filler in the intumescent coating results in an environmentally friendly
invention that not only protects human lives but also preserves the environment. In this
experimental work, the thermal stability of CES and commercial CaCO3 were compared
and studied.
4.3.1 Thermal Stability of CES and Calcium Carbonate
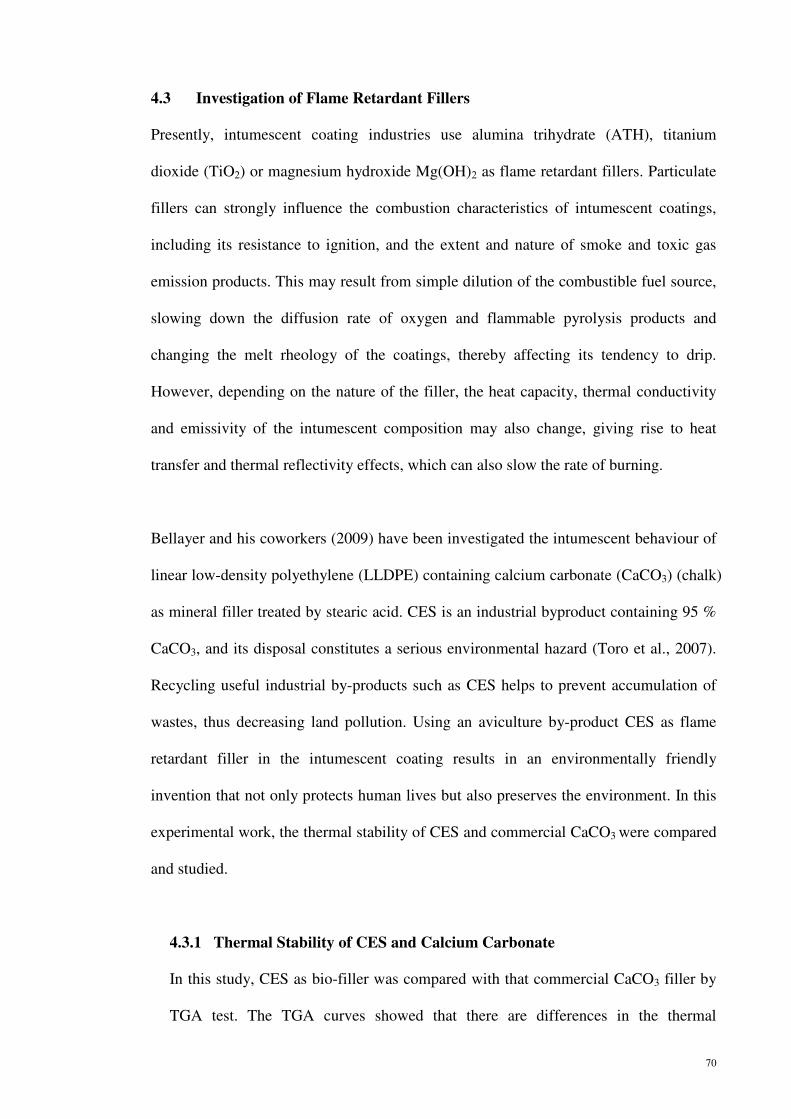
In this study, CES as bio-filler was compared with that commercial CaCO3 filler by
TGA test. The TGA curves showed that there are differences in the thermal
71
decomposition of CES and commercial CaCO3 as shown in Figure 4.5. Commercial
CaCO3 has only one stage of thermal degradation, whereas CES has two stages (as
shown in Table 4.2). For CES, the first stage of thermal degradation occurs between
the temperatures of 300°C to 790°C where weight loss is about 7 wt.% due to
dehydration of the CES. The second stage which occurred between the temperatures
of 790°C to 907°C shows 39 wt.% of mass loss due to the formation of calcium
oxide (CaO) and the release of carbon dioxide (CO2). The thermal degradation of
commercial CaCO3 which occurs between temperatures of 742°C to 850°C shows
53.5 wt.% residual weight. The temperature for 10 wt.% weight loss of CES and
commercial CaCO3 are 810°C and 770°C respectively. Furthermore, CES
decomposes completely at about 907°C and the commercial CaCO3 at around 850°C.
Hence, the temperature for complete decomposition of CES is higher than that of
commercial CaCO3. Moreover, the residue left for CES and commercial CaCO3 at
1000°C were almost the same, at 53.0 wt.% and 53.5 wt.% respectively. This proves
that the CES had better thermal stability compared to commercial CaCO3.
Figure 4.5 TGA curves of chicken eggshell and commercial CaCO3
72
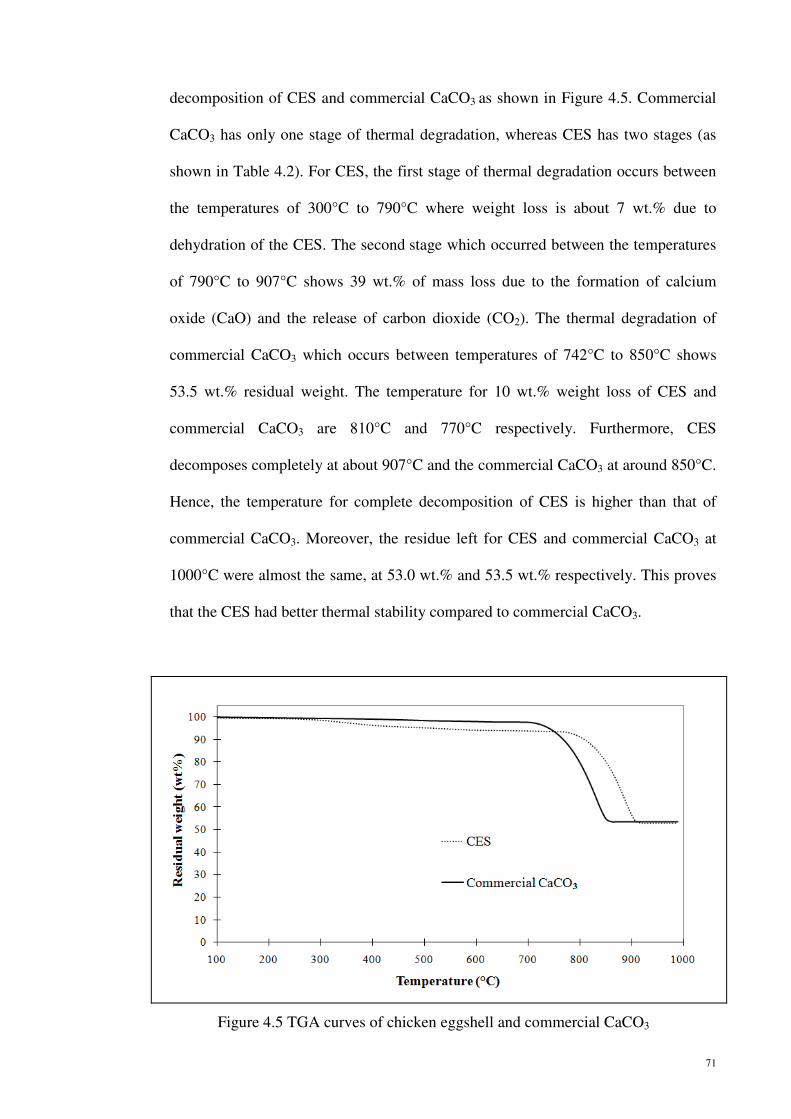
Table 4.2: Thermal stability of CES and commercial CaCO3
Commercial CaCO3 CES
First step Tonset (°C) 742 300
Tend (°C) 850 790
Residual wt. (%)
at Tend 53.5 93
Second step Tonset (°C) 790
Tend (°C) 907
Residual wt. (%)
at Tend 53.0
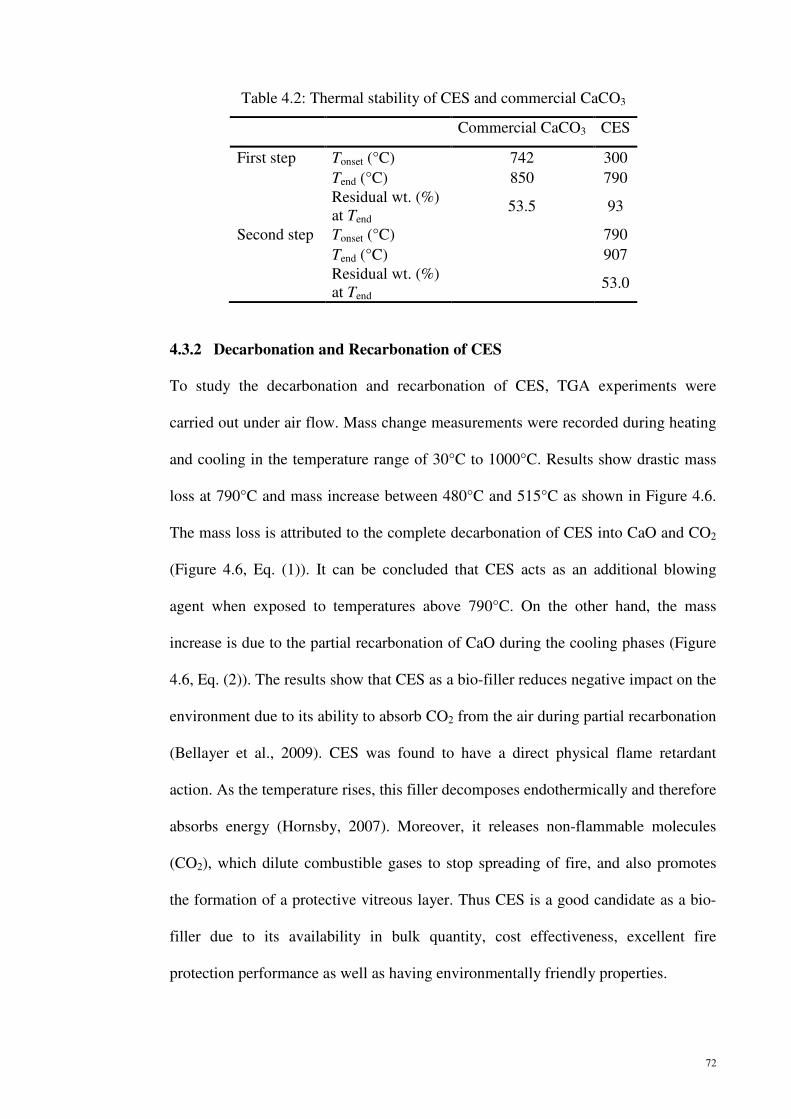
4.3.2 Decarbonation and Recarbonation of CES
To study the decarbonation and recarbonation of CES, TGA experiments were
carried out under air flow. Mass change measurements were recorded during heating
and cooling in the temperature range of 30°C to 1000°C. Results show drastic mass
loss at 790°C and mass increase between 480°C and 515°C as shown in Figure 4.6.
The mass loss is attributed to the complete decarbonation of CES into CaO and CO2
(Figure 4.6, Eq. (1)). It can be concluded that CES acts as an additional blowing
agent when exposed to temperatures above 790°C. On the other hand, the mass
increase is due to the partial recarbonation of CaO during the cooling phases (Figure
4.6, Eq. (2)). The results show that CES as a bio-filler reduces negative impact on the
environment due to its ability to absorb CO2 from the air during partial recarbonation
(Bellayer et al., 2009). CES was found to have a direct physical flame retardant
action. As the temperature rises, this filler decomposes endothermically and therefore
absorbs energy (Hornsby, 2007). Moreover, it releases non-flammable molecules
(CO2), which dilute combustible gases to stop spreading of fire, and also promotes
the formation of a protective vitreous layer. Thus CES is a good candidate as a bio-
filler due to its availability in bulk quantity, cost effectiveness, excellent fire
protection performance as well as having environmentally friendly properties.
73
Figure 4.6 TGA graphs of CES at 20°C/min heating and cooling ramp under air flow
and chemical changes that occurred during the two ramps
4.4 Fire Protection Test of Intumescent Coatings on Steel
During the Bunsen burner test, the evolution of temperature on the back of the coated
steel plate as a function of time was recorded and investigated. The temperatures were
measured using a digital thermometer which was connected to a thermocouple on the
back of the steel plates coated with the different formulations.
Subsequently, four different samples of each coating system (AMP+SF, AMP+SF+CES
and AMP+SF+CES+ER) were tested and the time-temperature curves were plotted. The
samples were subjected to a high temperature flame (about 1000°C) using a Bunsen
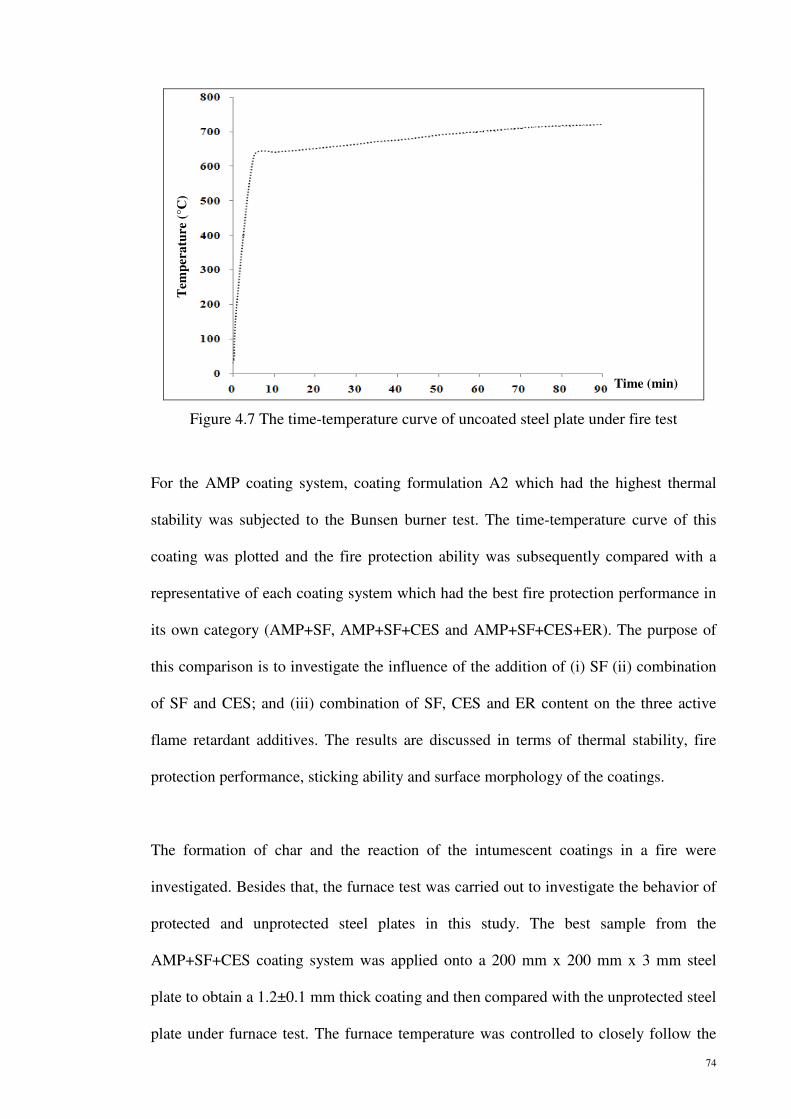
burner. The temperature evolution of a steel plate without protection (Figure 4.7) was
also tested as a control for the purpose of comparison.
Res
idu
al
wei
gh
t (w
t%)
Tem
per
atu
re (
°C)
Time (s)
CES mass variation
Temperature ramps
Eq2: partial
recarbonation
CaO +CO2 →
CES
Eq1: total
decarbonation
CES + T°C →
CaO +CO2
74
Figure 4.7 The time-temperature curve of uncoated steel plate under fire test
For the AMP coating system, coating formulation A2 which had the highest thermal
stability was subjected to the Bunsen burner test. The time-temperature curve of this
coating was plotted and the fire protection ability was subsequently compared with a
representative of each coating system which had the best fire protection performance in
its own category (AMP+SF, AMP+SF+CES and AMP+SF+CES+ER). The purpose of
this comparison is to investigate the influence of the addition of (i) SF (ii) combination
of SF and CES; and (iii) combination of SF, CES and ER content on the three active
flame retardant additives. The results are discussed in terms of thermal stability, fire
protection performance, sticking ability and surface morphology of the coatings.
The formation of char and the reaction of the intumescent coatings in a fire were
investigated. Besides that, the furnace test was carried out to investigate the behavior of
protected and unprotected steel plates in this study. The best sample from the
AMP+SF+CES coating system was applied onto a 200 mm x 200 mm x 3 mm steel
plate to obtain a 1.2±0.1 mm thick coating and then compared with the unprotected steel
plate under furnace test. The furnace temperature was controlled to closely follow the
Time (min)
Tem
per
atu
re (
°C)

75
Eurocode parametric standard temperature-time curve as described in Eurocode 1 part
1-2 (EC1, 2002).
4.4.1 AMP+SF Coating System
Four types of AMP+SF coating systems were studied i.e. (i) B1, (ii) B2, (iii) B3 and
(iv) B4. During the Bunsen burner test, the temperature of the back side of the steel
plate was plotted as a function of time (Figure 4.8) and the influence of SF content
on the fire protection of coatings was evaluated.
Figure 4.8 Evolution of temperature on the back of the steel plates of AMP+SF system
Table 4.3: Char thickness and equilibrium temperature of AMP+SF coating system
Sample Thickness of char layer (mm) Equilibrium temperature of coating (ºC)
B1 * > critical temperature
B2 24.4 240
B3 20.6 305
B4 18.1 388
* The coating did not adhere to the steel plate during Bunsen burner test
During the first 10 minutes, there was not much difference in the temperature of each
coating. The shape of the temperature profiles was almost similar for all the coatings
Time (min)
Tem
per
atu
re (
°C)
76
between the temperatures of 30°C to 250°C. Twenty minutes into the test, the
temperature profiles of the 4 systems started to differ from each other. The
temperature of sample B1 increased rapidly after 20 minutes of the fire test. This
phenomenon is due to insufficient content of SF binder that holds the formation of
char layer on the steel plate. As a result, some of the char detached from the plate
during testing. Poor adhesion of coating B1 to the steel plate led to its inability to
protect the steel plate during fire.
The temperature of sample B2 reached an equilibrium value at about 240°C after 33
minutes of fire testing and remained almost unchanged thereafter. Sample B2
showed improvement in fire protection performance compared to sample B1 which
reached a maximum temperature of 455°C after exposure to 90 minutes of fire. The
addition of 10 wt.% of SF as a binder in sample B2 permits continuous adhesion
between the coating and steel plate, providing longer-lasting fire protection.
The experimental results showed that the equilibrium temperatures of B2, B3 and B4
were 240°C, 305°C and 388°C respectively. This indicates that the increase in SF
content leads to the increase in the equilibrium temperature of the coatings. The
increase of SF content hinders the mechanism of intumescence which in turn reduces
the fire protection ability of the coating. The addition of 10 wt.% of SF was found to
be optimal for effective fire protection as it enables adhesion of the coating on the
steel plate without compromising on the performance of the coating.
The thickness of the char layer of each system was measured after burning (Table 4.3)
and it was found that there was a correlation between thickness of the char layer and
equilibrium temperature. The thicker the char layer, the lower the equilibrium
77
temperature. This shows that the thickness of the char layer correlates with the fire
protection performance of the coating.
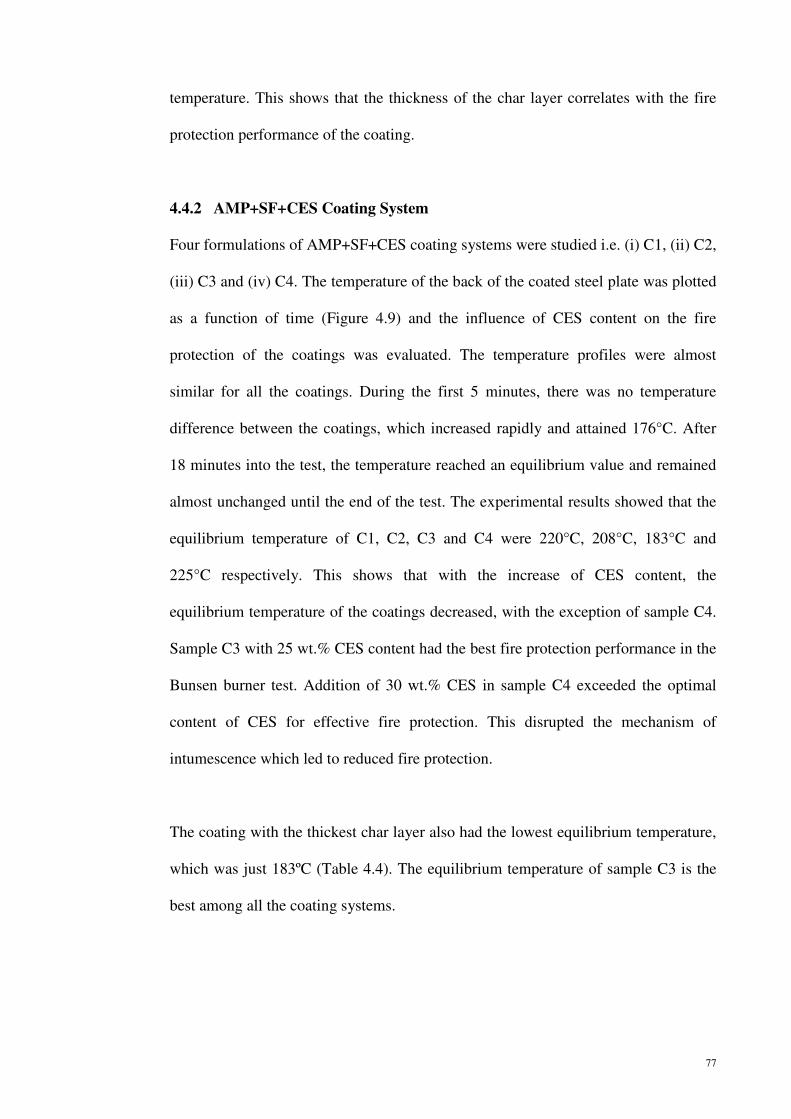
4.4.2 AMP+SF+CES Coating System
Four formulations of AMP+SF+CES coating systems were studied i.e. (i) C1, (ii) C2,
(iii) C3 and (iv) C4. The temperature of the back of the coated steel plate was plotted
as a function of time (Figure 4.9) and the influence of CES content on the fire
protection of the coatings was evaluated. The temperature profiles were almost
similar for all the coatings. During the first 5 minutes, there was no temperature
difference between the coatings, which increased rapidly and attained 176°C. After
18 minutes into the test, the temperature reached an equilibrium value and remained
almost unchanged until the end of the test. The experimental results showed that the
equilibrium temperature of C1, C2, C3 and C4 were 220°C, 208°C, 183°C and
225°C respectively. This shows that with the increase of CES content, the
equilibrium temperature of the coatings decreased, with the exception of sample C4.
Sample C3 with 25 wt.% CES content had the best fire protection performance in the
Bunsen burner test. Addition of 30 wt.% CES in sample C4 exceeded the optimal
content of CES for effective fire protection. This disrupted the mechanism of
intumescence which led to reduced fire protection.
The coating with the thickest char layer also had the lowest equilibrium temperature,
which was just 183ºC (Table 4.4). The equilibrium temperature of sample C3 is the
best among all the coating systems.
78
Figure 4.9 Evolution of temperature on the back of the steel plates of AMP+SF+CES
system
Table 4.4: Char thickness and equilibrium temperature of AMP+SF+CES coating
system
Sample Thickness of char layer (mm) Equilibrium temperature of coating (ºC)
C1 31.9 220
C2 37.3 208
C3 43.9 183
C4 30.4 225
4.4.3 AMP+SF+CES+ER Coating System
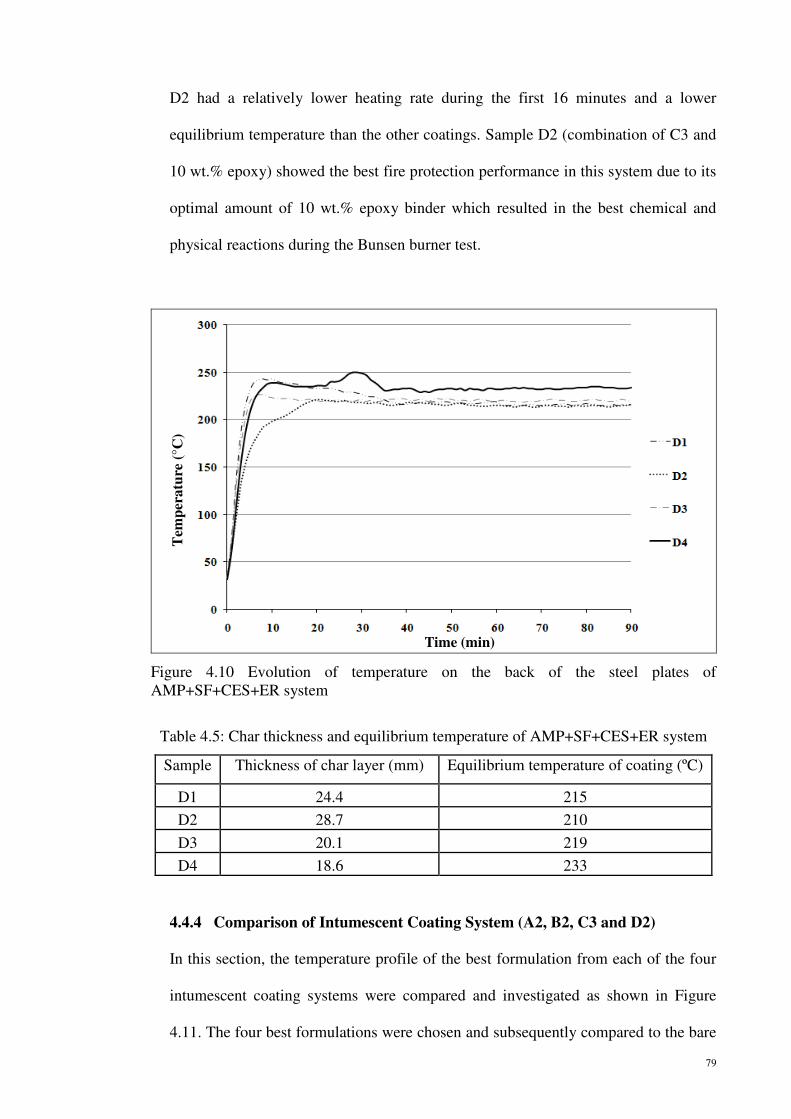
Four formulations of AMP+SF+CES+ER coatings (marked as D1-D4) were studied
using the fire protection test. During the test, the temperature of the back of the
coated steel plates were plotted as a function of time (as shown in Figure 4.10) and
the influence of epoxy content on the fire protection performance of coatings was
evaluated. The curves of the temperature profiles were similar for coatings D1, D3
and D4. During the first 5 minutes, there was no difference in temperature for D1,
D3 and D4, and the temperature increased rapidly and reached about 200°C. The
experimental results showed that the equilibrium temperature of D1, D2, D3 and D4
were 215°C, 210°C, 219°C and 233°C respectively as shown in Table 4.5. Sample
Time (min)
Tem
per
atu
re (
°C)
79
D2 had a relatively lower heating rate during the first 16 minutes and a lower
equilibrium temperature than the other coatings. Sample D2 (combination of C3 and
10 wt.% epoxy) showed the best fire protection performance in this system due to its
optimal amount of 10 wt.% epoxy binder which resulted in the best chemical and
physical reactions during the Bunsen burner test.
Figure 4.10 Evolution of temperature on the back of the steel plates of
AMP+SF+CES+ER system
Table 4.5: Char thickness and equilibrium temperature of AMP+SF+CES+ER system
Sample Thickness of char layer (mm) Equilibrium temperature of coating (ºC)
D1 24.4 215
D2 28.7 210
D3 20.1 219
D4 18.6 233
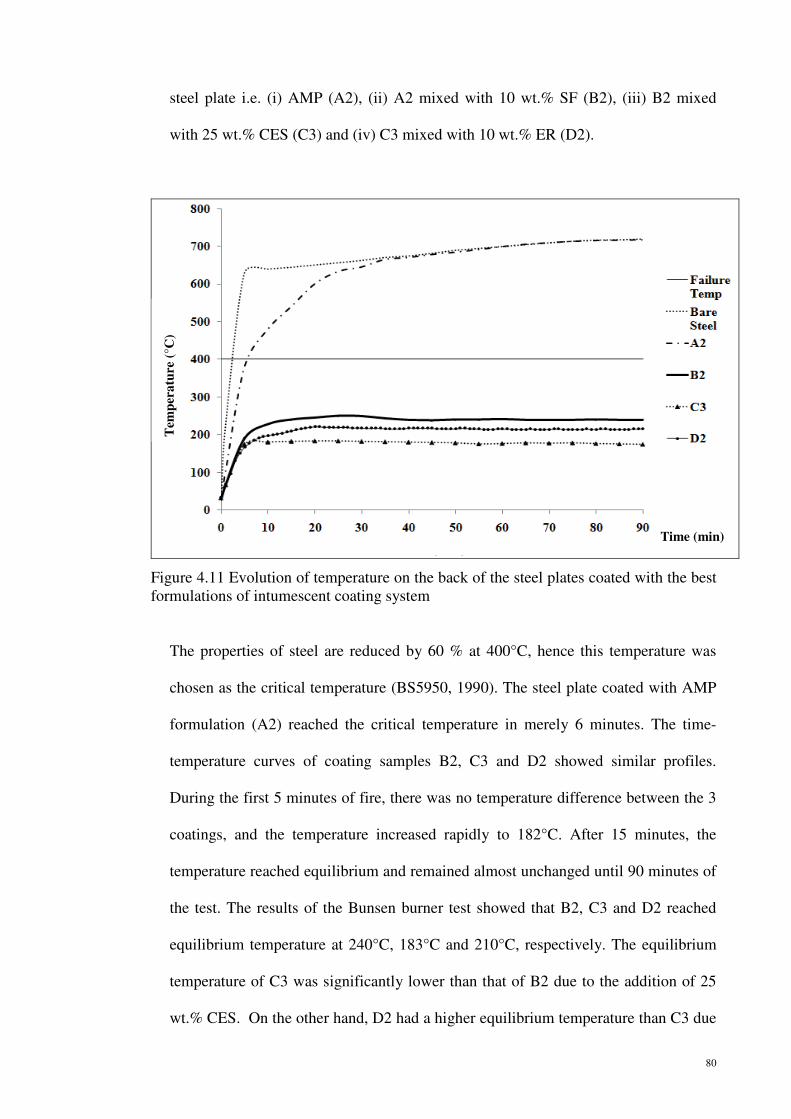
4.4.4 Comparison of Intumescent Coating System (A2, B2, C3 and D2)
In this section, the temperature profile of the best formulation from each of the four
intumescent coating systems were compared and investigated as shown in Figure
4.11. The four best formulations were chosen and subsequently compared to the bare
Tem
per
atu
re (
°C)
Time (min)
80
steel plate i.e. (i) AMP (A2), (ii) A2 mixed with 10 wt.% SF (B2), (iii) B2 mixed
with 25 wt.% CES (C3) and (iv) C3 mixed with 10 wt.% ER (D2).
Figure 4.11 Evolution of temperature on the back of the steel plates coated with the best
formulations of intumescent coating system
The properties of steel are reduced by 60 % at 400°C, hence this temperature was
chosen as the critical temperature (BS5950, 1990). The steel plate coated with AMP
formulation (A2) reached the critical temperature in merely 6 minutes. The time-
temperature curves of coating samples B2, C3 and D2 showed similar profiles.
During the first 5 minutes of fire, there was no temperature difference between the 3
coatings, and the temperature increased rapidly to 182°C. After 15 minutes, the
temperature reached equilibrium and remained almost unchanged until 90 minutes of
the test. The results of the Bunsen burner test showed that B2, C3 and D2 reached
equilibrium temperature at 240°C, 183°C and 210°C, respectively. The equilibrium
temperature of C3 was significantly lower than that of B2 due to the addition of 25
wt.% CES. On the other hand, D2 had a higher equilibrium temperature than C3 due
Tem
per
atu
re (
°C)
Time (min)
81
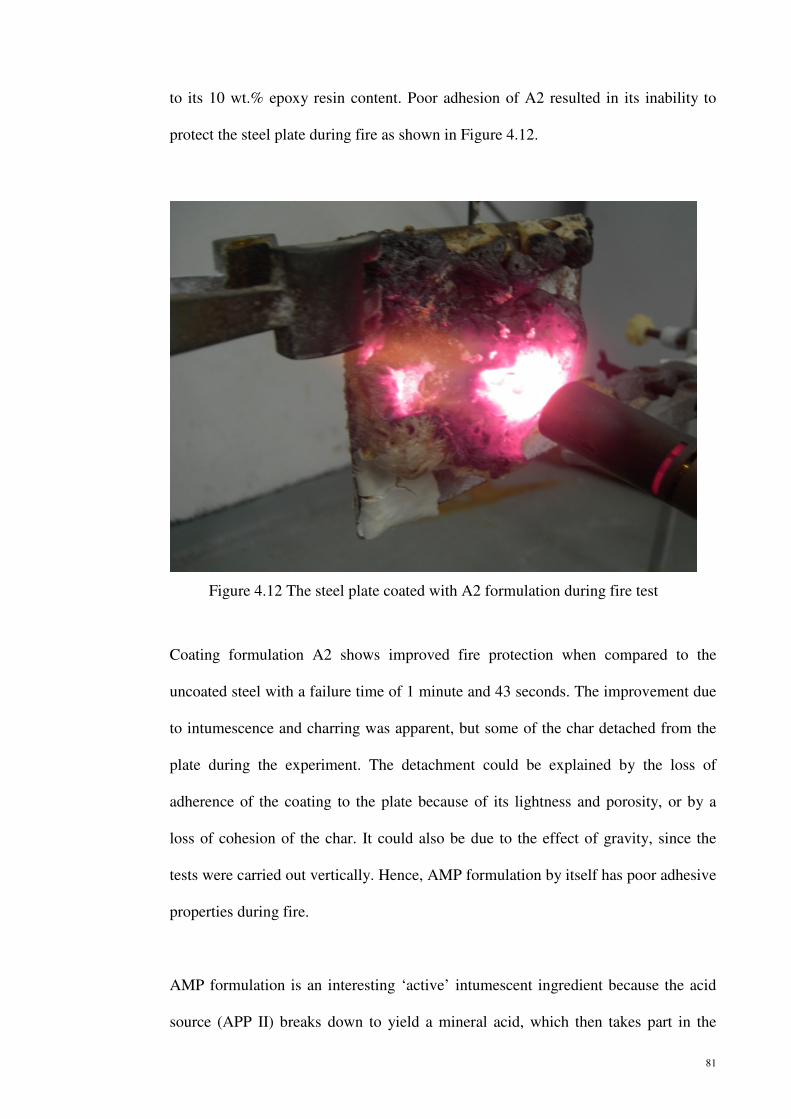
to its 10 wt.% epoxy resin content. Poor adhesion of A2 resulted in its inability to
protect the steel plate during fire as shown in Figure 4.12.
Figure 4.12 The steel plate coated with A2 formulation during fire test
Coating formulation A2 shows improved fire protection when compared to the
uncoated steel with a failure time of 1 minute and 43 seconds. The improvement due
to intumescence and charring was apparent, but some of the char detached from the
plate during the experiment. The detachment could be explained by the loss of
adherence of the coating to the plate because of its lightness and porosity, or by a
loss of cohesion of the char. It could also be due to the effect of gravity, since the
tests were carried out vertically. Hence, AMP formulation by itself has poor adhesive
properties during fire.
AMP formulation is an interesting ‘active’ intumescent ingredient because the acid
source (APP II) breaks down to yield a mineral acid, which then takes part in the
82
dehydration of the carbonization source (PER). This produces the carbon char and
finally, the blowing agent (MEL) decomposes to yield gaseous products, improving
the swelling. The latter causes the char to swell and produce the insulating multi-
cellular protective layer (Duquesne et al., 2004).
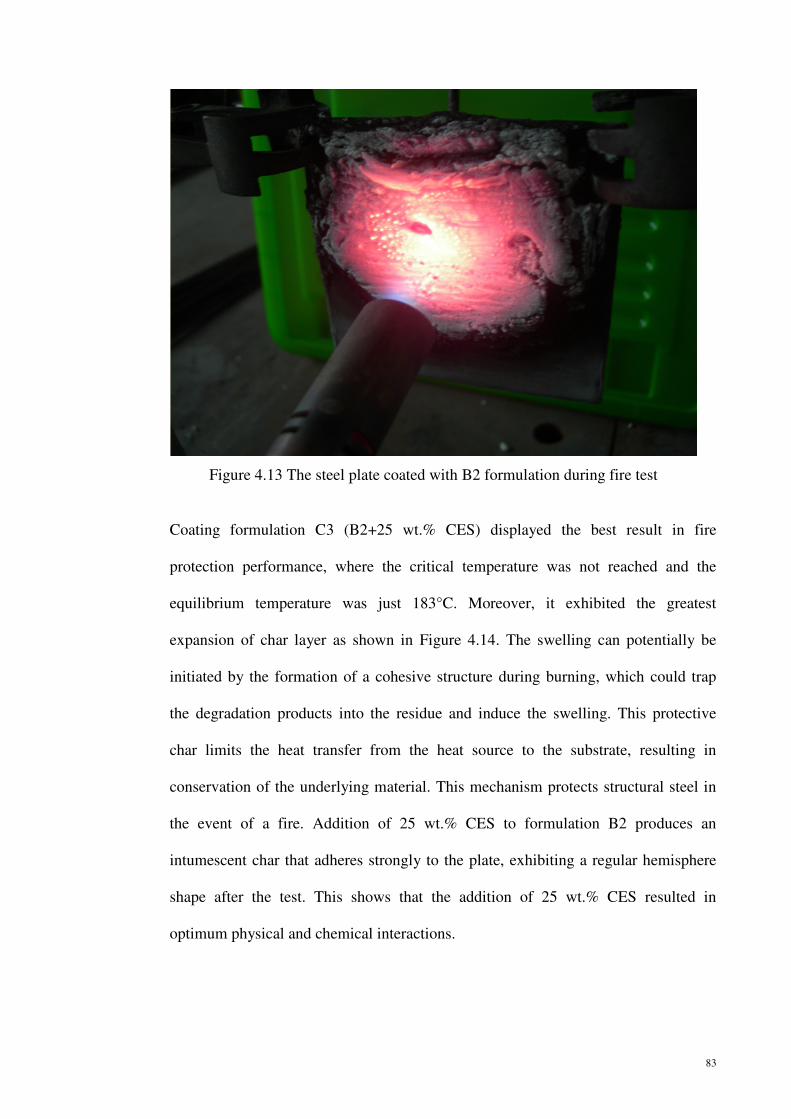
Coating formulation B2 (A2+10 wt.% SF) showed improvement in fire protection
performance compared to the AMP coating whereby the critical temperature was not
reached after exposure to 90 minutes of fire and the equilibrium temperature reached
was 250°C. The addition of 10 wt.% SF to formulation A2 resulted in excellent
adhesion onto the plate and showed improvement in thermal destabilization of the
intumescent coating as shown in Figure 4.13 (Jimenez et al., 2009; Wang and Shi,
2006). Development of intumescence was also observed and the char permits
continuous adhesion between the coating and steel plate, providing longer-lasting
protection. This char combines the positive effect of AMP and SF, promoting
adhesion to the steel and producing a very hard char while ensuring the formation of
a uniform foam structure (Wang and Yang, 2010). This suggests that physical and
chemical interactions have occurred, resulting in the superior mechanical resistance
of the char as well as its adhesion on the steel plate.
83
Figure 4.13 The steel plate coated with B2 formulation during fire test
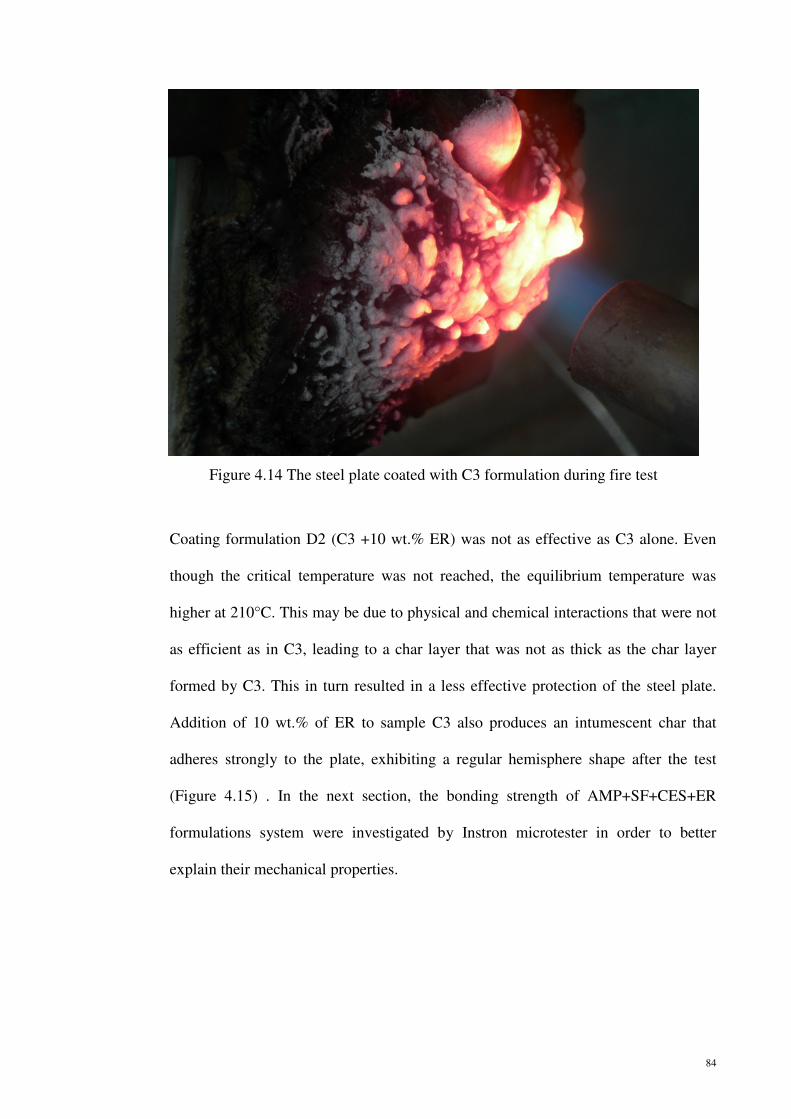
Coating formulation C3 (B2+25 wt.% CES) displayed the best result in fire
protection performance, where the critical temperature was not reached and the
equilibrium temperature was just 183°C. Moreover, it exhibited the greatest
expansion of char layer as shown in Figure 4.14. The swelling can potentially be
initiated by the formation of a cohesive structure during burning, which could trap
the degradation products into the residue and induce the swelling. This protective
char limits the heat transfer from the heat source to the substrate, resulting in
conservation of the underlying material. This mechanism protects structural steel in
the event of a fire. Addition of 25 wt.% CES to formulation B2 produces an
intumescent char that adheres strongly to the plate, exhibiting a regular hemisphere
shape after the test. This shows that the addition of 25 wt.% CES resulted in
optimum physical and chemical interactions.
84
Figure 4.14 The steel plate coated with C3 formulation during fire test
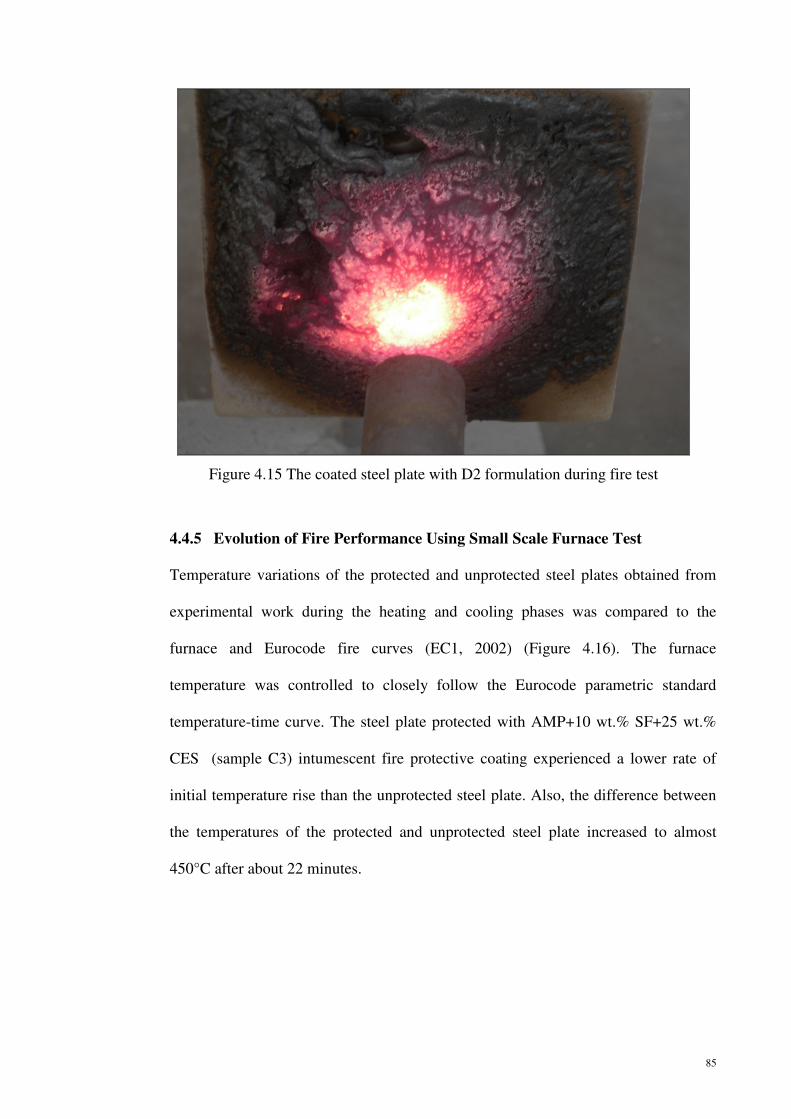
Coating formulation D2 (C3 +10 wt.% ER) was not as effective as C3 alone. Even
though the critical temperature was not reached, the equilibrium temperature was
higher at 210°C. This may be due to physical and chemical interactions that were not
as efficient as in C3, leading to a char layer that was not as thick as the char layer
formed by C3. This in turn resulted in a less effective protection of the steel plate.
Addition of 10 wt.% of ER to sample C3 also produces an intumescent char that
adheres strongly to the plate, exhibiting a regular hemisphere shape after the test
(Figure 4.15) . In the next section, the bonding strength of AMP+SF+CES+ER
formulations system were investigated by Instron microtester in order to better
explain their mechanical properties.
85
Figure 4.15 The coated steel plate with D2 formulation during fire test
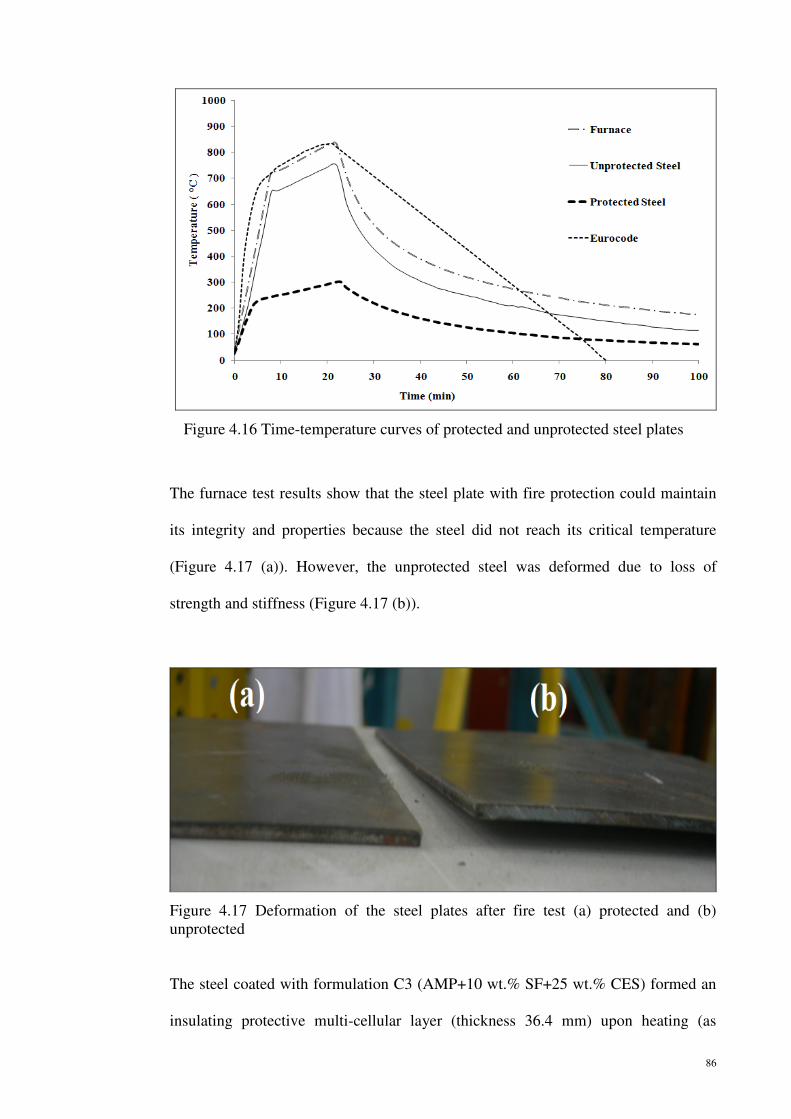
4.4.5 Evolution of Fire Performance Using Small Scale Furnace Test
Temperature variations of the protected and unprotected steel plates obtained from
experimental work during the heating and cooling phases was compared to the
furnace and Eurocode fire curves (EC1, 2002) (Figure 4.16). The furnace
temperature was controlled to closely follow the Eurocode parametric standard
temperature-time curve. The steel plate protected with AMP+10 wt.% SF+25 wt.%
CES (sample C3) intumescent fire protective coating experienced a lower rate of
initial temperature rise than the unprotected steel plate. Also, the difference between
the temperatures of the protected and unprotected steel plate increased to almost
450°C after about 22 minutes.
86
Figure 4.16 Time-temperature curves of protected and unprotected steel plates
The furnace test results show that the steel plate with fire protection could maintain
its integrity and properties because the steel did not reach its critical temperature
(Figure 4.17 (a)). However, the unprotected steel was deformed due to loss of
strength and stiffness (Figure 4.17 (b)).
Figure 4.17 Deformation of the steel plates after fire test (a) protected and (b)
unprotected
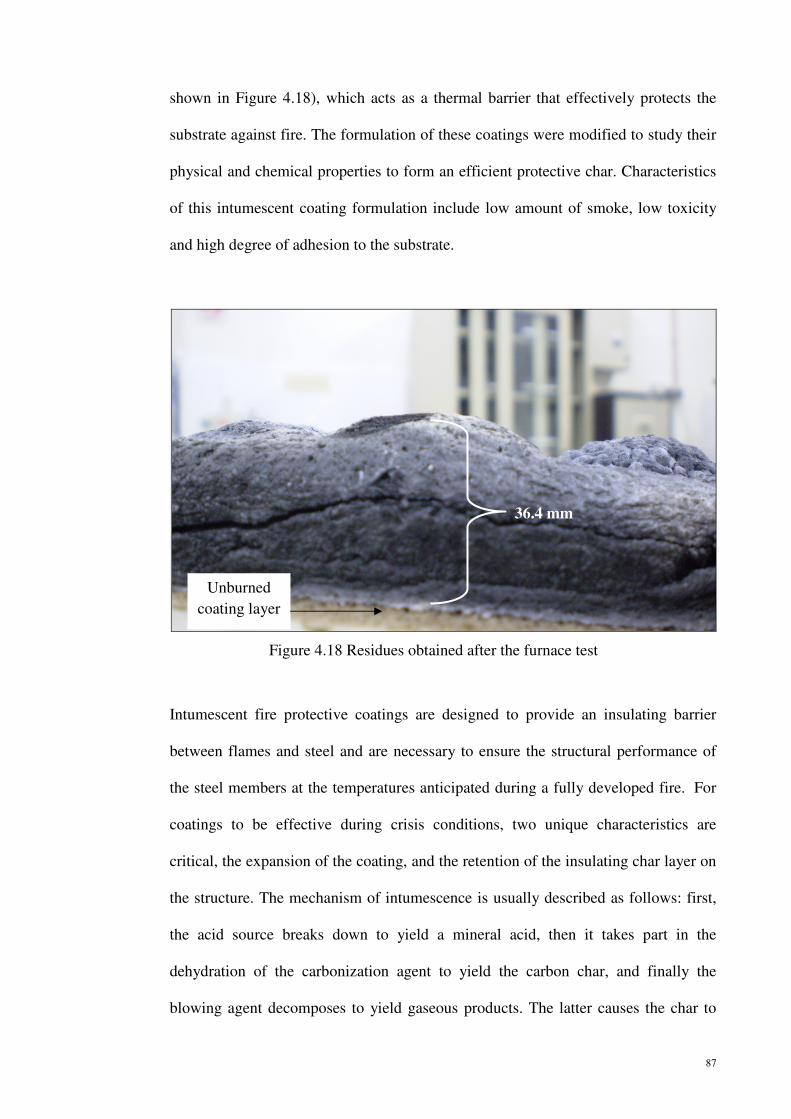
The steel coated with formulation C3 (AMP+10 wt.% SF+25 wt.% CES) formed an
insulating protective multi-cellular layer (thickness 36.4 mm) upon heating (as
87
shown in Figure 4.18), which acts as a thermal barrier that effectively protects the
substrate against fire. The formulation of these coatings were modified to study their
physical and chemical properties to form an efficient protective char. Characteristics
of this intumescent coating formulation include low amount of smoke, low toxicity
and high degree of adhesion to the substrate.
Figure 4.18 Residues obtained after the furnace test
Intumescent fire protective coatings are designed to provide an insulating barrier
between flames and steel and are necessary to ensure the structural performance of
the steel members at the temperatures anticipated during a fully developed fire. For
coatings to be effective during crisis conditions, two unique characteristics are
critical, the expansion of the coating, and the retention of the insulating char layer on
the structure. The mechanism of intumescence is usually described as follows: first,
the acid source breaks down to yield a mineral acid, then it takes part in the
dehydration of the carbonization agent to yield the carbon char, and finally the
blowing agent decomposes to yield gaseous products. The latter causes the char to
Unburned
coating layer
36.4 mm

88
swell and hence provides an insulating multi-cellular protective layer. At the same
time, this shield limits the heat transfer from the heat source to the substrate and the
mass transfer from the substrate to the heat source resulting in conservation of the
underlying material ( Jimenez et al., 2006).
With such intumescent coatings, the burning coating as a block consisting of several
separate layers can be visualised. The top char layer is followed by the intumescent
front where the foaming reactions take place. Below is an unburned coating layer
that still contains the flame retardant. The bottom layer represents the substrate that
is being protected by the intumescent coating. The char-foam provides a physical
barrier to heat and mass transfer, and therefore interferes with the combustion
process (Gilman and Kashiwagi, 1997).
The Bunsen burner and furnace tests are useful because they enable observation of
the changes during fires. However, they do not give further information on the effect
of the flame retardant components on the surface morphology and thermal
degradation of the intumescent coatings. Further investigation on selected
intumescent coating formulations were carried out in detail using small scale lab test
(TGA, SEM and FESEM) to better explain and compare their behavior and
properties in a fire.
89
4.5 Thermal Analysis of Intumescent Coatings
In this part of the research, thermal analysis was carried out to study and compare the
influence of SF binder, CES filler and different composition of epoxy binder on the
different intumescent coating systems (B2, C3 and D1-D4) were compared and studied.
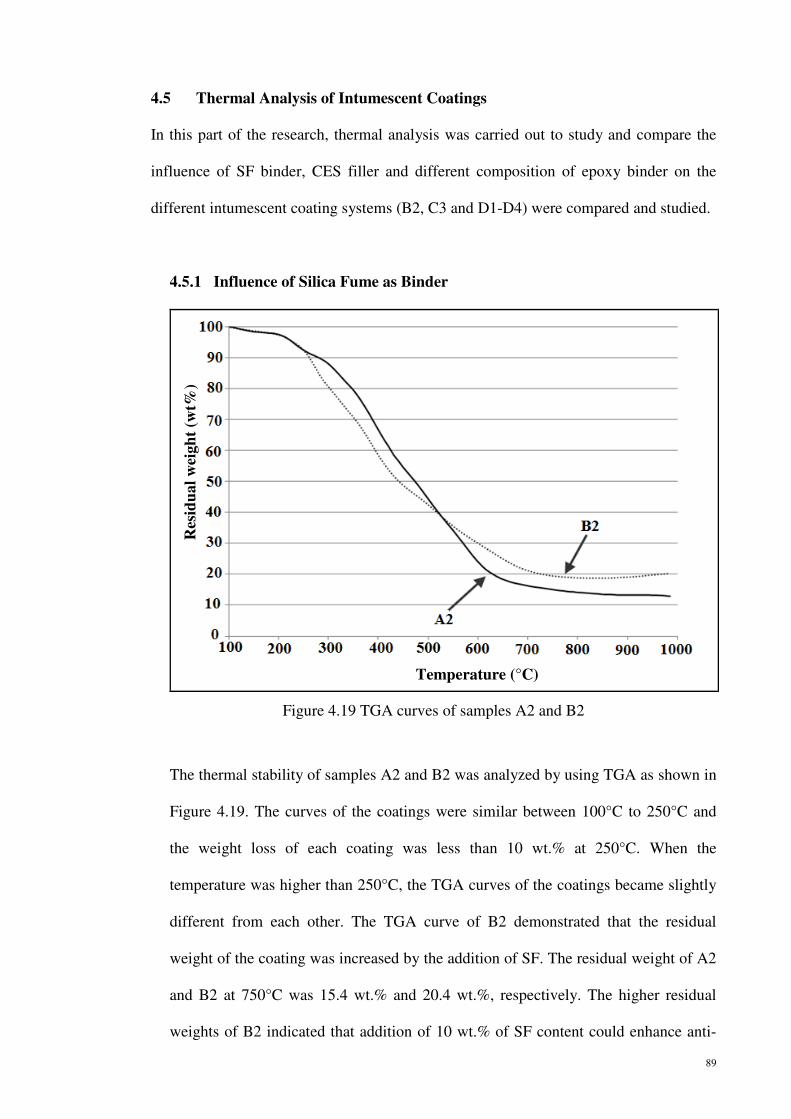
4.5.1 Influence of Silica Fume as Binder
Figure 4.19 TGA curves of samples A2 and B2
The thermal stability of samples A2 and B2 was analyzed by using TGA as shown in
Figure 4.19. The curves of the coatings were similar between 100°C to 250°C and
the weight loss of each coating was less than 10 wt.% at 250°C. When the
temperature was higher than 250°C, the TGA curves of the coatings became slightly
different from each other. The TGA curve of B2 demonstrated that the residual
weight of the coating was increased by the addition of SF. The residual weight of A2
and B2 at 750°C was 15.4 wt.% and 20.4 wt.%, respectively. The higher residual
weights of B2 indicated that addition of 10 wt.% of SF content could enhance anti-
Temperature (°C)
Res
idu
al
wei
gh
t (w
t%)
90
oxidation and thermal stability of the coatings, resulting in a good fire protection
performance.
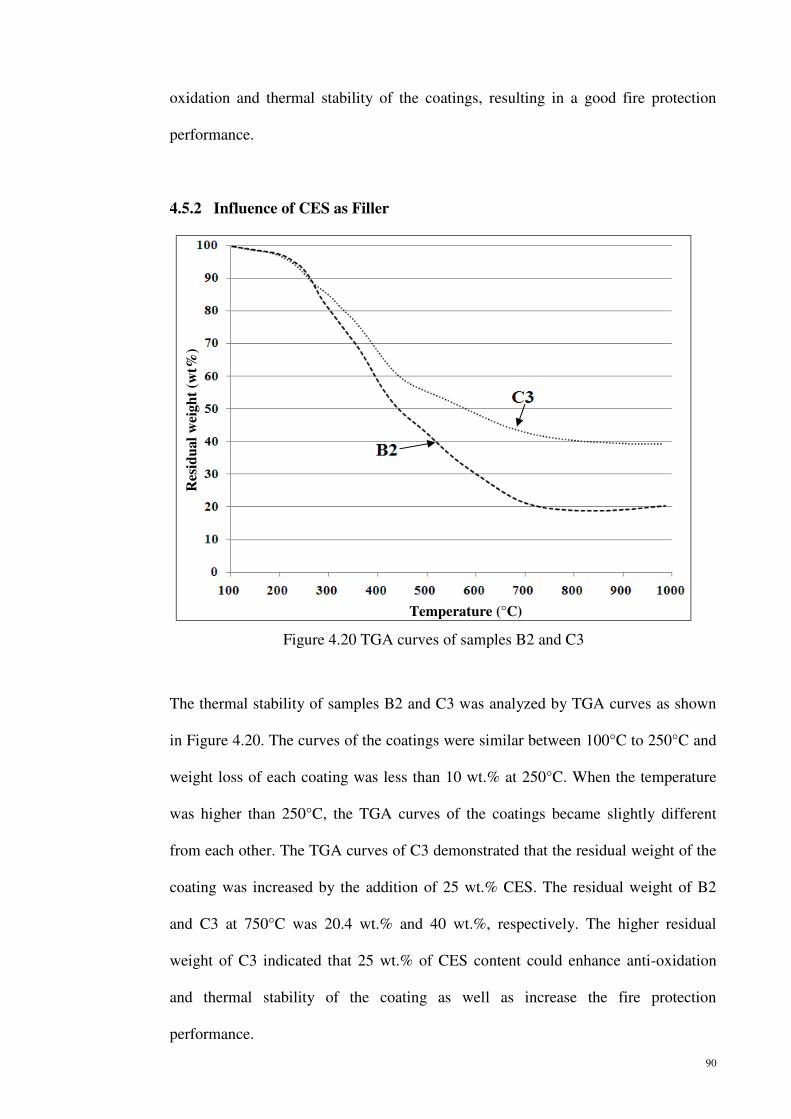
4.5.2 Influence of CES as Filler
Figure 4.20 TGA curves of samples B2 and C3
The thermal stability of samples B2 and C3 was analyzed by TGA curves as shown
in Figure 4.20. The curves of the coatings were similar between 100°C to 250°C and
weight loss of each coating was less than 10 wt.% at 250°C. When the temperature
was higher than 250°C, the TGA curves of the coatings became slightly different
from each other. The TGA curves of C3 demonstrated that the residual weight of the
coating was increased by the addition of 25 wt.% CES. The residual weight of B2
and C3 at 750°C was 20.4 wt.% and 40 wt.%, respectively. The higher residual
weight of C3 indicated that 25 wt.% of CES content could enhance anti-oxidation
and thermal stability of the coating as well as increase the fire protection
performance.
Res
idu
al
wei
gh
t (w
t%)
Temperature (°C)
91
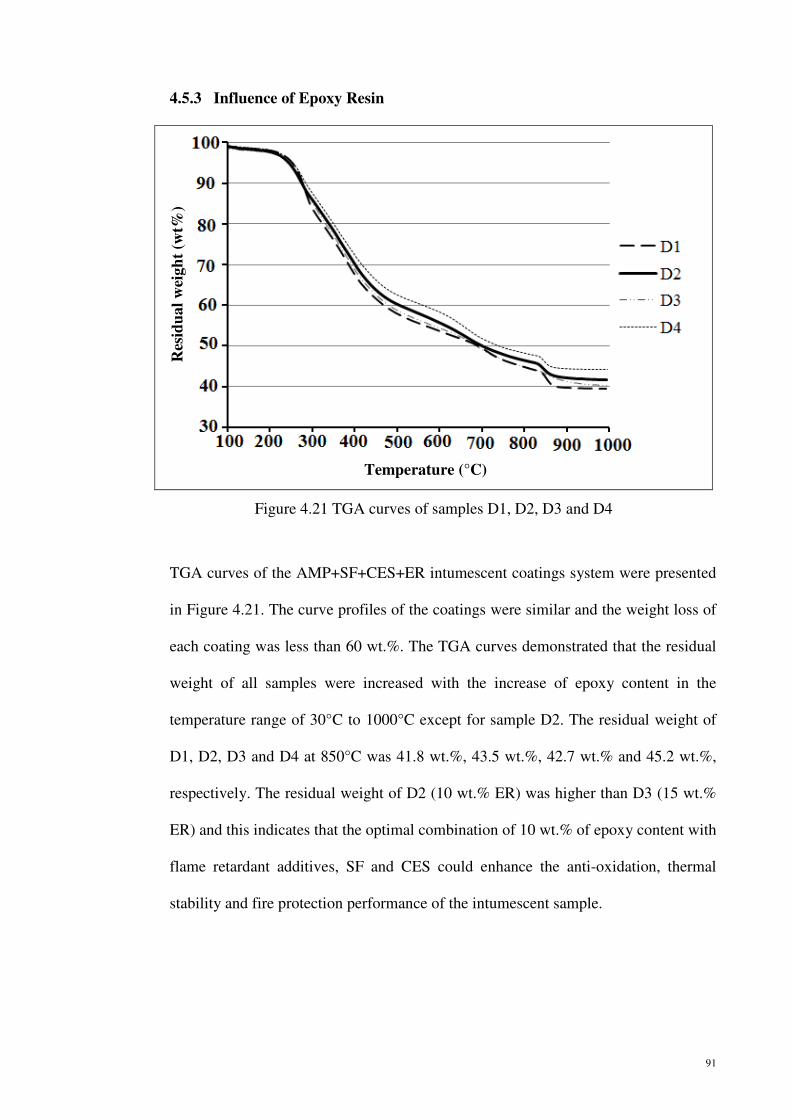
4.5.3 Influence of Epoxy Resin
Figure 4.21 TGA curves of samples D1, D2, D3 and D4
TGA curves of the AMP+SF+CES+ER intumescent coatings system were presented
in Figure 4.21. The curve profiles of the coatings were similar and the weight loss of
each coating was less than 60 wt.%. The TGA curves demonstrated that the residual
weight of all samples were increased with the increase of epoxy content in the
temperature range of 30°C to 1000°C except for sample D2. The residual weight of
D1, D2, D3 and D4 at 850°C was 41.8 wt.%, 43.5 wt.%, 42.7 wt.% and 45.2 wt.%,
respectively. The residual weight of D2 (10 wt.% ER) was higher than D3 (15 wt.%
ER) and this indicates that the optimal combination of 10 wt.% of epoxy content with
flame retardant additives, SF and CES could enhance the anti-oxidation, thermal
stability and fire protection performance of the intumescent sample.
Temperature (°C)
Res
idu
al
wei
gh
t (w
t%)
92
4.6 Surface Morphology of Intumescent Coatings
In this study, the morphology of the coating and the char layers as well as the
distribution of the cell size was characterized by SEM and FESEM images.
4.6.1 Influence of Binder and Filler
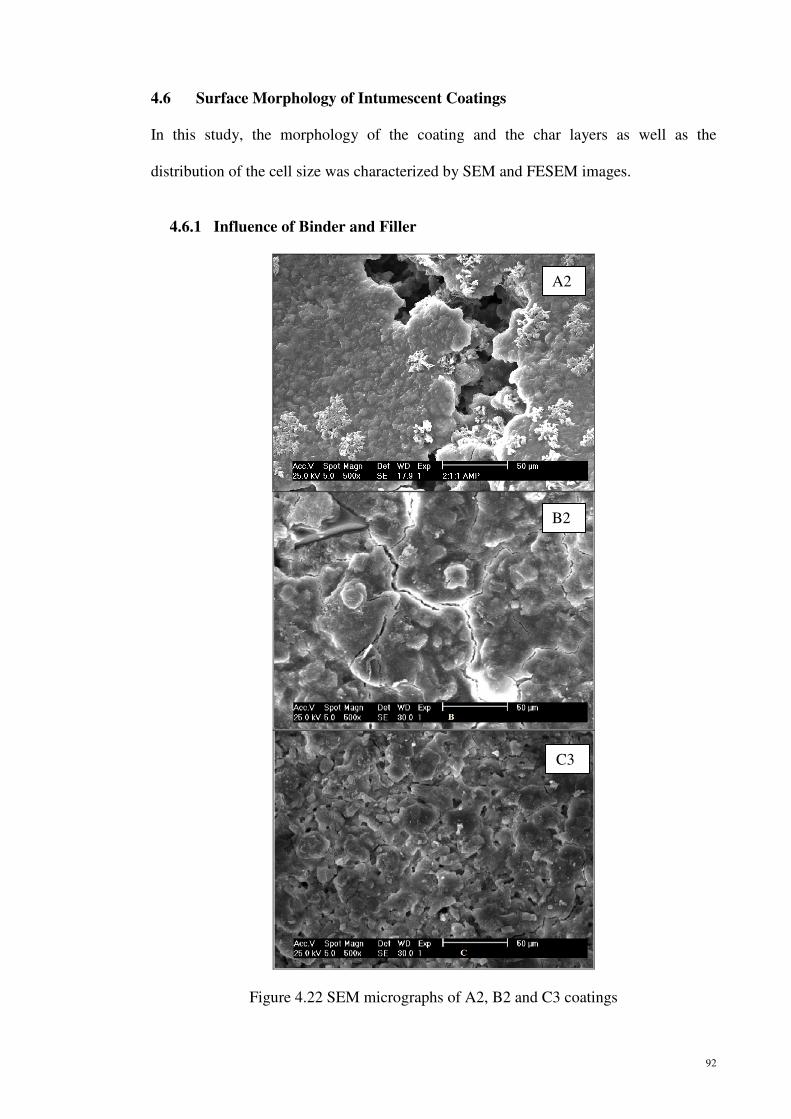
Figure 4.22 SEM micrographs of A2, B2 and C3 coatings
A2
B2
C3
93
The efficiency of surface coatings depend strongly on its physical structure (Wang et
al., 2006). The SEM micrographs of samples A2, B2 and C3 were shown in Figure
4.22. Sample C3 had a denser surface structure compared to samples A2 and B2.
This surface structure could isolate the steel substrate from heat and fire and provide
improved fire protection. Samples A2 and B2 showed some cracks on their surface
structures. Cracks in the surface may result in heat and fire transfer to the steel
substrate, which could lead to a decline of fire protection of samples A2 and B2. As a
conclusion, sample C3 exhibited better fire protection performance compared to
sample A2 and B2.
4.6.2 Influence of Epoxy Resin
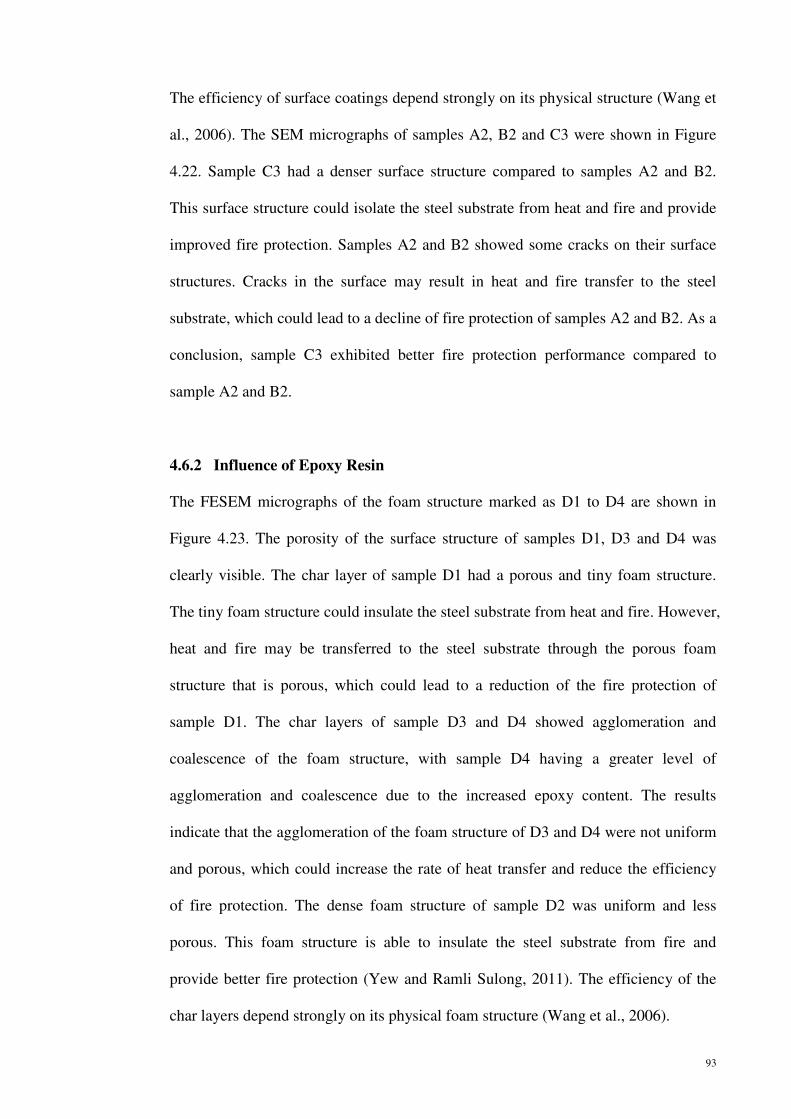
The FESEM micrographs of the foam structure marked as D1 to D4 are shown in
Figure 4.23. The porosity of the surface structure of samples D1, D3 and D4 was
clearly visible. The char layer of sample D1 had a porous and tiny foam structure.
The tiny foam structure could insulate the steel substrate from heat and fire. However,
heat and fire may be transferred to the steel substrate through the porous foam
structure that is porous, which could lead to a reduction of the fire protection of
sample D1. The char layers of sample D3 and D4 showed agglomeration and
coalescence of the foam structure, with sample D4 having a greater level of
agglomeration and coalescence due to the increased epoxy content. The results
indicate that the agglomeration of the foam structure of D3 and D4 were not uniform
and porous, which could increase the rate of heat transfer and reduce the efficiency
of fire protection. The dense foam structure of sample D2 was uniform and less
porous. This foam structure is able to insulate the steel substrate from fire and
provide better fire protection (Yew and Ramli Sulong, 2011). The efficiency of the
char layers depend strongly on its physical foam structure (Wang et al., 2006).
94
Figure 4.23 FESEM micrographs of the foam structure of D1, D2, D3 and D4
D1
D3
D2
D4
95
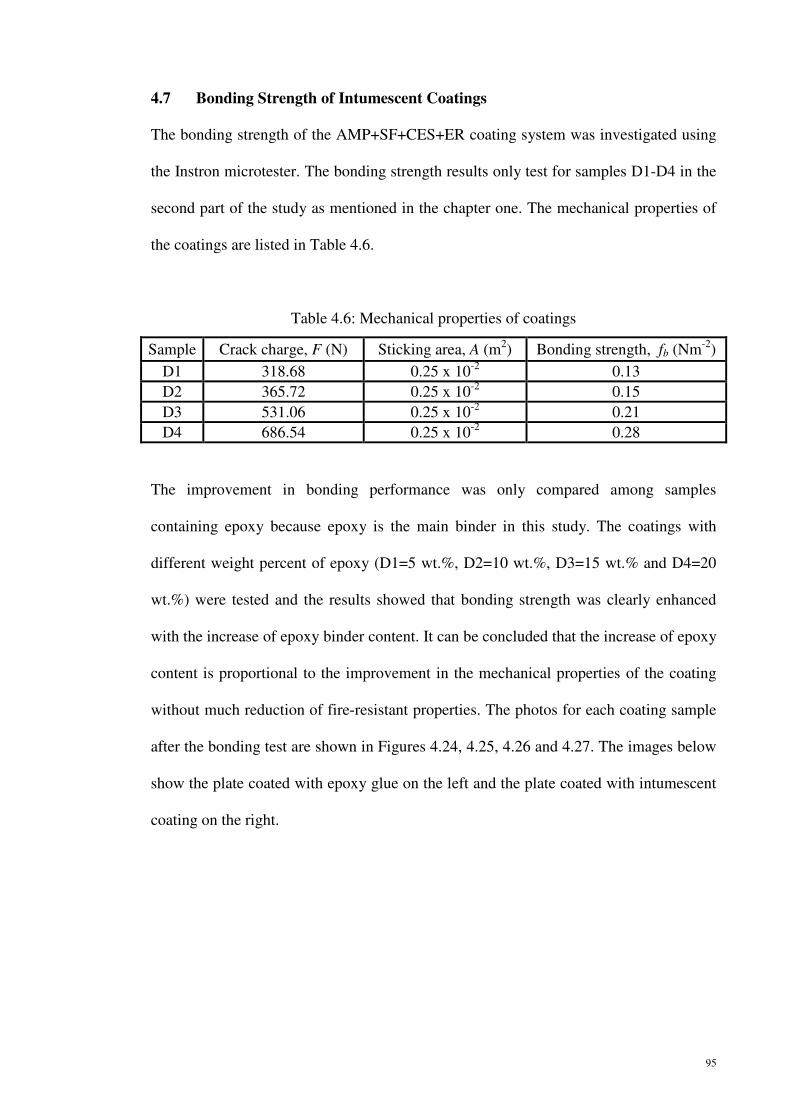
4.7 Bonding Strength of Intumescent Coatings
The bonding strength of the AMP+SF+CES+ER coating system was investigated using
the Instron microtester. The bonding strength results only test for samples D1-D4 in the
second part of the study as mentioned in the chapter one. The mechanical properties of
the coatings are listed in Table 4.6.
Table 4.6: Mechanical properties of coatings
Sample Crack charge, F (N) Sticking area, A (m2) Bonding strength, fb (Nm
-2)
D1 318.68 0.25 x 10⁻²
0.13
D2 365.72 0.25 x 10⁻²
0.15
D3 531.06 0.25 x 10⁻²
0.21
D4 686.54 0.25 x 10⁻²
0.28
The improvement in bonding performance was only compared among samples
containing epoxy because epoxy is the main binder in this study. The coatings with
different weight percent of epoxy (D1=5 wt.%, D2=10 wt.%, D3=15 wt.% and D4=20
wt.%) were tested and the results showed that bonding strength was clearly enhanced
with the increase of epoxy binder content. It can be concluded that the increase of epoxy
content is proportional to the improvement in the mechanical properties of the coating
without much reduction of fire-resistant properties. The photos for each coating sample
after the bonding test are shown in Figures 4.24, 4.25, 4.26 and 4.27. The images below
show the plate coated with epoxy glue on the left and the plate coated with intumescent
coating on the right.
96
Figure 4.24 Coating sample D1 with 5 wt.% ER
Coating sample D1 with only 5 wt.% epoxy binder resulted in poor adhesion with most
of the coating pulled off, exposing the steel plate beneath. The bonding strength
between the coating and substrate was merely 0.13 MPa.
Figure 4.25 Coating sample D2 with 10 wt.% ER
The coating with 10 wt.% epoxy binder (D2) showed better adhesion compared to 5
wt.% epoxy binder (D1), with reduced detachment of the coating. The results showed
97
that the bonding strength between coating sample D2 and the substrate achieved 0.15
MPa, which is a 15.38 % improvement in bonding strength compared to sample D1.
Figure 4.26 Coating sample D3 with15 wt.% ER
Coating sample D3 with 15 wt.% epoxy binder showed good adhesion to the steel plate,
with significantly less detachment of the coating compared to the previous samples as
shown in Figure 4.26. Bonding strength of sample D3 achieved 0.21 MPa. Addition of
15 wt.% epoxy content resulted in 40 % improvement of bonding strength compared to
sample D2.
98
Figure 4.27 Coating sample D4 with 20 wt.% ER
Coating sample D4 with 20 wt.% epoxy binder showed excellent adhesion, with even
and strong bonding of the coating to the steel plate. The results showed that the bonding
strength achieved 0.28 MPa which is an increment of 33.33 % compared to sample D3.
There was only slight detachment of the coating as shown in Figure 4.27. It can be
concluded that the coating formulation is stable and resistant to detachment from the
steel surface.