Embed Size (px)
Citation preview


Journal ofRural Development
Vol. 31 January - March 2012 No. 1
CONTENTS
1. Drinking Water Collection and Cost-Benefit Analysis of a 1
Rural Water Supply Scheme in Uttarakhand State
– Fahimuddin
2. Water Use Pattern Of Rural Community In Gangetic 17
West Bengal – A Case Study
– Arijit Roy
3. Incremental Housing and Housing Transformation of the 25
Poor in Karnataka : Problems and Prospects
– M. Mahadeva
4. Rural Banking Scenario in India and the Opportunity for 43
Commercial Banks
– Manoj Kumar Joshi
5. Coping Mechanisms of People In Drought-prone Areas of Rural Orissa 61
– Sujit Kumar Mishra
6. Impact of Farmers' Participation in Farmer Field Schools 85
– Gopala .Y.M1, B. Krishnamurthy2, K.P. Raghuprasad3,
K.Nagabhushanam4 and K. Shivaramu5
7. Management of School Education : Role of Panchayati Raj Institutions 95
– R. S. Tyagi

8. Financial Inclusion - A Gateway to Sustainable 115
Development for the Impoverished
– Kartick Das
BOOK REVIEWS
1. Towards Financial Inclusion in India 129
by K.G. Karmakar, G.D. Banerjee, N.P. Mohapatra
– Dr. B.K. Swain
2. Administration and Development Planning in India 130
by V.Nath
– Dr. K. Jayalakshmi
3. Micro-finance and Women Empowerment 131
by B. Malleshwari
– Dr. Gyanmudra
4. Socio-Economic Profile of Rural India Series-II 133
Edited by S.C. Patra and Ashish Vachhani
– Dr. R. Murugesan
5. Environment and Social Concerns 134
Edited by Venu Trivedi and VK Shrivastava
– Dr. G. Rajani Kanth
6. Participatory Monitoring and Evaluation 135
Edited by M.J.Chandre Gowda
– Dr. R.Chinnadurai
7. Economic Analysis of Institutions : A Practical Guide 136
by V. Santha Kumar
– Dr. V.Annamalai
Fahimuddin*
DRINKING WATER COLLECTIONAND COST-BENEFIT ANALYSIS OFA RURAL WATER SUPPLY SCHEMEIN UTTARAKHAND STATE
Journal of Rural Development, Vol. 31, No. (1) pp. 1 - 15NIRD, Hyderabad.
* Senior Fellow, Giri Institute of Development Studies, Sector-O, Aliganj, Lucknow-226 024.E-Mail:[email protected]
ABSTRACT
In the State of Uttarakhand, availability of safe drinking water has been aserious problem. In order to tackle the problem, State government installed severalrural water supply schemes in the past, but efforts could not yield desired results dueto lack of community participation in operation and maintenance of these schemes.Few years back, State government with funding support from World Bank installedRural Water Supply and Environmental Sanitation Projects with NGOs and communitysupport. The idea was that with the installation of such projects, time used in watercollection would be considerably saved which a rural household can utilise ineconomic activities to earn additional income. The total income, thus, earned wouldprovide an economic advantage when such benefits exceeded the costs incurred inthese projects.
The analysis in the paper focused on two issues. (i) The situational analysis ofvarious dimensions of drinking water collection in the State. (ii) The cost-benefitanalysis of a rural water supply scheme. The findings revealed that drinking watercollection was arduous and a time-consuming activity for the rural households inthe State. The economic benefits which resulted due to time savings from ruralwater supply scheme were higher than the investment made and rural watersupply schemes of the Uttarakhand State provided a model of replicability inother hilly areas of the country.
Availability of safe drinking water is oneof the major problems in most of the ruralareas of India. As a result, people in rural areasdevote substantial part of their working hoursin the arduous task of water collection. In orderto minimise the scarcity of safe drinking water,state governments implemented largenumber of Rural Water Supply Schemes(RWSS). However, it is a known fact that mostof these schemes became non-operational or
functioning irregularly on account of non-participation of beneficiaries in their operationand maintenance. Therefore, the need wasfelt that a fresh strategy was to be evolvedincorporating Government, community-basedNon-Governmental Organisations (NGO's) andthe community to support such water supplyschemes to sustain for a longer period. TheGovernment of Uttarakhand, with World Bankassistance, implemented such schemes in

2 Fahimuddin
Journal of Rural Development, Vol. 31, No. 1, January - March : 2012
different districts of the State known as RuralWater Supply and Environmental SanitationProjects (RWSESP). The core of the strategy wasthat water is to be treated like othercommodities and benefits should exceedcosts. The process involved a small ProjectManagement Unit contracting large numberof independent Non-GovernmentalOrganisations to assist the communities inplanning, implementation and maintenance ofwater supply schemes.
The paper examines, on the basis ofprimary data, the involvement of ruralhouseholds in drinking water fetching byfinding the time taken to collect safe drinkingwater, number of water collection tripsundertaken and quantity of water collected.The quantification of time saving ofhouseholds due to introduction of a Rural WaterSupply Scheme was done. The cost-benefitanalysis was attempted to ascertain theassumption that in case of a planned ruralwater supply scheme, estimated benefits arecertainly higher than the costs incurred interms of different types of investment made.
Objectives
The objectives of the paper are :
1. To estimate the time involved incollection of drinking water, number oftrips undertaken for drinking watercollection and the quantity of drinkingwater collected in rural hilly areas ofUttarakhand State.
2. To find out the time usage pattern ofhouseholds for different activities andquantify it in value terms by finding outthe local rural wage rate.
3. To estimate the possible savings in timeafter the introduction of a water supplyscheme.
4. To estimate the benefits over the costs.
5. To draw conclusions and suggestions forwider replication of the model in otherparts of the country.
Methodology
The above issues have been examinedon the basis of primary data collected from102 households, covering a population of 556persons from 10 villages of two districts inUttarakhand State. The districts of Almora andPauri were randomly selected out of thedistricts where rural water supply schemeswere proposed by the World Bank assistedProject Management Unit of the State. Thevillages and their households were alsoselected randomly. The financial viability hasbeen analysed on the basis of costs and returnsestimates provided by the ProjectManagement Unit of the State. Data werecollected through personal interviews fromheads of households in ten sample villageswhich have been covered under drinkingwater supply schemes installed by thegovernment. Results have been analysed intabular form which presents number of tripsper person and per household of different agegroups involved in water collection. Quantityof water fetched per trip and time taken pertrip have also been examined. In the analysis,data relating to number of sample households,average size of population and time usepattern of water collection have been analysedto calculate benefit-cost ratios. The details ofsample design are shown in Table 1.
On the basis of above Table, it is evidentthat the sample consisted of 2 districts, 10villages, 102 households and 556 populationin Uttarakhand State.

Journal of Rural Development, Vol. 31, No. 1, January - March : 2012
Drinking Water Collection and Cost-Benefit Analysis of a Rural Water Supply Scheme ... 3
Table 1 : Sampling Design of the Study
Districts Blocks Villages Households Population
Almora Bageshwar 1. Nandigaon 10 61
2. Karuli 10 62
3. Chirang 10 50
4. Anarsa 10 52
5. Choura 10 60
Pauri Pauri 6. Thalli 12 58
7. Rawat-ka Falna 10 45
8. Pali 10 53
9. Padul 10 59
10. Sirauli 10 56
Total 2 2 10 102 556
Households and Population : Out of total102 households, 6.86 per cent householdswere of scheduled castes, 1.96 per cent ofbackward castes and 91.18 per cent of uppercastes. The average family size was 5.45
persons. The sex ratio was 100 males per 94females. The ratio of males in total populationwas 52 per cent versus 48 per cent of females.The details are shown in Table 2.
Table 2 : Population, Family Size and Sex Ratio
Particulars Scheduled Backward Upper TotalCastes Castes Castes
No. of Households 7 2 93 102(6.86) (1.96) (91.18) (100.00)
Population : 36 12 508 556
Male 22 5 263 290
Female 14 7 245 266
Family Size 5.14 5.5 5.47 5.45
Sex Ratio 64 120 94 94
Source : Primary data based.

4 Fahimuddin
Journal of Rural Development, Vol. 31, No. 1, January - March : 2012
Occupational Characteristics : Theoccupational characteristics of the samplepopulation revealed that 74.23 per cent of totalworkers were dependent on agriculture foremployment in the State. It became evidentthat the workers were employed in fouroccupational groups namely, agriculture,agricultural labour, household industry andservices. Though agriculture was the mostimportant activity followed by the serviceswhich provided employment to 23.60 per centof total workers.
Sources of Water : The village communityin the State depended upon four types of watersources. These were Dhara, Naula, tap and river.The average volume of water collected wasfound to be 118.6 litres from Dharas, followedby 74.44 litres, 29.59 litres and 8.55 litres fromNaulas, taps and rivers, respectively. On anaverage, 30 litres of potable water wascollected per household. The tap water supplywas observed to be erratic, interrupted andundependable. The natural sources of waterwere found to be unprotected, exposed tovarious sanitational hazards to be unfit and
Table 3 : Source-wise Volume of Water Collected
Water Source No. of Volume Percentage of Average perhouseholds collected water collected household
Dhara 80 12097 51.30 118.60
Naula 38 7593 32.20 74.44
Tap 59 3018 12.80 29.59
River 43 872 3.70 8.55
Total 220 23580 100.00 231.18
Source : Primary data based.
unsafe. Table 3 shows source-wise watercollected.
Source-wise Time Taken to CollectWater : Average time taken to fetch waterdepends upon the speed of walking to thewater source and the location of a watersource. On an average, sample householdsrequired 30.18 minutes to reach water sourcesin each trip to get water from different sources.Time required to take water from tap workedout to be 7 minutes. Actual time taken to fetchwater from each source was used to arrive ataverage time taken to fetch water. Sincefrequency of water fetching from each sourcevaries, this has been used as weight. Actualnumber of trips to each source was added andpercentage of trips to each source in total trips
was drawn. Thus, source-wise time taken tofetch water is shown in Table 4.
Table 4 : Source-wise Average Time Taken toCollect Water
Source Actual Weights WeightedTime Values
Dhara 35.15 0.27 9.49
Naula 38.40 0.30 11.52
Tap 7.00 0.28 1.96
River 48.03 0.15 7.21
Average Time 31.17 1.00 30.18
Source: Primary data based.

Journal of Rural Development, Vol. 31, No. 1, January - March : 2012
Drinking Water Collection and Cost-Benefit Analysis of a Rural Water Supply Scheme ... 5
Average Distance Between Householdsand Water Sources : Average distance ofhouseholds from the existing sources of waterworked out to be 900 metres in case of Dhara,950 metres in case of Naula, 310 metres and2100 metres in case of tap and river,respectively as given in Table 5. It is evidentthat distance covered for water fetching wasa time-consuming activity as people had towalk roughly a distance of 1 km. to get waterwhich required more than half an hour in eachtrip.
30.18 minutes to fetch water. Data showedthat average trip time of males and femalesin the age-group of 40-59 years was lowest,i .e. 23.07 minutes and 26.67 minutes,respectively. Maximum members of this age-
Table 6 : Number of Trips for WaterCollection by Gender and Age-Group
Age-Group Gender Numberof Trips
10 - 15 Male 4.04Female 5.10
15 - 40 Male 3.21Female 5.91
40 - 59 Male 2.23Female 6.21
59 & Above Male 2.78Female 3.36
Total Male 3.96Female 5.44
Grand Total 4.89
Source: Primary data based.
Table 7 : Average Time Taken per Person toCollect Water by Gender and Age
Age Group Gender Time per person(Minute)
10 - 15 Male 32.79Female 39.91
16 - 40 Male 27.94Female 30.49
41 - 59 Male 23.07Female 22.67
60 & Above Male 25.21Female 27.11
Total Male 30.41Female 29.67
Grand Total 30.18
Source: Primary data based.
Table 5 : Average Distance of WaterSources from Households
Source Distance (in Metres)
Dhara 900
Naula 950
Tap 310
River 2100
Average Distance 1065
Source: Primary data based.
Number of Trips Undertaken to CollectWater : Average number of trips undertakenper day to collect water by all samplehouseholds worked out to be 4.89 (Table 6).Data showed that females made more tripsper day to collect water as against malesirrespective of their age-groups. The femalesin the age-group of 40-59 years mademaximum number of trips, i.e. 6.21 trips whichwere three times more trips made by males inthe same age group. Results also indicated thatthose involved in water fetching made at leastmore than two trips in a day. The number oftrips increased to six which depended uponthe age-group.
Average Time Taken to Collect Water :Table 7 explains average time taken by a maleor female of different age groups on a trip tofetch water. On an average, a person had taken

6 Fahimuddin
Journal of Rural Development, Vol. 31, No. 1, January - March : 2012
group in both the sexes were also involved inwater fetching. On the whole, average timetaken per person to fetch water appeared tobe quite high.
Trip-wise Time Consumed in WaterCollection : Table 8 presents trip-wise averagetime taken in fetching water. It was observedthat average distance covered to reach watersources was more than 1 km. As a result, timespent on a trip was quite long. It is reflectedfrom the Table that on an average 30.18minutes were needed for a trip to fetch water.Out of these, 30.18 minutes, 10.35 minutesand 12.25 minutes were needed for going andreturning, respectively and remaining was thewaiting time at the water source. Sinceavailability of water from Dhara, Naula and tapwas not enough, people had to wait and thencollect water from these sources. As a result,average waiting time during water collectionworked out to be 4.76 minutes.
Table 8 : Average Time Consumedin Water Collection
Activity Time (In Minutes)
Going 10.35
Waiting 4.76
Collecting 2.82
Returning 12.25
Total 30.18
Source : Primary data based.
Trip-wise Time Consumed in AlliedActivities During Water Fetching : People alsogo to water sources for washing clothes,fetching water for animals and for otherrequirements. They spent around 13.43minutes on washing clothes and 6.28 minuteson fetching water for animals. Thus, 20.81minutes were spent per trip on these activities.Table 9 showed trip-wise average time spentin allied activities during water fetching.
Volume of Water Collected, Trips Taken andWater Collected per Trip : Primary data relatingto volume of water collected, number of tripsundertaken and volume of water fetched pertrip were processed to get an idea as to howmuch average volume of water was beingcollected and average number of trips wereundertaken per household in the State. Theaverage volume of water fetched per trip wasalso analysed. The analysis of data on theseaspects is presented in Table 10.
The above Table revealed that on anaverage 231.18 litres of water was beingcollected per household. Average size ofhousehold was found to be 5.45 persons.When average volume of 231.18 litres of watercollected per household was divided byaverage household size of 5.45 persons, wegot per capita water consumption of 42.42litres. Average number of trips taken perhousehold was found to be 12 in theaggregate sample and 19.22 litres of waterwas being collected per trip. In this way, on anaverage less than one and a half buckets (eachbucket of 15 litres) was being fetched per trip.
Economic Viability of a Water Supply Scheme
People in the hilly State of Uttarakhandcollected water mostly from natural sources.Government also implemented water supplyschemes for some villages. However, due tolack of proper maintenance, most of these
Table 9 : Average Time Spent in AlliedActivities during Water Fetching
Activity Time (in Minutes)
Gossiping 1.10
Washing clothes 13.43
Water fetching andbatching of animals 6.28
Total 20.81
Source : Primary data based.
Journal of Rural Development, Vol. 31, No. 1, January - March : 2012
Drinking Water Collection and Cost-Benefit Analysis of a Rural Water Supply Scheme ... 7
Table 10 : Average Volume of Water Collected, Trips Taken perHousehold and Water Collected per Trip
1. Average volume of = Total volume of water = 23580 = 231.18water per household collected (Litres)
Number of households 102 Litres
2. Average number of = Total number of trips = 1227 = 12trips per household Total number of households 102 Trips
3. Average volume of = Total volume of waterwater fetched per trip collected (Litres) = 23580 = 19.22
Total number of trips 1227 Litres
Source : Based on primary data.
schemes remain non-functional for manymonths in a year. Overall water supplysituation, therefore, needed to be modified asthe earlier analysis of total volume of watercollected per household indicated that thepresent level of average volume of waterfetched per household was lower than theprescribed standard of water consumption. TheProject Management Unit (PMU), with externalfunding, intended to install Water SupplySchemes (WSS) in the State in collaborationwith the community and the SupportOrganisations (SOs). If such types of watersupply schemes are installed and successfullyrun, households will get sufficient quality ofwater and their time in the arduous task ofwater fetching would be considerablyreduced. Hence, due to the installation of PMU-Community and Support Organisations-managed water supply schemes, people willget their precious time saved which they mayutilise for productive activities. Hence,implementation of these schemes may bringconsiderably economic benefits to the servedpopulation. But the accrual of such benefitsinvolves substantial investment too.Investment may be viable only if the benefitsderived out of it exceeded costs and whenbenefit-cost ratio works out to be more than
one. Therefore, to know whether investmentin the proposed water supply schemes (WSS)would be viable or not becomes a paramountissue in view of the substantial investmentinvolved in the construction, operation andmaintenance of these schemes. There areseveral measures which serve as aninvestment index to indicate the viability of aproject. The profitability too, may be viewedfrom different angles. In case of investmentto be made in the proposed water supplyschemes, profitability has been calculatedfrom the beneficiary's point of view. Broadly,the profitability may be classified intocommercial/financial profitability and socialprofitability. The former is also called privateprofitability. The objective of this exercise is toascertain the viability of a proposed watersupply scheme by taking into accountbenefits that may accrue to users of thescheme as a result of proper utilisation of timeinvolved in water collection.
Time Saving Benefits
Analysis in this paper is based on asample of 102 households selected from tenvillages. Average size of households workedout to be 5.45 persons. Average time taken in
8 Fahimuddin
Journal of Rural Development, Vol. 31, No. 1, January - March : 2012
collecting water per trip was calculated in caseof sample households which worked out to30.18 minutes in going, waiting, collectingand returning. This entire time will beminimised considerably when sufficient waterwould be made available by the water supplyscheme. However, all the beneficiaries will notbe using water supply scheme uniformly. It wassuggested by the Project Management Unit(PMU) that 30 per cent of total beneficiarieswould have private tap connections whileremaining 70 per cent will depend uponpublic connections and would not have tospend much time in going, waiting andreturning. Water collection time of a bucketof both types of households would also bereduced, because of high water pressure abucket will be filled in 55 seconds as observedduring field survey. The 70 per cent householdswould spend lesser time in going and waitingas public tap-stands would be installed at anaverage distance of 200 meters which wouldbe far lower than the present average distanceof 1065 meters of households from allavailable water sources. The future waitingtime would also be lesser as compared to thepresent time required in waiting as the size ofthe queue would be smaller because 30 percent households who were part of the queueearlier would be using their own private taps.In this way, average time consumed incollecting water per trip has been estimatedto be 6.47 minutes in future.
Average time taken per trip at presentwhich is referred as time before (T1) was 30.18minutes and average time taken per trip infuture which is referred as time after (T2) wasestimated to be 6.47 minutes. Average volumeof water collected per household before was231.18 litres. Average volume of collectedwater per trip before (V) was 19.22 litres or1.28 buckets (15 litres of one bucket) and thenumber of trips taken per household before(N1) was 12. After giving weights to the 'after'water consumption @40 lpcd for 70 per cent
population using public tap stands and 70 lpcdfor 30 per cent population using privateconnections, the number of trips 'after' (N2)were calculated. The number of such tripswould be after (N2) i.e. (Y *50/V) = 15 trips.Where N2 was the number of trips after, Y wasthe average size of household (5.45 persons),50 lpcd was weighted per capita waterconsumption and V was the average volumeof water collected per trip before.
Thus, the resultant time savings perhousehold (TSHH) are calculated as :
TSSH = {(N2 * T2 - N1 * T1) / 60} = 4.43 hours
The total time savings(TSVL) in the sample is :
TSVL = {(TSHH * Number of Households)} =452.22 hours
Benefit Estimate
Total benefits in value terms can simplybe calculated by multiplying total time savingsin the sample by the prevalent average wagerate in sample villages. However, it isimpossible that the total time savings in thesample that would result on account ofproposed water supply scheme will be usedtotally for work purpose. It is natural that someof the time saved by the households may beused in household activities or leisure. FrankMichel has used in his analysis that 52 per centof the total time saved in water fetching willbe utilised for different work purposes. Hence,we have also adopted the same 52 per cent oftotal time saved to be used in working. Theaverage wage rate of ` 47 per day in thesample which has been arrived at from thesample data was divided by the 8 hours andmultiplied by the 52 per cent of the total timesaved. The resultant figures provided ` 3.03which was the value of time savings per hour(VLTS). The value of time saved per day in thesample was = VLTS * TSVL, which came to

Journal of Rural Development, Vol. 31, No. 1, January - March : 2012
Drinking Water Collection and Cost-Benefit Analysis of a Rural Water Supply Scheme ... 9
` 1368. This value of time saved per day in thesample has been multiplied by the 365 daysto arrive at the value of time saved per year inthe sample which worked out to ` 49, 9,412.According to the results of our sample data,25 per cent of whole day time was devotedfor work, 35 per cent of total time was devoted
for household activities and 40 per cent oftotal time was given to leisure activities.According to these figures, 53 per cent of totaltime saved was utilised and BC ratio workedout to be 2.06 (net benefit) and 2.24 (netbenefit hardware only). Detailed results arepresented in Table 11.
Table 11 : Outcome of Short Term Economic Criteria Study
Calculation of BC Ratio
Total population Total households Average persons perin sample in sample household (y)
556 102 5.45
Average distances involved and time taken in collecting water per trip
Distance (mtrs) Time (In Minutes)
Going Waiting Collecting Returning Total
Present 1065 10.35 4.76 2.82 12.25 30.18
Future
Public 200 1.94 3.33 1.17 2.30 8.74
Pvt. Conn. 0 0.00 0.00 1.17 0.00 1.17
Average 140 1.36 2.33 1.17 1.61 6.47
Average time taken per trip Average time taken per trip
before (T1) 30.18 Min after (T2) 6.47 Min
Consumption levels
Avg. Vol. of water collected Average volume fetched per trip Number of trips taken
per household 231.18 Litres before (v) 19.22 Litres per household 12
before (1.28 buckets) before (N1)
Weighted consumption 'after'
From public stand posts (@ 40 lpcd for 70 per cent population) 28 lpcd
From private connections (@ 70 lpcd for 30 per cent population) 21 lpcd
Total 49 lpcd
Say 50 lpcd

10 Fahimuddin
Journal of Rural Development, Vol. 31, No. 1, January - March : 2012
Explanatory Notes
* These figures are based on a sample of102 households in 10 villages of the Hillregion.
* Present distances and time taken arebased on the empirical data taken fromthe above sample. Collection at presentis from more than one type of source.
* It has been assumed that in future notapstand shall be more than 200 mtsfrom any household. It has also beenassumed that there will be 30 per centprivate connections.
Formulae for future times taken are asfollows
Going/ returning time
= (Actual time in going/ returning atpresent) * 200
Actual distance covered at present
Waiting time = Actual time in waiting atpresent * 0.70
Collecting time = Time taken to fill 1.28buckets from a tap
(A tap fills a bucket in 55 seconds).
* Avg.Vol. of water collected perhousehold/ number of trips before arebased on empirical data taken fromabove sample.
Investment Costs
Investment costs comprise hardwarecosts (HC), software costs (SC) and operationand maintenance costs (O&M). Hardware costsare to be incurred on pipes and plant andmachinery etc. Software cost denotes the costto be incurred on training and orientationprogrammes. It has been proposed by ProjectManagement Unit (PMU) that the entirehardware costs would be incurred within threeyears from the initiation of the project. ThePMU further suggested that no hardware costsare required in year-1 while 30 per cent and70 per cent hardware costs would be spent inyear-2 and year-3. The per capita software costswould be ` 267 in year-1 which was theplanning phase cost and ̀ 146 in year-2 whichis the implementation and post-implemen-tation cost. No software cost was required inthird year. In case of hardware costs, it was notrequired in year-1 while it will be ` 590 inyear-2 and ` 1378 in year-3. In this way, totalper capita capital costs estimate at marketprice of a scheme for the same worked out tobe ` 267 in year-1, ` 736 in year-2 and `1524in year-3. The per capita capital costs have beenmultiplied by the sample population. Theresultant figures were the cost of a scheme.These costs figures were ` 1,48,452 forhardware and ` 1,48,452 the total in year-1.In the year-2, ` 81,176 and ` 32,826 and` 4, 09,438 were software, hardware and totalcosts of a scheme respectively. In the year-3,` 7, 65,946 and ` 7,65,946 were the softwareand total costs, respectively (Table 12).
Journal of Rural Development, Vol. 31, No. 1, January - March : 2012
Drinking Water Collection and Cost-Benefit Analysis of a Rural Water Supply Scheme ... 11
Table12 : Outcome of Short-Term Economic Criteria Study
Number of trips after {N2} ie {y*50/v} 15
Time savings per household {TSHH={(N2*T2-N1*T1)/60} } 4.43 (hrs)
Total time savings in the sample {TSVL={TSHH*Number of 452.22 (hrs)
Households} }
Benefit Estimates
Use of Time Work Housewok Leisure Total
(a) Percentage of Time by Use 30% 16% 54% 100%
(b) Valuation of Time in that Use (% of wage) 100% 50% 25%
(c) Weight to apply to wage rate (a)*(b) 30% 8% 14% 52%
(d) Wage Rate (R./day)= 47.00
(e) Value of Time Savings per hour, {VLTS} (Rs./hour) (d)*(c)/8 hrs 3.03
Value of time saved per day in the sample = {VLTS*TSVL} ` 1368
Value of time saved per year in the sample = ` 499412
Per capita investments costs
Hardware Software O&M
Year 1 0 267 0
Year 2 590 146 0
Year 3 1378 0 @3% of total Hardware costs
Total 1968 413 59
Capital cost estimate at market prices of a scheme for the sample (`)
Per capita costs Year 1 Year 2 Year 3
Software 267 146
Hardware 590 1378
Total 267 736 1378
Cost of a scheme for the sample (per capita cost sample) population
Software 148452 81176
Hardware 328262 765946
Total 148452 409438 765946

12 Fahimuddin
Journal of Rural Development, Vol. 31, No. 1, January - March : 2012
* The number of trips after have beencalculated on the basis of 'weightedconsumption' after.
* Distribution of use and valuation of timehas been assumed.
* These cost figures at market prices havebeen worked out from the project costtables used by the Dec. 1995 Mission.The following assumptions have beenmade.
Hardware
- No hardware in year 1
- 30 per cent and 70 per cent costs in year2 and 3, respectively.
Software
- Planning phase cost in year 1
- Implementation and post-implemen-tation cost in year 2.
O & M
From year 3 onwards
Benefit- Cost Flows
Year-wise costs to be incurred onhardware, software and operation andmaintenance of a water supply scheme for thesample are shown in Table 13.
It has been assumed that the populationof sample would increase by 2 per centannually. The values of the time saved per yearin case of sample have also been depicted inthe same table. The benefit-cost flows (`) havebeen calculated year-wise up to 24 years assuggested by the PMU. The net benefits havebeen arrived at by deducting the total capitalcosts of a scheme from the value of time savedper year in the sample. It is evident from thevalues of the net benefits and the net benefitsof hardware that the net gains would be
negative in the first, second and third yearsafter the implementation of the scheme asthe beneficiaries would not get any timesavings up to the three years which shall bethe planning and implementation years. Sincefourth year onwards, the net benefits andbenefits on hardware would accrue and go onincreasing up to 15 years, serving thepopulation with the 2 per cent increase eachyear. The scheme would be unable to meetthe requirements of the water of growingpopulation after 15 years and hence benefitswill stagnate. The value of benefit-cost ratiofor the entire period works out to be 2 in caseof net benefits and 2.18 in respect of netbenefits of hardware only which implied thatthe scheme is economically viable to beimplemented in the State. A discount rate of11 per cent in the net present values has beengiven to take into account the impact of theinflation, changes in the interest rates and therisk factor. The basis of 11 per cent discountfactor is also based on Frank Michel'sestimation.
Summary and Conclusions
The State of Uttarakhand, which was partof the U.P. State earlier, is largely a mountainousregion in the lap of Great Himalaya. In the State,availability of safe drinking water has been aserious problem because of larger availabilityand dependency on natural sources of waterlike Dhara, Naula and river for various waterneeds. But due to their natural open flows,water gets contaminated and becomes unsafefor human consumption. To make available thesafe water to the people, State governmenthad installed many water supply schemes inthe past which could not be successfulbecause of lack of community participation inthier operation and maintenance. Few yearsback, State government, with financial supportfrom the World Bank, decided to install WaterSupply and Sanitation Projects with the helpof NGOs and community. The idea was thatwith the installation of such projects,

Journal of Rural Development, Vol. 31, No. 1, January - March : 2012
Drinking Water Collection and Cost-Benefit Analysis of a Rural Water Supply Scheme ... 13
Table 13 : Outcome of Short Term Economic Criteria Study
Project Costs Benefits Net Net PopulationYear Benefits Benefit Served
Hardware Software O&M Total Time Hardwaresavings only
1 2 3 4 5=(2+3+4) 6 7=(6-5) 8=(6-5-3) 9
1 0 148452 0 148,452 0 (148,452) (148,452) 0
2 328262 81176 0 409,438 0 (409,438) (409,438) 0
3 765946 32,826 798,772 499,412 (299,360) (266,533) 578
4 32,826 32,826 509,400 476,574 509,400 590
5 32,826 32,826 519,588 486,762 519,588 602
6 32,826 32,826 529,980 497,154 529,980 614
7 32,826 32,826 540,580 507,754 540,580 626
8 32,826 32,826 551,391 518,565 551,391 639
9 32,826 32,826 562,419 529,593 562,419 651
10 32,826 32,826 573,668 540,841 573,668 664
11 32,826 32,826 585,141 522,315 585,141 678
12 32,826 32,826 596,844 564,018 596,844 691
13 32,826 32,826 608,781 575,954 608,781 705
14 32,826 32,826 620,956 588,130 620,956 719
15 32,826 32,826 633,375 600,549 633,375 734
16 32,826 32,826 633,375 600,549 633,375 734
17 32,826 32,826 633,375 600,549 633,375 734
18 32,826 32,826 633,375 600,549 633,375 734
19 32,826 32,826 633,375 600,549 633,375 734
20 32,826 32,826 633,375 600,549 633,375 734
21 32,826 32,826 633,375 600,549 633,375 734
22 32,826 32,826 633,375 600,549 633,375 734
23 32,826 32,826 633,375 600,549 633,375 734
24 32,826 32,826 633,375 600,549 633,375 734
NPV at Disc. Rate of
0.11 826,478 199,625 217,822 1,243,925 3,736,411 2,492,486 2,710,308
BC Ratio 2.00 2.18
* An annual increase of 2 per cent in population has been assumed.
(in `)

14 Fahimuddin
Journal of Rural Development, Vol. 31, No. 1, January - March : 2012
substantial time of the people used in waterfetching would be saved considerably whichpeople can use in economic activities to earnadditional income. Thus, the water supplyprojects would give time savings in watercollection whose total returns would be higherthan the costs to be incurred on the schemesfor a longer time period of 15 years. The paperhas examined these hypotheses to ascertainas to what extent the assumptions turn intoreality. To study it, primary data were collectedfrom the sample households relating to theirsize, water fetching practices, sources of water,quantity of water fetched by the households,time involved and time savings that wouldresult due to easy and adequate availability ofsafe water from the new scheme. The averagefamily size in State was found to be 5.45persons. The village community was found tobe dependent upon four types of watersources, namely, Dhara, tap, Naula and river.The most important water source was Dharafrom which 51.30 per cent of total quantity ofwater was fetched by the sample households.Only 12.80 per cent of total water procurementwas made by tap, which was the only sourceof potable water. The river has been reportedto be the water source from which only 3.70per cent of total water was obtained. The Naulawas also one of the major natural watersources which provided 32.70 per cent of totalwater used by sample population. An averagequantity of water collected per household perday was found to be 15.41 buckets in thesample. It worked out to around 42 litres percapita per day. For drinking water purpose, 11litres per capita was the water volume fetched.
The figure of 11 lpcd was calculated fromaverage volume of water collected perhousehold for different uses. The perhousehold water use for drinking purpose wasfound to be 61.82 litres. When this figure wasdivided by the average household size of 4.45persons, we got the 11 lpcd for drinkingpurpose. The sample households required30.18 minutes to reach the water source ineach trip. Average distance of samplehouseholds from the existing water sourcesworked out to be 10365 metres. Averagedistance of natural water sources like Dhara,Naula and River was found to be 1 km. andmore. Average number of trips taken to fetchwater per person by gender and age-grouprevealed that 5 trips per person engaged inwater collection were undertaken. The averagetime taken per person to fetch water by genderand age-group showed that 30 minutes wererequired. On the whole, average volume ofwater collected per household worked out tobe 231 litres. The average number of trips perhousehold were 12 and the average volumeof water collected per trip was estimated tobe 19 litres.
Financial viability of the proposed watersupply scheme was analysed for samplepopulation. The value of the benefit-cost ratioworked out to be 2 in case of net-benefits and2.18 in respect of net-benefits of hardwareonly which implied that the scheme wasfinancially viable for implementation in theState of Uttarakhand. It also indicated that suchtype of water supply schemes have viablereplicability in other parts of the country.

Journal of Rural Development, Vol. 31, No. 1, January - March : 2012
Drinking Water Collection and Cost-Benefit Analysis of a Rural Water Supply Scheme ... 15
References
1. Jim Dowing and Pooja Sharma, (2002), Sustainability of Rural Water Supply Projects : Lessons from thePast, Revisiting Community Based Rural Water Supply Projects in Uttar Pradesh, World Bank.
2. B.K. Bajpai and Fahimuddin, (1996), Time Usage and Short Term Economic Criteria Study, Hill andBundelkhand Regions of Uttar Pradesh, Project Management Unit, Lucknow.
3. Water Supply and Sanitation, (2002), A WHO-UNICEF Sponsored Study, Planning Commission, Governmentof India.
4. Uttarakhand Rural Water Supply Projects, World Bank, 2006.

Arijit Roy*
WATER USE PATTERN OFRURAL COMMUNITY INGANGETIC WEST BENGAL –A CASE STUDY
Journal of Rural Development, Vol. 31, No. (1) pp. 17 - 23NIRD, Hyderabad.
* Assistant Professor in Economics, Department of Commerce, V.M. Mahavidyalaya, Chaitanyapur, EastMidnapore, West Bengal - 721645. E-mail : [email protected]
ABSTRACT
Water is the most precious natural resource acting as the lifeline of the ruralcommunity. It can be highly productive and support prosperous communities ifproperly used. This paper attempts to explore the water use pattern of ruralcommunity in Gangetic West Bengal. Primary data were collected in the EastMidnapore district of West Bengal during 2008-2009. It has been observed thatthe level of per capita income does have a positive influence on the level of percapita domestic water consumption. Also, the proximity of the water source doesincrease domestic water consumption. Agriculture is the major occupation withthe highest water dependence. It has also been found that water consumed foragriculture is directly influenced by the level of per capita income, the proximityof water source and water-intensive cropping pattern.
Introduction
Water is commonly regarded as plentifulin gangetic plain of West Bengal. However, thesupply for man’s use is definitely limited andits volume and quality are determined, to agreat extent, by human activities. In rural partof gangetic West Bengal, water ispredominantly consumed for drinking,sanitation and farm irrigation.
Kumar, A.C., Malhotra, K.C., Raghuram, S.and Pais, M. (2000) considered the waterconsumption behaviour of rural community ofTumkur district, Karnataka. This study had alsoshown the significance of water rights toincrease equity in water use, systems ofincentives for the use of water-saving devicesand recycled water in agriculture, managingwater systems including drinking water used
by local communities, providing watereducation, introducing community managedirrigation systems and empowering womenin water resource management. Bhattacharyya,D., Roy, G.B. and Das, J.K. (2008) studied thepattern and efficiency of water use on the basisof different socio- economic classes in Howrahdistrict of West Bengal. Another study byKumar, M., Gaur, D.R., Goel, M. and Mishra, R.(2009) revealed the water use pattern andbehaviour of rural community in Beri block ofJhajjar district of Haryana.
The present study attempts toinvestigate the water use pattern of ruralcommunity in gangetic plain of West Bengalaccording to different socio–economic classes,different occupations, ease of access to waterand different cropping patterns.

18 Arijit Roy
Journal of Rural Development, Vol. 31, No. 1, January - March : 2012
Methodology
A two-stage stratified random samplingtechnique was used for the purpose of thestudy. With similar geographical and socio –economic features, two villages, namely, Bardaand Chaitanyapur under No.3-ChaitanyapurGram Panchayat, Sutahata Block of EastMidnapore of West Bengal were selected. Inthe second stage, a complete enumeration ofhouseholds according to monthly per headincome(Y in `) was made. The householdswere then stratified into three major groups,i.e. ,the Poor Class (Y<1500),the Middle Class(1500 < Y <4000) and the Rich Class (Y >4000). From the total population, 100households were selected at randomconsisting of 32 poor households, 56 middleclass households and 12 rich households. Thesample households were administered withwell-designed semi-structured questionnairesto find required information. The data werecollected in the year 2008-2009. The simplestatistical tools like percentage and mean havebeen used to interpret the data in tabular form.Multiple Regression technique has beenemployed to know the impacts of income andproximity of water source upon the domesticconsumption of water. We have also analysedthe impacts of income, proximity of watersource and cropping pattern on theconsumption of water for farming. For this, weuse the following log-lin equations:
ln DWC = β1 + β2 ln Y + β3 PX + u,
ln FWC = α1 + α2 ln Y + α3 PX + α4 CP + v,
where DWC = Domestic waterconsumption in liter per capita per day (lpcd),
FWC = Water consumption for farming(lit/ bigha),
Y = per head income ( `/month ),
PX = proximity of the water source ; PX= 1 for distance < 300 meter,
= 0 otherwise
CP = Cropping pattern ;
CP = 1 for water-intensive croppingpattern, = 0 otherwise.
u and v are random error terms normallydistributed with zero mean and finite varianceand satisfying the assumptions of the ClassicalLinear Regression Model. β1 and α1 areintercept coefficients. β2, β3, α2, α3 and α4are the partial slope coefficients.
Study Area
Barda (22 09’33’’N, 8808’30’’E ) andChaitanyapur (2207’47’’ N, 8801’28’’ E ) villagesare under No. 3 Chaitanyapur Gram Panchayat,Sutahata Block of East Midnapore district ofWest Bengal. The area comes under thegangetic plain agro-climatic zone of the State.The area is covered with loamy soil. Theaverage temperature varies between 120C -350C, while the average annual rainfall variesbetween 150 cm – 175 cm.
Table 1 reveals that the average per headdrinking water consumption is the highest forrich people (4.9 lpcd) followed by the middleclass (4.8 lpcd) and the poor class (4.0 lpcd).The average per head consumption of waterfor sanitation is the highest for rich people (6.3lpcd) followed by the middle class (4.8 lpcd)and the poor class (3.8 lpcd). The average totalconsumption of domestic water is the highestfor the rich class (11.20 lpcd) followed by themiddle class (9.60 lpcd) and the poor class(7.80 lpcd).
Table 2 shows that the average totaldomestic water consumption is the highestfor households in farming (9.15 lpcd) followedby service (9.10 lpcd) and business (8.92 lpcd).

Journal of Rural Development, Vol. 31, No. 1, January - March : 2012
Water Use Pattern of Rural Community in Gangetic West Bengal – A Case Study 19
Result and Discussion
Table 1 : Domestic Consumption of Water by Different Income Classes and Occupations inChaitanyapur and Barda, Sutahata Block, East Midnapore
Social Status No. of No. of Water Water Average TotalFamilies Members Consumption Consumption Domestic
for Drinking for Sanitation Water(a) (b) Consumption
(a+b)Total Average Total Average
(lit/day) (lpcd) (lit/day) (lpcd)
Farming 22 118 477.50 4.05 452.80 3.84 7.89
Poor Non-farming 10 44 170.50 3.86 162.80 3.70 7.56
Total 32 162 648.00 4.00 615.60 3.80 7.80
Farming 40 213 1032.00 4.85 1029.60 4.83 9.68
Middle Non-farming 16 48 220.80 4.60 223.20 4.65 9.25
Total 56 261 1252.80 4.80 1252.80 4.80 9.60
Farming 4 12 64.80 5.40 81.60 6.80 12.20
Rich Non-farming 8 30 141.00 4.70 183.00 6.10 10.80
Total 12 42 205.80 4.90 264.60 6.30 11.20
Total 100 465 2106.60 2133.00
Mean 4.53 4.59 9.12
Source : Field Survey.
Table 2 : Domestic Consumption of Water by Different Occupational Groups inChaitanyapur and Barda, Sutahata Block, East Midnapore
Occupation No. of No. of Water Water Average TotalFamilies Members Consumption Consumption Domestic
for Drinking for Sanitation Water(a) (b) Consumption
(a+b)Total Average Total Average
(lit/day) (lpcd) (lit/day) (lpcd)
Farming 66 343 1574.30 4.59 1564.00 4.56 9.15
Business 14 50 230.50 4.61 215.50 4.31 8.92
Service 20 72 301.80 4.19 353.50 4.91 9.10
Total 100 465 2106.60 4.53 2133.00 4.59 9.12
Source : Field Survey.

20 Arijit Roy
Journal of Rural Development, Vol. 31, No. 1, January - March : 2012
Table 3 shows that the average waterconsumption for farming is 2600 lit/bigha forthe poor families who do not have enoughmoney to spend on irrigation. The averagewater consumption for farming for the middle
class families is 3500 lit/bigha who can affordto spend on irrigation. The average waterconsumption for farming is the highest (4100lit/bigha) for the rich families.
Social Status No. of Source of Water for Source of WaterFamilies Domestic Purpose for Farming
Poor Farming 22 Small pond in the backyard Rain water, canal waterfor 17 families, common tube- supplied throughwell established by Panchayat. manual system.
Non-farming 10 Common tubewell establishedby Panchayat, small pond in thebackyard for 7 families.
Middle Farming 40 Small pond in the backyard and Rain water, canal watercommon tubewell established supplied through pump-by Panchayat for 30 families, set.large pond and own submersiblepump for 10 families.
Non-farming 16 Pond and common tubewellfor 5 families, own submersiblepump for 11 families.
Rich Farming 4 Own submersible pump. Rain water, canal watersupplied throughpumpset.
Non-farming 8 Own submersible pump.
Source : Field Survey.
Table 3 : Consumption of Water for Farming by Different Income Classes in Chaitanyapur& Barda, Sutahata Block, East Midnapore
Social Status Occupation No. of Average WaterFamilies Consumption
for Farming(lit/ bigha)
Poor Farming 22 2600
Middle Farming 40 3500
Rich Farming 4 4100
Source : Field Survey.
Table 4 : Source of Water for Domestic Purpose and Farming Purpose

Journal of Rural Development, Vol. 31, No. 1, January - March : 2012
Water Use Pattern of Rural Community in Gangetic West Bengal – A Case Study 21
All the poor farming and non-farmingfamilies have small ponds in the backyard fordomestic use except in the peak dry season.For drinking water, they depend on Panchayat-established common tubewells. Rainwater isthe biggest source of water for farming forpoor families. Besides this, they supply canalwater manually to their lands when necessary.Most of the middle class farming and non-farming families rely upon own ponds forsanitation. For drinking water, 30 families usecommon tubewell provided by the Panchayat,15 families use own tubewell and 11 familiesuse own submersible pump. For farming, allthe 40 families use rain water and canal watersupplied through pumpset. All the rich familiesuse own submersible pump for sanitation aswell as drinking water. Rich farming familiesuse rain water along with canal water suppliedthrough pumpset for irrigation.
Table 5 : Cropping Pattern of the Families
Water-intensity Crops cultivated
High Aman paddy, jute, auspaddy, boro paddy, betel-nut, vegetables.
Low Wheat, khesari (lowquality pulse), sunflower,vegetables.
Source : Field Survey.
The common crops in our study area canbe divided into two groups : (a) crops withhigh water intensity e.g. aman paddy, jute, auspaddy, boro paddy, betel-nut and vegetableswhich require heavy irrigation; and (b) cropswith low water intensity e.g. wheat, khesari(low quality pulse), sunflower and somevegetables which require low to mediumirrigation.
Determinants of Domestic and Farm WaterConsumption Disparity
We have tried to analyse the contributionof income(Y) and proximity of water source(PX) to domestic water consumption (DWC)disparity between sample households. In ourlog-lin model, natural log of (DWC) isregressed upon natural log of (Y) and (PX)dummy. The estimated regression results areshown in Table 6.
Table 6 : Regression Result of DomesticWater Consumption Disparity
Co- Standard t-statistic pefficient error value
Intercept 0.382 0.152 2.508 0.028
ln Y 0.214 0.019 11.076 0.000
PX 0.107 0.035 3.101 0.009
N = 100, k = 3.
F- (2,97)d.f. = 72.698 , p value = 0.000.
R² = 0.924 , Adj R² = 0.911.
N (= 100) is the sample size and k (= 3 )is the number of parameters to be estimated.The high t-values are indicative of the fact thatall the estimated coefficients are statisticallysignificant. The intercept coefficient ? β1 takesthe value of 0.382 and is significant at 5 percent level. The coefficient β2 (= 0.214) is theelasticity of ' domestic water consumption 'with respect to income . If per head incomeincreases by 1 per cent, per head waterconsumption increases by 21 per cent. β2 issignificant at any level. β3, the proximitydummy coefficient takes the value of 0.107and is significant at 1 per cent level. β3 = 0.107signifies that the average domestic waterconsumption increases by 11 per cent
22 Arijit Roy
Journal of Rural Development, Vol. 31, No. 1, January - March : 2012
(approx.) for the households living near thewater source compared to the others. F =72.698 implies that all the coefficients arestatistically different from zero and aresignificant at any level , d.f. = (2,97). R² = 0.924signifies that approximately 92 per cent of thevariation in the dependent variable (DWC) isexplained by the regression model , R beingthe coefficient of multiple correlation. R²becomes 0.911 when adjusted for thedegrees of freedom.
We have also studied the contributionof income(Y), proximity of water source (PX)and cropping pattern (CP) to farming waterconsumption (FWC) disparity between samplehouseholds. In our log-lin model, natural logof (FWC) is regressed upon natural log of (Y),(PX) dummy and (CP) dummy. The estimatedregression results are shown in Table 7.
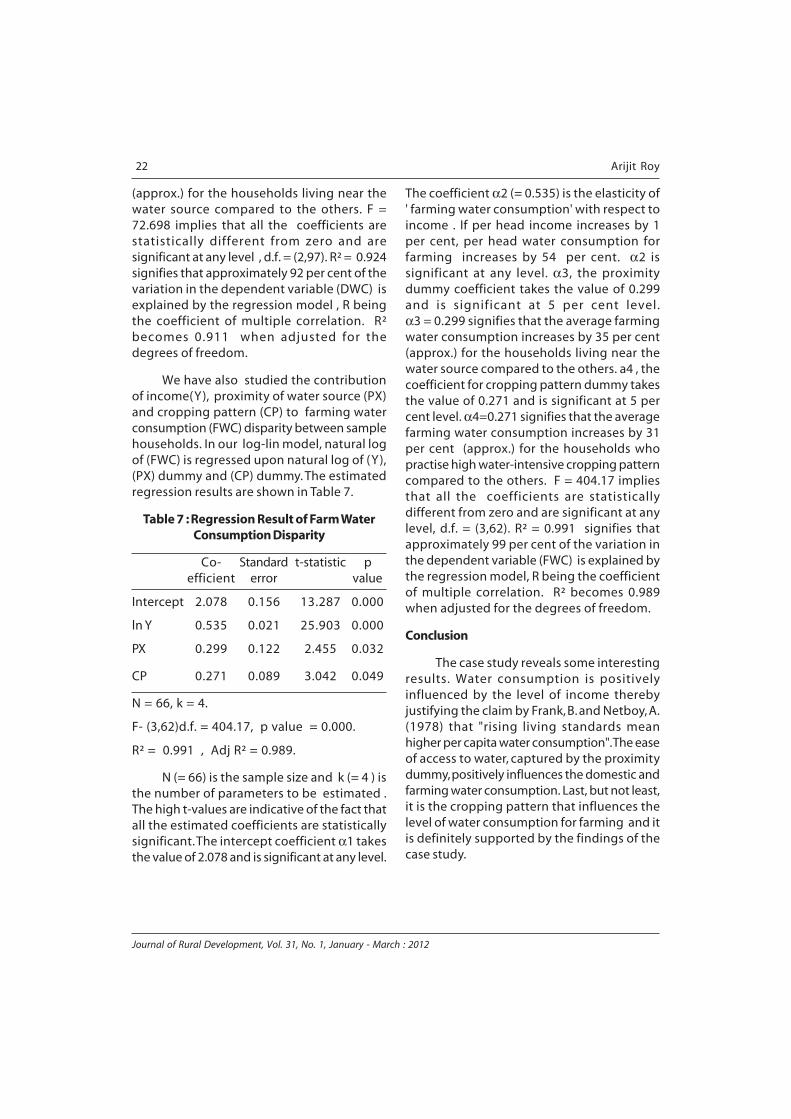
Table 7 : Regression Result of Farm WaterConsumption Disparity
Co- Standard t-statistic pefficient error value
Intercept 2.078 0.156 13.287 0.000
ln Y 0.535 0.021 25.903 0.000
PX 0.299 0.122 2.455 0.032
CP 0.271 0.089 3.042 0.049
N = 66, k = 4.
F- (3,62)d.f. = 404.17, p value = 0.000.
R² = 0.991 , Adj R² = 0.989.
N (= 66) is the sample size and k (= 4 ) isthe number of parameters to be estimated .The high t-values are indicative of the fact thatall the estimated coefficients are statisticallysignificant. The intercept coefficient α1 takesthe value of 2.078 and is significant at any level.
The coefficient α2 (= 0.535) is the elasticity of' farming water consumption' with respect toincome . If per head income increases by 1per cent, per head water consumption forfarming increases by 54 per cent. α2 issignificant at any level. α3, the proximitydummy coefficient takes the value of 0.299and is significant at 5 per cent level.α3 = 0.299 signifies that the average farmingwater consumption increases by 35 per cent(approx.) for the households living near thewater source compared to the others. a4 , thecoefficient for cropping pattern dummy takesthe value of 0.271 and is significant at 5 percent level. α4=0.271 signifies that the averagefarming water consumption increases by 31per cent (approx.) for the households whopractise high water-intensive cropping patterncompared to the others. F = 404.17 impliesthat all the coefficients are statisticallydifferent from zero and are significant at anylevel, d.f. = (3,62). R² = 0.991 signifies thatapproximately 99 per cent of the variation inthe dependent variable (FWC) is explained bythe regression model, R being the coefficientof multiple correlation. R² becomes 0.989when adjusted for the degrees of freedom.
Conclusion
The case study reveals some interestingresults. Water consumption is positivelyinfluenced by the level of income therebyjustifying the claim by Frank, B. and Netboy, A.(1978) that "rising living standards meanhigher per capita water consumption". The easeof access to water, captured by the proximitydummy, positively influences the domestic andfarming water consumption. Last, but not least,it is the cropping pattern that influences thelevel of water consumption for farming and itis definitely supported by the findings of thecase study.

Journal of Rural Development, Vol. 31, No. 1, January - March : 2012
Water Use Pattern of Rural Community in Gangetic West Bengal – A Case Study 23
References
1. Bhattacharyya, D., Roy, G.B., Das, J.K., (2008), Water Use Efficiency on the Basis of Socio-Economic Classes- A Study in Howrah District of W.B., Journal of Interacademicia, 12(4), pp. 478 - 482.
2. Frank, B. & Netboy, A. (1978), Water, Land and People, Alfred A Knopf Inc. London.
3. Kumar, A.C., Malhotra, K.C., Raghuram, S. and Pais, M. (2000), Case Study : India , Water & Pollution Dynamicsin a Rural Area of Tumkur District, Karnataka State, Water & Population Dynamics : Case Studies & PolicyImplications Edited by Sherbinin, A.D. and Dompke, V., HTML Document, Date & Time of Access :17.05.2009,8-15 A.M.
4. Kumar, M., Gaur, D. R., Goel, M., Mishra, R., (2009), Water Collection and Consumption Behaviour in RuralHaryana, The Internet Journal of Epidemiology, 6(2).

M. Mahadeva*
INCREMENTAL HOUSING ANDHOUSING TRANSFORMATIONOF THE POOR IN KARNATAKA :PROBLEMS AND PROSPECTS
Journal of Rural Development, Vol. 31, No. (1) pp. 25 - 42NIRD, Hyderabad.
* Member, Karnataka Public Service Commission (KPSC), Udyoga Soudha, Park House Road, Bangalore-560001. Email: [email protected]
Acknowledgement
* This paper is based on a completed research project at the Institute for Social and Economic Change(ISEC), Bangalore, when the author was a faculty member in Economics. The author is grateful to theManaging Director and the administrative authorities of the Rajiv Gandhi Rural Housing CorporationLimited, Bangalore for their support to the study. The research assistance of Mr. K. Keshavamurthy, Mr.Nitin Tagade and the academic support of Dr. KG Gayathri Devi at ISEC are gratefully remembered. Butfor their support this research would not have been possible. The author is especially grateful to theanonymous referee for the valuable comments on the earlier version of the paper. The views expressedin this paper are entirely of the author and do not reflect on the current institutional affiliation.
ABSTRACT
Social housing schemes have historically played a very significant role inalleviating the housing poverty in the rural and urban areas of the country and inrealising the dreams of houseless poor families at the national and sub-nationallevels. With the national and state governments' financial commitments for theimplementation of the social housing schemes, additional housing stock has beencreated and thereby the housing deprivation has been minimised, especially inthe rural areas of the country. These schemes have contributed for the increase inthe housing stock in the pucca and semi-pucca streams and thereby the incidenceof the dilapidated units has been brought down substantially. Also these schemeshave been successful in bringing about housing comforts as well as increasedaccess to housing amenities like household electricity, sanitation, drinking waterand drainage. Besides, a good number of beneficiary families have successfullyundertaken a few economic activities and have enhanced their family income tosome extent. Despite these positive impacts on the poorer sections, the functioningof the social housing schemes has been bogged down by a number of problemsfrom panchayat, beneficiary and village corners. Inadequacy of housing benefits,prevalence of corruption, various costs involved in receiving the housing benefitsand use of the external influence are some of the problems identified. This paper,after having considered all these issues in greater detail based on an empiricalresearch in Karnataka, suggests alternatives for better administration of the socialhousing schemes.
26 M. Mahadeva
Journal of Rural Development, Vol. 31, No. 1, January - March : 2012
Introduction
Incremental housing refers to overallimprovement in the housing and livingconditions among the beneficiary familiesunder various social housing schemes. To bespecific, it is a situation in which thebeneficiary families experience a betterhousing structure or transformation of thefamilies' dwelling from deficient housing unitsto better structured units, on account ofreceiving the housing benefits. With theincremental housing, the families would haveovercome the insecurity feeling they werefacing in the deficient housing. It is a situationthat provides improved space for the familymembers thereby experiencing privacy withinthe housing environment. Further, being therecipient of the housing benefit, the familieshave been experiencing increased access tobasic housing amenities like the householddrinking water, sanitation, electricity anddrainage connection. In other words, thebeneficiary families with the changingcircumstances would have minimised thesedeprivations. Finally, incremental housing maylead to the use of their housing units forundertaking some economic activities by thebeneficiary families and would have led toimprovement in employment and income oftheir households.
Ever since Independence, IndianGovernment is committed to the developmentof the housing sector to ensure housing facilityto the houseless people and has particularlyengaged itself to meet this critical basic needfor the poorer sections, as they cannot affordit by themselves or can obtain from the privatesector and the market. Social housing schemesare one of the prominent interventions of thenational government, which have beenintroduced from the very First Five Year Planin the country to meet the housing needs ofthe vulnerable groups, both in the rural andurban areas (Mahadeva, 1994). The socialhousing schemes (like Subsidised Industrial
Housing, Low Income Group Housing, MiddleIncome Group Housing, Rental HousingScheme, Village Housing Project Scheme,Plantation Labour Housing Scheme and RuralHouse Sites Scheme) introduced by thenational government were implemented bythe state governments till early nineties. Withthe declaration of the year 1987 as the“International Year of the Shelter for theHomeless” by the United Nations Assemblyand after enacting the first National HousingPolicy in 1987 in the countr y, stategovernments have started playing their ownrole for the development of housing sector atthe sub-national level. In fact, the NationalHousing and Habitat Policy-1998 has been amilestone in clearly defining the role of thestate governments in the development ofhousing sector (GoI, 1998). These initiativespaved ways for laying a strong foundation atthe sub-national level to meet the housingneeds of the various sections, particularly thepoorer sections by the state itself, byintroducing their own social housing schemes,in addition to the implementation of thenational schemes.
Karnataka is one of the prominent Statesin south India to have committed itself to meetthe housing needs of the houseless families,particularly of the poorer sections, weakersections and socially distanced sections(Mahadeva, 2004). In fact, of the five differentsocial housing schemes in vogue for meetingthe housing requirement of the variousvulnerable groups, four have been introducedby the State government with its own publicpolicy and financial commitment, since earlynineties. Setting up of a specialised institutionfor the administration of housing benefitsunder the social housing schemes andfinancing these schemes on a continuum basishave been the testimony for the sustainableconcern of the State. Correspondingly, theseschemes have also lived up to their own goalsand mission, by and large, in giving the

Journal of Rural Development, Vol. 31, No. 1, January - March : 2012
Incremental Housing and Housing Transformation of the Poor ... 27
homestead rights to the targetedbeneficiaries and in meeting the housingneeds of the poorer sections. However, therehave been a number of misconceptions on theworking of these schemes, in terms of coveringthe genuine beneficiaries, financingcommitment of the state and on the impactof the social housing schemes on the housingstock and on the beneficiary families, withregard to housing security, incrementalhousing, increasing access to housingamenities, improvement in the familyconditions, corruption in the administrationand other problems etc. Thesemisconceptions have come to the fore frommany corners of the society, mainly on accountof the fact that there are hardly any empiricalresearch studies on the social housingschemes, either at the national or sub-nationallevel. More so, in the case of Karnataka,empirical research on the functioning andimpact on the social housing schemes arealtogether absent. Therefore, addressing theseissues, particularly on the misconceptionsabout the social housing schemes in the Stateis the main purpose of the paper, which isbased on an empirical research study.
The principal objectives of the paper are:(a) to study the role of the State in terms ofthe administrative and financial commitmentstowards the social housing schemes; (b) toassess the impact of the existing social housingschemes in terms of the housing stock createdand residential sites distributed in the State;(c) to examine the impact of the social housingschemes on the beneficiary families in regardto the incremental housing, access to basichousing amenities, new economic activitiesundertaken and family income; (d) to analysethe various problems encountered by thebeneficiaries in receiving the housing benefitsunder the social housing schemes; and (e) tooffer various policy alternatives for making thesocial housing schemes more effective, interms of attaining the goals and achieving
better results. This study was conducted intwenty taluks, including the nine identified asbackward by the High Power Committee(HPCFRRI, 2002), spread into eleven districtsof the State and used both secondary andprimary data for the analysis. Primary data werecollected through a specially designed andtested questionnaire from 1, 632 beneficiaries,covering the representative samples from allthe five social housing schemes implementedin the study area. Secondary data werecollected from various official documents,maintained by the Rajiv Gandhi Rural HousingCorporation (RGRHC), a nodal agency for theadministration of the social housing schemesin the State.
The State Intervention
The role of the State government inregard to the administration of the socialhousing schemes can be captured under threedifferent domains viz, (a) Social HousingSchemes (in terms of the core purpose, targetgroup, financial assistance available); (b)institutional arrangement-RGRHC; and (c)public expenditure on the social housingschemes. Since the success of any publicintervention largely depends on politicalcommitment, these three parameters havebeen analysed, as they roughly refer to thepolitical will of the State.
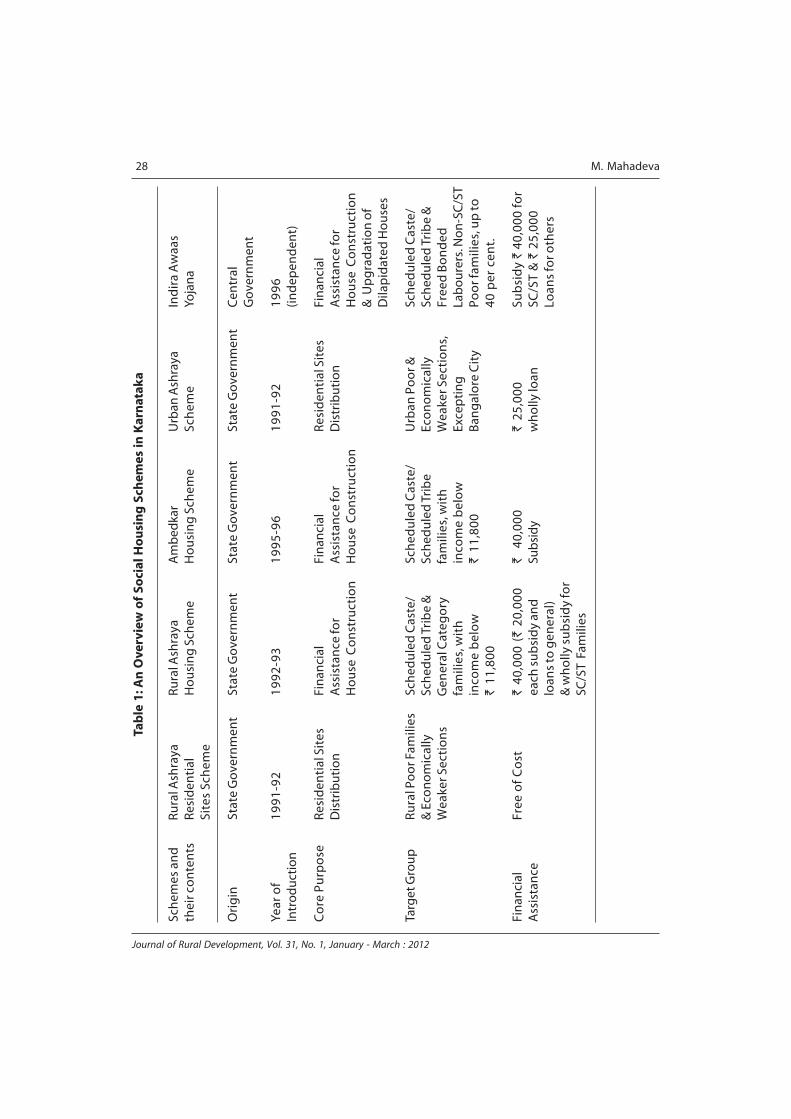
Social Housing Schemes : By design ofthe social housing schemes, the Stategovernment has been intending to achievetwo important ends of the poorer sections.First, provide residential site, which is one ofthe critical inputs of housing, for the familiesof poorer sections who want to construct theirhouses but are not prepared to do soimmediately. This strategy would giveopportunity to these families to preparethemselves and to plan their houseconstruction. Two of the schemes (RuralAshraya Residential Sites Scheme and UrbanAshraya Scheme) have been designed to
28 M. Mahadeva
Journal of Rural Development, Vol. 31, No. 1, January - March : 2012
Tab
le 1
: An
Ove
rvie
w o
f So
cial
Ho
usi
ng
Sch
emes
in K
arn
atak
a
Sch
emes
an
dR
ura
l Ash
raya
Ru
ral A
shra
yaA
mb
edka
rU
rban
Ash
raya
Ind
ira
Aw
aas
thei
r co
nte
nts
Res
iden
tial
Ho
usi
ng
Sch
eme
Ho
usi
ng
Sch
eme
Sch
eme
Yoja
na
Site
s Sc
hem
e
Ori
gin
Stat
e G
ove
rnm
ent
Stat
e G
ove
rnm
ent
Stat
e G
ove
rnm
ent
Stat
e G
ove
rnm
ent
Cen
tral
Go
vern
men
t
Year
of
19
91
-92
19
92
-93
19
95
-96
19
91
-92
19
96
Intr
od
uct
ion
(in
dep
end
ent)
Co
re P
urp
ose
Res
iden
tial
Sit
esFi
nan
cial
Fin
anci
alR
esid
enti
al S
ites
Fin
anci
alD
istr
ibu
tio
nA
ssis
tan
ce fo
rA
ssis
tan
ce fo
rD
istr
ibu
tio
nA
ssis
tan
ce fo
rH
ou
se C
on
stru
ctio
nH
ou
se C
on
stru
ctio
nH
ou
se C
on
stru
ctio
n&
Up
gra
dat
ion
of
Dila
pid
ated
Ho
use
s
Targ
et G
rou
pR
ura
l Po
or F
amili
esSc
hed
ule
d C
aste
/Sc
hed
ule
d C
aste
/U
rban
Po
or &
Sch
edu
led
Cas
te/
& E
con
om
ical
lySc
hed
ule
d T
rib
e &
Sch
edu
led
Tri
be
Eco
no
mic
ally
Sch
edu
led
Tri
be
&W
eake
r Sec
tio
ns
Gen
eral
Cat
ego
ryfa
mili
es, w
ith
Wea
ker S
ecti
on
s,Fr
eed
Bo
nd
edfa
mili
es, w
ith
inco
me
bel
ow
Exce
pti
ng
Lab
ou
rers
. No
n-S
C/S
Tin
com
e b
elo
w`
11,
800
Ban
gal
ore
Cit
yP
oo
r fam
ilies
, up
to`
11,
800
40 p
er c
ent.
Fin
anci
alFr
ee o
f C
ost
` 4
0,00
0 (`
20,
000
`
40,0
00`
25,
000
Sub
sid
y `
40,
000
for
Ass
ista
nce
each
su
bsi
dy
and
Sub
sid
yw
ho
lly lo
anSC
/ST
& `
25,
000
loan
s to
gen
eral
)Lo
ans
for o
ther
s&
wh
olly
su
bsi
dy
for
SC/S
T F
amili
es

Journal of Rural Development, Vol. 31, No. 1, January - March : 2012
Incremental Housing and Housing Transformation of the Poor ... 29
distribute residential sites to the poor familiesand economically weaker sections in rural andurban areas (excluding the Bangalore City) ofthe State. It may be noted that the residentialsites are distributed free of cost for the ruralbeneficiaries. Secondly, distribution of financialassistance for the houseless families owningresidential sites for house construction is theother strategy of the State. While doing so,there are no guidelines prohibiting/barringdistribution of financial assistance for thereconstruction of the existing houses by thebeneficiaries and therefore, distribution offinancial assistance for reconstruction of theexisting is also widely practised. Two schemes(Rural Ashraya Housing Scheme and AmbedkarHousing Scheme) are exclusively intended toprovide financial assistance for houseconstruction for their respective target group.Scheduled caste and scheduled tribe familiesbeing the major constituents in the totalhousing shortage of the State (Mahadeva,2008a), the beneficiaries of thesecommunities get full financial assistance in theform of subsidy under the schemes. A notablefeature of Indira Awaas Yojana, a Centrallysponsored scheme, is that it earmarks financialassistance up to 20 per cent of the totalallocation for upgradation of the houses and` 10,000 subsidy for individual beneficiaries.
Institutional Arrangement : One of thebetter reflections of the housingadministration is to establish Rajiv Gandhi RuralHousing Corporation Limited (RGRHCL) in theyear 2000 to implement all the social housingprogrammes for the economically weakersections and for the special occupationalcategories in rural and urban areas in the Stateof Karnataka with greater efficiencies inbuilding housing infrastructure in the State.The main objectives of the RGRHCL are to (a)provide affordable housing for EconomicallyWeaker Sections (EWS) in the State; (b)promote partnership with Gram Panchayat andNGOs in rural areas; (c) provide choice to
people in housing design, materials andtechnologies through self-help; (d) promotecost-effective building technologies in ruralareas through Nirmithi Kendras; (e) raiseresources and ensure recirculation of thefunds; and (f ) promote sustainable housingprogramme through encouragingbeneficiaries to save for housing and repayhousing loans. The RGRHCL has three mainstrategies to achieve its objectives viz, (a)implementing social housing schemes withself-help method, involving the beneficiaries;(b) enabling smooth flow of funds for theimplementation of the social housingschemes; (c) organising manufacture or bulkprocurement of cost-effective buildingmaterials; and (d) recovering the loans fromthe beneficiaries through a beneficiary–friendly mechanism. RGRHCL has beendesignated as a nodal agency forimplementation of the social housing schemesin the State in general and the rural areas inparticular.
Public Expenditure on Social HousingSchemes : The problem of housing of thepoorer sections cannot be solved by meredesigning a range of social housing schemesbut by financing them by public source. In fact,the success of the social housing schemesentirely depends upon financing them by theState to the extent that the higher the publicexpenditure on social housing schemes, themore the housing stock created and morebeneficial for the beneficiaries. It can be evensaid that the commitment of the State forhousing the poorer sections is better judgedby the public expenditure towards the same.In this regard, public expenditure on the socialhousing schemes has not only constantlyincreased in the State during the decade from2001-02, but is also spent to the tune of` 4677.02 crore during the period (Table 2).Interestingly, a total expenditure of ̀ 3646.18crore (78 per cent) has been incurred on theState-owned social housing schemes and the

30 M. Mahadeva
Journal of Rural Development, Vol. 31, No. 1, January - March : 2012
Table 2 : Public Expenditure on Social Housing Schemes in Karnataka2001-02 to 2009-10 (Rupees in Crore)
Year Social Housing Schemes in Rural and Urban Areas
Rural Rural Indira Awaas Urban TotalAshraya Ambedkar Yojana Ashraya
2001-02 143.59* (55.97) 35.24 (13.73) The scheme was 77.75 (30.30) 256.58
2001.02 273.77 (65.31) 52.98 (12.67) not implemented 91.80 (21.92) 418.55
2002-03 230.53 (71.85) 36.83 (11.48) by RGRHCL during 53.50 (16.67) 320.86
2003-04 217.49 (75.46) 32.55 (11.29) the years. 38.17 (13.25) 288.21
2004-05 174.76 (61.74) 18.11 (06.39) 59.73 (21.11) 30.46 (10.76) 283.06
2005-06 156.01 (49.82) 13.01 (04.15) 121.50 (38.80) 22.64 (07.23) 313.16
2006-07 255.90 (63.73) 13.47 (03.35) 118.07 (29.40) 14.08 (03.52) 401.52
2007-08 617.15 (83.04) 23.26 (03.13) 99.14 (13.34) 3.63 (00.49) 743.18
2008-09 558.69 (62.08) 36.34 (04.04) 299.11 (33.24) 5.79 (00.64) 899.93
2009-10** 373.04 (49.61) 38.11 (05.07) 333.29 (44.32) 7.53 (01.00) 751.97
Total 3,000.93(64.16) 299.90 (06.41) 1,030.84 (22.05) 345.35 (7.38) 4677.02
Note: Figures in the parentheses indicate percentages to the total.
* includes the amount spent under the scheme Neralina Bhagya.
** Figures are up to January 2010.
Source : RGRHCL, Bangalore.
rest of `1030.84 crore (22 per cent) on theCentrally sponsored scheme. With this, theaverage housing expenditure works out at` 467.70 crore; this has increased from` 256.58 crore in 2001-02 to ` 751.97 crorein 2009-10. While doing so, greater impetushas been accorded to the development ofhousing in rural areas, with a total expenditureof 92.38 per cent and the same is justifiableconsidering the highest magnitude of theincidence of housing shortage in rural areasof the State. Further, across the various socialhousing schemes, given the coverage of the
beneficiaries, Rural Ashraya schemeaccounted for over 64 per cent of the totalexpenditure (` 3000.93 crore), on an average` 300 crore every year. Further, one of thesignificant features of the scheme has beenthat the public expenditure incurred isenhanced by more than two and a half foldfrom ` 143.59 crore in 2001-02 to ` 373.04crore in 2009-10 in nominal terms. However,in the relative terms, the percentage share inexpenditure has fallen from almost 56 in 2001-02 to 50 in 2009-10. Indira Awaas Yojana (IAY),the second largest scheme implemented in
Journal of Rural Development, Vol. 31, No. 1, January - March : 2012
Incremental Housing and Housing Transformation of the Poor ... 31
the State has got a total expenditure of` 1030.84 crore in a span of six years or` 171.81 crore per year. But, unlike the RuralAshraya scheme, expenditure on the IAY hasincreased in both absolute and relative termsfrom ` 59.73 crore (21 per cent) in 2004-05to ` 333.29 crore (over 44 per cent) in 2009-10. In the case of Rural Ambedkar HousingScheme, the total expenditure incurred wasonly around ̀ 300 crore and the relative shareof the scheme is drastically reduced from 14per cent to only 5 per cent during the reviewperiod. Finally, under the Urban Ashrayascheme, a total expenditure of ̀ 345.35 crorehas been incurred and it comes to ` 34.53crore per annum or only 7.38 per cent of thetotal expenditure. The irony is that the schemewas the second largest in 2001-02 with a totalexpenditure of ̀ 77.75 crore or 30.30 per cent,but it lost its importance with a totalexpenditure of only ` 7.53 crore or just 1 percent in the total expenditure.
Impact Assessment
The impact of the social housing schemescan be better judged initially by the numberof houses constructed and the residential sitesdistributed in the State during the period ofassessment, as they mirror the politicalcommitment of the State. Secondly, nothingshould undermine the importance of the socialhousing schemes, as long as they contributeto overall improvement of welfare of thetarget group. This can be better reflected withregard to improvement in quality stock,promotion of housing privacy, improvementin housing amenities and better prospects forhousehold economic activities, as detailedbelow.
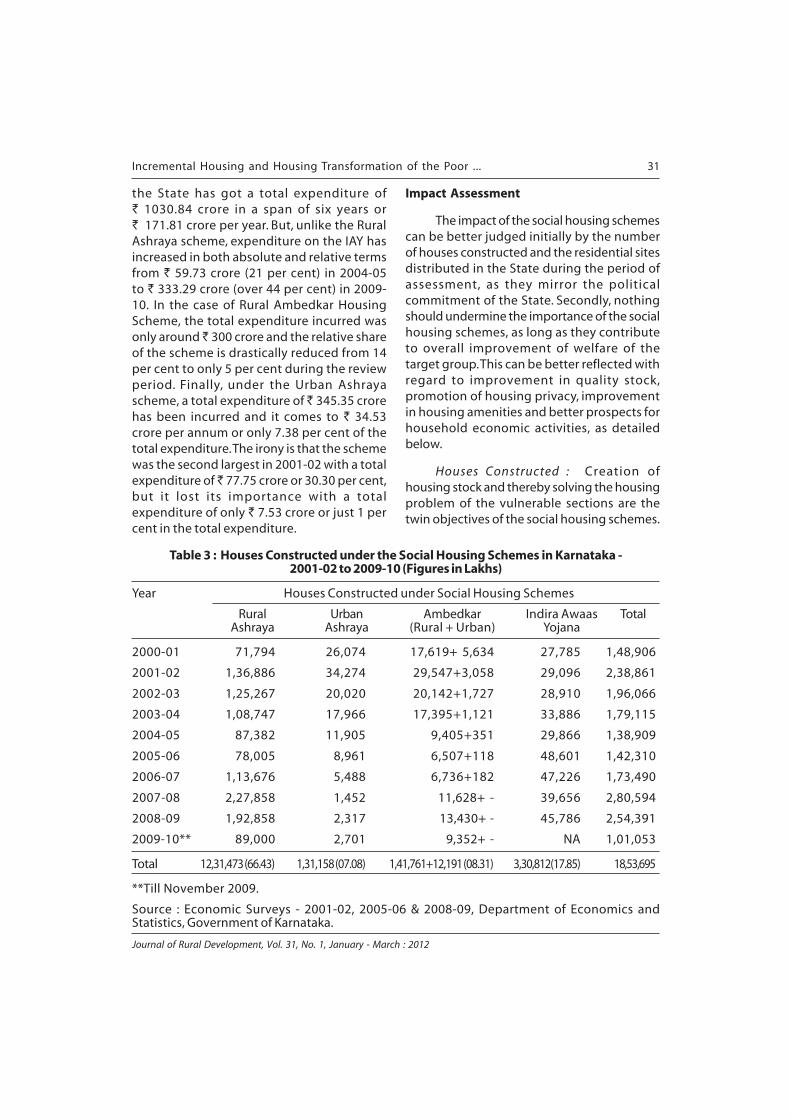
Houses Constructed : Creation ofhousing stock and thereby solving the housingproblem of the vulnerable sections are thetwin objectives of the social housing schemes.
Table 3 : Houses Constructed under the Social Housing Schemes in Karnataka -2001-02 to 2009-10 (Figures in Lakhs)
Year Houses Constructed under Social Housing Schemes
Rural Urban Ambedkar Indira Awaas TotalAshraya Ashraya (Rural + Urban) Yojana
2000-01 71,794 26,074 17,619+ 5,634 27,785 1,48,906
2001-02 1,36,886 34,274 29,547+3,058 29,096 2,38,861
2002-03 1,25,267 20,020 20,142+1,727 28,910 1,96,066
2003-04 1,08,747 17,966 17,395+1,121 33,886 1,79,115
2004-05 87,382 11,905 9,405+351 29,866 1,38,909
2005-06 78,005 8,961 6,507+118 48,601 1,42,310
2006-07 1,13,676 5,488 6,736+182 47,226 1,73,490
2007-08 2,27,858 1,452 11,628+ - 39,656 2,80,594
2008-09 1,92,858 2,317 13,430+ - 45,786 2,54,391
2009-10** 89,000 2,701 9,352+ - NA 1,01,053
Total 12,31,473 (66.43) 1,31,158 (07.08) 1,41,761+12,191 (08.31) 3,30,812(17.85) 18,53,695
**Till November 2009.
Source : Economic Surveys - 2001-02, 2005-06 & 2008-09, Department of Economics andStatistics, Government of Karnataka.

32 M. Mahadeva
Journal of Rural Development, Vol. 31, No. 1, January - March : 2012
From this perspective, house construction hasbeen given greater impetus in the rural areasunder the social housing schemes in the State.This is largely on account of the pressing needfor construction of housing units to meet theimmediate needs of the target people.Secondly, the people seeking housing benefitsunder social schemes largely prefer financialassistance for housing units on priority basis.Thirdly, implementing agencies prefer toprovide financial assistance for houseconstruction, as it does not involve landacquisition process and the relatedadministrative delays. Over and above,availability of suitable land in the close vicinityof the existing rural settlements anddevelopment of the residential infrastructurelike roads, drainage, water supply, electricityand others have turned out to be a seriouschallenge. Fourthly, in order to discourage theresidential site allotters from resorting todisposal of their sites, distribution of financialassistance is encouraged mostly. With thisbackdrop, it is evident from Table 3 that a totalnumber of 18, 53, 695 houses have beenconstructed in the State under various socialhousing schemes, on an average of 1, 85, 369houses every year during 2001-02 to 2009-10. As is reflected already in the housingexpenditure, the housing stock created in theState has largely depended upon theexpenditure incurred under each of theschemes. Rural Ashraya has been playing a verysignificant role in the creation of housingstock with 12.31 lakh units and has a majorshare of over 66 per cent. During the periodunder assessment, 1, 23, 147 housing unitshave been constructed under the scheme. Theother scheme, which has significantlycontributed to the creation of housing stock isIAY with over 3.30 lakh units or around 18 percent of the total stock. This is followed byAmbedkar Housing Scheme (AHS) with 1, 53,952 units in rural and urban areas and UrbanAshraya (UA) with over 7 per cent contributionin the State. But, one of the disappointing
observations is the significant erosion of theimportance in the implementation of AHS andUA in the recent years. The house constructionunder AHS, which was 17,619 units in 2001-02 came down to 9,352 units in 2009-10 andits non-implementation in the urban areassince 2007-08 is a serious concern, as theincidence of families of the target group facinghousing problem is growing immensely. Thecase of the UA is the same. The number ofhousing units constructed under the UA hasdrastically fallen from 26,074 to just 2,701during the period under reference.
Distribution of Residential Sites:Notwithstanding the advantages associatedwith construction of housing units, distributionof residential sites is an essential requirementfor such families that are newly formed,separated from joint families, homelesswidows, migrated and other vulnerable groupsbelonging to poverty group in rural and urbanareas to initiate the process of houseconstruction. In reality, the actual process ofhouse construction commences with theresidential sites and moreover, enthusiasm onthe part of the poor houseless families is more,if they own residential sites. Despite the factthat residential site is the foremost criticalrequirement for house construction,distribution of residential sites to various targetgroups under the social housing schemes hasnot progressed the way it was expected in theState, as compared to house construction. Itcan be discerned from Table 4 that only 1.16lakh residential sites have been distributed inthe State in the last ten years. Also, it isdisappointing to note that there has been adeclining trend in the distribution ofresidential sites both in rural and urban areas,respectively from 13,000 to 1,097 and 2,994to 908 during the period of assessment.Especially, residential site distribution in urbanareas under the Urban Ashraya Scheme hasbeen historically far less than in the rural areas,which needs rethinking to realise the dream

Journal of Rural Development, Vol. 31, No. 1, January - March : 2012
Incremental Housing and Housing Transformation of the Poor ... 33
of the urban poor. Given the dynamics involvedin the process of residential site acquisitionlike suitability and affordability and but for thescheme, it would have been next toimpossible for the poor people to acquireresidential site in urban areas.
Quality Improvement : Quality of housingis one of the important aspects, which reflectsboth on the overall living standard of thepeople and the importance attached to thedevelopment of housing in any society.Development of the standard housing units,which is weather proof, is expected to be theideal situation for all the families (Habitat,1996). It is an even more sufficient conditionif the poor families live in the all-weather
structures or in the housing units that providesafe dwelling during all seasons in a year andprovide safe housing. It is believed that onlypucca housing structure constructed out of thestandard building materials fulfills thisrequirement in rural and urban areas. It is alsoargued that in rural areas, semi-pucca housingunits constructed with standard buildingmaterials either for walls or for the roof alsoensures safe dwelling but with time to timeintervention for their improvement (Rao,1988). Kutcha housing units on the other hand,are not considered safe for living and do notensure safety for the families round the year.It is attributed further that such housing unitsmay collapse, especially during the rainyseason on account of their poor constructionthereby families dwelling there would alwaysbe under housing threats.
From these perspectives, it is importantto note that the existing social housingschemes in the State have brought respiteamong the beneficiary families in bringing anoverall improvement in the housing situation.It is observed that housing condition in thestudy area has especially improved afterreceiving the housing benefit ( Table 5), interms of the changing stock of the housingunits. The kutcha housing units, which werethe predominant dwelling stock of thebeneficiaries, have reduced their populationonce the poor families have received the newhousing benefits. As a result, there has been asignificant decline in the kutcha housing stockfrom 64 per cent to less than one per cent. Inother words, people who have received thehousing benefits have transformed from thekutcha housing stock to the improvedstructure. This transformation has largelyoccurred among the OBC, general and STbeneficiaries, although almost 2 per cent ofthe SC beneficiaries have been continuing todwell in the kutcha stock. Secondly, there hasbeen a conspicuous increase in the semi-puccahousing stock by over three folds from 23 per
Table 4 : Residential Sites Distributed for thePoor in Karnataka - 2001-02 to 2009-10
Year Residential Sites Distributed
Rural UrbanAshraya Ashraya Total
Residential ResidentialSites Sites
2000-01 13,000 2,994 15,994
2001-02 19,784 18,267 38,051
2002-03 21,397 1,526 22,923
2003-04 7,392 3,826 11,218
2004-05 4,762 2,379 7,141
2005-06 6,814 3,160 9,974
2006-07 2,280 3,566 5,846
2007-08 1,191 2,066 3,257
2008-09 139 139 278
2009-10** 1,097 908 2,005
Total 77,856 38,831 1,16,687
**Till November 2008.
Source : Economic Surveys- 2001-02, 2005-06& 2008-09, Department of Economics andStatistics, Government of Karnataka.
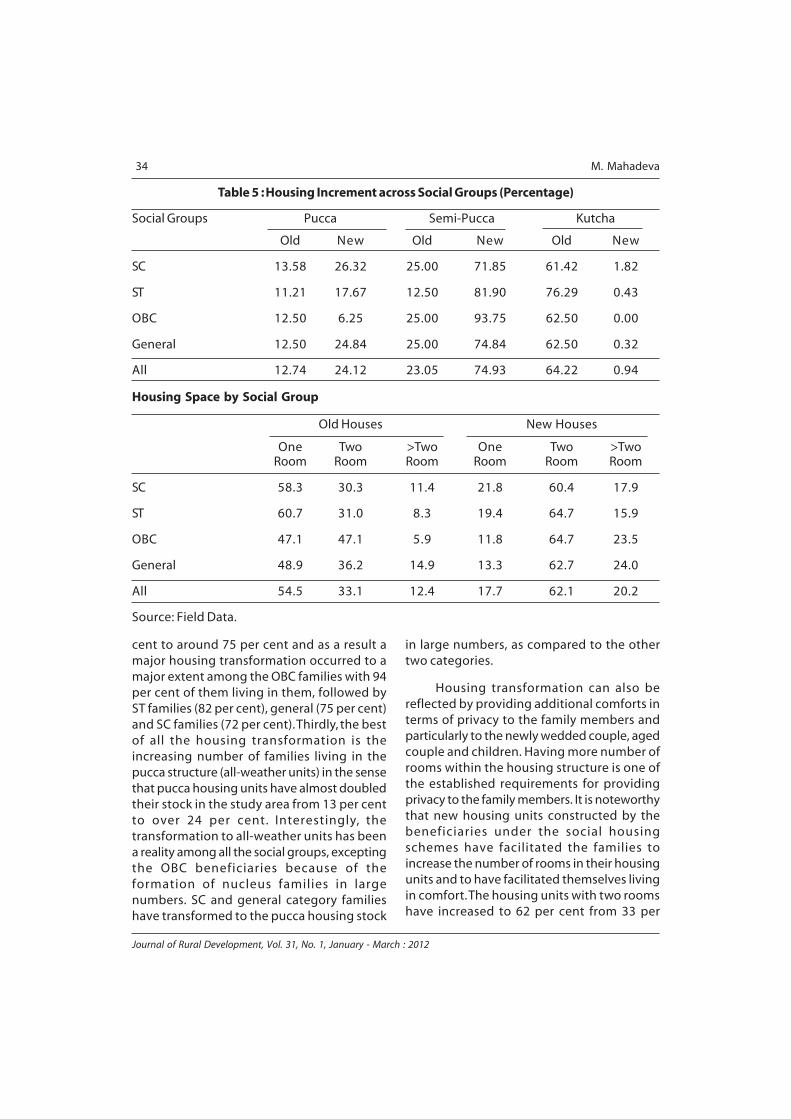
34 M. Mahadeva
Journal of Rural Development, Vol. 31, No. 1, January - March : 2012
Table 5 : Housing Increment across Social Groups (Percentage)
Social Groups Pucca Semi-Pucca Kutcha
Old New Old New Old New
SC 13.58 26.32 25.00 71.85 61.42 1.82
ST 11.21 17.67 12.50 81.90 76.29 0.43
OBC 12.50 6.25 25.00 93.75 62.50 0.00
General 12.50 24.84 25.00 74.84 62.50 0.32
All 12.74 24.12 23.05 74.93 64.22 0.94
Housing Space by Social Group
Old Houses New Houses
One Two >Two One Two >TwoRoom Room Room Room Room Room
SC 58.3 30.3 11.4 21.8 60.4 17.9
ST 60.7 31.0 8.3 19.4 64.7 15.9
OBC 47.1 47.1 5.9 11.8 64.7 23.5
General 48.9 36.2 14.9 13.3 62.7 24.0
All 54.5 33.1 12.4 17.7 62.1 20.2
Source: Field Data.
cent to around 75 per cent and as a result amajor housing transformation occurred to amajor extent among the OBC families with 94per cent of them living in them, followed byST families (82 per cent), general (75 per cent)and SC families (72 per cent). Thirdly, the bestof all the housing transformation is theincreasing number of families living in thepucca structure (all-weather units) in the sensethat pucca housing units have almost doubledtheir stock in the study area from 13 per centto over 24 per cent. Interestingly, thetransformation to all-weather units has beena reality among all the social groups, exceptingthe OBC beneficiaries because of theformation of nucleus families in largenumbers. SC and general category familieshave transformed to the pucca housing stock
in large numbers, as compared to the othertwo categories.
Housing transformation can also bereflected by providing additional comforts interms of privacy to the family members andparticularly to the newly wedded couple, agedcouple and children. Having more number ofrooms within the housing structure is one ofthe established requirements for providingprivacy to the family members. It is noteworthythat new housing units constructed by thebeneficiaries under the social housingschemes have facilitated the families toincrease the number of rooms in their housingunits and to have facilitated themselves livingin comfort. The housing units with two roomshave increased to 62 per cent from 33 per

Journal of Rural Development, Vol. 31, No. 1, January - March : 2012
Incremental Housing and Housing Transformation of the Poor ... 35
cent and more than two-room units to 20 percent from 12 per cent. These two increaseshave brought down the housing units with onlysingle room units from 55 per cent to around18 per cent, as can be seen in the Table. Acrossthe social group also, there is a significantchange in the number of rooms within thehousing units of the ST, OBC and Generalcategories. However, in the case of the SCfamilies, two-room housing units are slightlylower than the average. If more than 62 percent of the families belonging to ST, OBC andthe general categories are living in the two-rooms housing units, SC families haveaccounted to only 60 per cent in the studyarea. What is further interesting is to note thatthe number of housing units with more thantwo rooms increased from 8.3 to 15.9 per cent.In the case of ST households, this increase isvery high from 5.9 to 23.5 per cent. In thecase of the SC and general category families,
the increase is from 11.4 to 17.9 per cent and14.9 to 24 per cent, respectively. Consequentupon the significant increase, the housing unitswith only one room have drastically reducedfrom 58.3 to 21.8 per cent, with more thanthe average number of families belonging toSC and ST categories continue to dwell in thesingle room housing units in large numbers.
Housing Services Improvement : Theother important indicator of the housingtransformation is the improvement in theprovision of housing amenities or housingservices namely, access to drinking water,sanitation, drainage and electricity within thehousing units. A comparison of the householdamenities before and after receiving thehousing benefits indicates that there is asubstantial increase in their provisions,especially in the case of household electricity,although there is a very long way to go in
Table 6 : Access to Housing Amenities across the Social Groups (Percentage)
Social Electricity Sanitation Sources of Water Facility DrainageGroups
Piped Stand Pump Well Other
Before the Housing Benefits Received
SC 63.08 2.15 33.79 48.10 0.52 17.59 15.07
ST 48.71 1.29 24.00 52.89 1.78 21.33 9.05
OBC 37.50 0.00 37.50 43.75 18.75 0.00 6.25
General 67.72 4.11 35.29 42.52 2.18 20.00 11.08
All 62.53 2.83 32.91 46.47 1.62 19.00 12.33
After the Housing Benefits Received
SC 91.96 27.52 40.44 41.81 0.34 17.41 24.16
ST 92.67 30.17 32.46 43.86 1.75 21.93 15.15
OBC 93.75 26.67 37.50 37.50 25.00 0.00 13.33
General 95.99 36.10 50.17 30.85 1.69 17.29 23.08
All 93.80 31.59 43.17 37.54 1.41 17.89 22.17
Source: Field Data.

36 M. Mahadeva
Journal of Rural Development, Vol. 31, No. 1, January - March : 2012
providing these facilities for the poorersections (Table 6). Of all the housing amenities,social housing schemes have facilitated thebeneficiaries to have electricity connection totheir housing units to the extent of over 94per cent, as against only 62.53 per centpreviously. Similarly, in the case of thehousehold sanitation, the achievement is eyecatching in the sense that there has been aten-fold increase from 3 per cent to almost 32per cent. However, in the case of thehousehold drainage and drinking waterconnections, the progress achieved was onlytardy. In other words, only 22 and 43 per centof the beneficiaries have had connection forhousehold sanitation and drinking waterwithin their housing units. What is furtherimpressive is that the increase in the provisionof the housing services has been a realityacross all social groups but with a little ofvariation between them. A positivedevelopment among the beneficiaries is thatthere has been a drop in dependence on‘other’ sources of drinking water, which areavailable only outside the residential houses.Owing to the increase in the availability ofdrinking water connection within theresidential units, the dependence on standpump has been dropped by 8.93 points from46.47 to 37.53 per cent, wells from 1.62 to1.41 per cent and the other sources from 19.00to 17.89 per cent in the study area.
New Economic Activities : The newhouses constructed have also facilitated theinmates to undertake a few new economicactivities, which have further paved the wayfor increasing income of the families. In otherwords, the new housing units have been usednot only for dwelling, but also as a place foreconomic activities by a few beneficiaries, ifnot by all. It is found that these economicactivities have facilitated them to getemployment and augment the family income.Excepting the OBC beneficiaries, all the othershave undertaken a few economic activities,especially petty business like tailoring and
grocery shops. A few have also been able torear livestock in the new housing environment.Surprisingly, for a few, housing units with socialidentity have also facilitated to undertakedriver’s job. Interestingly, these economicactivities have contributed for augmenting thefamily income and per capita income of thebeneficiary families. It has been worked outthat there has been an increase in the familyincome from ` 30,168 to ` 32,201 and percapita income from ` 6,015 to ` 7,289. Thus,the family income has gone up by ` 2,033 andper capita by ` 1,274. These increases inincome are on account of savings of thehousing cost, which were in the form of rentand service charges. But at the same time, itneeds to be noticed that the increase afterowning new housing units has not been afeature across the social groups. Excepting thegeneral category families, all the others havecontinued to register family income muchbelow the average family income. It is alsotrue in the case of per capita income, more soin the case of SC/ST families. Finally, onascertaining the number of economicactivities undertaken by a few beneficiaries(21.38 per cent), economic incapabilities likelack of initial/seed capital and skills have beenattributed as the major reasons by a largemajority of the beneficiary families. Even moredisappointing is that none of the beneficiaryfamilies was aware of “Productive Housing inRural Areas”, a scheme to provide a compositeloan for housing as well as for production,designed by the National Housing Bank (NHB,2006).
Problems of the Social Housing
With an understanding of the role of theState and the impact of the social housingschemes in the State, let us turn our discussiontowards the problems confronted by thebeneficiaries in achieving success. The first andforemost problem of the social housingschemes is inadequate financial assistance forhouse construction. The present unit cost of

Journal of Rural Development, Vol. 31, No. 1, January - March : 2012
Incremental Housing and Housing Transformation of the Poor ... 37
the financial assistance up to ` 25,000 to` 40,000 is said to be grossly inadequate, ascompared to growing construction cost, if onewere to use fairly decent building materials,like burnt brick, cement and steel. The unit costfixed under these schemes is inadequate, evenif one uses the locally available buildingmaterials for house construction. This concern
was expressed by 77 per cent belonging to allthe segments of the beneficiaries and isargued that it is next to impossible to constructa decent housing unit. The amount isinadequate, especially for the provision for allthe housing amenities like drinking water,sanitation and electricity connection (Table 7).Under the existing support mechanism, most
Table 7 : Problems Associated with Social Housing Schemes
Problems by Scheduled Scheduled Other General TotalSocial Group Caste Tribe Backward Category
Community
1. Total Sample Beneficiaries 666 252 17 697 1632
2. Inadequacy of Benefit 597 232 16 623 1468
% in the Total 76.72 87.07 68.75 73.68 76.98
Additional Amount 597 232 16 623 1468
Less than ` 20,000 23.40 27.50 31.20 17.10 21.40
` 20,000 to 50,000 56.30 51.80 43.80 49.60 52.60
` 50,000 to 1,00,000 18.10 19.10 25.00 26.00 21.70
` 1,00,000 & Above 2.20 1.60 0.00 7.30 4.20
Source of Financing 597 232 16 623 1468
Own Savings 21.27 37.93 43.75 45.43 34.40
Disposal of Assets 16.42 27.59 12.50 4.49 13.08
Loans from SHGs 52.09 9.05 37.50 42.22 40.94
Moneylenders 10.22 25.43 6.25 7.86 11.58
3. Extent of Corruption 228 97 119 215 659
% in the Total 34.60 14.72 18.06 32.63 40.38
4. Cost of Housing Benefit
Application & 100.00 99.60 100.00 100.00 1631Documentation
Employment & Wage Loss 90.24 67.86 93.75 54.09 1164
Bribe at Panchayat Level 31.83 39.29 52.94 48.64 659
Others 4.05 5.16 41.18 7.75 101
5. Use of External Influence 312 137 10 447 936
% in the Total 46.85 54.36 58.82 64.13 57.35
Panchayat Member 296 130 8 425 859
Source : Perceptions as obtained by the beneficiaries on the social housing schemes from thestudy area.

38 M. Mahadeva
Journal of Rural Development, Vol. 31, No. 1, January - March : 2012
beneficiaries have either constructed half-housing units and provided facilities orconstructed full unit without providingamenities within their housing units. It can benoted from the Table that SC/ST beneficiarieshave in large numbers felt the brunt of beinginadequately financed. Although the total unitcost of construction varies, a majority of thebeneficiaries have invested almost an amount,which is over and above the unit cost fixed bythe government. Further, the inadequatefinancing has prompted the beneficiaries tofinance additionally by their own means,which is ranging from ̀ 20, 000 to over `1 lakh.It is very clear that over half of the beneficiarieshave financed between ̀ 20,000 and ̀ 50,000,by 22 per cent in the range of ` 50, 000 to 1lakh and over 21 per cent less than ` 20,000.Interestingly, a good number of beneficiarieshave also financed over `1 lakh forconstructing their housing units. It goeswithout saying that these beneficiaries madeprovisions for all the housing amenities, whichare not included in the unit cost under thesocial housing schemes. Further, what issignificant to note is the source of additionalfinancing of housing units by the beneficiaries.A majority of the beneficiaries have financedtheir unmet housing cost from the loans raisedfrom the Self-Help Groups (SHGs) followed bytheir own savings. A surprising fact is that noneof the beneficiaries borrowed assistance fromthe traditional commercial and housingfinancial markets (Mahadeva, 2008b & 2009)like the scheduled commercial banks, creditcooperative societies and others. But,inadequate financing of the housing projectby the government has also compelled thebeneficiaries to dispose a few householdassets like sheep, goat and other milch animalsand to borrow from the high-cost lending orthe doorstep moneylender in the rural areas.In fact, the incidence of asset disposal and highcost borrowing is more among the SC/STbeneficiaries.
Secondly, prevalence of corruption in theadministration of social housing schemes hasbeen a common problem. If inadequate costhurts the beneficiary families on the one side,pilferages in the unit cost of financial assistancedid hurt on the other side. Over 40 per cent ofthe beneficiaries have been affected by theproblem of corruption, which in turn resultedin stalling the house construction and in manycases the construction has been downsized.Thirdly, acquiring housing benefits under thesocial housing schemes involves a number ofcosts, including employment and sometimeswage losses. It was narrated that once theselection of beneficiaries is finalised,panchayat members and officials collectmoney from them towards various charges.Application and documentation is one of theimportant charges being collected and almostevery beneficiary incurred this expenditure inthe range of ` 1500-2000 per beneficiary.However, incurring such a huge expensetowards application and documentation wouldnot ensure automatically the housing benefit,but a follow-up has to be done by thebeneficiary and every time the beneficiarycomes to follow up, they lose employmentand related wage, besides incurringopportunity charges. It is indicated that overtwo-thirds of the beneficiaries opined that inthe process of obtaining housing benefit, theywould have lost employment and the relatedwage to the extent of `1000-1300 perbeneficiary. What is even more disappointingis the bribe that is being paid by thebeneficiaries for the members and the officialsinvolved in the administration of housingbenefits. Over 40 per cent of the beneficiariesreported to have paid bribe to the extent of` 2000-3000 per head to get the housingbenefits.
Finally, even after payment of bribe,housing benefit is not guaranteed, unless oneuses political influence at local level. This onlybrings to the fore that being houseless and

Journal of Rural Development, Vol. 31, No. 1, January - March : 2012
Incremental Housing and Housing Transformation of the Poor ... 39
payment of bribe would not qualify thefamilies to get housing benefits under socialhousing schemes. Also, distribution of housingbenefits depends upon the proximity that thehouseless families maintain with the people’srepresentatives and officials at the panchayatlevel. In other words, people’s representativesand officials play a significant role in thedistribution of housing benefits under thesocial housing schemes for more than half ofthe beneficiaries. It is found that about 57 percent of the beneficiaries used politicalinfluence to get the housing benefits and toexpedite the process of housing benefitdistribution. Gram Panchayat members are themajor source of the influence in thedistribution of housing benefits. In this regard,it is being maintained that panchayat membersdo have a major say in the distribution of thehousing benefits only to ensure that needyand genuine beneficiaries are not deprived ofthese benefits. It is also admitted that in theprocess of distribution of the housing benefits,the concern of the other members of thepeople's representatives has also beenaccommodated.
Some Alternative Policy Options
Housing is an important indicator toassess the position of an individual in a society,and the society at large reflects on itself howit has developed by housing infrastructure,especially for the poorer sections. In fact, agood housing environment mirrors the prioritythat a society has given to construction ofhouses for the poorer sections of society. Theseexpectations prompt the society and thegovernment to accord priority for developinga better housing environment to the houselessfamilies of poorer sections and facilitate themto construct decent housing units for dwellingto protect themselves and their belongings.Also, it should be noted that such environmentfacilitates a better access to all the housingamenities like households connected withdrinking water, sanitation, drainage and
electricity. Thus, it is indeed necessary that poorfamilies in the State are ensured with suchhousing environment and the facilitieswithout any encumbrances or problems, notonly to alleviate housing deprivation but alsoto mainstream them to better living conditions,especially in rural areas. Keeping these in view,the following policy implications arepresented for effective administration of thehousing benefits under the social housingschemes.
First, there is every need to assess thehousing needs of the poor families, once inevery five-year plan period in the State todesign and evolve housing strategies for thedevelopment. The local government at thegrossroot level in urban and rural areas shouldbe made responsible to prepare the list ofprospective housing benefit seekers, includingthe newly wedded and separated couple fromthe joint families in regular intervals. Thisapproach clearly gives an appropriate scenarioof housing requirements of the houselessindividuals and families and to put an end toad hoc approach, besides minimisingoverlapping. This approach will also lead tobetter administration of housing benefits, interms of planning, resource mobilisation,allocation and its application. While preparingthe list of prospective housing benefit seekers,local bodies should include all the socialgroups of all the communities and then toseparate the list of the aspirants into poor andnon-poor category and while administering thehousing benefit, the beneficiaries should beselected from the muster register. Thebeneficiary initially chosen from the musterlist should be placed before the gram sabhameetings of the panchayats and the objectionsfrom the fellow villagers should be invitedconfidentially and the finalisation of the list ofbeneficiaries be announced. If there are anyfurther objections, cross-checking of suchprospective beneficiaries should be done,preferably by the officials other than the

40 M. Mahadeva
Journal of Rural Development, Vol. 31, No. 1, January - March : 2012
panchayats. It is necessary to avoidencroachment of the benefits meant for thepoorer sections by the non-poor families.
Secondly, the present financialcommitment of the State towards socialhousing development should be stepped upfor many genuine reasons. If housing sectorgets the higher public resource allocation bythe State, it will facilitate increasing thenumber of beneficiaries, to meet theuncovered and deprived houseless families,especially in the rural areas and urban slums.Further, the present unit cost of housing fixedunder the social housing schemes isdisproportionately low and by and large, thepoorer section families are unable to meet thespiraling rise in the construction cost ofhousing. Keeping this critical economicinability of the poorer sections to meet thetotal cost of housing, there is every need andreason to enhance the unit cost of housingsubstantially under the social housingschemes. The other benefit of increasing unitcost of housing would release thebeneficiaries from the door-step and high-costmoneylenders besides desisting them fromdisposing their household assets for financingthe unmet cost of housing. Therefore, it wouldbe appropriate, if the State governmentenhances the unit cost of housing to ` onelakh per beneficiary. This will certainly meetmany ends like meeting the total cost ofconstruction, besides developing charges ofhousehold amenities. In this regard, thepresent effort of the State to enhance the unitcost of housing to ̀ 60,000 under the modifiedrural housing scheme (GoK, 2010) needsreconsideration to further enhance the sameto ̀ 1,00,000. Also, as a strategy of promotingbeneficiary contribution, there is everynecessity to promote thrift for housingactivities through beneficiary-SHG-banklinkage, which will bring about the financialinclusion of the houseless families in the State.
Thirdly, having established a trendtowards the replacement of dilapidatedhousing units and increasing housing comfortin the State under the social housing scheme,the target of the State must be to increase thestock of the all-weather or standard housingunits, especially in the rural areas. The presentthrust must be continued until the ruralhousing scenario is changed entirely toreplace the dilapidated/deficient housingunits. In order to do so, there shall be a specialdrive against the dilapidated housing units andto convert all the semi-pucca or sub-standardhousing units into pucca or standard housingunits. Similarly, there shall be a drive to convertall the existing single-room housing units intodouble or more than double-room units. Thiscan be realised by giving additional impetusfor replacement of dilapidated units as well asfor extension of the housing units in the yearsto come. Simultaneously, while undertakingthe drive, the State should also ensure toprovide all the housing amenities inside thehousing units, given the existing deficiency inthe development of housing amenities.Upscaling the achievement in the sanitationfront is also a need of the hour by integratingthe cost of the development into the total costof the housing unit, in order to eradicate opendefecation practices in rural areas.
Fourthly, in view of the fac t thatresidential site is one of the critical inputs ofmeeting housing need, houseless individualsand families plan for house construction onlywhen this end is met. Therefore, allotment ofresidential sites for the houseless familiesshould also be given equal priority in thehousing development administration. Thiswould facilitate the newly formed but sitelessfamilies to plan for their housing developmentactivity. In order to encourage distribution ofresidential sites in rural areas, people-friendlyorganisations and people’s initiatives shouldbe encouraged with the possible support from

Journal of Rural Development, Vol. 31, No. 1, January - March : 2012
Incremental Housing and Housing Transformation of the Poor ... 41
the State to identify and develop thegovernment land in the close vicinity of thevillages.
Fifthly, there should be every effort topromote employment and income generatingactivities within the housing units constructedunder the social housing schemes in the State.The economic activities not only diversify theidle family members to employ themselvesbut also encourage acquiring new skills andupgradation of the existing skills. The otheradvantage is that the economic activitiessupplement the family income. Keeping thegood intention of improving the incomes ofthe poorer sections, undertaking economicactivities should be made mandatory for allthe beneficiaries of the social housingschemes. As far as possible, the State shouldevolve strategy of productive housing schemeon the lines of the National Housing Bank. Also,these beneficiaries need to be given an initialfinancial support to undertake economicactivities within their houses. This would notonly facilitate the beneficiaries in the long runto minimise the dependence on the State butalso help them to finance their future needs.
Sixthly, it is extremely important tocontrol and avoid the increasing menace of
corruption in the administration of housingbenefits at the lower level under the socialhousing schemes. Although, payment offinancial assistance through bank accountsmakes sense to some extent, it does not ensurecorruption–free mechanism. Therefore, theState can explore the possibility of involvingLand Army and Nirmithi Kendras to undertakeconstruction of housing units for thebeneficiaries under the social housingschemes with the close involvement of thebeneficiaries at every stage of theconstruction. This method, though not acorruption-free, will certainly bring down themenace to a large extent.
In sum, the implementation authoritiesshould be exposed to the social message(homestead right and housing security) thatthe State is carrying through the social housingschemes. The authorities should be made toimplement these schemes to their fullestpotential, in terms of the target evolved andthe financial resources allotted under themand be made accountable for the totaladministration of housing benefit under eachof the housing schemes.
References
1. Government of India (1998), National Housing and Habitat Policy, Ministry of Urban Affairs & Employment,New Delhi.
2. Government of Karnataka (2010), Budget 2010-11, March 05, 2010.
3. Habitat (1996), An Urbanizing World- Global Report on Human Settlements, Oxford University Press.
4. HPCFRRI (2002), High Power Committee of Regional Imbalances: Final Report, Government of Karnataka,Bangalore.
5. Mahadeva (1994), Housing Policies in India- An Overview, Nagarlok, Vol XXVI, No 2, pp 53-62.
6. ——— (2004), Housing Problem and Public Action: Continued Incompatibility- Experience from a SouthIndian State, Review of Development and Change, Volume IX, Number 1, pp 41-67.
7. ——— (2008a), Housing Problem of Scheduled Caste and Scheduled Tribe Families in Karnataka : AnAlternative Framework, Journal of Social and Economic Development, Vol 10, No 1, pp 127-151.

42 M. Mahadeva
Journal of Rural Development, Vol. 31, No. 1, January - March : 2012
8. —————— (2008b), Financial Growth in India : Whither Financial Inclusion? Margin- The Journal ofApplied Economic Research, 2:2, pp 177-197.
9. ——— (2009), Challenges of a Sustainable Housing Finance System in India, Margin-The Journal of AppliedEconomic Research, 3:1, pp 41-61.
10. NHB (2006), Finance for Rual Housing-A Report, National Housing Bank, New Delhi.
11. Rao, Seshagiri.Y (1988), Housing Needs, National Building Organisation, New Delhi, Government of India.

Manoj Kumar Joshi*
RURAL BANKING SCENARIO ININDIA AND THE OPPORTUNITYFOR COMMERCIAL BANKS
Journal of Rural Development, Vol. 31, No. (1) pp. 43 - 60NIRD, Hyderabad.
* Faculty Member, (ICFAI Business School), IFHE (ICFAI Foundation for Higher Education), Deemed-to-beUniversity, Hyderabad. E-mail : [email protected]
ABSTRACT
This study examines the present state of banking services and the potentialdemand for such services in the rural areas of India. It analyses the emergingfavourable opportunities that can motivate commercial banks to open rural bankingcentres. The study also gives an account of the various innovative banking modelsthat can be implemented with the help of electronic devices, and with the activeparticipation of local individuals. These models in contrast to the traditional brickand mortar model, have the potential to not only reduce the operating costs ofthe banks but also make available, the banking services and products at the door-step of rural masses.
Majority of people in India live in rural areas. However, rural population havelimited access to formal banking services and products because there is nosignificant development of banking infrastructure in these areas. They face financialexclusion and hence have no other choice but to depend on informal creditsources. However, increase in rural employment opportunities, rise in the ruralmiddle class population and the penetration of wireless telecommunication facilityhave opened up a vast market potential that can be utilised by the commercialbanks to extend their services and products to the unbanked rural areas. Bankscan develop innovative banking models by taking advantage of Information andCommunication Technology (ICT) and by involving rural masses in the capacity ofBusiness Correspondents (BCs) and Self-Help Groups (SHGs). These models wouldnot only promote the goal of financial inclusion in a big way but also help inchannelling the savings from rural areas towards the mainstream economy.
Introduction
One can experience the pulse of India–avery vast land with varied languages andreligious and cultural diversity–only in itsvillages. Based on 2001 census1, about 72 percent of India’s population are living in ruralareas. People residing in urban and rural areasmay have different kinds of needs and
priorities but the need for financial services iscommon to both of them. This is because anyindividual’s livelihood and occupation aredependent upon the availability of money atthe right time and at the right place.Commercial banks in India can be divided intotwo types: Scheduled Commercial Banks andNon-scheduled Commercial Banks. The variouscategories of scheduled commercial banks are

44 Manoj Kumar Joshi
Journal of Rural Development, Vol. 31, No. 1, January - March : 2012
public sector banks, private sector banks,foreign banks and Regional Rural Banks (RRBs).Public Sector Banks (PSBs) are the State Bankof India (SBI) and its seven subsidiaries andthe nineteen nationalised banks. These banksare managed and controlled by thegovernment by having majority (i.e. 51 percent or more) shareholding in them. Privatesector banks are those banks which have beenincorporated in India but their ownership is inthe hands of private business houses andindividuals. Foreign banks are those whichhave been incorporated in other countries buthave their branches in India. They conductbusiness by obtaining license from ReserveBank of India (RBI), which is the central bankof the country.
RRBs are established by Government ofIndia (GoI). Their ownership capital is providedjointly by GoI (50 per cent), a public sectorbank in the capacity of a sponsor (35 per cent)and a concerned state government (15 percent). These banks cover rural and semi-urbanareas with their area of operation limited tojust one or two districts of a state. The primarypurpose of establishing these banks is toprovide institutional credit to farmers,agricultural labourers and artisans from ruralareas. A non-scheduled commercial bank is abanking company, defined in clause (c) ofsection 5 of the Banking Regulation Act, 1949(10 of 1949) and it is not included in the 2ndschedule of the RBI Act. Presently there areonly four such banks in India.
Methodology
Objectives of the Study : The paper isbased on secondary data. It has four objectives:
1. To analyse the present state of bankingservices in rural and semi-urban areas.
2. To identify the rural bankingopportunities for the commercial banks.
3. To examine the extent of financialinclusion achieved in India.
4. To describe innovative banking models,feasible in rural areas.
The present state of banking services inrural areas and the volume of credit and debitavailable in those areas is examined with thehelp of various reports published by theReserve Bank of India (RBI). The economicconditions of the rural masses and the extentof financial inclusion are studied with the helpof reports of the Planning Commission, theNational Sample Survey Organisation (NSSO),the union budget and the economic surveyreports. The Reports of National Bank forAgriculture and Rural Development (NABARD)are used to examine the combined role ofbanks and Self-Help Groups (SHGs) inpromoting financial inclusion. The features ofvarious banking models have been discussedwith the help of different reports, articles andillustrations. Simple statistical tools likepercentages and mean are used to compare,analyse and draw conclusions from thenumerical data presented in various tables.
Spread of Banking Operations
RBI has classified banking centres fromTier 1 to Tier 6 based on the population. It hasalso classified banking centres into Rural,Semi-urban, Urban and Metropolitan centresbased on the population groups. Thisclassification, based on 2001 populationcensus is shown in Table I.

Journal of Rural Development, Vol. 31, No. 1, January - March : 2012
Rural Banking Scenario in India and the Opportunity for Commercial Banks 45
Table 1 : Tier-wise Classification of Centres Based on Population
(i) Classification of centres (tier-wise) Population (as per 2001 Census)
Tier 1 - 1,00,000 and above
Tier 2- 50,000 to 99,999
Tier 3- 20,000 to 49,999
Tier 4- 10,000 to 19,999
Tier 5- 5,000 to 9,999
Tier 6- Less than 5,000
(ii) Population-group wise classification of centres Criteria
Rural centre Population up to 9,999
Semi-urban centre from 10,000 to 99,999
Urban centre from 1,00,000 to 9,99,999
Metropolitan centre 10,00,000 and above
Source: Reserve Bank of India.
To increase the penetration of bankingservices in unbanked2 centres, RBI has relaxedits rules. Under new rules, domestic scheduledcommercial banks (other than RRBs) need nottake prior permission from RBI for openingbranches in Tier 3 to Tier 6 centres (wherepopulation is up to 49,999), subject tosatisfying certain requirements. This alsoapplies to starting of branches in rural, semi-urban and urban centres in North-EasternStates and Sikkim.
Like their urban counterparts, rural folksalso need the services of a bank to fulfil theirfinancial needs and commitments. But amajority of rural people are dependent onprivate moneylenders and other informalsources due to the non-availability ofinstitutionalised credit facilities. In his speechon “Financial Inclusion : Challenges andOpportunities”3, Dr. D.Subbarao, Governor, RBIhas said that in India there are 600,000habitations out of which only 30,000 have a
commercial bank branch. Table 2 shows thepercentage of total earners residing in urbanand rural areas, having a bank account underdifferent slabs of annual income.
Table 2 : Earners having a Bank Account-2007
(Percentage of Total Earners)
Annual Urban Rural All IndiaIncome (`) (%) (%) (%)
<50,000 34.1 26.8 28.3
50,000 – 100,000 75.5 71.2 73.0
100,000 – 200,000 91.8 87.4 89.9
200,000 – 400,000 95.5 93.6 94.9
>400,000 98.0 96.3 97.6
All income slabs 61.7 38.0 44.9
Source : Presentation by Dr. K. C. Chakrabarty,Deputy Governor RBI, at 20th SKOCH summit2009, Mumbai on July, 17th 2009.

46 Manoj Kumar Joshi
Journal of Rural Development, Vol. 31, No. 1, January - March : 2012
It can be seen from Table 2 that only 44.9per cent of total earning population and 38per cent of rural masses who are earning, havea bank account, across all income slabs. Table3 shows the sources of loans for the earning
individuals based on different annual incomeslabs. It is obvious that moneylenders are asignificant source of loans (when comparedto banks) for people having income of less than` 50,000 per annum.
Table 3 : Sources of Loans
(Percentage of Indebted Earners)
Annual Income (`) Banks Moneylenders Other Institutional Total& Non-institutional
Sources
<50,000 13.0 34.9 52.1 100
50,000 - 100,000 34.5 19.6 45.9 100
100,000 - 200,000 49.3 12.0 38.7 100
200,000 - 400,000 51.6 11.8 36.6 100
>400,000 62.8 5.5 31.7 100
Source : Same as given in Table 2.
Shri S.C. Gupta committee (constitutedby RBI in May 2006) in its report on reviewinglegislation on moneylending, has noted thatthe interest rate charged by informal creditproviders ranged from 12 to 150 per cent perannum. The report further notes that thesecredit providers do not follow the standardisedpractices for interest collection. On the otherhand, formal financial institutions have put inplace cumbersome documentationprocedures for the sanction of credit. Inaddition, they do not have personal bondingwith the customers as is the case with themoneylenders. Farmers with less than onehectare of land face financial exclusion andthus have no alternative but to depend on themoneylenders who provide credit for allpurposes including consumption. This is notthe case with banks which provide credit onlyfor some well-defined purposes.
The data provided by NSSO through itsAll-India Debt and Investment Survey (59thround) indicate that rural households areindebted to an extent of 63 per cent of thetotal outstanding debt of the country as onJune, 2002. The survey further points out thatthe professional moneylenders account for19.6 and 13.2 per cent of the debt in rural andurban areas, respectively. Commercial banksand cooperative societies are primary sourcesof debt in both urban and rural areas,accounting for about 51 per cent of the totaldebt.
Table 4 presents the data related tonumber of scheduled commercial banks andthe number of their offices in rural, semi-urban,urban and metropolitan centres and also thepopulation served per bank office from 2000to 2009.

Journal of Rural Development, Vol. 31, No. 1, January - March : 2012
Rural Banking Scenario in India and the Opportunity for Commercial Banks 47
Tab
le 4
: St
atis
tics
Rel
atin
g to
Co
mm
erci
al B
anks
Ind
icat
ors
Mar
chM
arch
Mar
chM
arch
Mar
chM
arch
Mar
chM
arch
Mar
chM
arch
20
00
20
01
20
02
20
03
20
04
20
05
20
06
20
07
20
08
20
09
Nu
mb
er o
f Co
mm
erci
al B
anks
29
73
01
29
82
94
29
12
88
22
21
83
17
51
70
(a) S
ched
ule
d C
om
mer
cial
Ban
ks2
97
29
62
94
28
92
86
28
42
18
17
91
71
166'
of w
hic
h: R
egio
nal
Ru
ral B
anks
19
61
96
19
61
96
19
61
96
13
396
9186
(b) N
on
-Sch
edu
led
Co
mm
erci
al B
anks
--5
45
54
44
44
Nu
mb
er o
f Off
ices
of S
ched
ule
d6
54
12
65
91
96
61
90
66
53
56
71
88
68
35
56
94
71
71
83
97
60
50
80
54
7C
om
mer
cial
Ban
ks in
Ind
ia*
Rura
l3
27
34
32
56
23
23
80
32
30
33
21
21
32
08
23
05
79
30
55
13
10
76
31
66
7
Sem
i-u
rban
14
40
71
45
97
14
74
71
48
59
15
09
11
54
03
15
55
61
63
61
17
67
51
89
69
Urb
an1
00
52
10
29
31
04
77
10
69
31
10
00
11
50
01
20
32
12
97
01
43
91
15
73
3
Met
rop
olit
an8
21
98
46
78
58
68
68
08
97
69
37
01
13
04
11
95
71
29
08
14
17
8
Po
pu
lati
on
per
off
ice
(in
tho
usa
nd
s)15
1516
1616
1616
1515
14
.5
* Ex
clu
des
ad
min
istr
ativ
e o
ffic
es.
Sou
rce
: "B
asic
Sta
tist
ical
Ret
urn
s o
f Sch
edu
led
Co
mm
erci
al B
anks
in In
dia
", Vo
lum
e 38
, Mar
ch, 2
009,
Res
erve
Ban
k o
f In
dia
.

48 Manoj Kumar Joshi
Journal of Rural Development, Vol. 31, No. 1, January - March : 2012
From Table 4, we find that the totalnumber of bank offices in India has shown anincrease of nearly 23 per cent from 2000 to2009. However, the share of rural bank officesin the total bank offices in the country hascome down from nearly 50 per cent in 2000to nearly 39 per cent in 2009. On the otherhand, the total number of bank officesoperational in metropolitan and urban centreshas increased by nearly 72 and 56 per cent,respectively during the same period.
Even though there has been rapidexpansion of bank branches after thenationalisation of banks (1969) and post-liberalisation (after 1990), yet the number ofpersons served per branch is very highcompared to other developed countries. Thus,there is a need to extend and expand the reachof banking services in India. Table 5 shows thenumber of individuals served per branch indifferent countries.
Table 5 : Number of Persons ServedPer Bank Branch
Country Number of personsper bank branch
India 16,129
United Kingdom 4,484
United States of America 2,720
Germany 1,945
Japan 3,968
Hong Kong 454
France 1,587
Canada 6,410
Sweden 4,672
Singapore 10,101
Source : Joint study by ASSOCHAM andresearch firm Ernst & Young; Website: http://w w w. z e e n e w s. c o m / n e w s 5 0 6 0 9 2 . h t m laccessed on 22/4/2011.
Rural Banking Opportunity
In recent times, rural India has presentedsignificant business opportunity to differentindustries. Fast Moving Consumer Goods(FMCG) companies have expanded theirbusinesses in rural India on a large scale. GoIhas launched a number of schemes to increaserural employment. Prominent among them isthe Mahatma Gandhi National RuralEmployment Guarantee Act (MGNREGA)launched by the government in 2005. Thisscheme legally guarantees one hundred daysof employment every year to every adultmember residing in a rural area together withprescribed minimum wages. In the unionbudget, 2010-11, ` 40,000 crore has beenallocated to MGNREGA scheme so as to bringabout rural empowerment on a massive scale.
A report4 by financial services firm, IndiaInfoline, has indicated that there has been agrowth of 135 per cent in the rural middle-class homes since 2001 and they represent45 per cent of total national demand forconsumer products. Such guaranteedemployment schemes together with the risein the middle-class population brings with itthe demand for banking services and productssince money in the form of wages is availablein the hands of the rural people.
Post-liberalisation, all the major banksboth in public and private sector have beencompeting heavily in the metropolitan citiesand urban areas to attract and retain middleclass retail customers. They had not givenmuch attention to the rural segment due tothe underdeveloped physical infrastructure.But in present times increased competitiontogether with government's proactivedevelopment policies for rural areas has forcedthem to devise strategies and build businessplans for rural customers. Rural India also has alarge number of traders, entrepreneurs, smalland medium scale industries, professionals,agriculturalists, horticulturalists and manyothers as potential customers.

Journal of Rural Development, Vol. 31, No. 1, January - March : 2012
Rural Banking Scenario in India and the Opportunity for Commercial Banks 49
Tab
le 6
: D
epo
sits
an
d C
red
it o
f Sc
hed
ule
d C
om
mer
cial
Ban
ks in
Dif
fere
nt
Cen
tres
(Per
cen
tag
e te
rms)
Cent
res
Mar
chM
arch
Mar
chM
arch
Mar
chM
arch
Mar
chM
arch
Mar
chM
arch
2000
2001
2002
2003
2004
2005
2006
2007
2008
2009
Depo
sits
Cred
itDe
posit
sCr
edit
Depo
sits
Cred
itDe
posit
sCr
edit
Depo
sits
Cred
itDe
posit
sCr
edit
Depo
sits
Cred
itDe
posit
sCr
edit
Depo
sits
Cred
itDe
posit
sCr
edit
(%)
(%)
(%)
(%)
(%)
(%)
(%)
(%)
(%)
(%)
(%)
(%)
(%)
(%)
(%)
(%)
(%)
(%)
(%)
(%)
Rura
l14
.710
.614
.710
.114
.210
.213
.810
.212
.99.
712
.29.
510
.88.
39.
77.
99.
47.
69.
37.
3
Sem
i-19
.712
.219
.611
.519
.111
.218
.911
.317
.711
.416
.911
.314
.510
.013
.89.
713
.39.
613
.59.
3ur
ban
Urba
n23
.017
.222
.917
.422
.816
.522
.816
.421
.917
.121
.516
.420
.616
.420
.516
.320
.416
.121
.016
.1
Met
ro-
42.6
60.0
42.8
61.0
43.9
62.1
44.5
62.1
47.5
61.8
49.4
62.8
54.1
65.3
56.0
66.1
56.9
66.7
56.2
67.3
polit
an
All I
ndia
100
100
100
100
100
100
100
100
100
100
100
100
100
100
100
100
100
100
100
100
Sour
ce :
Com
pile
d fro
m d
iffer
ent v
olum
es o
f "Ba
sic S
tatis
tical
Ret
urns
of S
ched
uled
Com
mer
cial B
anks
in In
dia"
, Res
erve
Ban
k of I
ndia
.

50 Manoj Kumar Joshi
Journal of Rural Development, Vol. 31, No. 1, January - March : 2012
Deposits and Credit
Depositing money in the bank andavailing of credit in the form of loans form thebasic banking transaction for retail customersin both rural and urban areas. Table 6 lists thepercentage distribution of total deposits andcredit of commercial banks among rural, semi-urban, urban and metropolitan centres.
From Table 6 it can be noted that thepercentage of deposits is higher compared tothe percentage of credit disbursed in ruralcentres. However, in metropolitan and urbancentres, credit made available is morecompared to the deposits secured. While themetropolitan centres are cornering more than60 per cent of credit disbursed by scheduledcommercial banks, the percentage of credit
for rural centres declined from around 10 percent (2000-2005) to around 7.5 per cent(2006-2009). It is an irony that 72 per cent ofIndia's population live in villages but the creditdisbursed in rural areas by the commercialbanks is less than 10 per cent of the total creditavailable (for the period 2000 to 2009).
RBI's quarterly report 5 mentions that theCredit to Deposit (C-D) ratio was 59.0 per cent(rural centres), 51.8 per cent (semi-urbancentres), 58.8 per cent (urban centres) and84.9 per cent (metropolitan centres). Thus, thecredit made available to metropolitan centresis more, compared to rural and semi-urbancentres. Table 7 presents the distribution ofbank credit to different sectors in percentageterms (Year 2000 to 2009).
Table 7 : Bank Credit to Different Sectors
(Percentage share)
Sector 2000 2001 2002 2003 2004 2005 2006 2007 2008 2009
Agriculture 9.9 9.7 9.8 10.0 10.9 10.8 11.4 11.8 11.3 10.9
Industry 46.5 43.9 41.4 41.0 38.0 38.8 37.4 38.1 38.4 39.8
Transport operators 1.8 1.6 1.4 1.2 1.3 1.2 1.6 1.3 1.8 2.0
Professional services 3.2 3.6 4.2 4.5 5.0 4.8 5.4 6.2 7.7 8.7
Personal loans 11.2 12.2 12.6 15.1 20.3 22.2 23.3 22.3 20.1 19.5
Trade 15.6 16.6 15.4 13.8 11.5 11.2 9.9 10.5 8.8 9.8
Finance 4.7 4.9 5.7 6.7 6.7 6.4 6.3 6.4 7.l 6.6
Miscellaneous 7.1 7.5 9.5 7.7 6.3 4.6 4.7 3.4 4.8 2.7
Total 100 100 100 100 100 100 100 100 100 100
Source : As given in Table 6.
The economic survey (2009-2010) tellsus that in 2008-09, the share of agriculture(including forestry and fisheries) in the GDPwas 15.7 per cent and 52 per cent of the totalworkers are employed in agricultural sector
(2001 population figures). But it is a matter ofconcern (as can be seen from Table 7) thatbank credit to agricultural sector is hoveringaround just 10 to 11 per cent of the total creditmade available by the commercial banks.

Journal of Rural Development, Vol. 31, No. 1, January - March : 2012
Rural Banking Scenario in India and the Opportunity for Commercial Banks 51
Banking Services
Information and CommunicationTechnology (ICT) provides convenience for thebanks to reach a large number of customersand offers them varied services in the shortestpossible time. The website of a bank servesdual purpose for the customers. It not onlyprovides all the information related to theproducts and services but also facilitates onlinetransactions in real-time such as payment ofdifferent kinds of bills, transfer of money fromone account to another, online shopping etc.Some of the new services that commercialbanks have been offering to their customersthrough ICT are:
(i) Demat Service : Demat service isdesigned to facilitate storage as well as transferof securities in a speedy and secure manner.Securities stored in physical form (as paperdocuments) may be lost or soiled. But underDemat service, they are stored in the electronicform for any length of time. A large number ofcommercial banks are offering the Dematservice through their websites. Utilising thisservice, rural customers can operate theDemat account, trade in securities and gainfrom the capital markets, from the comfort oftheir homes, without having to travel longdistances. Demat account holders can convertthe securities from physical to electronic formand vice versa. Benefits such as bonus sharesand rights issue can be credited directly intotheir Demat account. They can alsohypothecate or pledge the securities storedin their account.
(ii) Real Time Gross Settlement (RTGS):This service is designed to facilitate inter-bankfund transfer. By utilising this service, customerscan transfer funds from one bank account toanother in real time without any hassles. Inrural India, physical branches of banks arelimited in number. Moreover, private andforeign banks are reluctant to open branchesin rural areas due to overhead costs. In such a
scenario, rural customers have to travel longdistance to reach their bank's branch. RTGShelps them transfer funds by sitting in thecomfort of their house. Convenient andcomfortable banking experience would attractmore customers to open accounts with thebanks. However, reliable broadbandconnection is needed to effectively utilise thisservice.
(iii) Utility Bill Payment Service: Most ofthe public and private sector commercialbanks offer the facility to pay utility bills (suchas telephone bills, electricity bills, insurancepremium, municipal taxes etc.) throughInternet banking, phone banking and ATMs.Banks charge nominal amount to thecustomers while offering this service. Thus, itis a source of non-interest income. In addition,banks also accept ECS (Electronic ClearanceSystem) mandate from their customers to payutility bills. Under ECS, automatic payment ofutility bill is effected on the due date bydebiting the customer's account. ECS facilityis free for the customers. Like RTGS, ECS facilityparticularly helps rural customers since theyneed not travel long distance and stand inqueues to pay their bills. Also they need notworry about forgetting the due date of billpayment.
(iv)Internet Banking Service : A numberof banks have been offering Internet bankingservice to their customers through theirwebsites. Internet banking is convenient,hassle-free and can be used to carry outtransactions in real-time. The main advantageis that almost all the banking related servicescan be offered through the bank's website inelectronic form. Examples of these servicesinclude, transferring funds between differentaccounts, opening of fixed deposit, loan andsavings bank accounts, placing a request forthe issue of cheque book, demand draft etc.,registering a complaint, payment of utility billsand credit card bill, online recharge of mobilephones, buying of movie tickets and many

52 Manoj Kumar Joshi
Journal of Rural Development, Vol. 31, No. 1, January - March : 2012
more such services. According to Internet andMobile Association of India (IAMAI), by 2010there were only 5.4 million Internet users inrural India. This represents only 0.62 per cent6
of the rural population of India.
For utilising Interent banking services, itis necessary to have dedicated Internet/broadband connectivity. The Department ofTelecommunications, GoI in its Annual Report(2010-11) has said that the GoI has introduceda prototype tablet Personal Computer (PC)(powered by solar power) for only ` 1500.00,in order to make the usage of computersfinancially feasible even to the poor peoplefrom rural areas. It has also provided subsidiesfor the establishment of wireless broadbandinfrastructure. The number of CommonService Centres (CSC) would also be increasedfrom present number of 86521 to 100,000 inorder to provide broadband coverage to all thevillages in the country.
Internet banking service is advantageousfor both banks and their rural customers. Whilebanks can serve a large number of ruralcustomers without incurring infrastructuralcosts, customers on the other hand can carryout most of their banking transactions withoutvisiting physical branches. Moreover, they cancarryout safe and secure transactions inelectronic form, without the need to carry cash.
(v)Services Under Government Schemes:Commercial banks have been rendering theirservices to the society by facilitating theimplementation of government schemes.Some of the schemes which deserve specialattention are the New Pension System (NPS)and the MGNREGA. These schemes aredesigned to provide financial security andemployment opportunities for the financiallyweaker sections.
NPS was introduced from 1 May, 2009by the Pension Fund Regulatory andDevelopment Authority (PFRDA) to offer old
age pension to citizens in the age group of 18to 60 years. A number of banks have beenacting as Point-of-Presence (PoP), serviceproviders and offering documentationservices (through their branches) for thedelivery of NPS. Subscribers can makecontribution to the NPS either through bankbranches or through ECS facility.
To check malpractices and avoid cashtransactions, the Central government hasdecided that wage payments for peopleemployed under MGNREGA should be donethrough the savings bank account. Banks canutilise the services of Business Correspondents(BCs) and biometric identification forencouraging workers to open their wageaccounts and also for effecting payments inthese accounts. The state governments willreimburse the transaction costs incurred bythe banks by paying certain amount as fee (peraccount). Thus, for banks it will be anothersource of non-interest based income.According to the report of the Ministry of RuralDevelopment, GoI, in the financial year 2009-10, 4.27 crore households were providedemployment and 10.86 crore job cards wereissued under MGNREGA. Since all thebeneficiaries will be required to open savingsbank account, banks can see a surge in theirretail customer base.
(vi) Bancassurance Service : Bancassuranceis the usage of banking channels to sell theinsurance products (both life and non-life),based on the tie-up between banks andinsurance companies. With the opening ofinsurance sector in 1999, there has beenintense competition in the Indian insuranceindustry. Presently, in each of life and non-lifeinsurance segments, there are 24 companiesin operation. Commercial banks are not onlyselling insurance products but have alsoentered the insurance business by forgingpartnership with other banks and foreigninsurance companies.

Journal of Rural Development, Vol. 31, No. 1, January - March : 2012
Rural Banking Scenario in India and the Opportunity for Commercial Banks 53
Annual survey (2010) conducted by FICCI(Federation of Indian Chamber of Commerceand Industry) has found out thatBancassurance is the most profitableopportunity for the banks in the non-interestincome bearing category. Similar views areexpressed by Indian Banks Association (IBA)in its report titled "Banking Industry Vision,2010". The report also mentions that ruralmarkets account for 74 per cent of population,41 per cent of middle class and 58 per cent ofdisposable income. In India, only 227 per centof the insurance sales are throughBancassurance. Thus, there is a vast market tobe explored under Bancassurance.
The Economic Survey (2010-11) hasrevealed that the growth of life insurancepremium has been nearly 26 per cent andinsurance penetration has been 5.4 per centof the GDP in 2009. According to a researchpaper on insurance industry brought out jointlyby CRISIL (Credit Rating Information ServicesIndia Limited) and ASSOCHAM (AssociatedChambers of Commerce and Industry of India),the penetration of general insurance businessis only 0.6 per cent of the GDP while the worldaverage is 2.14 per cent. The reasons citedbeing the untapped rural markets, lowpreference and limited distribution channels.The penetration8 of insurance business inurban India is at 47 per cent while it is only 27per cent in rural India.
Bancassurance would turn out to be a'Win-Win' situation for both the banks and theinsurance companies. In India, public sectorbanks have a huge network of brick and mortarbranches, spread across the country. A largenumber of customers visit the bank's branchesand many of them would be in need ofinsurance products. Bank employees shouldbe properly trained and given incentives forselling these products. IRDA is of the opinionthat selling insurance products through agencymodel has lost its sheen in many parts of theworld including India. In its opinion
Bancassurance can turn out to be an efficientchannel for selling insurance products. It hasalso allowed banks to sell policies of more thanone insurance company.
Financial Inclusion
Banks being commercial entities, offertheir services by weighing the transaction costsagainst the profits. Therefore, they prescribecertain minimum amount of deposit foropening and maintaining an account. Forpeople with education and employment inorganised sector, it is very easy to open a bankaccount and avail of related services. Besides,employees working in the corporate sector areprovided corporate salary accounts by theirrespective organisations. But for the majorityof rural masses, neither there are sufficientbranches in their vicinity nor can they satisfybanking norms for opening an account. Thus,they remain excluded from the formal bankingsystem.
For RBI, financial inclusion forms a majorobjective under priority sector lending. Inorder to bring marginalised sections within theformal banking ambit, RBI has advised banksto make provision for basic banking 'No frills'account. Such accounts are meant for thoselow-income individuals who earn very meagresalary/wage income, just enough for theirsurvival. It is permitted to maintain either zeroor very low minimum balance in the 'No frills'accounts. Annual policy statement (2005-06)of RBI suggests banks to change/modify theirexisting practices so that the objective offinancial inclusion is fulfilled conclusively. RBIhas simplified KYC (Know Your Customer)banking norms for low-income customers andhas brought small balance accounts under low-risk category. Along with public sector banks,some foreign and private banks have alsostarted offering 'No frills' accounts. RBI's annualreport (2009-10) mentions that the totalnumber of 'No frills' accounts is 5.06 crorebetween November, 2005(when such

54 Manoj Kumar Joshi
Journal of Rural Development, Vol. 31, No. 1, January - March : 2012
accounts were permitted) and March, 2010.The total amount outstanding in suchaccounts is ` 5,386 crore.
Prof. Suresh D. Tendulkar Committeereport (accepted by the Planning Commission)constituted for the estimation of povertymentions that 37.2 per cent (i.e. nearly 37crore people as per 2001 population census)of the total population come under thecategory of Below Poverty Line (BPL). Thus,BPL population is about seven times theexisting number of 'No frills' accounts if weassume that there exists only one 'No frills'account per individual. Thus, there is still a longdistance to be covered in order to achieve thegoal of total financial inclusion.
Some banks have also started offeringoverdraft facility to such account holders. Theamount of overdraft stands at ` 28 crore byMarch, 2010. With the intention of making 'Nofrills' accounts financially viable, governmenthas constructed a fund of ̀ 800 crore. This fundwill reimburse the costs incurred (such aspaying commission to businesscorrespondents, setting up of branches in ruralareas etc.) by the banks in rural and unbankedareas.
Through ‘No frills’ accounts, poor peoplecan also be offered other banking productssuch as fixed deposits, insurance products,recurring deposits, loan products, credit cards,overdraft and money transfer facility. This willwiden the scope of financial inclusion. In retailbanking segment, it is the number of accountsrather than size of an account that brings profitto the banks. For banks, credit risk is minimumin ‘No frills’ accounts because the exposure isvery limited.
Information Technology (IT) can provecritical for banks in not only identifying ruralcustomers but also reducing the transactioncosts associated with ‘No frills’ accounts. In thisregard, the Unique Identification (UID) project
launched by Unique Identification Authorityof India (UIDAI)9 would come handy for bothbanks and its customers. Under UID project,every Indian will be issued a unique twelve-digit number, linked to his/her biometricfeatures. A UID number will be sufficient forrural and illiterate customers for opening anaccount in the bank without the need foradditional documents.
Rural Banking Models
For banks, opening a brick-and-mortartype branch in rural area may not be financiallyand operationally viable because of manyconstraints such as logistics, administration,physical infrastructure and employee well-being. Therefore, they need to scout forinnovative models. In these models electronicsand IT components would have a prominentrole in reducing costs and increasing thenumber of rural customers. Outlook Business10
magazine reports that for a bank, a singletransaction carried out through a Teller costs` 50 to ̀ 150. On the other hand, a transactioncarried out through an Automatic TellerMachine (ATM) costs `10 to `18 while thatcarried out through mobile banking costs lessthan ` 5. However, local individuals andinstitutions at grassroots level should beinvolved in a prominent way in order to makethese models operational in a successfulmanner.
A Automatic Teller Machines (ATMs)
An ATM is an electronic machine basedon Information and CommunicationTechnology (ICT), using which customers canaccess account information and also withdrawcash. In addition, customers can also obtainsavings/loan account information, deposit thecash and pay utility bills. Banks can install ATMsat convenient locations in a small place andthey have proven to be cost-effective,compared to a full-fledged branch. Ruralcustomers can use locally installed ATMs,

Journal of Rural Development, Vol. 31, No. 1, January - March : 2012
Rural Banking Scenario in India and the Opportunity for Commercial Banks 55
instead of travelling long distance to cities andtowns. Average population per branch and perATM provides an indication towards the extent
of penetration of banking services as can beseen from Table 8.
Table 8 : ATMs and Population Per Bank Branch in Different Centres
(March, 2010)
ATMs and Population Rural Semi-urban Urban Metropolitan Totalper bank branch Centres Centres Centres Centres
Number of ATMs 5,196 14,478 19,763 20,716 60,153
Percentage share of ATMs 8.6% 24.1% 32.9 % 34.4% 100%
Population per ATM* 43,500 8,100 19,700
Number of ATMs per —— ——- 5.071,00,000 population
Population per bank branch* 16,100 10,400 14,000
Number of bank branches —— ——- 7.13per 1,00,000 population
* Population of rural and semi-urban centres is taken together. Also population of urban andmetropolitan centres is taken together.
Source : Report on Trend and Progress of Banking in India 2009-10, Reserve Bank of India.
The number of branches and ATMs per1,00,000 population according to thebenchmark set by the OECD (Organisation forEconomic Cooperation and Development)countries is (23-45) and (57-158), respectively.But from Table 8, we find that in India this figureis only 7.13 and 5.07, respectively. Thus,considering the OECD benchmark, India scoresvery poorly. From Table 8 it can be seen thatthe population per ATM in rural and semi-urbancentres are nearly five times that of urban andmetropolitan centres. Also the population perbank branch is higher in rural and semi-urbancentres compared to urban and metropolitancentres. From this we can infer that there is aneed to increase the number of ATMs and bankbranches in rural and semi-urban centres.
B Business Correspondents
RBI has permitted banks to avail of theservices of companies having retail outlets,retired government employees, teachers,grocery shop owners, insurance agents, SHGsand post offices in the capacity of BusinessCorrespondents (BCs). BCs deliver retailbanking services such as opening of a bankaccount or fixed deposit, collecting intereston loans, selling insurance and mutual fundproducts, issuing receipts etc., on behalf ofbanks to the rural customers. The services aredelivered through Internet kiosks or hand-heldcommunication devices linked in real-time tothe bank’s core banking network. However, abank is ultimately liable for any acts of omissionor commission of BCs, appointed by it. RBI has
56 Manoj Kumar Joshi
Journal of Rural Development, Vol. 31, No. 1, January - March : 2012
made it mandatory that every BC has to workfor only one particular bank and should notcollect any fees from the customers. With theexpansion of banking services in rural areas,the services of BCs would become paramount.This would create huge employmentopportunity for rural masses.
Rural internet banking model of SBI isimplemented through the BC model. In thismodel, Internet kiosk owners acting as BCs,help villagers perform basic bankingoperations. Biometric parameters are used toauthenticate Internet banking operations.Internet kiosks, acting as mini-bank branchesare connected to the LAN (Local AreaNetwork) server of SBI.
A Working Group constituted under thechairmanship of Mr. P.Vijaya Bhaskar, reviewedthe BC model and submitted a report to RBI inAugust, 2009. The important findings of thisWorking Group are:
(i) Out of a total 50 public sector and privatesector banks, only 26 have appointedBCs.
(ii) Public sector banks have appointed atotal of 85 BCs and the number ofaccounts opened through them is80,47,007.
(iii) Private sector banks have appointed atotal of 44 BCs and the number ofaccounts opened through them is8,13,259.
(iv) The total number of no frills accountsopened through BCs is 88,60,266 whichconstitute only 26.82 per cent of thetotal number of frills accounts openedas on 31March, 2009.
(v) A majority of the no-frills accountsopened through BCs have remainednon-operational.
(vi) The commission paid by banks to theBCs is not adequate to cover their costsrelated to transportation, operations,insurance and security. Therefore,majority of BCs have withdrawn theiroperations.
(vii) In the BC model, banks face differenttypes of risks such as credit risk,operational risk, legal risk, liquidity riskand risk of reputation. They have to takeadequate measures to reduce theserisks.
C Mobile Banking
Mobile banking is the provision ofbanking service, made available through thetelecommunications network and accessedthrough a mobile phone. Mobile phones areavailable at a fraction of cost and thusaffordable to poor people from rural areas.According to Telecom Regulatory Authority ofIndia ( TRAI), there are about 77 crore11
wireless telephone subscribers in India as onJanuary, 2011. Out of these, nearly 26 croreare rural subscribers. Thus, nearly 63.34 percent of the total population (121 crore, as per2011 population census) and out of whichnearly 34 per cent of rural population haveaccess to mobile phones. The rural wirelessteledensity has increased from 30.11 to 31.05(between December, 2010 and January,2011). Also subscription to wireless telephoneservices in rural areas has increased by 3.20per cent compared to an increase of 2.19 percent recorded in urban areas during the sameperiod. This shows that mobile banking modelcan be effectively used by the banks to offertheir services even in the remote areas.
Three types of banking services are madeavailable through a mobile phone–Information-based, Transactions-based andRelationship-based. Information-basedservices include supply of essential

Journal of Rural Development, Vol. 31, No. 1, January - March : 2012
Rural Banking Scenario in India and the Opportunity for Commercial Banks 57
information related to savings/loan account,credit/debit card etc. through customer carecentres. Transaction-based services is the nexthigher level service which facilitatestransactions such as transfer of funds from oneaccount to another, stock trading and opening/closing a loan account. Relationship-basedservice includes building personalisedrelationships between the bank and itscustomers such as targeted promotions andalert messages through SMS (Short MessageService). All these services are available 24X7basis by clicking a few buttons on the keypadof the mobile phone. Mobile phones permit‘Anywhere, Anytime Banking’ since they canbe carried in pockets or in handbags. Web-enabled services provided through mobilephones facilitate internet banking transactionsby browsing the bank’s website in real-time.
In Banknet’s Payment Conference12 itwas revealed that government has permitted32 banks to offer mobile banking services inthe country and 21 banks have been offeringthese services. RBI has allowed funds transferto a maximum of ` 50000 per customer perday through mobile banking. However, thereis no limit on the amount of funds that can bereceived.
D SHG-Bank Linkage Programme
NABARD was the pioneer to start theSHG-Bank linkage programme in the countryin 1992. A SHG can be formed by 15-20 ruralpoor people belonging to economicallyhomogeneous and affinity group. Eachmember contributes a small amount as savingsto the group fund in order to start smallbusinesses either individually or as a group.Thus, individuals who do not have access toformal banking system form a SHG. Membersof SHG can open a savings bank account andalso avail of credit facility from the bank onthe strength of their collective savings. Banksprovide credit facility to SHGs either directlyor through Non-Governmental Organisations
(NGOs) and Micro-Finance Institutions (MFIs).Members of SHGs are collectively responsiblefor the disbursal of credit amongst themselvesand also for the repayment of loans.
SHG-Bank linkage programme hasachieved tremendous success in promotingfinancial inclusion in India. According toNABARD’s status report on Micro-finance(2009-10), the number of SHGs having savingsand credit linkage with banks are 69.53 lakhand 15.87 lakh, respectively, bringing about9.7 crore poor households under their ambit.The savings of SHGs with banks as on March,2010 amounted to ̀ 6198.71 crore registeringa growth of 11.80 per cent over the previousyear. Bank loans disbursed to SHGs during2009-10 was `14453.30 crore registering agrowth of 17.9 per cent over the previous year.This shows that the growth of SHGs would notonly help banks penetrate rural areas but alsohelp them augment their revenues.
Factors for the Success of Rural Banking
Banks should be given freedom to raiseor lower the interest rates (within certainlimits) in different geographical regionsaccording to the profile of their clients.Differential interest rates would help bankspay adequate commission to the BCs andensure the feasibility of their operations. Banksshould train their field staff adequately andgrant them operational autonomy so that theyprovide better services to rural customers.
ATMs installed in rural areas shouldwithstand voltage fluctuations and hightemperatures. Preferably ATMs in rural areasshould make use of customer’s biometricparameters rather than the password or PIN(Personal Identification Number). This isbecause passwords can be easily lost, hackedor shared unknowingly. Biometr icidentification is unique, tamper proof, accurateand authentic. It also does not requirecustomers to be literate.

58 Manoj Kumar Joshi
Journal of Rural Development, Vol. 31, No. 1, January - March : 2012
Information related to the borrowers andtheir businesses in a particular geography areparamount for banks, intending to operate inrural areas. Hence, NABARD has proposedestablishment of rural credit bureaus as a jointventure in association with ICICI bank andCredit Information Bureau of India Limited(CIBIL). Rural credit bureaus will help banks,share and utilise information related to fraudand loan default, pertaining to rural customers.It will also help borrowers with good trackrecord avail of loans in the shortest possibletime. Banks can implement risk managementprocesses effectively in compliance with BaselII norms using timely information availablethrough the credit bureau. In future, the scopeof rural credit bureau would expand whenmore banks intending to start operations inrural segments, become part of it.
There are around 1,55,015 post offices13
in India at the end of the financial year (2009-10) making it the largest network in the world.Of these 1,39,144 post offices (i.e. 89.76 percent) are located in rural areas. The postaldepartment has rich experience in offeringfinancial products such as savings account andterm deposits of small amounts. Banks canpartner with post offices in locating potentialrural customers and market different productsand services jointly. Only minimal investmentwould be needed to improve theinfrastructure, already available with the postoffices. This synergy between the banks andpost offices will reduce operational andinfrastructure costs.
Financial literacy and financial inclusiongo hand-in-hand. Awareness about financialmatters and services will lead to more peopleaccessing institutional sources for their creditneeds. RBI has started a project named “ProjectFinancial Literacy” for educating women,school and college going students, poor peoplefrom urban and rural areas and others aboutvarious banking concepts. In addition, it hasasked lead bank in each district to prepare a
blue-print so that all villages with populationof above 2000 have access to some bankingoutlet by March, 2012.
Conclusion and Suggestions
Commercial banks should realise thatrural India also offers vast business opportunity.To tap it they need to undertake properresearch and select suitable business modeland technology that is operationally andfinancially feasible. Since India is highlydiversified in terms of culture, language,tradition and social groups, involvement oflocal persons in banking operations wouldpermit rendering of banking service withoutany hassles. The crucial thing for banks in ruralareas is to simplify the documentation processand create awareness about different financialservices on a large scale. This will eliminatethe involvement of touts, agents ormiddlemen in the transactions between banksand their customers. Segmenting the ruralmarket based on the income or occupationand offering them banking and insuranceproducts would go a long way in attractingrural customers.
Based on the economic survey (2010-2011), about 42 per cent of savings in ruralIndia are held in the form of cash. Throughtailor-made financial inclusion schemes, thecash available in the hands of rural masses canbe diverted to savings bank accounts. This cashwhen brought into mainstream economy canturn out to be a major source of investmentfor rural development and infrastructureprojects which suffer from chronic financialcrunch and escalating costs. These projectswould generate huge employmentopportunity which in turn increases thedemand for banking services. Additionally, thedomestic savings rate can also be increasedthereby minimising the dependence on globalfinancial markets and institutions which arehighly volatile in present situation of globalfinancial crisis.

Journal of Rural Development, Vol. 31, No. 1, January - March : 2012
Rural Banking Scenario in India and the Opportunity for Commercial Banks 59
Along with appropriate products andservices, it is necessary to modify themaccording to changing needs. Customer carecentres should be established in largenumbers for handling customer queries,grievances and for dissemination ofinformation in local languages. Rural farmersdo not mind paying higher interest rate onagricultural loans. But they should be madeavailable at the appropriate time. Hence,
government and RBI should take steps toreduce red tapism and politically motivatedsops and subsidies. Government shouldencourage private participation in thedevelopment of infrastructure facilities in ruralareas. In a nutshell, the field is wide open forcommercial banks to venture into the ruralbanking arena. They can tap this opportunitythrough strategic thinking, planning andperseverance.
References
1. Annual Reports of Reserve Bank of India.
2. Annual Report (2010-11), of Department of Telecommunications, Ministry Of Communications & IT,Government of India.
3. NABARD (2010), “Status of Micro Finance in India 2009-10”, National Bank for Agriculture and RuralDevelopment (NABARD)
4. NABARD (2009), “Status of Micro Finance in India 2008-09”, National Bank for Agriculture and RuralDevelopment (NABARD)
5. NSSO (2006), “All-India Debt and Investment Survey NSS 59th Round (January–December 2003)”, NationalSample Survey Organisation, Ministry of Statistics & Programme Implementation, Government of India.
6. Planning Commission (2009), “Report of the Expert Group to Review the Methodology for Estimation ofPoverty”, Government of India.
7. RBI (2008), “Report on Currency and Finance : 2006-08”, Reserve Bank of India, Mumbai.
8. RBI (2009), “Report of the Working Group to Review the Business Correspondent Model”, Reserve Bankof India, Mumbai.
9. RBI (2009), “Basic Statistical Returns of Scheduled Commercial Banks in India”, Volume 38, March, 2009,Reserve Bank of India, Mumbai
10. RBI (2010), “Handbook of Statistics on Indian Economy”, Reserve Bank of India, Mumbai.
11. RBI (2007), “Report of the Technical Group to Review Legislations on Money Lending”, Reserve Bank ofIndia, Mumbai.
12. RBI (2010), “Report on Trend and Progress of Banking in India 2009-10”, Reserve Bank of India, Mumbai.
13. Union Budget (2010-2011) and Economic Survey (2009-10)
14. Union Budget (2011-2012) and Economic Survey (2010-11).

60 Manoj Kumar Joshi
Journal of Rural Development, Vol. 31, No. 1, January - March : 2012
Notes
1 Government of India, Ministry of Home Affairs, Office of the Registrar General & Census Commissioner,Website: www.censusindia.gov.in, accessed on 25/4/2011.
2 According to RBI, unbanked centre is one wherein there is no functioning branch of any commercial/cooperative bank.
3 Remarks by Dr. Duvvuri Subbarao, Governor, Reserve Bank of India at the Bankers’ Club in Kolkata on 9/12/2009.
4 Report “Kisan Is King” by financial services firm, India Infoline. Website: http://www.moneycontrol.com/news_html_files/news_attachment/2008/tfp200812161.pdf accessed on 27/4/2011.
5 RBI’s Quarterly Report, “Quarterly Statistics on Deposits and Credit of Scheduled Commercial Banks”,March 2010.
6 Population of India according to 2011 census is 121 crore and rural population is about 87 crore (72 percent of total population).
7 7th Asian conference on Bancassurance & Alternative Distribution Channels, 2006 Mumbai.
8 www.business-standard.com/india/ accessed on 30/8/2011.
9 The Unique Identification Authority of India (UIDAI) constituted under the guidance of PlanningCommission of India in 2009 with Shri Nandan M. Nilekani as its chairman.
10 Anurag Prasad, “Swipe that Phone”, Outlook Business magazine. Website : http://business.outlookindia.com/print.aspx?articleid=1403&editionid=39&catgid=29&subcatgid=705 accessed on25/4/2011.
11 Telecom Regulatory Authority of India (TRAI), Press release No. 13/2011, Date, 4/3/2011. Website: http://www.trai .gov. in/WriteReadData/trai/upload/PressReleases/800/PressRelease04Jan2011.pdfaccessed on 25/4/2011.
12 Banknet’s Sixth Annual Conference on Payment Systems, 22/1/2010, Mumbai.
13 Annual Report (2009-10), Department of P osts, Government of India.
Sujit Kumar Mishra*
COPING MECHANISMS OFPEOPLE IN DROUGHT-PRONEAREAS OF RURAL ORISSA
Journal of Rural Development, Vol. 31, No. (1) pp. 61 - 83NIRD, Hyderabad.
* Assistant Professor, Council for Social Development (An Institute of ICSSR, GoI & RBI), Southern RegionalCentre, Rajendranagar, Hyderabad- 500 030. Email: [email protected]
Acknowledgement
* Data used in this paper were earlier collected for a major project titled “Coping with Extremes: StrategicDimensions of Institutions, Policies and Information” being carried out by Council for SocialDevelopment, Hyderabad, which is funded by the Indian Council for Social Sciences Research, New Delhi.The author is grateful to them. Earlier version of this paper was selected as a winner of the InternationalDevelopment Research Centre (IDRC) - India Social Science Research Award.
ABSTRACT
This paper is an attempt to study various coping strategies employed by peopleduring drought. It also looks at the sustainability about the coping mechanisms, whichthe communities adapt to counter the erratic behaviour of rainfall. This study testsfor ex-ante and ex-post adaptation responses to weather risk in rural farm householdsof Orissa and also examines how poor rural families adapt with the changing patternsof livelihood. The study critically analyses different safety-nets available for thepeople and examines the gaps between policy and practice. The coping mechanismsof poor agricultural households during the drought period reveal several problemsrelating to diversification of crop and livelihood, capacity to migrate and the role ofgovernment institutions and policies. Based on the findings, this paper puts forthseveral suggestions and the role of different stakeholders and institutions, which havebearing on policy.
Introduction
Livelihoods and welfare of householdscan be adversely affected by the destructionof physical and human capital stock. One suchfactor which negatively impacts householdwelfare is climate induced natural disasters.The livelihood of most of the farmers in thedisaster-prone regions is highly fragile andthinly balanced, even a minor shock canendanger the security of farm households(Subbiah, 2004). Adaptation1 to climate
change is a critical issue for India. It has becomecommon knowledge that the poor are likelyto be hit hardest by these events as thecapacity to respond to such situations is alsothe lowest among the poor (IPCC, 2001;Olmos, 2001). Recent research on climatechange predicts that there will be changes inthe pattern of precipitation and temperature,occurrence of extreme events like droughts,floods, and typhoons, fluctuations inagricultural activities, availability andaccessibility of water, nutrition and health

62 Sujit Kumar Mishra
Journal of Rural Development, Vol. 31, No. 1, January - March : 2012
status (Hetberg et. al., 2009). In this context,the developing countries are predicted asmore vulnerable to the climate changedamages. In addition, poverty and other factorscreate conditions of low adaptive capacitiesin most developing countries. The impacts ofclimate change are already evident in India.Hence adaptation, which is nothing but aprocess to enhance the coping capacities ofthe affected people, is essentially a necessaryand sufficient condition to overcome theimpact of climate change. The four thassessment report of the Inter-governmentalPanel on Climate Change (IPCC AR4) statesthat while neither adaptation nor mitigationactions alone can prevent significant climatechange impact, taken together they cansignificantly reduce risks. Mitigation isnecessary to reduce the rate and magnitudeof climate change, while adaptation is essentialto reduce the damages from climate changethat cannot be avoided (IPCC 2007; Lemmenet. al., 2008).
Research Questions
Keeping these issues in view, the presentpaper addresses the following importantresearch question: (i) What are the factorsinfluencing successful adaptation? To addressthis research question, the present paper aimsto study the different factors and stepsinfluencing the success of an adaptationprocess. The specific objectives of this paperare : (i) to study the individual and communityadaptive and planning strategies respondingto the crucial impact of climate change i.e.drought; (ii) to study the different stages andfactors influencing the success of anadaptation process; (iii) to analyse criticallythe different safety-nets available for thepeople and examine what went wrong inputting this policy into practice; (iv) to studythe key factors that determine the differencesin outcome; and (v) to suggest appropriatepolicy measures to enhance people’s adaptivecapacity in a sustainable manner.
The Issue of Adaptation : An Overview
A growing body of literature on the issueof adaptation has evolved over time, whichput into practice anticipatory adaptationstrategies as well as response strategies tomanage the impact of climate risk (IPCC, 2007;Smit and Wandel, 2006; TERI, 2007; UNDP,2007). The importance of climate change isincreasingly emphasised (Pielke et. al., 2007).This is because helpless and ignoranthouseholds find their own way of survivalstrategy even in adverse terms and conditions.Though state intervention is there, peoplehave to fight for their livelihood independentlyas state intervention is limited in terms of time,area and dimensions (Mahamallik, 2008). Theapproach to adaptation needs to be dealt withdifferently from the way the mitigation issueshave been handled (TERI, 2005). Mitigationrepresents activities to protect nature fromsociety, while adaptation constitutes ways ofprotecting society from nature.
In different circumstances people adopta variety of strategies within their hand-reach.Therefore, households adopt strategies as perthe need of the time. They think of theirlivelihood in a very narrow perspective, i.e. for“survival” only. Livelihood means some sourcesfor bare needs and/or a little more thansurvival for resources-poor or vulnerablehouseholds (Mahamallik, 2008). On the otherhand, livelihood is not merely a source ofsurvival for the better-off households, butsomething indirectly holding power relationand more income. In other words, theresource-rich households directly or indirectlymake control over different social andeconomic institutions, market conditions etc.and try to make the situation in favour of themto gear up their strategies. Many timesresource-rich households use the shoulders ofpoor households to reach the peak bycontrolling institutions, which, in turn flowresources in their favour. However, wheneverthere is a change (which is basically climatic),

Journal of Rural Development, Vol. 31, No. 1, January - March : 2012
Coping Mechanisms of People in Drought-Prone Areas of Rural Orissa 63
there will be an impact. Our interest here is tominimise the vulnerability and this can beachieved through a proper adaptation process,which is of two types: ex- ante and ex- post.Such mechanisms involve both activities
undertaken in anticipation of rainfall variability;called ex- ante based on the expectation ofthe event whereas activities that take placeafter the realisation of the event is an ex- postmeasure. The details are shown in Table 1.
Table 1: People’s Strategies to Cope with Climate Variations
Ex- ante (Based on Expectation) Ex-post (Based on Event Realisation)
* Diversify crops, livestock * Reduce or intensify inputs
* Occupational diversity * Change crops
* Invest or disinvest in irrigation, fertiliser etc. * Depend on irrigation sources
* Accumulate assets * Buy or sell assets
* Purchase crop or weather insurance * Receive or provide transfers
* Make sharecropping contract * Seek non-agricultural employment
* Arrange to share with family, community * Migration
* Diversify income sources
Source : Subbiah, 2004.
Ex-post adaptation measures aim atsustenance in the immediate present ratherthan to minimise loss whereas ex-ante processalways aims at minimisation of the loss, whichhas a long-run perspective. Ex- ante process isbacked by sufficient time period, which iscompletely absent for the ex-post process. Ex-post process is just a curative measure for anytype of crucial situation. Of these twomeasures, the ex- ante measure is preferableas preventive measure is always better thancurative measure. Through the preventivemeasure loss to a particular event can beminimised to a larger extent.
Methodology
Study Area - Nuapada District in Orissa: AChallenging Hydro Climate : The present studyhas been concentrated on Nuapada district ofOrissa where drought is the most frequent andthe most devastating disaster. Nuapada districtwas chosen as the representative survey area
because it truly represented the climatevariation which took place in the State. Erraticrainfall and other geographic condition of thedistrict further aggravate the drought situation.According to the official data, the South WestMonsoon forms about more than 80 per cent2
of the total rainfall for the year. South Westmonsoon usually commences in themeteorological week 23-25 (June 4–24) in thisregion and cessation takes place during 4-42week (October 7–21). The distribution ofrainfall during meteorological week 23–42ultimately decides the fate of Kharif rainfedcrops in this district. The rainfall for North Eastmonsoon period is around 10 per cent on theaverage of the annual rainfall (October toDecember). Since, agriculture production issolely dependent on the arrival of monsoon inappropriate quantity, due to lack of alternateirrigation facilities, failure of monsoon is oftenassociated with high degree of risk foragricultural production and high incidence of

64 Sujit Kumar Mishra
Journal of Rural Development, Vol. 31, No. 1, January - March : 2012
crop failure. Despite large number of droughtmitigation programmes like Medium IrrigationProject, the up-land dominated rainfed areasare most vulnerable to water stress condition
and face drought with canny regularity. Thetemporal variability of rainfall in Nuapadadistrict is explained in Figure 1.
Figure 1: Average Rainfall (mm) in Nuapada District: 1988- 2008*
* The monsoon (SW) is defined as early : June- July; mid: August; late: September and monsoon:June- September
Source : http://www.ori.nic.in/rainfall
To understand the rainfall picture in abetter way in the study district, the South-Westmonsoon is divided into three differentdivisions as; early (June- July), mid (August)and late (September). The early period isgenerally the preparatory stage for agriculture.The second stage corresponds to sowing andsubsequently the third stage is growing of thecrop. All the three stages are crucial foragricultural operation. Depending upon thethree different stages of monsoon, theinvestment made by the people are alsodifferent. Each and every stage has their owninvestment. Closer observation of Figure 1reveals that the inconsistency1 of rainfall isfound to be more in the late period (as thecoefficient of variation (CV) value is more (78)
compared to other two periods) in Nuapadadistrict. It implies that a farmer reaches thethird stage only after investing in the first twostages. Because of this, the vulnerability of thefarmers in Nuapada district is more as thereturn of investment from the first two periodsis almost nil. Neither can they leave theoperation nor can they get anything from it.Hence these people have started diversifyingtheir income strategies which are importantlydependent upon the generation of purchasingpower in non- cropping occupation.
Data and Techniques : The study requireda three-pronged approach while collectinginformation: (a) conducting a field survey; (b)collection of data from secondary sources and

Journal of Rural Development, Vol. 31, No. 1, January - March : 2012
Coping Mechanisms of People in Drought-Prone Areas of Rural Orissa 65
discussions with officials in government, non-officials and local leaders in the sampled area;and (c) Focus Group Discussions (FGD) withvarious stakeholders.
The study has been carried out in Orissabut within the State, the selection of the districtfor detailed analysis was based on the criteriaof maximum loss during the last drought.Hence based on the loss, Nuapada district wasidentified for detailed case study analysis.Further, villages were selected for field visits
based on a composite index purely based onthe basis of infrastructure, classified asdeveloped (IU Village) and underdeveloped(ID Village). The indicators that are consideredto construct the infrastructure index are (i)power supply; (ii) communication; (iii) bankfacility; (iv) agricultural society; (v) medicalfacility; (vi) drinking water; and (vii) educationfacility. Here the conventional approach4 hasbeen adopted to determine weight fordifferent indicators for the infrastructureindex.
Construction of Infrastructure Index
In order to construct the infrastructure index, information about the 7-indicators ofthe concerned villages were collected from 2001 census report. Then they were arrangedin accordance with a binary response (If the facility is available in the village then YES =1. Non-availability of the infrastructure facilities led to a NO = 0 answer). Here in thepresent context, instead of taking a NO = 0 response, this particular survey hasstandardised this NO answer in terms of nearest distance where this facility is available.For example, if medical facility is not available in a particular village, but the nearestdistance where the facility is available is 10 km, then in that particular place instead oftaking a zero, we have taken 1/10. In this way the standardised value of all indicatorswere found out for all the villages. After this a simple average of all the standardisedindicators gave the composite index purely based on infrastructure.
One village from each category wasreflected in the study. From these two villages,a total of 257 households were selected onthe basis of circular systematic randomsampling. Of the total 257 households coveredunder this study, 107 households are from IUvillage and 150 are from ID village. Thehouseholds are classified into five distinctcategories on the basis of their landholdingsin standard acres. They are (i) large farmers(10.01 acres and above); (ii) medium farmers(5.01 to 10.0 acres); (iii) small farmers (2.01 to5.0 acres); (iv) marginal farmers (up to 2.0acres) and (v) landless (no land). In the study,out of the total sample of 257 in both thevillages, 36 landless, 25 marginal, 55 small, 33medium and 108 are large farmers.
Three sets of instruments were used tocollate information for this study :(i) household schedule; (ii) check list forsecondary data collection, which reflects,different reports on drought impact, disastermanagement, information on crop yield,rainfall , temperature etc; (i i i) Schedule(basically open-ended) for FGDs. The contentareas in- terms of variables covered aredescribed in Table 4. The narrations of thepeople with respect to drought, found fromthe FGDs through these open-endedquestions were later incorporated in theanalysis in order to enrich the outcome. Theinstruments were piloted and enrichedsubsequently before the data collectionprocedure.

66 Sujit Kumar Mishra
Journal of Rural Development, Vol. 31, No. 1, January - March : 2012
From each sample village, three FGDswere performed, consisting of 15 villagers atdifferent levels. In the first level, the FGDincluded members, such as sarpanch, wardmember, knowledgeable person, schoolteacher, village post master, individuals fromSC & ST community. At this village meeting,issues related to loss, different copingmechanisms both ex-ante and ex-post,perception about the people on the factorsaffecting the coping mechanisms, etc. werediscussed. In the second level, the FGD waswith the women folk. During the FGD withthe women, various important issues such asfetching of water, time trend analysis,maintenance of family during the migrationperiod of the spouse, wage rate during thedisaster period, exploitation in terms of wagerate and working hour were discussed. Lastly,the study also focused on the elderly peopleto gather information (through PRAtechniques) since they are vulnerable todisaster to a larger extent. The main purposeof generating information through qualitativemethod was to find out the problems facedby the affected people during the process ofdisaster. The process of interaction, in nature,was spread over extended and leisurelyconversation mode to elicit their needs anddemands. The structure followed was more orless similar for both the villages: villagemeetings, followed by group meetings, andthen individual household surveys byadministering interview schedules.
The interviews aimed to capture theeffects of drought on the studied community,strategies employed by local farmers to dealwith the situation. For this analysis, qualitativeanswers were coded into a set of definingvariables5. For example, answers to questionsconcerning the household’s current income,number of working days, wage rate, differentsources of livelihood (e.g. a household mayearn income from agriculture, agriculturalwage labour, petty business, daily wage labour
etc.), which for each household was set. Allvariables were cross-checked against eachother to search for potential trends in thematerial. Having done that, another layer ofanalysis was added, where the definingvariables were grouped into a few broadercategories (Table 2). In this paper it is primarilyused as a complement to the qualitative data.
Method Used to Define HouseholdVulnerability : A number of factors affect thedisaster vulnerability and they are: income,occupation, family structure, gender, socialclass, caste, cultural factors, and health. In orderto identify the vulnerability of a household,various approaches have been suggested inthe past literature, which focus mainly onpoverty and disaster (Bhandari et al., 2007;Brooks et al., 2005; Christiaensen and Subbarao,2005; WB, 2001, 2005). In order to identify thevulnerable groups of households, the studyused the coefficient of variation measures ofincome between the normal year and thecalamity year. Here the advantage is that itaccounts for both the normal year income vis-a-vis the calamity (impact) year income.Therefore, the households with greatervariation in the two income years will comeout as more vulnerable, whatever be theirinitial (normal) year incomes. It is generallyassumed that the income of the people isadversely impacted because of a particularcalamity (drought). Hence the pattern ofincome will show variation responding to theevent. More the variation in terms of income,more is the vulnerability due to a particularevent. The study fixed a cut-off point to identifyvulnerability. That household will be called asvulnerable whose income will show morethan 33 per cent of variability and less than 33per cent variability will be called as lessvulnerable people.
Method Used to Define Diversification : Ineconomics, the Herfindahl Index6 is a measureof the size of firms in relationship to the

Journal of Rural Development, Vol. 31, No. 1, January - March : 2012
Coping Mechanisms of People in Drought-Prone Areas of Rural Orissa 67
Table 2 : Examples of Variables and Categories Used in the Analysis
Category Defining Variables Original Questions/ Discussion Topic
Adaptive Diversification of Based on questions about perception onCapacity Livelihood alternative non-cropping livelihood sources,
accessibility to these livelihoods.
Distress Sale Number of livestock, their sale, normal price anddistress price at sale, availability of jewellery and itsprice.
Credit Loan from bank, moneylenders, relatives and friends,rate of interest and repayment mode.
Migration Landholding pattern, person migrate, type of family,capacity to migrate, other earning members in thefamily.
Agri-Insurance General insurance, agri-insurance, premium details,facilities details.
Vulnerability Income level Based on questions about income sources, householdexpenditures, and assessment of asset holdings.
Education level Based on questions regarding the respondent’s formaland informal education.
No. of members Defined as people living at the same homestead,in household sharing income sources.
Active Earners Number of male and female earners, wage rate,availability of work, type of work, distance from theirhome.
Access to Membership of Household/individual membership in local groups andnetworks the local groups level of engagement in them.and information
Access to Perceptions of access to information about options forinformation farming systems, extension service system.
Source : Author’s Own.
industry, and an indicator of the amount ofcompetition among them. It is defined as thesum of the squares of the market shares ofeach individual firm. Formula: H = Σ(Si2), whereSi is the market share of firm i in market. TheHerfindahl Index (H), also known as Herfindahl-Hirschman Index (HHI), has a value that isalways smaller than one. A decrease in theHerfindahl Index generally indicates a loss ofpricing power and an increase in competition,
while an increase implies monopoly. ThisHerfindahl Index can be used in thediversification measurement issues. TheDiversification Index is calculated as: D
1 = 1- H,
where, H is Herfindahl Index.
Results and Discussion
General Characteristics of the StudyHouseholds : More vulnerable households inthese study villages have a larger average
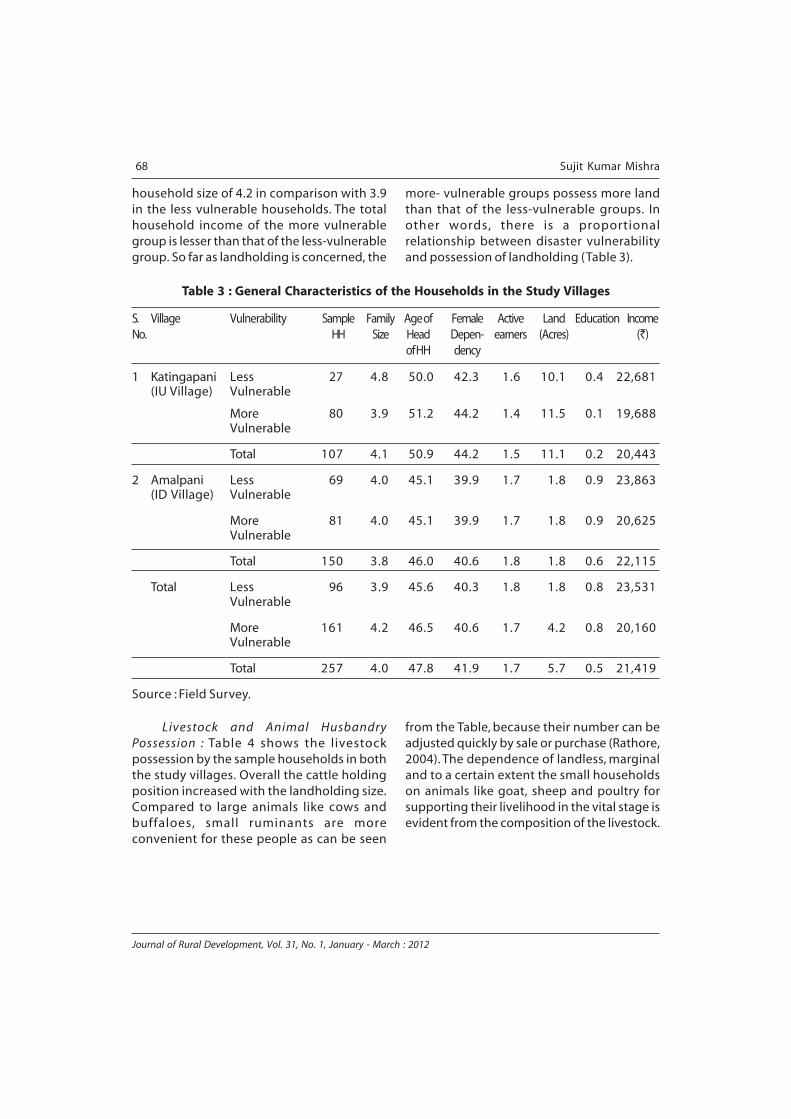
68 Sujit Kumar Mishra
Journal of Rural Development, Vol. 31, No. 1, January - March : 2012
household size of 4.2 in comparison with 3.9in the less vulnerable households. The totalhousehold income of the more vulnerablegroup is lesser than that of the less-vulnerablegroup. So far as landholding is concerned, the
more- vulnerable groups possess more landthan that of the less-vulnerable groups. Inother words, there is a proportionalrelationship between disaster vulnerabilityand possession of landholding (Table 3).
Table 3 : General Characteristics of the Households in the Study Villages
S. Village Vulnerability Sample Family Age of Female Active Land Education IncomeNo. HH Size Head Depen- earners (Acres) (`)
of HH dency
1 Katingapani Less 27 4.8 50.0 42.3 1.6 10.1 0.4 22,681(IU Village) Vulnerable
More 80 3.9 51.2 44.2 1.4 11.5 0.1 19,688Vulnerable
Total 107 4.1 50.9 44.2 1.5 11.1 0.2 20,443
2 Amalpani Less 69 4.0 45.1 39.9 1.7 1.8 0.9 23,863(ID Village) Vulnerable
More 81 4.0 45.1 39.9 1.7 1.8 0.9 20,625Vulnerable
Total 150 3.8 46.0 40.6 1.8 1.8 0.6 22,115
Total Less 96 3.9 45.6 40.3 1.8 1.8 0.8 23,531Vulnerable
More 161 4.2 46.5 40.6 1.7 4.2 0.8 20,160Vulnerable
Total 257 4.0 47.8 41.9 1.7 5.7 0.5 21,419
Source : Field Survey.
Livestock and Animal HusbandryPossession : Table 4 shows the livestockpossession by the sample households in boththe study villages. Overall the cattle holdingposition increased with the landholding size.Compared to large animals like cows andbuffaloes, small ruminants are moreconvenient for these people as can be seen
from the Table, because their number can beadjusted quickly by sale or purchase (Rathore,2004). The dependence of landless, marginaland to a certain extent the small householdson animals like goat, sheep and poultry forsupporting their livelihood in the vital stage isevident from the composition of the livestock.

Journal of Rural Development, Vol. 31, No. 1, January - March : 2012
Coping Mechanisms of People in Drought-Prone Areas of Rural Orissa 69
Table 4 : Livestock Possession of Sample Households in the Study Villages
Village Size of Livestock Ownership (% of HH) Total sampleHolding households
Cow Buffalo Goat Sheep Poultry
Katingipani (IU Village) Landless 50 0 50 0 100 4
Marginal 0 0 0 0 0 0
Small 0 0 0 0 0 0
Medium 75 0 25 0 50 4
Large 64 0 47 22 48 99
Total 58 0 38 7 61 107
Amlapali(ID Village) Landless 2 0 11 13 9 32
Marginal 11 2 5 8 9 25
Small 52 26 17 13 6 55
Medium 66 42 23 10 12 29
Large 100 85 40 20 10 9
Total 51 34 21 14 10 150
Source : Field Survey.
Impact of Drought on AgricultureProduction : Rice is the dominant crop in boththe surveyed villages. The area under rice cropconstitutes nearly 84.8 to 69.2 per cent inthese villages. The production of paddy peracre of land as per last year's production is 5.3quintals in Amlapali and 2.4 quintals inKatangipani. In both the villages one noticessignificant decline in production of paddy.
Current year production is 3.7 and 7.6 per cent,respectively of last year production of thesetwo surveyed villages, showing more than 90per cent production loss in these surveyedvillages. At the level of cultivating households,the loss of production is 100 per cent for morethan 80 per cent cultivators in Amalapalivillage whereas in Katangipani, it is 38.4 percent (Table 5).
Table 5 : Extent of Production in the Study Villages
S.No. Details Villages
Katangipani Amlapali(IU Village) (ID Village)
1 % of Paddy area 69.2 84.8
2 Average production of paddy per acre 2.4 5.3
3 % current year production to last year production 7.6 3.7
4 % of households with 100% loss 38.4 81.1
Source : Field Survey.

70 Sujit Kumar Mishra
Journal of Rural Development, Vol. 31, No. 1, January - March : 2012
The other important crops produced inthe surveyed villages have been horsegram,blackgram, greengram, raggi, cereal, gram andGunji (an inferior variety of paddy). One alsonotices significant decline in the productionof these crops which can be observed fromTable 6.
Table 6 : Production of Other Cropsin the Study Villages
S.No. Crops Villages
Katangipani Amlapali Total(IU Village) (ID Village)
1 Horsegram 18.4 13.3 15.8
2 Blackgram 15.1 10.1 12.5
3 Greengram - 42.4 42.1
4 Gunji 23.9 - 23.9
5 Gram 33.7 64.9 49.3
Source : Field Survey.
It is noticed that horsegram, blackgramand yellowgram are produced in both the
surveyed villages. One finds some productionof Gunji only in Katangipani and greengramonly in Amlapali. The current year productionin all the surveyed villages together constituteshighest proportion of 64.9 per cent for gramand lowest of 10.1 per cent for blackgram. Thecrop loss for greengram is around 60 per cent.The two crops (horsegram and blackgram)which are produced in both the villages showa proportion of 15.8 and 12.5 per cent,respectively suggesting a crop loss of morethan 80 per cent.
Impact of Drought on Farm Wage Earners:Agriculture employment in India fluctuatesseasonally both in terms of labour forceparticipation rates and the number of workdays available during particular season.This is also associated with high levels ofinvoluntary unemployment (Table 7) amongthe agriculture wage labourers. Seasonalfluctuation in wage earnings affects thepurchasing power of the daily wage labourersin full or part, particularly those who areworking as agricultural labourers (Agrawal,1990).
Table 7 : Impact of Drought on Farm Wage Earners in the Study Villages
Villages Event Annual full days No. of days of Annual real7
of employment not working due earningsto drought per person
Women Men Women Men Women Men
Katangipani (IU Village) Normal 190 280 155 55 680 1867
Drought 100 190 235 145 433 1266
Amlapali (ID Village) Normal 180 290 175 65 533 1900
Drought 95 200 255 140 367 1400
Source : Informal discussion, Field work, Observation and FGD.
For Amlapali village, the normal period’sannual earnings are `1900 and `1400 fordrought period and `1867 and `1266 are
normal and drought period income inKatangipani village (for men). Huge variationis found with regard to the annual real earning
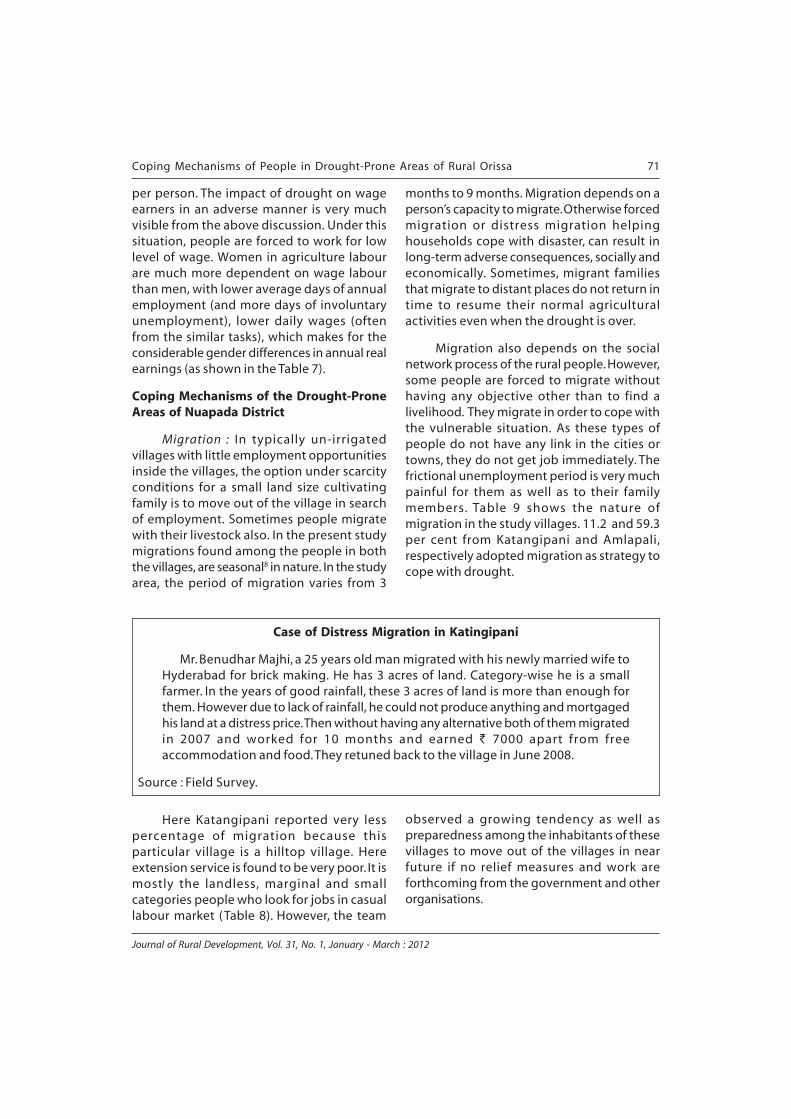
Journal of Rural Development, Vol. 31, No. 1, January - March : 2012
Coping Mechanisms of People in Drought-Prone Areas of Rural Orissa 71
per person. The impact of drought on wageearners in an adverse manner is very muchvisible from the above discussion. Under thissituation, people are forced to work for lowlevel of wage. Women in agriculture labourare much more dependent on wage labourthan men, with lower average days of annualemployment (and more days of involuntaryunemployment), lower daily wages (oftenfrom the similar tasks), which makes for theconsiderable gender differences in annual realearnings (as shown in the Table 7).
Coping Mechanisms of the Drought-ProneAreas of Nuapada District
Migration : In typically un-irrigatedvillages with little employment opportunitiesinside the villages, the option under scarcityconditions for a small land size cultivatingfamily is to move out of the village in searchof employment. Sometimes people migratewith their livestock also. In the present studymigrations found among the people in boththe villages, are seasonal8 in nature. In the studyarea, the period of migration varies from 3
months to 9 months. Migration depends on aperson’s capacity to migrate. Otherwise forcedmigration or distress migration helpinghouseholds cope with disaster, can result inlong-term adverse consequences, socially andeconomically. Sometimes, migrant familiesthat migrate to distant places do not return intime to resume their normal agriculturalactivities even when the drought is over.
Migration also depends on the socialnetwork process of the rural people. However,some people are forced to migrate withouthaving any objective other than to find alivelihood. They migrate in order to cope withthe vulnerable situation. As these types ofpeople do not have any link in the cities ortowns, they do not get job immediately. Thefrictional unemployment period is very muchpainful for them as well as to their familymembers. Table 9 shows the nature ofmigration in the study villages. 11.2 and 59.3per cent from Katangipani and Amlapali,respectively adopted migration as strategy tocope with drought.
Case of Distress Migration in Katingipani
Mr. Benudhar Majhi, a 25 years old man migrated with his newly married wife toHyderabad for brick making. He has 3 acres of land. Category-wise he is a smallfarmer. In the years of good rainfall, these 3 acres of land is more than enough forthem. However due to lack of rainfall, he could not produce anything and mortgagedhis land at a distress price. Then without having any alternative both of them migratedin 2007 and worked for 10 months and earned ` 7000 apart from freeaccommodation and food. They retuned back to the village in June 2008.
Source : Field Survey.
Here Katangipani reported very lesspercentage of migration because thisparticular village is a hilltop village. Hereextension service is found to be very poor. It ismostly the landless, marginal and smallcategories people who look for jobs in casuallabour market (Table 8). However, the team
observed a growing tendency as well aspreparedness among the inhabitants of thesevillages to move out of the villages in nearfuture if no relief measures and work areforthcoming from the government and otherorganisations.

72 Sujit Kumar Mishra
Journal of Rural Development, Vol. 31, No. 1, January - March : 2012
Table 8 : Migration of Sample Households in the Study Villages
Village Size of Total % ofHolding Person Migrate sample migration
householdsHead of Other Totalthe HH Members
Katingipani Landless 04 - 04 04 100.0(IU Village)
Marginal - - - - -
Small - - - - -
Medium 01 01 02 04 50.0
Large 03 03 06 99 6.1
Total 08 04 12 107 11.2
Amlapali Landless 16 11 27 32 84.3(ID Village)
Marginal 11 10 21 25 84.0
Small 25 23 28 55 50.9
Medium 09 04 13 29 44.8
Large - 01 - 09 11.1
Total 61 49 89 150 59.3
Source : Field Survey.
Occupational Diversification : Nuapadadistrict is primarily an agrarian economy.Though 70 per cent of the land is rainfed,people still derive their livelihood fromagriculture. The diversification of livelihoodsthrough the Herfindahl index is shown inTable 9.
Table 9 : The Herfindahl Index forLivelihoods Diversification
in the Study Villages
Villages No. of DiversificationHouseholds
Katingapani 107 0.14(IU Village)
Amalpali 150 0.39(IU Village)
Source : Field Survey.
Among the two villages (Katangipani andAmlapali) in Nuapada district, diversificationwas found to be more in Amlapali (0.39) thanthat of Katangipani (0.14).
There were so many “other activities”found in Amlapali (ID village) (14 per cent)which is found to be less in Katangipani (theIUD village) (9 per cent). The other activitiesare: non-agricultural wage work such asrickshaw drivers, gardener, mason etc.In ID village, migration is prevalent and at thevillage level through SHG, women have takennote-worthy steps to help their family(Chart 1).
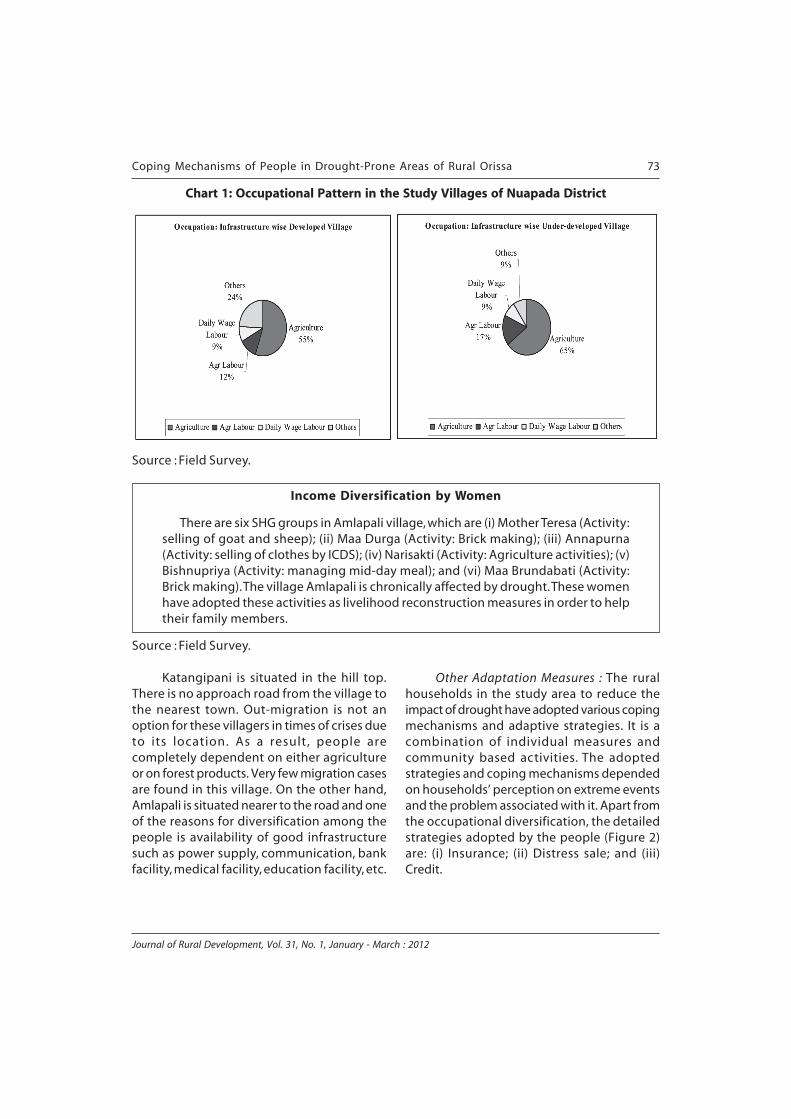
Journal of Rural Development, Vol. 31, No. 1, January - March : 2012
Coping Mechanisms of People in Drought-Prone Areas of Rural Orissa 73
Chart 1: Occupational Pattern in the Study Villages of Nuapada District
Income Diversification by Women
There are six SHG groups in Amlapali village, which are (i) Mother Teresa (Activity:selling of goat and sheep); (ii) Maa Durga (Activity: Brick making); (iii) Annapurna(Activity: selling of clothes by ICDS); (iv) Narisakti (Activity: Agriculture activities); (v)Bishnupriya (Activity: managing mid-day meal); and (vi) Maa Brundabati (Activity:Brick making). The village Amlapali is chronically affected by drought. These womenhave adopted these activities as livelihood reconstruction measures in order to helptheir family members.
Source : Field Survey.
Source : Field Survey.
Katangipani is situated in the hill top.There is no approach road from the village tothe nearest town. Out-migration is not anoption for these villagers in times of crises dueto its location. As a result, people arecompletely dependent on either agricultureor on forest products. Very few migration casesare found in this village. On the other hand,Amlapali is situated nearer to the road and oneof the reasons for diversification among thepeople is availability of good infrastructuresuch as power supply, communication, bankfacility, medical facility, education facility, etc.
Other Adaptation Measures : The ruralhouseholds in the study area to reduce theimpact of drought have adopted various copingmechanisms and adaptive strategies. It is acombination of individual measures andcommunity based activities. The adoptedstrategies and coping mechanisms dependedon households’ perception on extreme eventsand the problem associated with it. Apart fromthe occupational diversification, the detailedstrategies adopted by the people (Figure 2)are: (i) Insurance; (ii) Distress sale; and (iii)Credit.

74 Sujit Kumar Mishra
Journal of Rural Development, Vol. 31, No. 1, January - March : 2012
Figure 2: Other Coping Strategies Adopted in the Study Villages
Source : Field Survey.
Insurance : The scenario of insurancesector is not popular among the ruralhouseholds (18 per cent in the two studyvillages of Nuapada district). The people whotake agricultural loan are bound to insure theircrop. Insuring a crop by non-loan holders isfound to be very rare. The factor, which createsconfusion among the people, is the definitionof a unit, which declares a particular year as acalamity year. During the FGDs in thosevillages, people showed their dissatisfactionregarding this definition. In this scenario,information plays a major role between theplanners and the affected communities. Fromthe study, lack of a proper extension servicein the two study villages is evident. This leadsto lack of information among population aboutvarious government programmes andschemes.
Distress Sale and Credit : The mostimportant way of responding to drought isdistress sale and credit. In the study villages,sale of cattle was found to be very muchprominent during calamities. Also duringdistress, people invariably depend on credit.In the present study, it was found that 46 percent of the people took credit from differentsources to cope with the situation. They usuallydepend on banks, relatives, friends and mostimportantly village moneylenders. Due to theprocedural delay and lack of collateral, peopleare more often trapped by the villagemoneylenders who lend at very high rates ofinterest. In the study villages, the interestpayable to private moneylender variesbetween 36 and 60 per cent.

Journal of Rural Development, Vol. 31, No. 1, January - March : 2012
Coping Mechanisms of People in Drought-Prone Areas of Rural Orissa 75
Status of Insurance Sector
So far as insurance is concerned, there are two types of farmers - borrower farmersand non-borrower farmers. For borrower farmers, minimum 2.5 per cent of the disbursedcrop loan is to be insured by the farmers. The percentage is inbuilt with the scale offinance. The District Consultation Committee (DCC) generally decides the scale of finance.The DCC decides the kind and quantity of crop to be financed in the kharif season. If afarmer wants to cultivate efficiently through increased use of fertiliser, water and input,he can go beyond the threshold yield (i.e. 6.25 per cent). There is no pressure from thebank side in this regard. In Nuapada district of Orissa, the three main crops for whichloans are disbursed include paddy, groundnut and cotton. In case of small and marginalfarmers, there is a rebate of 10 per cent in the premium amount (information collectedthrough informal discussion with field officer of a regional rural bank.
Source : Informal Discussion with Field Officer, Kalahandi Anchlika Gramya Bank.
Factors Influencing Adaptation Options :The different factors that influence thecoping mechanism of the people which willincrease the adaptive capacity are explainedin Table 10.
Drought forecasting is the mostimportant factor influencing the copingmeasures among both the study villages(Table 10). Efficient and timely forecasting willreduce the vulnerability to a larger extent.Effective leadership has been suggested inboth the villages. Equitable distribution of reliefand reconstruction measures is one of the toppriorities for all the people in all the studyvillages. Use of drought resistance variety andextension services are emerging as theefficient factors influencing copingmechanisms. Presence of communityorganisation, health facilities and strong NGOintervention are suggested by the people.Extension service is found as one of theimportant factors influencing the copingcapacities of people.
Understanding of Adaptation DecisionMaking : A striking feature inherent in thepresent study of adaptive behaviour is that notonly do households plan their response, butthere is also a distinct sequence in the
Table 10 : Factors InfluencingImplementation of Coping
Mechanism in Nuapada District
S. No. Factors % of Households
Katangipani Amlapali Total(IU Village) (IU Village)
1 Leadership 55 68 60
2 Drought 100 97 93forecasting
3 Community 38 47 41Organisation
4 Relief and 100 95 92reconstructionmeasures
5 Education 09 02 04
6 Health 41 45 41facilities
7 Land 17 23 20ownership
8 Strong NGO 32 46 38intervention
9 Insurance 10 22 16
10 Extension 76 55 60service
11 Drought 65 71 65resistantvariety
Source : Field Survey.

76 Sujit Kumar Mishra
Journal of Rural Development, Vol. 31, No. 1, January - March : 2012
response. The significance of thesesequences9 in relation to householdobjectives, the way in which strategies areplanned to meet these objectives and thefactors which determine the effectiveness ofthese strategies is the primary cause ofconcern for this study. In order to examine
this idea more carefully, this study hasrecorded household responses to drought. Onthe basis of strategic and focused interviews,the most important and commonly observedadopted responses, which the affected peoplehad adopted serially with the intensity of theevent, are explained in Table 11.
Table 11: Sequencing of Adaptation Options in the Study Villages
Sequencing ofCoping
MechanismsFactors Affecting theCoping Mechanisms
Government,NGOs, Civilsociety,Panchayats,leaders,community
Availability andaccessibility toformal financialinstitutions; presenceof privatemoneylenders in thevillage; ex-antedecision-makers;availability of friendsand relatives
S.No. Point ofIntervention
Level ofIntervention
Chances are always therefor interlocking with thepeople who take ex-antedecisions. Poor peoplealways take ex-postdecisions after realisationof the event. Always ex-ante decisions are betterthan the ex-post decisions.So intervention should aimat converting the ex-postdecisions of the peopleinto ex-ante decisions
Credit1. Legal procedure of theformal financial institutionsshould be more liberal sothat all the affected peoplecan access to it
Bank
2. Insurance Extension services,communityparticipation,agriculture loans
Proper and efficient exten-sion staffing facility, moni-toring by the extension staff,discrimination of differentgovernment schemes
Demonstration of benefitand cost of insuranceschemes
Regular contact of the bank-ing staff with the people atbottom level
Proper dissemination ofbenefits to the people oncerealised
Governmentextension staff
Insurancecompanies,NGOs
Bank
Bank
(Contd.)

Journal of Rural Development, Vol. 31, No. 1, January - March : 2012
Coping Mechanisms of People in Drought-Prone Areas of Rural Orissa 77
Sequencing ofCoping
MechanismsFactors Affecting theCoping Mechanisms
Extension services,availability of input,communityparticipation
S.No. Point ofIntervention
Level ofIntervention
Diversificationof Crops
3. Proper and efficientextension staffing facility,monitoring by theextension staff,dissemination of differentgovernment schemes
Facilities of subsidies towardsagricultural input at villagelevel
Strong participation of thecommunity at all levels ofthe decision-making process
Governmentextension staff
Government,Panchayats,leaders, NGOs
Availability of foodstock, family size,availability of Food forWork Programme(FWP)
Adjustment inFood Habits
4. Through the system ofredistribution (Meert, et al.,2005). It means thateveryone contributes tocommon stocks ofresources that are thenredistributed according toagreed rules. This can bedone by creating foodgrainstorage at the village level
Proper and equitabledistribution of safety-netprogrammes like FWP
Strong association of thecommunity at the grassrootlevel
Community level,Panchayats
Government,NGOs, Community
Table 11: (Contd.)
Community
Community
Risk-bearing capacity,availability oflivelihood options,family size, education,investment capacity,extension services
Diversificationof Livelihood
Helping people byproviding non-agriculturallivelihood option. It shouldbe accompanied by propermarketing facilities. Also tosensitise them about theother sub-support systemsof the main livelihoodsystems
Encouragement foreducation
Provision of subsidisedcredit for differentlivelihood options
Government andNGOs
Government, NGO,Leaders
Bank
(Contd.)

78 Sujit Kumar Mishra
Journal of Rural Development, Vol. 31, No. 1, January - March : 2012
Sequencing ofCoping
MechanismsFactors Affecting theCoping Mechanisms
S.No. Point ofIntervention
Level ofIntervention
Asset holdingcapacity, wage rate,family size
Distress Sale5. Assurance of work throughNREGS in order to protect thepeople from distress wage
Government
Social networking,capacity to migrate,type of family, familysize, familycomposition
Migration6. Infrastructure development,road connectivity, supportservices to the immediatefamily members of themigrated person for atemporary period
Government,NGOs,Panchayats,Community
Source : Field Survey.
Thus, a clear understanding of householdbehaviour in response to drought will have anumber of important practical implications forits proper design and management in asustainable manner.
Role of Government : Throughout India,Government has assumed one of the mostimportant post-disaster roles : provision ofsupport to those persons who are least able tocope. However, in a country like India,Government often has insufficient funds toprovide assistance after major disasters. Thissection of the paper summarises the role ofthe government in reducing the vulnerability.To facilitate easier understanding, the contentsare categorised under three major areas: (i)successful adaptation vs. mal-adaptation; (ii)policy intention vs. policy practice; and (iii)financing adaptation.
Successful Adaptation vs. Mal-Adaptation : By observing the adaptationmeasures adopted in the two study villages, itwas found that the adaptive capacity of theinfrastructure-wise developed village is betterthan that of the underdeveloped village. Fromthe very beginning, these two villages aredistinguished on the basis of infrastructure. Itis obvious that infrastructure is certainly a
factor which makes difference in outcome.However, some other factors such as plannedadaptation measures implemented by thegovernment also make the difference inoutcomes. These factors are : (i) existence ofthe facility of lift irrigation (ii) availability ofactive SHG groups linked with the banks. (iii)livelihood diversification (iv) emphasis on cropsubstitution and diversification with bettercrops like cotton, pulses, groundnut,vegetables, yam etc. endowed with deep rootsystem and adaptability to withstand moisturestress much better than rice through WesternOrissa Rural Livelihood Project (WORLP), (v)availability of foodgrains at subsidised ratethrough the public distribution system (PDS);(vi) availability of different schemes like oldage pensions; (vii) repeated governmenttraining programme for primary and secondarystakeholders.
Policy Intention vs. Policy Practice : As ofnow India lacks a definite policy on disastermanagement like drought mitigation. A largenumber of specific schemes and proposalshave been debated but there is absence ofconsensus on the merits of alternativeschemes. The important policy instrumentsseen by many as a promising safety-net
Table 11: (Contd.)

Journal of Rural Development, Vol. 31, No. 1, January - March : 2012
Coping Mechanisms of People in Drought-Prone Areas of Rural Orissa 79
instrument in Orissa, however, are Food forWork Programme, National Rural EmploymentProgramme, Integrated Rural DevelopmentProgramme and Rural Landless EmploymentGuarantee Programme. Some of theseprogrammes are, however, ad-hoc in natureand do not have a long-term perspective(Government of Orissa, 2004). These are all ex-post mechanisms adapted by the people afterrealisation of the event. These measuressustain the vulnerable people in theimmediate distress situation. However, theseprogrammes do not have long runsustainability. For example, the implemen-tation of watershed in different parts in orderto reduce vulnerability is partially successful.The crop yield has increased, the groundwatertable has increased and soil erosion hasdecreased to a larger extent where watershedimplementation was successful. Furthermore,field survey in one of the watershed villagesof Khariar block of Nuapada district points outthat the success of this planned adaptation arecompletely dependent on the consensualeffort of government, NGO and communities.Sometimes, it is found that lack of propercollective action among the communitiesleads to mal-adaptation.
Financing Adaptation : Financingadaptation can be achieved through thefinancial intervention, which is required forthe sustainability of the activities. Activities likeproper maintenance of all watershedstructures including check dams, percolationtanks etc. are cost intensive. Financial supportfrom the government is required on acontinuous basis for such types of activities.An alternate way to converge the fundsinstead of creation of new funds for adaptationactivities is required. For example, variousdevelopmental works need to be channelisedthrough the NREGS (National RuralEmployment Guarantee Scheme). As a result,generation of employment as well asmaintenance of assets such as watersheds can
be maintained and monitored properly in asustainable way. Also, SHGs can be empoweredthrough soft loans at subsidised rates ofinterest for income-generating activities.Further, funds should be provided for theprimary and secondary stakeholders’ trainingprogrammes. However, for activities such asconstruction of dams, artificial recharge ofgroundwater aquifers, integrated watershedmanagement, promotion of drought-tolerantseeds, soil conservation, improved agronomicpractices and infrastructure development (likeapproach road, schools, hospital, financialinstitutions, agriculture credit societies, etc.),huge investment is required. This needs to beprovided by the government.
Conclusions and Recommendations
This article argues that drought-affectedhouseholds suffered production losses up to100 per cent in the case of paddy in the studyvillages. Drought had induced farmers to thinkof innovations in the cropping pattern andaccordingly farming practices are adapted tosuit the harsh moment. For instance, changein cropping intensity and shift to tolerantvarieties (though very insignificant in the studyvillages) are helpful to cope with drought.
Adjusting consumption of food was animportant coping strategy during droughtyears. But the adaptation among the rich andpoor were different from each other. In caseof the latter, adjustment involved a reductionin the number of meals taken in a day (fromthree times to two times). However, in case ofrich group, the scenario was different. Theyreduced the consumption of milk, pulse, sugarand vegetables.
Depending upon the severity of drought,people moved from place to place in searchof employment. The role of seasonal migrationhad impacted positively in one of the studyvillages (Amlapali village). A closer observationfrom the FGD into the inner dynamics revealed

80 Sujit Kumar Mishra
Journal of Rural Development, Vol. 31, No. 1, January - March : 2012
that the advantaged and disadvantaged groupsof society have differential impact in the shortterm and long term. In the short term,disadvantaged groups are pushed out in searchof employment. Apart from this, livelihooddiversification, distress sale and insurancewere the other important coping strategiesfound in the study villages. Infrastructureavailable was an important factor ininfluencing coping strategies. Developedvillage in terms of infrastructure had faredbetter than the less developed one.
It is suggested in this paper that copingstrategies typically fall into different stages.First they try to manage by consuming lesserfrom the existing food stock. Generally,whatever the poor people earn they consumeit. Failure of agricultural practices due to theextreme climate situation leads todiversification of livelihood. However, peoplehardly get enough time intervals to take properdecision regarding their livelihood. Whenthese mechanisms prove ineffective, peoplegradually dispose the key productive assets(like selling of cattle, mortgaging of asset forcredit), which slowly culminate in migration.However, migration completely depends uponthe capacity to migrate, networking andavailability of physical infrastructure.Examination of the sequences of the strategiesrequired a proper understanding about theimportance of adaptation mechanisms. Aproper understanding can only come from thecurrent sequencing of the strategies. Then thecurrent strategies can be rearranged accordingto the economy of that area which is subjectto that particular event. This rearrangement canbe done with proper consultation with theclimate specialist, government officials andrepresentatives from NGOs, communityorganisations and the PRI. However, these arethe depiction of autonomous adaptationprocesses, which poor and vulnerable peoplegenerally adapt. These processes need to becomplemented with and intervened at
different levels (Government, NGO, Bank, etc.)along with planned adaptation processes likeproper facilities of credit, insurance and benefitfrom crop diversification. This will enable theadaptation process to be a successful andsustainable one.
On the basis of empirical findings, thefollowing strategies can be useful in futurein order to reduce the vulnerability of thepeople :
(i) Rainfall in the study area is highlyskewed in nature and most of the timerainwater runs off and little percolatesdown. This leads to poor recharge ofgroundwater and the water tablecontinues to decline. Through drought-prone area programme, laying of contourbunds, wasteland development,construction of check dams andestablishment of percolation ponds it ispossible to arrest the run away rainwater.So watershed management is a crucialintervention that needs immediateattention in the present context ofOrissa;
(ii) Effective planning mechanism shouldbe encouraged to streamline theexisting water base of the villageeconomy;
(iii) Community based organisationinitiatives like self-help group (SHG)formation should be given priority inorder to tackle climate induced naturaldisaster vulnerability effectively;
(iv) Infrastructure development should bepromoted by interlinking the villageswith the market places;
(v) Insurance to be popularised throughsensitising the community;
(vi) Landless people should be given utmostimportance in the context of financial

Journal of Rural Development, Vol. 31, No. 1, January - March : 2012
Coping Mechanisms of People in Drought-Prone Areas of Rural Orissa 81
support from government forsustainable reconstruction of theirlivelihood. The production base of thepoor agricultural labour should bestrengthened by the provision of surplusprivate and government land in order togenerate resource base of thesehouseholds, in the absence of whichthey are completely thrown intomiseries;
(vii) Giving reliefs during the drought time isa short run solution to the localcommunity and hence does notcontribute substantially to the livelihoodof the local community in the long run.Therefore, the focus should be at
creating such livelihood assets, whichwould enhance the capacity of thepeople to cope with drought in future.Moreover, the block officials, whiledispersing any agricultural inputs likeseeds, fertilisers, post-reliefs etc. shouldmonitor equity;
(viii) Traditional knowledge on copingmechanisms of the farmers is alsoefficient in reducing vulnerability of thepeople. These coping strategies shouldbe supported by scientific and technicalmethods so that the losses due toclimatic extreme events can beminimised to a greater extent.
References
1. Agrawal, B (1990), “Social Security and the Family: Coping with Seasonality and Calamity in Rural India”,Journal of Peasant Studies, 17 (3), pp. 341-412.
2. Bhandari, H., Pandey, S., Sharan, R., Naik, D., Hirway, I., Taunk, S.K., Sastri, A.S.R.A.S. (2007), “Economic Costs ofDrought and Rice Farmers’ Drought- Coping Mechanisms in Eastern India” in Pandey, S., Bhandari, H., Hardy,B. (Eds), Economic Costs of Drought and Rice Farmers’ Coping Mechanisms : A Cross- Country ComparativeAnalysis, IRRI, International Rice Research Institute.
3. Brooks, N., Adger, W. N., Kelly, P. M. (2005), “The Determinants of Vulnerability and Adaptive Capacity at theNational Level and the Implications for Adaptation”, Global Environmental Change, 15, pp.151-163.
4. Christiaensen, L. J., Subbarao, K. (2005), “Towards an Understanding of Households’ Vulnerability in RuralKenya”, Journal of African Economics, 14, pp. 520-558.
5. Corbett, J. (1988), “Famine and Household Coping Strategies”, World Development, 16 (4), pp. 1099-1122.
6. Economic Survey of Orissa, (1981 to 2004), Bureau of Statistics and Economics, Government of Orissa.
7. Enfors, E. I., Gordon, L. J. (2008), “Dealing with Drought: The Challenge of Using Water System Technologiesto Break Dryland Poverty Traps”, Global Environmental Change, 18, pp. 607- 616.
8. Government of Orissa (2004), Orissa Human Development Report, Department of Planning andCoordination, Bhubaneswar, Orissa.
9. Hetberg, R., Siegel, P.B., Jorgensen, S.L. (2009), “Addressing Human Vulnerability to Climate Change: Towardsa ‘No- Regrets’ Approach”, Global Environmental Change , 19, pp. 89-99. http://www.ori.nic.in/rainfall(Assessed on 4 November 2009).
10. IPCC (2001), Climate Change: Impacts, Adaptation and Vulnerability, Third Assessment Report ofIntergovernmental Panel on Climate Change, Cambridge University Press, Cambridge UK.
11. IPCC (2007), Climate Change 2007, Retrieved from http://www.ipcc.ch on11 March 2009.

82 Sujit Kumar Mishra
Journal of Rural Development, Vol. 31, No. 1, January - March : 2012
12. Lemmen, D.S., Warren, F.J., Lacroix, J. (2008), From Impacts to Adaptation: Canada in a Changing Climate2007, Retrieved from http://adaptation2007.nrcan.gc.ca on 4 May 2009.
13. Mahamallik, M. (2008), An Analysis of Property Rights in Land, Resources Use and Livelihood Pattern ofRural Households (with special reference to Undivided District of Kalahandi), Unpublished Ph.D thesis,Sambalpur University, India.
14. Meert, H., Huylenbroeck, G. V., Vernimmen, T., Bourgeois, M., Hecke, E. V. (2005), “Farm Household SurvivalStrategies and Diversification on Marginal Farms”, Journal of Rural Studies, 21, pp. 81- 97.
15. Mishra, P.P (2008), Resource Extraction Externalities : A Socio-Economic Analysis of Coal Mining in Orissa,Unpublished Ph.D Thesis, University of Hyderabad, India.
16. Olmos, S. (2001), Vulnerability and Adaptation to Climate Change : Concepts, Issues, Assessment Methods,Climate Change Knowledge Network, Retrieved from http://www.cckn.net on 22 August 2005.
17. Pielke, R., Prins, G., Rayner, S., Sarewitz, D. (2007), “Climate Change 2007: Lifting the Taboo on Adaptation”,Nature, 445, pp. 597- 598.
18. Prasad, P (1998), Famines and Droughts Survival Strategies, Jaipur and New Delhi : Rawat Publication.
19. Rathore, J. S (2004), “Drought and Household Coping Strategies : A Case of Rajasthan”, Indian Journal ofAgricultural Economics, 59 (4), pp. 689-708.
20. Samal, K.C. (1998), “Poverty Alleviation after Liberalization: Study of a Tribal Block in Orissa”, Economicand Political Weekly, 33 (28), pp.1847.
21. Smit, B., Wandel, J. (2006), “Adaptation, Adaptive Capacity and Vulnerability”, Global Environmental Change,16, pp. 282- 292.
22. Subbiah, A. R. (2004), State of the Indian Farmer, Academic Foundation, New Delhi : In Association withMinistry of Agriculture, Government of India.
23. TERI (2005), Financing Adaptation, Paper Prepared for 11th Conference of Parties to United NationsFramework Convention on Climate Change, Canada: Montreal, 28 November- 9 December.
24. TERI (2007), Adaptation to Climate Change in the Context of Sustainable Development, BackgroundPaper, United Nations Department of Economic and Social Affairs Division for Sustainable DevelopmentClimate Change and Sustainable Development: A Workshop to Strengthen Research and Understanding,New Delhi, 7-8 April , Retrieved from http://www.un.org/esa/sustdev/sdissues/energy/op/new_dehli_workshop/ adaptation_paper.pdf on 25 March 2010.
25. United Nations Development Programme (UNDP) (2007), Human Development Report 2007/ 2008 : FightingClimate Change: Human Solidarity in a Divided World, New York.
26. World Bank (2001), World Development Report, 2000-2001: Attacking Poverty, The World Bank,Washington DC.
27. World Bank (2005), Ethiopia Risk and Vulnerability Assessment, Report No. 26275-ET, Human DevelopmentGroup III, Africa Region, The World Bank, Washington DC (USA).

Journal of Rural Development, Vol. 31, No. 1, January - March : 2012
Coping Mechanisms of People in Drought-Prone Areas of Rural Orissa 83
Note
1 Adaptations undertaken by individuals/ communities can be classified as: (i) Reactive or Anticipatory;(ii) Private or Public; and (iii) Planned and Autonomous (IPCC, 2001).
2 http://www.ori.nic.in/rainfal (Assessed on 4 November 2009).
3 To measure the inconsistency of rainfall, a coefficient of variation (CV) measure has been used in thestudy.
4 There are various approaches to determine weights. The conventional method involves the discretionof the investigator. The investigator uses his or her judgment to determine the importance of thecomponent variable in the composite index.
5 The defining variables selected for the study are: diversification of livelihood, distress sale, credit,migration, agriculture insurance, income level, education level, number of members in the household,active earners, membership of the local groups, and access to information. Also see Enfors and Gordon(2008).
6 Mishra (2009).
7 Annual Real Earning per person = (Number of Days * Wage Rate)/ 12.
Wage Rate : Average (women) = ` 40, Average (men) = ` 80
8 It involves neither change of place of residence nor permanent movement away from the place of birth,but a temporary change of place for the purpose of work (Prasad, 1998).
9 Corbett (1988).

Gopala .Y.M1, B. Krishnamurthy2,K.P. Raghuprasad3, K.Nagabhushanam4
and K. Shivaramu5
IMPACT OF FARMERS' PARTICIPATIONIN FARMER FIELD SCHOOLS
Journal of Rural Development, Vol. 31, No. (1) pp. 85 - 94NIRD, Hyderabad.
1. Research Scholar, UAS, GKVK, Bangalore
2. Prof. of Agril. Extension, Department of Agril. Extension, UAS, GKVK, Bangalore.
3. Assoc. Professor, Directorate of Extension, Hebbal, Bangalore
4. Prof. AC&ABC, Hebbal, Bangalore.
5. Assoc. Professor of Agril. Extension, VC Farm, Mandya.UAS, Bangalore.
ABSTRACT
The Farmers' Field School (FFS) is a non-formal learner-centered educationprocess. It seeks to empower people to solve their field problems actively by fosteringparticipation, interaction, dialogue, joint decision making etc. The presentinvestigation was carried out in Chickaballapur district of Karnataka State. The threetaluks viz. Shidlaghatta, Bagepalli and Chinthamani were purposively selected forthe study where FFS has been organised in the year 2004-05. The study revealed thatthere was a significant difference in the overall knowledge level of participants andnon-participants of FFS. More number of participants (41.67 per cent) belonged tohigh level of knowledge, whereas, more number of non-participants (45.00 per cent)belonged to low level of knowledge. Variables like age, education, extensionparticipation and extension contact, mass media exposure and achievementmotivation of the farmers were found to have significant association with knowledgelevel of participants.
Introduction
The traditional “transfer of technologymodel” in research-extension services in manydeveloping countries has increasingly comeunder considerable pressure. Imperfections inagricultural information flow among research,extension and farmers have led to hightransaction costs, which in turn have loweredthe pace of agricultural production. Currently,one of the practical dilemmas is to improvethe performance of agricultural extensionservice, which is currently facing resource,
logistical and methodological constraints(Hagmann et al., 1998). In order to developfarmers’ capacity to learn and to exploitopportunities in their local specific situation,it is essential that the learning materials bedeveloped by farmers themselves throughpersonal involvement from field experiments.Since the learners themselves develop thematerials, they can relate to them and evenexplain their contents. These conditions aresatisfied by the farmer field schools’ approachmaking it a springboard for enhancing learningamong farmers.

86 Gopala Y.M. et al
Journal of Rural Development, Vol. 31, No. 1, January - March : 2012
Farmer Field Schools (FFS) are platformsand “schools without walls” for improvingdecision-making capacity of farmingcommunities and stimulating local innovationfor sustainable agriculture (Braun et al., 2000).Farmers learn by carrying out for themselvesvarious activities related to selected farmingtechnologies and through constantobservation of the technology performancein the field. It always promotes healthy andquality discussions and decisions. Thecontinuous learning occurs throughout cropseason and facilitates farmer to farmercommunication. Some of the special featuresof FFS are, learning is field based and acts as aprimary venue for learning, encourages groupactivity involving about 30 farmers and farmwomen who learn constantly during the cropperiod. Participants work in small sub-groups,collect and analyse data and take decisionsbased on the results obtained which promoteshealthy discussions and quality decisionmaking and continue learning until a cropseason is over.
FFS has got its history witnessed duringthe end of the eighties of the last centurywhere farmers in Indonesia were putting theircrops, their health and their environment atsevere risk through indiscriminate use ofhighly toxic pesticides promoted aggressivelyby the private industry and government. Pestspecies were becoming resistant and in somecases resurgent. This called for a large-scaledecentralised programme of education forfarmers wherein they become “experts” inmanaging the ecology of their fields –bringing better yields, fewer problems,increased profits and less risk to their healthand environment. With this it can be said thatthe FFS approach emerged out of a concrete,immediate problem (Dilts, 2001).
The first wave of FFS was conducted in1989 in the rice fields of Indonesia. Thisinvolved 200 FFSs in four districts of Yogyakarta
initiated by the Indonesian National IPMProgramme with funds from the Governmentof Indonesia – United States Agency forInternational Development (GoI-USAID) andtechnical assistance from Food and AgricultureOrganisation of the United Nations (FAO). By1990, the Indonesian National IPMProgramme scaled up and launched 1,800FFSs for rice IPM in six provinces in Java,Sumatra and South Sulawesi. Around 1991, thepilot FFSs in IPM for rotation crops (mainlysoybeans) was initiated while the FFSProgramme spread out to different countriesin Asia (CIP-UPWARD, 2003).
With this background, the present studywas undertaken to assess the knowledge levelof participant and non-participant maizegrowers of Farmers' Field Schools (FFSs) andits association with socio-economiccharacteristics.
Methodology
The present investigation was carried outin Chickaballapur district of Karnataka State.Three taluks viz, Shidlaghatta, Bagepalli andChinthamani were purposively selected for thestudy where FFS was organised in the year2004-05 by UAS Bangalore and other NGOs.List of villages where FFS was organised wascollected from Karnataka Community BasedTank Management Project (KCBTMP)headquarters located at UAS, Bangalore. SixFFS were selected randomly for the study anda total of 120 respondents were selected fromthe villages, out of which, 60 respondents wereparticipants and 60 were non-participants. Toknow the impact of farmer field schools onknowledge level of cultivation practices 10participants and 10 non-participants from eachFFS were selected randomly. The present studywas concentrated on cultivation practices ofmaize. However, KCBTMP established FFS fordifferent crops like vegetables, cereals etc.

Journal of Rural Development, Vol. 31, No. 1, January - March : 2012
Impact of Farmers' Participation in Farmer Field Schools 87
Ex-post facto research design wasemployed for conducting the study. Thirty onemajor improved cultivation practices of maizewere selected for the study. Data werecollected by using a detailed pretestedinterview schedule and PRA technique wasemployed whereever necessar y. Theinformation regarding knowledge aboutproduction technologies were gathered,scored, quantified, categorised, tabulated andinterpreted using statistical methods likemean, standard deviation and chi-square.
Results and Discussion
To study the impact of Farmers' FieldSchools on knowledge level of cultivationpractices of maize farmers, sample consistingof 10 farmers each from 6 FFS which accountsto a total of 60 respondents in participantcategory and equal number of non-participantcategory respondents were selected and theyare compared in their overall knowledge leveland the results obtained are indicated in theTable as follows.
Table 1 : Overall Knowledge Level of Participant and Non-participant Maize Growers ofFarmer Field School Regarding Cultivation Practices of Maize
Knowledge level Respondents
Participants Non-participants Total(N=60) (N=60) (N=120)
Number Per cent Number Per cent Number Per cent
Low 18 30.00 27 45.00 41 34.17
Medium 17 28.33 15 25.00 30 25.00
High 25 41.67 18 30.00 49 40.83
Total 60 100.00 60 100.00 120 100.00
The overall knowledge level ofrespondents regarding cultivation practices ofmaize presented in Table 1 indicated that thereexisted difference between participants andnon-participants in their overall knowledgelevel with respect to cultivation practices ofmaize. More number of participants (41.67 percent) belonged to high level of knowledgewhereas more number of non-participants(45.00 per cent) belonged to low level ofknowledge. The farmer field school is non-formal education process where farmers willbe trained on various aspects like how to selecta seed, suitable varieties for the area, Agro-Ecosystem Analysis (AESA), IPM, field
observation, observation of pests and naturalenemies, important features of the cropenvironment and so on. Hence, the participantfarmers will be having the required knowledgeabout all these practices. The low knowledgelevel among non-participants may be due lowexposure to new technology, lack ofparticipation in training programmes, lack ofparticipation in FFS, low mass media exposureand low extension contact when compared toparticipants who are in constant touch withday-to-day developments. The findings are inagreement with findings of Parthasarathi andGovind (2001) and Godtland et al. (2003).

88 Gopala Y.M. et al
Journal of Rural Development, Vol. 31, No. 1, January - March : 2012
Table 2: Knowledge Level of Participant and Non-participant Maize Growers ofFarmer Field Schools Regarding Specific Cultivation Practices of Maize
S.No. Particulars Participants Non-participants(N=60) (N=60)
Number Per cent Number Per cent
1 Seed rate 38 63.33 29 48.33
2 Spacing (Rows) 47 78.33 38 63.33
3 Spacing (Plants) 49 81.67 29 48.33
4 Suitable month for sowing 45 75.00 31 51.67
5 Recommended varieties 50 83.33 31 51.67
6 Chemicals for seed treatment 36 60.00 23 38.33
7 Farm yard manure recommended 40 66.67 25 41.67
8 Nitrogen fertiliser recommended 47 78.33 31 51.67
9 Phosphorous fertiliser recommended 49 81.67 33 55.00
10 Potassic fertiliser recommended 44 73.33 30 50.00
11 Dose fertilisers at sowing time 43 71.61 32 61.67
12 Irrigation requirement for kharif maize 45 75.00 37 61.67
13 Irrigation requirement for rabi maize 48 80.00 31 51.67
14 Difference between beneficial and harmful insects 46 76.67 23 38.33
15 Difference between pest and disease 53 88.33 32 53.33
16 Difference between fungicide and insecticide 47 78.33 31 51.67
17 Name of the insect pest attacked 40 66.67 28 46.67
18 Name of the diseases attacked 39 65.00 28 46.67
19 Chemical used for controlling pest attacked 38 63.33 21 35.00
20 Chemical used for controlling disease 37 61.67 22 36.67
21 Knowledge about trap crop 37 61.67 28 46.67
22 Knowledge about NSKE 35 58.33 26 43.33
23 Knowledge about panchagavya 30 50.00 21 35.00
24 Knowledge about pheromone trap 34 56.67 22 36.67
25 Suitable time for inter-cultural operations 47 78.33 34 56.67
26 Knowledge about tank silt 51 85.00 40 66.67
27 FYM/compost 56 93.33 43 71.67
28 Vermicompost 37 61.67 21 35.00
29 Green leaf manure 38 63.33 19 31.67
30 Neem cake 46 76.67 14 23.33
31 Azotobacter 8 13.33 5 8.33

Journal of Rural Development, Vol. 31, No. 1, January - March : 2012
Impact of Farmers' Participation in Farmer Field Schools 89
The knowledge level of respondentsregarding specific cultivation practices ofmaize is presented in Table 2. The analysis ofknowledge level of 60 participants iscompared with 60 non-participants on 31specific cultivation practices of maize.
The knowledge level of respondentsregarding specific cultivation practices ofmaize is presented in Table 2. The result showsthat majority of participants (63.33 per cent)had correct knowledge about seed ratecompared to non-participants of whom only48.33 per cent had correct knowledge.Regarding spacing between the rows majorityof both participants (63.33 per cent) and non-participants (78.33 per cent) had correctknowledge and when it comes to spacingbetween the plants, majority of participants(81.67 per cent) had correct knowledgewhereas 48.33 per cent of non-participantshad correct knowledge. Further, majority ofparticipants had knowledge about suitablemonth for sowing (75.00 per cent),recommended varieties (83.33 per cent) andchemicals for seed treatment (60.00 per cent)when compared to non-participants. It is quiteevident that Farmer Field Schools train thefarmers on all aspects related to cultivationpractices in a participatory mode, farmersknow about appropriate cultivation practices.Where it is not so in case of non-participantssince they did not have the requiredknowledge due to their non-participation inFFS and less exposure to other source ofinformation.
Regarding fertilisers, majority of theparticipants had correct knowledge aboutrecommended quantity of farm yard manure(66.67 per cent), nitrogen fertiliser (78.33 percent), phosphorous fertiliser (81.67 per cent),potassic fertiliser (73.33 per cent) and dosageof fertilisers at the time of sowing (71.61 percent) whereas less number of non-participants(41.67 per cent) knew the recommendedquantity of farm yard manure, nitrogen
fertiliser (51.67 per cent), phosphorousfertiliser (55.00 per cent), potassic fertiliser(50.00 per cent) and dosage of fertilisers atsowing time (61.67 per cent). In farmer fieldschools, IPM and INM are given primeimportance, as a result most of the participantshad required knowledge about the organicand inorganic fertilisers as they are exposedto it and gave more importance toconservational agriculture as their primemotto in this method. Hence, the participantsof farmer field schools are influenced to useorganic manures extensively in their fieldalong with the chemical fertilisers whereverrequired.
Regarding irrigation requirement, morethan half of both the participants and non-participants had correct knowledge. Regardingpest and diseases, sufficient number ofparticipants had correct knowledge whencompared to non-participants viz., differencebetween beneficial and harmful insects (76.67per cent), difference between pest anddisease (88.33 per cent), difference betweenfungicide and insecticide (78.33 per cent),name of the insect pest attacked (66.67 percent) and name of the diseases attacked (65.00per cent). In case of integrated pestmanagement, majority of participants hadcorrect knowledge on aspects like trap crop(61.67 per cent), NSKE (58.33 per cent),pheromone trap (56.67 per cent),panchagavya (50.00 per cent). Regardingsuitable time for inter-cultural operations,majority of both the respondents had correctknowledge (78.33 per cent and 56.67 percent). Participants influenced by FFS carry outregular experiments in the field since farmersare regularly exposed to different IPMpractices and educating themselves regardingpest and disease management.
With respect to integrated nutrientmanagement (INM), majority of participantshad correct knowledge about application oftank silt (85.00 per cent), FYM/compost (93.33

90 Gopala Y.M. et al
Journal of Rural Development, Vol. 31, No. 1, January - March : 2012
per cent), vermicompost (61.67 per cent),green leaf manure (63.33 per cent) and neemcake (76.67 per cent) when compared to non-participants who have knowledge on tank silt(66.67 per cent), FYM/compost (71.67 percent), vermicompost (35.00 per cent), greenleaf manure (31.67 per cent) and neem cake(23.33 per cent). Since conservationagriculture is a part of FFS where farmers willbe trained on these practices which involvethe way of growing crops that conserve thesoil and maintain soil fertility. Participantfarmers know about the importance of theFYM, vermicompost and other organic manuresin the field to maintain soil structure andfertility. Hence, most of the participant farmershave knowledge about these.
Regarding bio-fertilisers, more thanninety per cent of both participants and non-participants did not have correct knowledge.Further, majority of both the respondents hadcorrect knowledge about optimum time ofharvesting. The reason for low knowledgeregarding bio-fertilisers may be due tocomplex technology of biological practices,non-availability of bio-fertilisers, cost of thetechnology and lack of desired risk involved.The reason for low knowledge level of non-participants about cultivation practices may bedue to lack of participation in FFS, low massmedia exposure, medium cosmopolitenessand low extension contact as revealed in thestudy. Also, the complexity involved,understanding of the above practices and costinvolved might be the reasons for lowknowledge level of non-participants. Thefindings of the study are in conformity withSakharkar (1992), Intodia and Sharma (1993),
Krishnamurthy and Veerabhadraiah (1999) andParthasarathi and Govind (2001).
Association Between Knowledge Level andIndependent Variables
The association between dependent andindependent variables was studied by usingstatistical test chi-square test. The contingencycoefficient (c) of participants and theirknowledge presented in Table 3 shows thatamong eleven variables taken up for the study,variables like age, education, extensionparticipation and extension contact are highlysignificantly associated with knowledge.variables like mass media exposure andachievement motivation had significantassociation with knowledge level of therespondents whereas, variables likelandholding, organisational participation,cosmopoliteness, economic orientation,innovative proneness were not significantlyassociated with knowledge level ofparticipants of farmer field schools.
Contingency Coefficient (c) of non-participants and their knowledge level showedthat among eleven variables, variables likeeducation, mass media exposure, extensioncontact, cosmopoliteness had highlysignificant association with knowledge. Age,landholding, extension participation andinnovative proneness are significantlyassociated with knowledge level of therespondents. Whereas, variables likeorganisational participation, economicorientation and achievement motivation arenot significantly associated with knowledgelevel of non-participants of farmer fieldschools.

Journal of Rural Development, Vol. 31, No. 1, January - March : 2012
Impact of Farmers' Participation in Farmer Field Schools 91
Table 3: Association Between Knowledge Level of Participants and Non-participantsof Farmer Field Schools and Independent Variables
S.No. Independent variables Participants Non-Participants(N=60) (N=60)
Chi- Contingency Chi- Contingencysquare coefficient square coefficient
(c)
1. Age 15.957** 0.901 11.285* 0.398
2. Education 18.473** 0.927 18.398 ** 0.484
3. Landholding 3.059 NS 0.625 10.274* 0.382
4. Mass media exposure 11.846* 0.848 18.537** 0.486
5. Extension participation 16.362** 0.906 11.846* 0.406
6. Extension contact 20.647** 0.947 19.453** 0.495
7. Organisational participation 3.683 NS 0.653 8.2784NS 0.348
8. Cosmopoliteness 6.353 NS 0.741 16.374** 0.463
9. Economic orientation 5.893 NS 0.728 6.2739NS 0.307
10. Achievement motivation 12.594* 0.859 8.263NS 0.348
11. Innovative proneness 6.538NS 0.745 11.284* 0.398
**-significant at 1% level,*-significant at 5% level, NS-Non-significant.
There was a highly significant associationbetween age and knowledge level of FFSparticipant maize growers since the youngfarmers are more receptive to new ideas andmake efforts to gain higher knowledge. In caseof non-participant maize growers of FFS therewas a significant association between age andknowledge level. The results of the study aresupported by the findings of Krishnamurthyand Veerabhadraiah (1999).
Education had highly significantassociation with knowledge level of maizegrowers who are the participants of FFS. Thepossible reason could be that education wasfound to have significant influence on therational decision making. Also, educated
farmers were having better opportunities toacquire more scientific information by the wayof mass media contact, printed materials,interaction with the scientists and extensionworkers to clarify doubts in scientific practices.The study reveals that among the respondentsselected, majority of them were young andmiddle aged. As these categories of farmersare more receptive to new technology,education had significant influence onknowledge. The findings are in line with thefindings of Subashini and Thyagarajan (2000).
Landholding had significant associationwith knowledge level of non-participant maizegrowers of FFS and not so in case ofparticipants. The possible reason could be that

92 Gopala Y.M. et al
Journal of Rural Development, Vol. 31, No. 1, January - March : 2012
the large landholdings might havenecessitated the farmers to acquire moreknowledge.
There was a significant associationbetween knowledge level of participants ofFFS and their extent of exposure to massmedia. It is logicaly true that educated farmerswith more exposure to mass media will havemore knowledge. Mass media exposure hadhighly significant association with knowledgelevel of non-participant maize growers of FFS.This is because mass media provides ampleopportunity for the farmers for exposure tonew technology.
The extension participation and theknowledge level of participants of FFS wasfound to have highly significant association.Extension activities conducted as a part of FFSin the area have direct effect on gain inknowledge level about cultivation practicesof maize. It is essential to increase theirparticipation so that their knowledge levelwould be increased. Extension participationhad significant association with knowledgelevel of non-participants of FFS maize growersas well. The possible reason could be thatextension activities conducted in and aroundthe area have direct and indirect effect on gainin knowledge.
There was a highly significant associationbetween extension contact of participants ofFFS and their knowledge level. This may bedue to the reason that the contact of extensionworker and his suggestions would help toincrease the knowledge of the farmers. Therewas a highly significant association betweenextension contact of non-participants and theirknowledge level. This may be due to thereason that the contact of extension workerand his suggestions would help to increasethe knowledge of the farmer. The findings ofthe study are in conformity with results ofAnasuya (1997) and Nirmala Devi andManoharan (1999)
The association between organisationalparticipation and knowledge was found to havebeen non-significant in both the cases ofparticipants and non-participants. The possiblereason may be, mere participation in grampanchayat, taluk panchayat and zilla panchayatmight not have helped them to acquireknowledge. Further, FFS involves any farmersirrespective of their participation in anyorganisation.
Cosmopoliteness and knowledge wasfound to have non-significant association. Itwas well accepted that the cosmopolitenessof the farmers increases the contact withoutside world so that individual may exposeto the new ideas but here in this case FFSfarmers obtain all the necessary knowledge intheir fields itself and minimum knowledgefrom outside. In case of non-participants, theassociation between cosmopoliteness andknowledge was found to be highly significant.
There was no significant associationbetween farmers' economic orientation andtheir knowledge level. This may be due to thefact that the participants are not ready to takethe risk in case of the high returns and tried togain more returns within their existing farmingsystems through better technologies. Thefindings are in line with the results obtainedby Anasuya (1997).
The achievement motivation and theknowledge level of participant maize growerswas found to be significantly associated. It maybe due to the fact that respondents withhigher achievement orientation would activelyparticipate in extension methods like FFS andacquire more knowledge. There was a non-significant association between achievementmotivation and the knowledge level of non-participant maize growers. It must be owingto the fact that, most of the non-participantshave not participated in FFS due to low andmedium achievement motivation.
Journal of Rural Development, Vol. 31, No. 1, January - March : 2012
Impact of Farmers' Participation in Farmer Field Schools 93
There was a non-significant associationbetween participants' innovative pronenessand their knowledge level. It may be due tothe reason that high innovative pronenessmight have not helped the farmers to enhancetheir knowledge. There was a significantassociation between non-participants'innovative proneness and their knowledgelevel. This may be due to the reason that afarmer who is highly proned to new technologywould try to know more about them to satisfyhis needs. The findings of the study supportthe results obtained by Anasuya (1997).
It is clear from the results that age,education, extension contact and extensionparticipation contributed significantly towardsknowledge level of participants of FFS whichneeds attention from different agencies todesign programmes/activities accordingly.
Conclusion
The results of this study showed that anextension service to the people through thefarmer field school is a better option to thechanging scenario. As a participatory approach,it could produce some striking features on thebasis of which one can conclude that theprocess of technology development has alwaysbeen the same, but the difference between
these two categories of respondents indicatesthat the FFS has proved its effectiveness. Thefindings of the study on knowledge level ofparticipants and non-participants regardingcultivation practices of maize have shown thatthe FFS has proved its worth in enhancing theknowledge of the maize growers with respectto recommended cultivation practices ofmaize which shows that the farmer fieldschools have significantly influenced thefarmers to gain the knowledge related to theimproved technologies. On the basis of this, itis recommended that the FFS approach shouldbe encouraged as an intensive teachingmethod to enhance adoption of criticaltechnologies. Efforts should be made toextend it to different states of the country ona wide range of crops with well trainedfacilitators for an effective take-off. Further,FFS on food crops would further enhance foodproduction to meet the food crisis of thecountry. New and vigorous drive should bemade to set up small groups where the FFSfarmers can become trainers or facilitators ofother farmers. Therefore, the planners andadministrators can make policy to promote theFFS concept as one of the extension tools foreffective transfer of technology through thedevelopment departments.
References
1. Godtland Erin., Elisabeth Sadoulet., Alain De Janvry., Rinku Murgai., and Oscar Ortiz., (2003), The Impactof Farmer Field Schools on Knowledge and Productivity : A Study of Potato Farmers in the PeruvianAndes, Department of Agricultural & Resource Economics, UCB, Paper 963 :1-27.
2. Anasuya, A., (1997), Impact of Farmer Field School on Farming Community, M.Sc. (Agric.) Thesis, (Unpub.),Tamil Nadu Agricultural University, Madurai.
3. Braun Ann, R., Thiele, G. and Fernandez, M., (2000), Farmer Field Schools and Local Agricultural ResearchCommittees : Complimentary Platforms for Integrated Decision Making in Sustainable Agriculture,Agricultural Research and Extension Network, Network Paper No. 105, Overseas Development Institute.
4. CIP-UPWARD, (2003), Farmer Field Schools : From IPM to Platforms for Learning and Empowerment,International Potato Center – Users’ Perspectives with Agricultural Research and Development, LosBanos, Laguna, Phillippines, 87 pp.
5. Dilts, (2001), Scaling up the IPM Movement, LEISA Magazine, 17-3: 18-21.

94 Gopala Y.M. et al
Journal of Rural Development, Vol. 31, No. 1, January - March : 2012
6. Intodia, S. L. and Sharma, F.L., (1993), Technological Knowledge of Tribal Farmers, Indian Journal of ExtensionEducation, 29(3&4) : 84-86.
7. Hagmann, J., Chuma, E., Connoly, M. and Murwira, K., (1998), Client Driven Change and Institutional Reformin Agricultural Extension : An Action Learning Experience from Zimbabwe, Agricultural Research andExtension Network, Network Paper No. 78.
8. Krishnamurthy, B. and Veerabhadraiah, V., (1999), Impact of IPM Farmer Field Schools Training Programmeon Knowledge Level of Rice Farmers, Cur. Res., 28:125-127.
9. Nirmala Devi, M. and Manoharan, M., (1997), Adoption Level of Guava Cultivators - An Analytical Study,Indian Journal of Extension Education, 8(2):2723-2726.
10. Parthasarathi, S. and Govind, S., (2001), Knowledge of Trained and Untrained Farmers on IPM Practices,Journal of Extension Education, 13(1): 3293-3297.
11. Sakharkar, V.S., Nikhade, M.D and Bhople, S.R., (1992), Correlates of Knowledge and Adoption Behaviour ofSoyabean Growers, Maharashtra Journal of Extension Education, 11: 212-217.
12. Subhashini, D. and Thyagarajan, S., (2000), Socio-Personal Characteristics of Tapioca Growers, Journal ofExtension Education, 11 (1): 2723-2726.

R. S. Tyagi*
MANAGEMENT OF SCHOOLEDUCATION : ROLE OF PANCHAYATIRAJ INSTITUTIONS
Journal of Rural Development, Vol. 31, No. (1) pp. 95 - 114NIRD, Hyderabad.
* Assistant Professor, Department of Educational Administration, National University of EducationalPlanning and Administration 17-B, Sri Aurobindo Marg, New [email protected] [email protected]
ABSTRACT
This paper considers how Panchayati Raj Institutions manage elementaryeducation in coordination with the Education Department in Madhya Pradesh. It isbased on a field study on Recent Trends in Educational Administration in MadhyaPradesh. Its objective was to critically examine the linkages and coordination betweenthe development administration and the Panchayati Raj Department. Themethodology of the study was based on survey research, obtaining primary andsecondary data through interviews and document analysis. Open-ended questionsand interviews were transcribed and inferences were drawn. Conducted on a sampleselected from two districts of Madhya Pradesh, namely, Datiya and Ratlam, the studyfound that Madhya Pradesh has transferred the management of school education toPanchayati Raj Institutions and has evolved a well-knitted structure of developmentadministration for elementary education in the form of Shiksha Kendras. It has beenfound that while Panchayati Raj Institutions are generally entrusted with theresponsibility of recruitment, transfer and decision-making, they face inadequacy ofcapacity-building programmes for them; while participation of the local communityin school management is increased to a great extent, lakhs of children are still out-of-school; and that there is hardly interface between Panchayati Raj Institutions andthe Parent Teacher Associations at school level. Coordination between PanchayatiRaj Institutions and various bodies of educational administration at district, blockand habitation levels has also been a major concern.
Introduction
Development administration isconcerned with providing service delivery toall citizens in a required quantity as well asquality and, in a timely manner withparticipation of all the stakeholders. In India,the administration of school education hasrapidly marched towards developmentadministration and witnessed a major
transformation in its approaches, structures andfunctions (NUEPA Country-wide Studies onEducational Administration, 1991-2001).Emphasis on structural changes has madeadministration more responsive to theeducational needs of people at the grassroot( Tyagi, 2006). Efforts have been made todecentralise planning and management ofeducation to the local level so as to make thedelivery of educational programmes more

96 R. S. Tyagi
Journal of Rural Development, Vol. 31, No. 1, January - March : 2012
effective. It is in this context that theestablishment of grassroots level democracythrough local self-governance has becomesignificant. Association of local bodies withmanagement of primary education in thecountry is not a new phenomenon; it startedduring the last quarter of 19th century. Overthe years, the National Policies on Education,Education Commissions and Committees haveconsistently elaborated the role of PanchayatiRaj Institutions (PRIs) in the management ofschool education. The 73rd and 74 th
Constitutional Amendments, where power issought to be devolved on the local bodies,again required the states to changeeducational administrative structures andfunctions.
Development administrationemphasises the need for local specificstrategies which necessitate decentralisationin decision-making to identify and bring thosechildren to schools who are not with thesystem at present. The Total Literac yCampaign introduced in decentralised modein the country and implemented through aparticipatory management approach was asignificant step towards localising educationaldecision-making process, besides other statelevel development programmes such as theBihar Education Project, the Lok JumbishProject and Shiksha Karmi Project in Rajasthanand the Basic Education Project (Education forall Project) in Uttar Pradesh. Thesedevelopment programmes providedexperiences for launching the District PrimaryEducation Programme (DPEP) and the SarvaShiksha Abhiyan (SSA) where the focus ofplanning and decision-making is decentralisedadministration and management with theinvolvement of all the stakeholders.Development administration has broughtabout a much-needed shift in the deliverymechanism, increased investment in basiceducation, in expenditure pattern specificallyfrom staff-salary-oriented budget to
infrastructure-development oriented budget,with the financial aid from internationalagencies. There is also a shift in supply-orientedparadigm to demand oriented paradigm as faras the educational needs at local level areconcerned. As a result, planning andmanagement of elementary education hasbecome participatory at the local level withthe help of Village Education Committees andSchool Management Committees (Govinda,1997) where PRIs have an important role toplay.
Inferences from Research Studies
It is necessary to recall how recentresearch has viewed the role of PRIs inmanaging school education. These aredivergent views and even critical about therole of Panchayati Raj Institutions in themanagement of education. It was originally afond hope that transferring education to PRbodies will provide on-the-spot supervisionand control of schools which will lead toquality improvement in education. However,the quality of supervision has considerablygone down due to ineffective supervision,haphazard inspection, tardiness ofadministration and insecurity of teaching staff(Krishnamacharylu, 1993), despite anotherobservation that ever since the responsibilityof construction of building has been given topradhans and headmasters, the buildings wereconstructed in time, and of the better quality(Zaidi, 1993). It was also found that theinterference of non-officials in posting andtransfer of teachers and using them forpurposes other than teaching, affected theirperformance and morale (Chalapati, 1992). Thedual control over education without cleardefinition of powers and functions of thePanchayati Raj Institutions and the EducationDepartment naturally resulted in confrontationand conflict between them (Bhargava andVenkata Krishnan, 1993). In the last twodecades of the last century, primary educationin West Bengal under PRIs has not been at all

Journal of Rural Development, Vol. 31, No. 1, January - March : 2012
Management of School Education : Role of Panchayati Raj Institutions 97
encouraging (Acharya, 2002). Manystakeholders now seem to feel that thehierarchical and bureaucratic control over theprimary education system has not decreasedin any way even after the establishment ofthe Panchayati Raj Institutions (Govinda, 2003).The involvement of panchayats is only in termsof providing community support; their role isperipheral, if not nil, in the management andadministration of education.
There is poor coordination between thePRIs and the schools. The ground realityindicates very weak and ineffectiveimplementation of the panchayat system asregards role of women in PRIs, resulting in littleprogress on the path of real decentralisation(Josephine, 2009). PRIs cannot deliver thedesired results as they are rarely empoweredto share any meaningful responsibility in thefield of education. Empowerment ofpanchayats is ultimately the only solution toall the related education problems at thevillage level (Mathew, 2008). The importanceof panchayats in universalisation of primaryeducation is often sidelined by contradictionin the guidelines of specific programmes,leaving very little scope for local governanceto be involved in it (Ray, Dale and Chatterjee,2008). Elected members of PRIs do not haveany administrative powers; they cannot takeany disciplinary action against any teacher,even if found guilty of any irregularity. There ishardly any capacity building programme forPRIs in school management. In spite ofprovisions in the guidelines that PRIs will beresponsible for recruitment and selection ofteachers, they are not included in the selectioncommittees of teachers, but are simplyassigned the task of posting of teachers inschools from the list of selected teachers(Tyagi and Akhtar, 2009).
Research Methodology
The paper, based on a field study on‘Recent Trends in Educational Administration
in Madhya Pradesh (Khandelwal and Tyagi,2003)' was conducted on a sample selectedfrom two districts, namely, Datiya and Ratlam.Latest data and information available on thesubject have also been incorporated to thepaper. It critically examines the linkages andcoordination between the developmentadministration and the Panchayati RajDepartment and identifies deficiencies ininterface between developmentadministration and PRIs. The methodology ofthe study was based on survey research,obtaining primary and secondary data throughinterviews, and document analysis related toeducational development and interface.Open-ended questions and interviews weretranscribed and inferences were drawn.Interviews were conducted with all thestakeholders including officers and electedrepresentatives of PRIs and officers ofEducation Department.
Structural Reforms
Transfer of Management of SchoolEducation to Panchayati Raj Institutions :Madhya Pradesh has made continuous efforts,since 1994, to decentralise the managementof school education to local level and toempower the community to make educationresponsive to the people’s needs. Theresponsibility of managing school education(from classes I-XII) was transferred to three-tier Panchayati Raj Institutions videGovernment Order of 30.10.1996 of the SchoolEducation Department, Government ofMadhya Pradesh to make further effort tostrengthen Panchayati Raj Institutions and todevelop them as units of self-governance inconsonance with the 73rd ConstitutionalAmendment. Accordingly, the staff of schooleducation at the Zilla (district) and Janpad(block) level were transferred to the ZillaPanchayat and Janpad Panchayat, respectively.There are Standing Committees on Education(Shiksha Sthayi Samitis) of PRIs at ZillaPanchayat and Janpad Panchayat levels and

98 R. S. Tyagi
Journal of Rural Development, Vol. 31, No. 1, January - March : 2012
Village Education Committee at GramPanchayat level for looking after managementof school education. The presidents of ZillaPanchayat, Janpad Panchayat are the Chairmenof the respective Committees. Any proposalrelated to education emanates at school level,moves through the VEC to Block EducationOfficer (BEO) to Standing Committees atJanpad Panchayat. The proposal is thereafterreceived by the District Project Coordinatorof Zilla Shiksha Kendra and submitted to theStanding Committee on Education at districtlevel. There are Chief Executive Officers (CEOs)at Janpad and Zilla levels under PRIs forhelping the Standing Committees onEducation.
At the initial stage, the StandingCommittee on Education (SCE) of ZillaPanchayat was responsible for : maintenanceof school buildings, cleanliness of schoolpremises, furniture and tat pattis, school staff,playground, tree plantation, maintenance ofenvironment, arrangements of toilets anddrinking water and constitution of VillageEducation Committees ( VECs); and forcoordination, the SCE would ensure regularattendance of teachers and students in school,regular teaching, all the work related to schooldevelopment, take note of all the programmesconducted by Central or state governmentfrom time to time, encourage co-curricularactivities, appropriate use of school funds,conduct enrolment drives and awarenessgeneration programmes for general public andparents. Table 1 indicates the transfer ofpowers to PRIs under Madhya PradeshPanchayati Raj Act, 1994; powers of theStanding Committees on Education at Zilla andJanpad (block) Panchayats and VillageEducation Committee at Gram Panchayat levelfor managing school education and also thepowers of School Education Department.
Establishment of Shiksha Kendras at Zilla,Janpad and Cluster Levels : The Stategovernment has created Shiksha Missions
(advisory bodies) and Shiksha Kendras(implementing bodies) at State, district, blockand cluster levels under the overall commandof Rajiv Gandhi Shiksha Mission (RGSM) at theState level to provide support to the PanchayatiRaj Institutions via mission mode approach forthe management of elementary education. Atthe State level, Rajya Shiksha Kendra wascreated by bringing together the Directorateof Adult Education and Literacy, the StateCouncil of Educational Research and Training,and the set-up of Sarva Shiksha Abhiyan.Similarly, at the district level Zilla ShikshaKendras were created under the overallcommand of the Chief Executive Officer, ZillaPanchayat. District Project Coordinator of SSAbeing its principal coordinator andrepresentatives from the District Institute ofEducation and Training, adult education andliteracy, non-formal education brought underthe umbrella of Zilla Shiksha Kendra as shownin Figure 1. At the Janpad level, BlockEducation Officer, Block Resource Centre (BRC)Coordinator and a representative of the DistrictInstitute of Education and Training work underJanpad Shiksha Kendra. Below the Janpadlevel, Jan Shiksha Kendras have been createdat the cluster level for monitoring andimplementing purposes. The headmaster oflocal middle school would be the Jan ShikshaPrabhari.
Parent-Teacher Associations : The Parent-Teachers Associations (PTAs) were establishedas statutory bodies at school level through theMadhya Pradesh Jan Shiksha Adhiniyam 2002with administrative and financial powers givento these bodies, all functions of grampanchayats related to school managementwere given to Gram Sabha (a village under agram panchayat); and the functions of VECstransferred to PTAs. VECs, known as EducationCommittees, constituted under Gram Sabhasare supervisory and monitoring bodies forprimary and upper primary schools. They donot participate in the school management

Journal of Rural Development, Vol. 31, No. 1, January - March : 2012
Management of School Education : Role of Panchayati Raj Institutions 99
Figure 1 : Structure under Development Administration for Missing Mode

100 R. S. Tyagi
Journal of Rural Development, Vol. 31, No. 1, January - March : 2012
Table 1: Powers and Functions of Management of School Education Transferred to PRIsunder Madhya Pradesh Panchayati Raj Act, 1994
S.No. Powers under State Sector Powers under Panchayati Raj Institutions
State Education DepartmentZilla Panchayat
(StandingCommittee on
Education)
JanpadPanchayat
(block)(StandingCommittee on
Education)
GramPanchayat( Village
EducationCommittee)
(Contd.)
(1) (2) (3) (4) (5)
1. Recognition of school Management and Inspection of all Establishment,running of schools schools falling management and
under village conduct ofself-governments primary,
secondary andsenior secondaryschools
2. Specification of Arrangement of Advocacy- Collection andcurriculum and textbooks school building etc. publicity for distribution of
literacy textbooks andcampaigns school material
3. Planning and conducting Duration of study Construction, Construction,examinations and vacations in extension and repair and
schools maintenance of maintenance ofprimary school secondary schoolbuildings building costing
up to ` 500,000
4. Assessment of students’ Purchase of Supply of free Distribution ofeducational levels teaching material uniforms to girl scholarship
students
5. Preparation of annual Supply of free Book bank Book bankacademic calendar textbooks and scheme scheme
Book bank scheme
6. Approval for starting new Distribution of Conduct of Appointment ofcourses in schools free uniforms formal school instructors and
programmes supervisors
7. All co-curricular activities at Non-formal Total literacy Selection ofdivisional and state levels education campaign Gurujis in EGS
programme schools
8. Innovations in school- Mid-day meal Recruitment, –based activities programme selection and
posting ofteachers inprimary schools

Journal of Rural Development, Vol. 31, No. 1, January - March : 2012
Management of School Education : Role of Panchayati Raj Institutions 101
9. All activities related to Operation – –collection and analysis of blackboardeducational data scheme
10. Implementation, supervision Distribution ofand monitoring of Central and ‘free ship’ andCentrally sponsored schemes scholarship
11. Responsibility for training Recruitment,of teachers and other staff; selectionControl over the staff of and posting andteacher training institutions transfers of teacherssuch as DIET, and BTI in upper primary,
secondary andsenior secondaryschools. – –
12. Power for decision making – –regarding opening of newschools and constructionor extension of schoolbuildings using fundsprovided by the Stategovernment; constitutionof district planningcommittees according tothe policies provided bythe State government.
Table 1: (Contd.)
(1) (2) (3) (4) (5)
Source : Directorate of Public Instruction, Madhya Pradesh, Bhopal.
activities. Madhya Pradesh Jan ShikshaAdhiniyam, 2002 envisages that plan proposalsemanating from PTA would be sent to GramSabha through Education Committee for itsapproval, which would further transmit themto Jan Shiksha Kendra at Cluster level.Construction of school buildings and theirinfrastructure under SSA are done by theVillage Nirman Samiti. At present, thesepowers have been delegated to the GramSabha. The members of PTA include mothersand fathers of all children enrolled in schools.Earlier, elections to Executive Committee ofPTA were held annually but an amendmentmade in the Jan Shiksha Adhiniyam in 2006
envisages that members of the ExecutiveCommittee shall be elected for two academicsessions. At the primary level, there would be14 members of Executive Committee and atthe upper primary level there would be only12 members.
In primary and upper primary schools,mother or father or guardian of each of suchchild who secured highest percentage ofmarks in the annual examination of thepreceding academic session in classes I-IV andin classes V-VII will be the members of theExecutive Committee. President and Vice-President will be selected from members of

102 R. S. Tyagi
Journal of Rural Development, Vol. 31, No. 1, January - March : 2012
the Executive Committee. A Shala ShikshaKosh has been established for each Parent-Teacher Association; about 80 per cent grantsgiven to the school under SSA are transferredfrom Zilla Shiksha Kendra to this Shala Kosh;and the decision to use the resources is takenby PTA. Funds to distribute incentives likeuniforms are also provided to PTAs accountdirectly. The role of PTA in school improve-ment, apart from general management ofschool includes developing village-leveleducational plans, financial planning,procurement plan, decision-making, recordkeeping and audit.
Linkages of PTA with PRIs : The MadhyaPradesh Jan Shiksha Adhiniyam , 2002,envisages for the PTA the following linkageswith the PRIs: the PTA to present its quarterlyreport before the Education Committee of theVillage (Gram Sabha); informs the EducationCommittee to initiate disciplinary actionagainst teachers found to be irresponsibletowards their duty; and for the EducationCommittee to review activities of the PTA andhelp them carry out their responsibilities;monitors activities of the PTA and extendssupport to solve the problems faced by them;and makes efforts to augment resources forShala Shiksha Kosh of the school.
Progress of Education : The State ofMadhya Pradesh has intensively made uniquestructural reforms in administration ofelementary education by creating shikshakendras and transferring management ofschool education to PRIs. It is necessary toassess the progress of elementary educationunder this form of development administrationand to see how these two are coordinating asa single unit to achieve educationaldevelopment at the desired level. Thesubsequent discussion reveals the interfacebetween two management structures inrespect to the progress of education and theissues and concerns which still need to beaddressed and further interventions. Zilla
Shiksha Kendras conduct programmes forformal schooling. Besides, the alternativeschooling facilities that lead to mainstreamingof the out-of school children include: non-residential bridge courses and residentialbridge courses for the children of migratorylabour, modernisation of madrasas, humandevelopment centres for urban deprivedchildren and the shiksha ghar programme. Theopening of Education Guarantee Scheme (EGS)centres started earlier, are now being upgradedto primary and upper primary schools tocontribute to the progress of elementaryeducation in the State as seen in Table 2.
Table 2 reflects phenomenal growth inenrolment of children in the age group 6-14,indicating that the gap of non-enrolledchildren has narrowed down by 63.3 per cent,from 7.7 lakh children out of the system in2003-04 to 2.82 lakh in 2006-07. Its impact onenrolment of children recorded 30.6 per centgrowth at primary stage, from 91.51 lakhchildren in 2003-04 to 119.52 lakh in 2006-07, and 19.3 per cent, at upper primary stagewhich has been lower as compared to theprimary stage, that is, from 25.54 lakh childrento 44.81 lakh during the corresponding period.As regards progress of education ofdisadvantaged groups, the data relating to girlsindicate that participation of girls at theprimary stage increased from 46.6 per cent in2003-04 to 47.5 per cent in 2006-07, whilethere has been a marked decrease in the shareof scheduled caste children from 24.55 to 17.7per cent at primary stage, and of scheduledtribes from 24.5 to 24.2 per cent during thisperiod. The participation of disabled childrenmade little progress; it remained almost thesame, that is, 0.5 per cent during 2003-04 to2006-07 except during 2004-05 when it was0.6 per cent, indicating that the developmentefforts have not yielded significant result forbringing out-of-school children ofdisadvantaged groups to the mainstreamschooling. The transition rate from primary toupper primary, as indicated in the Table,

Journal of Rural Development, Vol. 31, No. 1, January - March : 2012
Management of School Education : Role of Panchayati Raj Institutions 103
however, increased moderately from 86.54per cent in 2003-04 to 93.70 per cent in 2006-07. The progress of elementary education inMadhya Pradesh, despite the efforts made byRGSM through Shiksha Kendras at differentlevels under the management of PanchayatiRaj Institutions has rather been inadequateand not satisfactory for achieving the elusivegoal of universalisation of elementaryeducation primarily due to lack of coordination
between PRIs and PTAs, among many otherconsiderations that still need urgent attentionto get the desired success.
Major Issues
Lack of Infrastructure : Availability ofadequate infrastructural facilities in schoolsdetermines the quality of education amongothers to attract non-enrolled children toschool and also to reduce dropout of children
Table 2 : Trends of Outcome Indicators of Elementary Educationin Madhya Pradesh based on Base Line Data
Indicators 2003-04 2004-05 2005-06 2006-07
Number of children 7.74 lakh 4.28 lakh 4.72 lakh 2.82 lakhaged 6-14 years notenrolled in school oralternative system(In lakh)
Number of children 117.05 lakh 141.78 lakh 155.27 lakh 164.33 lakhenrolled in school (6-14) (elementary) (elementary) (elementary) (elementary)
91.51 lakh 103.51 lakh 112.74 lakh 119.52 lakhin primary in primary in primary in primary
25.54 in upper 38.27 in 42.53 in 44.81 inprimary upper primary upper primary upper primary
Share of girls enrolled 46.60 47.00% 47.30 47.50in primary stage (%)
Share of SC children 24.55 17.90 17.80 17.70at primary stage (%)
Share of ST children 24.50 24.20 24.20 24.20at primary stage (%)
Share of disabled 0.50 0.60 0.50 0.50at primary stage(%)
Transition rate from primary 86.54 90.62 92.47 93.70to upper primary (%)
Source : State Report of 5th Joint Review Mission of Sarva Shiksha Abhiyan, Rajya Shiksha Kendra,Bhopal, Madhya Pradesh, January, 2007.
104 R. S. Tyagi
Journal of Rural Development, Vol. 31, No. 1, January - March : 2012
to quite an extent. Table 3 indicates theinfrastructural gaps in the State schools in2006-07. As many as 244 primary and 5032upper primary schools were without their ownschool buildings; 2377 primary and 948 upperprimary schools had buildings in dilapidatedconditions; besides lack of 16776 and 7739required classrooms in primary and upperprimary schools, respectively and inadequatefacilities like drinking water, toilets for boysand girls in thousands of primary and upperprimary schools etc. which need to beaddressed as major concerns to bring moreand more children to school. It reflects thatthe efforts of PTA and PRIs backed up with thestrength of RGSM for providing financial,academic and administrative support for thedevelopment programmes for primary andupper primary education have not yet reachedtheir targets.
Low Educational Indicators of Access,Enrolment and Quality : Table 4 indicates thatthe basic educational indicators of access,enrolment and quality have been low in 2005-06 with a net enrolment ratio of 90.80 percent at primary stage and 78.40 per cent atupper primary stage. This is perhaps due to alarge number of non-enrolled and out-of-school children in the age group of 6-11 (3.34lakhs) and in the age group of 11-14 (1.38 lakh).Out of a total of 155.27 lakh children enrolledat primary and upper primary stages (112.74lakh at primary and 42.53 lakh at upper primary)including children enrolled in all types ofbridge courses and shiksha ghars, more than30 lakh (about 20 per cent) dropout from thesystem which appeared to be a hard task tobring them back to formal schooling oralternative schooling system. The dropout rateas indicated in Table 4, remains 19.9 per centat primary stage and 19.10 per cent at upperprimary stage due to the many reasons(mentioned by the approved Annual Work Planand Budget, 2007-08) such as of the total out-of-school children 19.1 per cent drop out due
to working as labour in agriculture and alliedfields, 15.9 per cent due to sibling care, 15.1per cent due to cattle grazing and 13.3 percent on account of weak financial conditionand 13.2 per cent due to migration. Rest ofthe children do not attend school because ofhandicaps or prolonged illness, schoolenvironment not conducive, lack ofeducational facilities and reluctance of theparents to educate their children. The problemgets further complicated by shortfalls inattendance rate of 73.40 per cent at primarystage and 73.50 per cent at upper primarystage as a deterrent to achieving universalaccess to elementary education, with as manyas 27 children out of 100 enrolled in schoolremaining absent from each primary andupper primary school. Besides there were25688 disabled children out of school in theage group of 6-11. The failure rate of about 22per cent children at primary level and 39 percent at upper primary level makes the problemeven more complex as they are not able tocross the primary and upper primary classes,the pass percentage at primary being 78.40per cent and at upper primary level 61.10 percent. The existence of 32325 single teacherprimary schools which lead to low quality ofeducation imparted to children, so also, over-crowded classes in primary and upper primaryschools too determine the quality of educationimparted by them. There were 30582 primaryand 4518 upper primary schools with pupil-teacher ratio of more than 50 which oftenhave an adverse impact upon the classroomdelivery in general and education quality inparticular.
Out-of-School Children (Dropouts andNever-Enrolled) : Table 5 indicates district-wiseout-of-school children in the State. More than82 per cent of children belong to thedisadvantaged groups of society who are outof the education system. Of the total out-of-school children, 50 per cent were girls.Similarly, of the total SC and ST out-of-school

Journal of Rural Development, Vol. 31, No. 1, January - March : 2012
Management of School Education : Role of Panchayati Raj Institutions 105
Tab
le 3
: G
aps
in In
fras
tru
ctu
re in
200
6-07
Pri
mar
y Sc
ho
ols
24
42
37
71
67
76
14
15
03
72
65
62
85
92
74
84
Up
per
Pri
mar
y5
03
29
48
77
39
86
82
13
82
5N
ASc
ho
ols
Tota
l5
27
63
32
52
45
15
22
83
25
10
90
62
85
92
74
84
Sou
rce
: An
nu
al W
ork
Pla
ns
and
Bu
dg
et fo
r 200
7-08
, Sar
va S
hik
sha
Ab
hiy
an—
Raj
ya S
hik
sha
Ken
dra
, Bh
op
al, M
adh
ya P
rad
esh
.
Typ
e o
fsc
ho
ol
Sch
oo
lsw
ith
ou
t ow
nb
uild
ing
No
. of s
cho
ols
in d
ilap
idat
edco
nd
itio
n
Req
uir
edad
dit
ion
alcl
assr
oo
m
No
. of s
cho
ols
wit
ho
ut d
rin
kin
gw
ater
faci
lity
No
. of s
cho
ols
wit
ho
ut t
oile
tfa
cilit
y
No
. of
sch
oo
lsw
ith
ou
t gir
lsto
ilet f
acili
ty
No
. of s
cho
ols
wit
ho
ut
Kit
chen
Sh
eds
for m
id-d
aym
eal

106 R. S. Tyagi
Journal of Rural Development, Vol. 31, No. 1, January - March : 2012
Table 4 : Educational Indicators in Madhya Pradesh
S.No. Basic Indicators (Primary) Status (2005-06)
1. Total Enrolment (I-V) (In Lakh) 112.74
2. Gross Enrolment Ratio 103.61
3. Net Enrolment Ratio 90.80
4. Out of School Children (In Lakh) 3.34
5. Dropout Rate 19.9%
6. Attendance Rate 73.40%
7. Achievement level (pass%) 78.40%
8. No. of Single Teacher Schools 32325
9. No. of Schools with PTR more than 50 30582
10. No. of Disabled Children to be enrolled 25688
Basic Indicators (Upper Primary)
1. Total Enrolment (VI-VIII) (In Lakh) 42.53
2. Gross Enrolment Ratio 90.24
3. Net Enrolment Ratio 78.50
4. Dropout Rate 19.10
5. Out of School Children (In Lakh) 1.38
6. Attendance Rate 73.52
7. Achievement level (pass%) 61.10
8. No of Schools with PTR more than 50 4518
Source : Report on Appraisal of Annual Work Plans and Budget for 2006-07, Sarva ShikshaAbhiyan—Appraisal Note for Project Approval Board (MHRD, Government of India).

Journal of Rural Development, Vol. 31, No. 1, January - March : 2012
Management of School Education : Role of Panchayati Raj Institutions 107
children, 48.63 and 51.74 per cent were SCand ST girls. Again, out of the total out-of-schooldisabled children 42.10 per cent were girls. Itsuggests that the management efforts madefor universalisation of elementary educationunder SSA seem to have overlooked thesegroups as alternative strategies too have notbeen effective to bring all out-of-schoolchildren to school. This may probably be sobecause the responsibility of managing schooleducation in rural areas was taken from VillageEducation Committees and given to PTAs. Thenew name of VEC, that is, EducationCommittee of the Gram Sabha, has beenassigned the job of supervision of school andmonitoring of the progress of PTA by theMadhya Pradesh Jan Shiksha Adhiniam, 2002.It seems there is no interface between PRIsand the development programmes at schoollevel. All these adversely affect the quality ofschool education, possibly because of the lackof clear direction and coordination ofeducational administration at different levels.
The Dying Cadre : Along with the transferof management of school education to PRIs, itwas decided by the State government that if ateacher retired from the regular post, the postwill be abolished and it will be kept in theDying Cadre. Since 1996 in place ofrecruitment of teachers in regular scales, theState started recruitment of Shiksha Karmis forthree years, at a very low pay scale, almostabout one-fifth of what regular teachers got,as shown in Table 6. Teachers appointed in theShiksha Karmi category were initially proposedto be regularised after three years. But after atwo-year period, the appointment of ShikshaKarmis was stopped, and, in their place,teachers in primary, upper primary andsecondary schools were recruited on contractbasis. The PRIs maintain that this practice hasbeen introduced in the State to make themmore accountable and their further promotionwill be made on the basis of their performance.The pay of contract teachers is fixed on a
consolidated basis. This has resulted in a lot ofconfusion, as teachers working on regular payscales belong to the Education Department,and once a regular teacher retires, the post isabolished from the Education Department, andis kept in Dying Cadre. The resulting vacancyis filled only on contract basis by the PanchayatiRaj bodies, Shiksha Karmis, contract teachers(Sanvida Shala Shiksha) and Gurujis belongingto the Panchayati Raj Institutions.
However, on 19.12.2005 the Stategovernment constituted a Committee to clearthe problem of differences between the payscale of shiksha karmis and the contactteachers. The new pay scale and thedesignation of teachers are presented in Table7. At present, the State has started to giveshiksha karmis the new regular pay scale andthe designation but new teachers are stillrecruited on contract basis. As per order of theMadhya Pradesh Government, every personselected through direct recruitment for thepost of contract teachers shall be appointedfor a period of three years for any school. Atthe end of the year, the appointing authoritywill assess his or her performance. After threeyears he or she may be appointed again forthe next three years on contract basis by thepanchayat on the basis of his work, conductand performance. Such persons onappointment will be entitled to receive anincrease of 15 per cent per annum of thecontract amount. If the work of contractteacher is not satisfactory, his services will beterminated by the panchayat. The rulesgoverning recruitment of contract teachersfurther state that recruitment will be school-based and no applicant shall apply for twoposts in different schools at a time.
Quality Issues : The major challenge foreducational planners and administrators is notuniversal enrolment and retention only butalso to ensure better quality of education. InMadhya Pradesh, access to school and lack of

108 R. S. Tyagi
Journal of Rural Development, Vol. 31, No. 1, January - March : 2012
Table 5 : Out-of-School Children 2005-06 (6-14 years age group)
S.No. District Total SC ST Disabled
(1) (2) (3) (4) (5) (6)
1 Sheopur 4987 748 1825 380
2 Morena 2385 601 23 84
3 Bhind 490 144 0 353
4 Gwalior 21497 5424 2181 230
5 Shivpuri 12341 2445 2537 574
6 Guna 12666 2148 2864 179
7 Ashoknagar 4378 911 590 115
8 Datia 2010 450 207 137
9 Dewas 4251 794 1631 293
10 Ratlam 9755 1654 4226 216
11 Shajapur 14484 4414 592 197
12 Mandsaur 5968 1301 435 439
13 Neemuch 1662 217 335 276
14 Ujjain 7068 2339 435 4406
15 Indore 25559 6908 5879 472
16 Dhar 11017 334 9249 853
17 Jhabua 38954 1352 36309 1096
18 Khargone 11009 851 7180 811
19 Barwani 36719 2056 30955 547
20 Khandwa 15552 771 11400 651
21 Burhanpur 5008 308 2783 253
22 Bhopal 4014 1038 288 167
23 Sehore 2056 469 670 412
24 Raisen 1471 61 30 290
25 Rajgarh 5266 1285 327 220
26 Vidisha 11653 2707 939 403
27 Betul 6562 489 5143 339
(Contd.)

Journal of Rural Development, Vol. 31, No. 1, January - March : 2012
Management of School Education : Role of Panchayati Raj Institutions 109
28 Hoshangabad 17544 3237 4287 784
29 Harda 3995 692 2191 134
30 Sagar 18698 4501 3040 808
31 Damoh 5852 1361 1252 423
32 Panna 13767 3515 3478 457
33 Chhatarpur 13642 4493 1957 319
34 Tikamgarh 13532 3608 912 1106
35 Jabalpur 18995 4576 4195 864
36 Katni 2841 1073 1701 358
37 Narsinghpur 2148 395 494 201
38 Chhindwara 3993 730 1642 637
39 Seoni 1406 113 524 452
40 Mandla 4466 53 3465 379
41 Dindori 1525 43 1101 105
42 Balaghat 917 181 306 401
43 Rewa 14336 3936 3186 905
44 Shahdol 2062 248 1206 604
45 Anuppur 1370 146 803 291
46 Umaria 5915 535 3674 74
47 Sidhi 38557 5764 19695 1137
48 Satna 7899 1909 2847 856
Total 472242 83328 190989 25688
Total Number and 238804 40523 98817 10860Percentage of Girls (50.10%) (48.63%) (51.74%) (42.10)
Table 5 : (Contd.)
(1) (2) (3) (4) (5) (6)
Total Disadvantaged group out–of-school children =girls+SC+ST+Disabled=398004 (82.37%)
Source : State Report of 5th Joint Review Mission of Sarva Shiksha Abhiyan, Rajya Shiksha Kendra,Madhya Pradesh, January, 2007.

110 R. S. Tyagi
Journal of Rural Development, Vol. 31, No. 1, January - March : 2012
infrastructure – school buildings, playgrounds,over-crowded classroom, dilapidatedconditions of school buildings, vacant posts andabsenteeism of teachers, lack of pre-serviceand in-service training of teachers, non-availability of textbooks in time, ineffective andincomplete delivery of classroom instructionsand syllabuses – all have led to low-enrolment,low retention and low achievement ofchildren and ultimately low quality ofeducation in schools. Lack of properprofessional qualifications of primary andupper primary school teachers have an adverseeffect on quality of teachers. In MadhyaPradesh professional qualifications are notnecessary at any stage of school education,particularly for elementary education. TheState has, however, started a 60-day diplomacourse for providing training to untrainedteachers in primary and upper primary schools.This course is known as ‘Operation Quality’.Assistant Teachers, Shiksha Karmis andcontract teachers (Sanvida Shala Shikshak)have been registered for this training, thoughthe State has not yet made the professionalqualifications essential for recruitment ofteachers in primary, upper primar y andsecondary schools.
Interface Between PRIs and PTAs : TheMadhya Pradesh Jan Shiksha Adhiniyam, 2002,has given all the administrative and financialpowers to PTAs for managing and conductingdevelopment programmes for primary andupper primary schools, apparently sideliningthe role of PRIs for school management. It hasbeen found that Education Committee of theGram Sabha is responsible to monitor andsupervise the activities conducted by the PTA.Gram Sabha does not have representation inthe PTA. There is also provision in theAdhiniyam that Village Education Plan (JanShiksha Yojana) prepared by the PTA will besubmitted to Education Committee of the localbody and the Committee with itsrecommendations submit it to the Gram Sabha
for consideration and approval. Thereafter, thePlan will be sent to the Jan Shiksha Kendra.The plan will be called as Jan Shiksha Yojna.There is no involvement of PRIs in theeducational activities of PTA. The appraisalreport of the Annual Work Plan and Budget2006-07 indicates the involvement of PTAmembers, anganwadi workers, and otherliteracy volunteers in preparation of JanShiksha Yojan but not of the members of theGram Sabha or the Education Committee. Thereis no mention about the number of trainingprogrammes conducted for PRIs at differentlevels for their involvement in educationalactivities. Structural reforms in Madhya Pradeshindicate diversification of administrativestructures and decentralisation of authority,participatory management and convergenceof different departments and resources. Theformation of Zilla Shiksha Kendras in MadhyaPradesh suffers from lack of coordination sinceall the constituents of Zilla Shiksha Kendrahave their own offices at distant places.Administrative and Financial Powers foreducational management were devolved toPRIs at district and block levels but, in practice,PRIs cannot exercise these powers due to theirlack of awareness. Presidents of ZillaPanchayats have a Rule Book, but they are notable to interpret the rules. Educational plansprepared by PTA are not presented in the GramSabha. Therefore, most of the members ofGram Panchayats are unaware about the plansand the planning processes, which constitutea serious lacuna in the process of effectiveschooling.
Conclusions
Changes in the policy and approach ofeducational development in Madhya Pradeshhave taken place several times in the past withevery change in the government. Thesechanges come from top to bottom, resultingin a clear lack of interface between thedevelopment administration and the PRIs since

Journal of Rural Development, Vol. 31, No. 1, January - March : 2012
Management of School Education : Role of Panchayati Raj Institutions 111
Table 6 : Different Categories of Teachers with Different Pay Scales on the Same Posts
(2002)
Regular Teachers Shiksha Karmi Contract Teachers
Category Pay Scale Category Pay Scale Category Pay Scale
Guruji in EGS ` 1000/-p.mCentres (Consolidated)
Lower Division ` 4000-6000 Class-III ` 800-1200 Class-III ` 2500/-p.mTeacher in (Consolidated)Primary andUpper PrimarySchools
Upper Division ` 5000-8000/ Class-II ` 1000-1800 Class-II ` 3500/- p.mTeacher (High, (Consolidated)and HigherSecondarySchools)
Lecturer ` 5500-9000/ Class-I ` 1200-2040 Class-I `4500/(Hr. Sec. (Consolidated)School)
Source : Directorate of Public Instruction, Bhopal, Madhya Pradesh (2002).
Table 7 : New Pay Scales of Different Category of Teachers in Madhya Pradesh
S.No. Category Terms Primary Upper Primary
1. Regular TeachersAppointed byEducation and TribalDepartment before1995
Eligible for allgovernmentallowances andincrements
Assistant Teachers(`3500-5500)app.
Upper grade(`4500-6000) app.
Source : Report on Appraisal of Annual Work Plans and Budget for 2006-07, Sarva ShikshaAbhiyan—Appraisal Note for Project Approval Board (MHRD, Government of India) and theAnnual Report of the Department of Education, 2007-08, Government of Madhya Pradesh.
2. Shiksha KarmiAppointed byJanpad Panchayat
Renewal after 3years (can bemade regularteacher)
III grade fixed@ ` 2500 permonth
II grade Fixed@ ` 3500 per month
3. Contract Teachers(Sanvida Shikshak)Appointed byJanpad Panchayat
3 years renewablecontract
III grade fixed@ ` 2500 permonth
II grade fixed@ ` 3500
4. Guruji Appointedby Community
Fixed @ ` 2500per month

112 R. S. Tyagi
Journal of Rural Development, Vol. 31, No. 1, January - March : 2012
decisions regarding administration, financeand academic issues are taken by the RGSMand conveyed to the Shiksha Kendras atdifferent levels. PRIs’ role is l imited torecruitment, transfer and decision-making atthe district and block levels and not at schoollevel where PTA manages and plans all theactivities of school creating a gap infunctioning of PRIs. Another major issue relatesto making all these structures and functionsas one unified plan of action. The employeeson Shiksha Kendras are either on deputationor on contract basis and the three constituentsof Shiksha Kendras are associated with eachother in a temporary arrangement; they arenot amalgamated. This creates insecurity inthe employees regarding their cadre and theservice conditions. This again shows the lackof interface between the constituents ofShiksha Kendras.
Education Committee of Gram Sabha cangive punishment to teachers if the working ofa teacher is unsatisfactory. This situation seemsto be unrealistic. Education Committee andGram Sabha have no involvement in otheractivities but are responsible simply formonitoring and supervision. It has been foundthat Education Committee members hardlyvisit the school and similar is the case with themembers of Gram Sabha, they do not have thecapacity to involve in the activities of schoolmanagement. It seems only a formality to getany proposal approved from the EducationCommittee and Gram Sabha. Their role isperipheral in which they are neither interestednor motivated to involve in the developmentprogrammes since all the powers in theAdhiniyam have been given to PTA. Power ofchecking of financial documents at all thethree levels—village, Janpad and district—should be devolved to PRIs. Transfer ofteachers should not be done without thepermission of the Gram Panchayat. PRIs shouldbe treated as special invitees in PTAs. GramPanchayat should have the powers of rewards
and punishment of teachers. Teachermanagement in the State is one of theimportant issues that should be addressed onpriority basis. The policy interventions seemto be haphazard. For instance, the pay scalesof teachers are not uniform. They have beenfixed separately for regular teachers and thecontract teachers. It is necessary to bringteachers in regular pay scale, may be on thebasis of their annual appraisal, to have parityin the present three categories of teachers inthe same school on different pay scales forthe similar work. The present capacity buildingprogrammes available for Village EducationCommittees and other members of the localbodies are also quite inadequate andineffective. Therefore, there is a need toprepare and implement capacity buildingplans. Involvement of Panchayati RajInstitutions should be an integral part ofplanning and implementation mechanismright from the habitation level to the districtlevel. Functions like planning, curriculum andsyllabus formulation, preparation of textual andnon-textual materials, training of teachers,recruitment, selection and transfers ofteachers are all important for building theircapacities. This is only possible when thepowers are devolved in true sense and thecapacity building programmes are conductedfor PRIs and accountability is fixed at variouslevels. There is a serious need to assess thepolicies adopted so far for the present phaseof structural reforms. An urgent task would beinvolvement of all the stakeholders ineducational planning and management. Thisis necessary to understand the interface ofthese administrative structures in managingvarious activities of elementary education inthe State.
Under the Right to Education Act, localauthority as defined by the Act will comprisemunicipal bodies in urban areas andpanchayats in rural area and also a body havingadministrative control over schools in the area

Journal of Rural Development, Vol. 31, No. 1, January - March : 2012
Management of School Education : Role of Panchayati Raj Institutions 113
such as Block Education Officer/AreaEducation Officer as the case may be in theStates. School Management Committee whichis a necessary pre-condition for primary andupper primary schools also has the
References
1. Acharya, Promesh, (2002), Education: Panchayat and Decentralization—Myths and Realities, Economicand Political Weakly, February 23, 2002.
2. Balwantray, G. Mehta (1959), Report of the Team for Study of Community Projects and National Extensionin Services.
3. Bhargava, B. S. and Venkatakrishnan V, (1993), Panchayati Raj in Tamil Nadu—Issue and Problems,Kurukshetra, Vol. 40 (9), 1992, pp.6-7.
4. Chalapati, B. V. (1992), Rural Education Administration, Deep & Deep Publications, New Delhi.
5. Government of India, Ministry of Human Resource Development (1993), CABE Committee onDecentralized Management of Education, New Delhi.
6. Govinda, R. (2003), Dynamics of Decentralized Management and Community Empowerment in PrimaryEducation : A Comparative Analysis of Policy and Practice in Rajasthan and Madhya Pradesh, In CommunityParticipation and Empowerment in Primary Education by R. Govinda and Rashmi Diwan in 2003, NUEPA,New Delhi.
7. Govinda, R. (1997), Dynamics of Decentralized Management and Community Empowerment in PrimaryEducation, NUEPA, New Delhi.
8. Government of India, Ministry of Human Resource Development, Department of Education (1992),National Policy on Education and Programme of Action 1986 & 1992, New Delhi.
9. _________ Department of Education (1993), Report of the Central Advisory Board of Education (CABE)Committee on Decentralized Management of Education, New Delhi.
10. _________ Report on Appraisal of Annual Work Plans and Budget for 2006-07, Sarva Shiksha Abhiyan—Appraisal Note for Project Approval Board, New Delhi.
11. Government of Madhya Pradesh, Madhya Pradesh Jan Shiksha Adhiniyam, 2002 and Madhya Pradesh JanShiksha Niyam, 2003, Bhopal.
12. Government of Madhya Pradesh, Rajiv Gandhi Shiksha Mission, Seven Years, 1994-2001, Bhopal.
13. _______ School Education Department (2003), Job Chart (Responsibility and Accountability) of Officers,Employees and Teachers Working in the Department, Bhopal.
14. _________ Annual Work Plans and Budget for 2007-08, Serva Shiksha Abhiyan—Rajya Shiksha Kendra,Bhopal.
15. _________ Rajya Shiksha Kendra (2006-07), 5th Joint Review Mission—State Report, Bhopal.
16. _________ School Education Department (2003), Document on Transfer of Powers to PanchayatsRegarding Decentralization of Duties, Functions and Programmes, Bhopal.
participation of Gram Panchayat. It is, therefore,necessary that panchayats at village, block anddistrict levels should be strengthened andinvolved in planning and management ofelementary education.
114 R. S. Tyagi
Journal of Rural Development, Vol. 31, No. 1, January - March : 2012
17. Josephine, Yazali, (2008), Status of Women in Panchayati Raj Members and Need of Strengthening theCapacity in Development of Girls Education in Madhya Pradesh - A Preliminary Investigation. PaperPresented in the Workshop of Management of School Education under PRIs in Madhya Pradesh, Bhopal(August 31-31, 2008).
18. Krishnamacharyulu, V. (1993), Management of Education in Panchayati Raj Institutions in Andhra Pradesh,A Case Study, Hyderabad.
19. Mathew, George (2008), Panchayats and Education, Institute of Social Science, New Delhi, PaperPresented in the Workshop on Management of School Education under PRIs in Madhya Pradesh, Bhopal(August 31-31, 2008).
20. National University of Educational Planning and Administration, Studies on EducationalAdministration—Structures, Processes and Systems, 1991-2001, New Delhi.
21. Rai, Manoj, Dale, Priyanka and Chatterjee, Sayonee (2008), Democratic Decentralization andUniversalization of Primary Education, Society for Participatory Research in Asia, New Delhi, PaperPresented in the Workshop on Management of School Education under PRIs in Madhya Pradesh, Bhopal(August 31-31, 2008).
22. Tyagi, R. S. (2006), Institutional Reforms in Educational Management—The Issue of Sustainability, Reviewof Development and Change, Volume XI, Number 1, January- June, Madras, 2006.
23. Tyagi, R. S. and Akhtar, Najma. (2009), A Study on Management of School Education under PRIs in MadhyaPradesh—Participation, Progress and Perspective, NUEPA, New Delhi.
24. Zaidi, SMIA (1993), Management of Educational Institutions under Panchayati Raj Institutions atGrassroots Level, Paper Presented at National Seminar of Management of Education, New Delhi, 2002.

Kartick Das*
FINANCIAL INCLUSION - AGATEWAY TO SUSTAINABLEDEVELOPMENT FOR THEIMPOVERISHED
Journal of Rural Development, Vol. 31, No. (1) pp. 115 - 128NIRD, Hyderabad.
* Assistant Professor & Head, Department of Political Science, Mathabhanga College, P.O. - Mathabhanga,Dist. - Coochbehar, West Bengal - 736146. Email - [email protected]
ABSTRACT
Inclusiveness is the growth mantra for policymakers today - not just in India,but the world over. In India, the Government has engineered a major directionalchange in public policy and stressed on inclusive growth for reduction indeprivation and disparities and for sustainable economic growth. In this direction,financial inclusion is in the top priority for policymakers and it is argued thatinclusive growth cannot happen without ensuring banking services at affordablecosts to the weaker sections of society who do not have any access to the formalfinancial system. India has a long way to go to ensure financial inclusion. TheReserve Bank of India, NABARD, Government Departments and numerous civilsociety organisations should make collaborative efforts to attain the mission offinancial inclusion. With a more enabling environment, the next few years promiseto be exciting for the delivery of financial services to attain sustainabledevelopment for the impoverished.
Introduction
World over there has been increasedemphasis on inclusiveness in economy, societyand polity. In India, the Government hasengineered a major directional change, inpublic policy by its focus on inclusive growth.It was argued that the verdict of the electionwas against the urban-biased economicdevelopment policies pursued earlier (Monaij:2005). The Government wants to focus moreon agriculture, rural development,employment, and social sector (Dev : 2007).Creation of legal entitlements for anindividual's right to work has added toresilience and dynamism in rural economy. The
right to information (2005) and the right toeducation (2010) are effective tools ofempowerment for removing socialimbalances. The Government's flagshipprogrammes have been the principalinstrument for implementing its agenda forinclusive growth. For the year 2011-12, BharatNirman, which includes Pradhan Mantri GramSadak Yojana, Accelerated Irrigation BenefitProgramme, Rajiv Gandhi GrameenVidyutikaran Yojana, Indira Awaas Yojana,National Rural Drinking Water Programme andRural telephony have together been allocated` 58,000 crore. This is an increase of ` 10,000crore from the 2010-11 (Union Budget :2011-12).

116 Kartick Das
Journal of Rural Development, Vol. 31, No. 1, January - March : 2012
Financial Inclusion for Inclusive Growth
The inclusive growth as a strategy ofeconomic development received attentionowing to a rising concern that the benefits ofeconomic growth have not been equitablyshared. Growth is inclusive when it createseconomic opportunities along with ensuringequal access to them. Apart from addressingthe issue of inequality, the inclusive growthmay also make the poverty reduction effortsmore effective by explicitly creating productiveeconomic opportunities for the poor andvulnerable sections of the society. The inclusivegrowth by encompassing the hithertoexcluded population can bring in several otherbenefits as well to the economy. The keychallenge, therefore, is to make economicgrowth more inclusive. Different studies haveaccepted that inclusive growth cannot happenwithout affordable access to financial services.Theoretical and empirical researches highlightthe role of financial inclusion in facilitatinginclusive development (Rajan and Zingales:2004). Evidence indicates that variousmeasures of financial accessibility arepositively related to economic growth (Kingand Levine: 1993; Levine and Zervos: 1998).An efficient and diversified financialaccessibility is important for promoting savingsand channellising them into investment andcreating opportunities to achieve faster rateof economic growth (Kodan et al: 2010). Dr.Rangarajan Committee on Financial Inclusion(2006) suggested a national mission onfinancial inclusion.
Venkataramaraju and Ramesh (2010)defined financial inclusion as the process ofensuring access to financial services and timelyand adequate credit where needed by thevulnerable groups such as weaker sections andlow income groups at an affordable cost.According to Mandira Sarma and Jesim Pais(2008), financial inclusion refers to a processthat ensures the ease of access, availability and
usage of the formal financial system for allmembers of an economy. Financial inclusionmeans inclusion of all sections which do nothave much access to financial institutions orfinancial products to a well-functioningfinancial system. More broadly, it refers to amovement that envisions a society in whichas many poor as possible have permanentaccess to an appropriate range of high qualityfinancial services, including savings, credits,insurance and money transfer. In other words,this would include:
* Easy and safe access to bank accounts.
* Extending timely and cheap credit forpoor and low income households andsmall entrepreneurs.
* Provision of financial and bankingservices at an affordable cost todisadvantaged and low-income groups.
Financial inclusion is the buzz wordtoday and it can be measured in terms ofaccess to institutions such as banks, insurancecompanies and micro-finance institutions(MFIs) and their services. Selected countriesof the world are also looking to providespecific financial products such as debit cards,credit cards, life and health insurance andhome mortgages. On 29 December 2003,former UN Secretary-General Kofi Annan said:"The stark reality is that most poor people inthe world still lack access to sustainablefinancial services, whether it is savings, creditor insurance. The great challenge before us isto address the constraints that exclude peoplefrom full participation in the financial sector.Together, we can and must build inclusivefinancial sectors that help people improvetheir lives." (wikipedia-Kofi Annan). India hasa long way to go to ensure financial inclusion.About half of the population of the country donot have any types of banking facilities whilethree-fourths are not covered by any form ofinsurance. The people who do not have much

Journal of Rural Development, Vol. 31, No. 1, January - March : 2012
Financial Inclusion - A Gateway to Sustainable Development for the Impoverished 117
access to financial services or financialproducts are the poorest and mostmarginalised communities - women andfemale-headed households, dalits/scheduledcastes, scheduled tribes, people withdisabilities, widows and destitute women,coastal fisher-folk and landless artisans, etc.
Objectives of the Study
The objectives of the present study are:
(i) To clarify the concept of financialinclusion;
(ii) To analyse status and concerns of accessto finance;
(iii) To analyse policy intervention of the RBI;and
(iv) To suggest measures towards achievingtotal financial inclusion.
Methodology and Significance
The present study is based on secondarysources of data gathered from differentsources, like, RBI website, NABARD website,newspapers, different issues of 'The Journalof Indian Institute of Banking & Finance', etc. Itis divided into different sections namely;introduction, present status and concerns, RBI'spolicy intervention, suggestive measures andconclusion with bibliography.
The study throws light on variousdimensions of financial inclusion in India. Itwill be helpful for decision makers informulating new policies/amending theexisting policies regarding rural orientedfinancial system in the country. The RBI andNABARD in particular may benefit byimplementing the measures suggested in thestudy by improving access to finance for thepoor.
Literature Survey
There is plenty of research work onfinancial inclusion, micro-finance/credit,inclusive banking conducted by researchscholars in different ways (Dasgupta: 2005,Vasimalai and Narender: 2007, Peachy andRoe: 2004) and these studies found thatfinancial inclusion has long way to go towardssustainable development for theimpoverished. In fact, scholars may attempt tostudy different new dimensions and issues onthe area of financial inclusion. A review of afew important and relevant literatures in thisarea has been made in this study.
Venkataramaraju and Ramesh (2010)focused on various aspects of financialinclusion in India, UK and USA in conjunctionwith an analysis of its outcome in India. Kapoor(2010) pointed out that by integrating thespecific needs of the bottom of the pyramidmarkets and working backward to developsuitable solutions different from the existingones; we can help the financially excluded.Nagayya and Rao (2010) highlighted thereports of the Committee on Financial Inclusion(2008). Mehta (2010) pointed out howfinancial inclusion has become part ofperformance evaluation criteria for banks.Khan (2010) analysed the government decisionto permit the entry of new private banks inIndia. He advocated preventing return of thepre-1969 era of banking.
Muhammad Yunus (2008) popularisedthe concept of micro-finance and is of theview that structural change to increase accessto finance will result in creating self-employment for poor. Mahajan (2010) saidthat micro-finance institutions should bejudged by their median and best, notaccording to the black sheep that hurt thecause of the poor who have helped the sector

118 Kartick Das
Journal of Rural Development, Vol. 31, No. 1, January - March : 2012
grow. Kabeer (1999) threw light on socialimpact of micro- credit in rural areas in India.Rao and Linnemann (1996), Dev (2007),Sainath (2004), and Kannan (2007) emphasisedthe need for economic reforms with equitabledevelopment. The present study highlights onvarious dimensions and challenges of financialinclusion in India.
Status of Access to Finance
Access to financial services, particularlycredit, has been a priority agenda for theGovernment since the early days ofIndependence for all-round development ofthe economy. One of the important steps inthis measure was the revival of the cooperative
credit structure in the mid-1950s and thedecades of the 1960s also continued to focuson institutional credit flows and cooperatives.Following the nationalisation of banks in 1969,the decade of the 1970s was marked byintroduction of lead bank scheme and directedlending. In the decade of 1990s, there havebeen many significant State initiatives in theinstitutional and policy spheres to facilitateaccess to financial services by poor,downtrodden, dalits and tribals. The evolutionof the Indian Banking sector in India and itsrole towards the growth and development ofthe country has been distinct and definitive(Ahuja : 2010).
Table 1 : Access to Finance- Major Milestones
Year Achievements
1921 Establishment of Imperial Bank of India.
1949 Government of India nationalised Reserve Bank of India.
1955 Imperial Bank of India was partially nationalised and it was named as the StateBank of India.
1969 Nationalisation of 14 large commercial banks by Indira Gandhi Government.
1971 Establishment of priority sector credit norms.
1975 Establishment of Regional Rural Banks (RRBs).
1980 Six private sectors banks were nationalised.
1982 Establishment of National Bank for Agriculture and Rural Development (NABARD),an apex institution in rural credit structure.
1990 Establishment of Small Industries Development Bank of India (SIDBI) to providemicro-credit.
1992 Development of self-help group (SHG) methodology in Karnataka to link theunbanked rural population.
1993 Establishment of Rashtriya Mahila Kosh (RMK).
2005 Establishment of Rural Infrastructure Development Fund (RIDF) to assist StateGovernments/State owned corporations.
2006 Establishment of Committee on Financial Inclusion under the Chairmanship of Dr.C. Rangarajan.
2008 Waiving of farm loans amounting to ` 65,000 crore.
2010 Successful listing of SKS Micro-finance in stock exchange.

Journal of Rural Development, Vol. 31, No. 1, January - March : 2012
Financial Inclusion - A Gateway to Sustainable Development for the Impoverished 119
The Government of India has takenseveral steps to strengthen rural credit system.The rural branches of commercial banks havebeen expanded and certain policies have beentaken in order to ensure greater flow of creditto agriculture and allied sectors. The IntegratedRural Development Project (IRDP) wasinitiated to ensure supply of credit andsubsidies to marginalised and landlesscultivators. The Reserve Bank of India (RBI)guidelines stipulate that the commercial banksare required to ensure that 40 per cent of totalcredit is provided to the priority sectors, whichinclude agriculture, small scale industries,education and advances towards weakersections. Within this limit, banks have to carveout 18 per cent in the form of direct finance
to agriculture and set aside10 per cent infavour of weaker sections (Mohan 2004). In2008, the Government of India introducedAgriculture Debt Waiver and Debt Reliefschemes and waived farm loans amounting to` 65,000 crore (Mahajan: 2010). Such lendingdone under the poverty alleviation schemesleft little sustainable impact on the economiccondition of the beneficiaries. A large sectionof farm households borrow from informalsources, despite doubling of agricultural creditin recent years and the others wereconsequently excluded from the scheme'spurview. Although these steps have helped tobring rural masses to institutional creditsystem, vast majority of the rural householdsstill have to bring in the financial systems.
Table 2 : Status of Financial Inclusion
* Considerable gap between demand and supply.
* Majority of poor are excluded from financial services.
* Rural India accounts for just nine per cent of total deposits.
* Rural India accounts for just seven per cent of total credit.
* Rural India accounts for just 10 per cent of life insurance business.
* About 56 per cent of the poor still borrow from informal sources.
* Very negligible numbers have access to health insurance (0.4 per cent) and crop insurance(0.2 per cent).
* 70 per cent of the rural poor do not have a deposit account.
* 87 per cent have no access to credit from formal sources.
* High transaction costs and bankers feel that it is fraught with risks and uncertainties.
* Unfavourable policies like caps on interest rates which effectively limit the viability ofserving the poor.
* Lack of an appropriate legal vehicle.
* Limited access to equity market.
Data Source : Different issues of "The Journal of Indian Institute of Banking & Finance".

120 Kartick Das
Journal of Rural Development, Vol. 31, No. 1, January - March : 2012
Concerns
India is one of the fastest growingeconomies of the world, yet the poor state offinancial inclusion remains a stark reality forpolicymakers, putting a question mark on theobjective of inclusive growth (Gupta: 2011).The challenges of achieving more inclusivegrowth can be met by policies that encourageeasier and affordable access to financialservices (Thorat: 2008). The number of farmersborrowing from moneylenders has risen tolevels not seen since Independence, despitehaving amongst the world's largest networkof about 79,000 banking outlets. Access tosaving bank accounts is the very basic indicatorof financial inclusion but we have just 15 croresaving accounts for a population of 118 crore(Venkataramaraju and Ramesh: 2010). Themain reason for financial exclusion is lack of aregular or substantial income and that's whymost of the people with low income do notqualify for a loan. Most of the excludedhouseholds are not aware of the bankingproducts, which are beneficial for them.Getting money for their financial requirements
from a local moneylender is easier than gettinga loan from the bank. Most of the banks needcollateral and it is very difficult for a low incomeindividual to find collateral for a bank loan.Moreover, banks give more importance tomeeting their financial targets. So they focuson larger accounts. It is not profitable for banksto provide small loans and make a profit.
A large number of small loans areneeded to serve the poor, but formal money-lenders prefer dealing with large loans in orderto minimise transaction costs. Bankers alsotend to consider lending to low incomehouseholds a bad risk as it is very difficult forlow income individual households to findcollateral for a bank loan. Although muchprogress has been made, the problem has notbeen solved yet, and the overwhelmingmajority of people in the country, who areliving on less than $1.25 a day, especially inthe rural areas, continue to have no lendingaccess to formal sector finance due to theabsence of a lending product to serve theneeds of the very low income group.
Table 3 : Key Challenges to Access to Finance
* To minimise operational costs of micro-transactions.
* Moving from micro-credit to micro-finance such as savings, credits, insurance and moneytransfer.
* Reformations of RRBs.
* Awakening the cooperative structure in real sense of the term.
* Lack of financial services-savings, micro-insurance, micro-pensions, Remittances, micro-housing loans in rural areas.
* Low levels of grants to proper functioning of MFIs.
* Establishment of substantial banking infrastructure in rural areas.
* Ability to access loan funds at reasonably low rates of interest to low-income households.
* Appropriate financial services for different segments of the society.
* Bringing 60 per cent of the financial excluded population in the financial services.
* Capacity to provide backward linkages or create support structures for marketing.

Journal of Rural Development, Vol. 31, No. 1, January - March : 2012
Financial Inclusion - A Gateway to Sustainable Development for the Impoverished 121
Policy Intervention
Financial inclusion as defined by RBI isproviding banking services at affordable coststo low-income households or the unbanksegment who do not have any access to theformal banking system. Public commercialbanks captured nearly 70 per cent of themarket share in terms of credit and depositsand have a wide network of branches andtherefore, have greater responsibility towardsRBI's drive on financial inclusion. The RBIguidelines to banks show that 40 per cent oftheir total bank credit should be lent to thepriority sector and this mainly consists ofagriculture, small scale industries, retail tradeetc. It is to be noted that 60 per cent of thetotal workforce engaged in agriculturegenerates only 17 per cent of total GDP of thecountry. The Finance Minister in his budgetspeech in 2010 had advised banks to providebanking facilities to habitations having apopulation of over 2000 by March 2012(Economic Survey: 2011). The banks haveidentified about 73,000 such inhibitions forproviding banking facilities using appropriatetechnologies (Venkataramaraju and Ramesh:2010). A multi-media campaign,"Swabhimaan", has been launched to inform,educate and motivate people to open bankaccounts (Union Budget: 2011). A number ofpolicy initiatives have been taken by the RBI/Finance Ministry to make the banking systemmore responsive to the needs of the marketas well as to strengthen its role in makinggrowth more inclusive. Some of the measuresinitiated to widen the credit delivery include:
(i) permitting the use of bankingfacilitators/correspondents;
(ii) augmentation of credit flow to theagriculture and other priority sectors;
(iii) simplification of systems andprocedures;
(iv) information technology to address thelast mile problem; and
(v) providing greater operational flexibilityto the Regional Rural Banks (RRBs).
According to RBI, India has about 350million bank accounts. The actual number ofpeople with bank accounts is far lower sincemany households in the bigger cities may havemore than one bank account, but thousandsof villages in India do not even have a bankbranch. Around 60 per cent of the populationdo not have any types of formal bankingfacilities and out of the six lakh villages, only30,000 villages have bank branches. Despitewidespread expansion of the banking sectorafter nationalisation of banks in 1969 and 1980,a significant proportion of the households,especially in rural areas, are still outside thecoverage of the formal banking system. Thesehouseholds have been dependent up on theinformal credit sources for their credit needsand had few avenues for keeping their savings.It has been noticed that people without bankaccounts are often the most vulnerable andimpoverished. In order to increase financialinclusion in India, the RBI has been proddingbanks to launch 'no-frill accounts' - especially,savings accounts with zero balance, limitedwithdrawals every month and no overdraft. Yet,banks have not aggressively covered theunbanked.
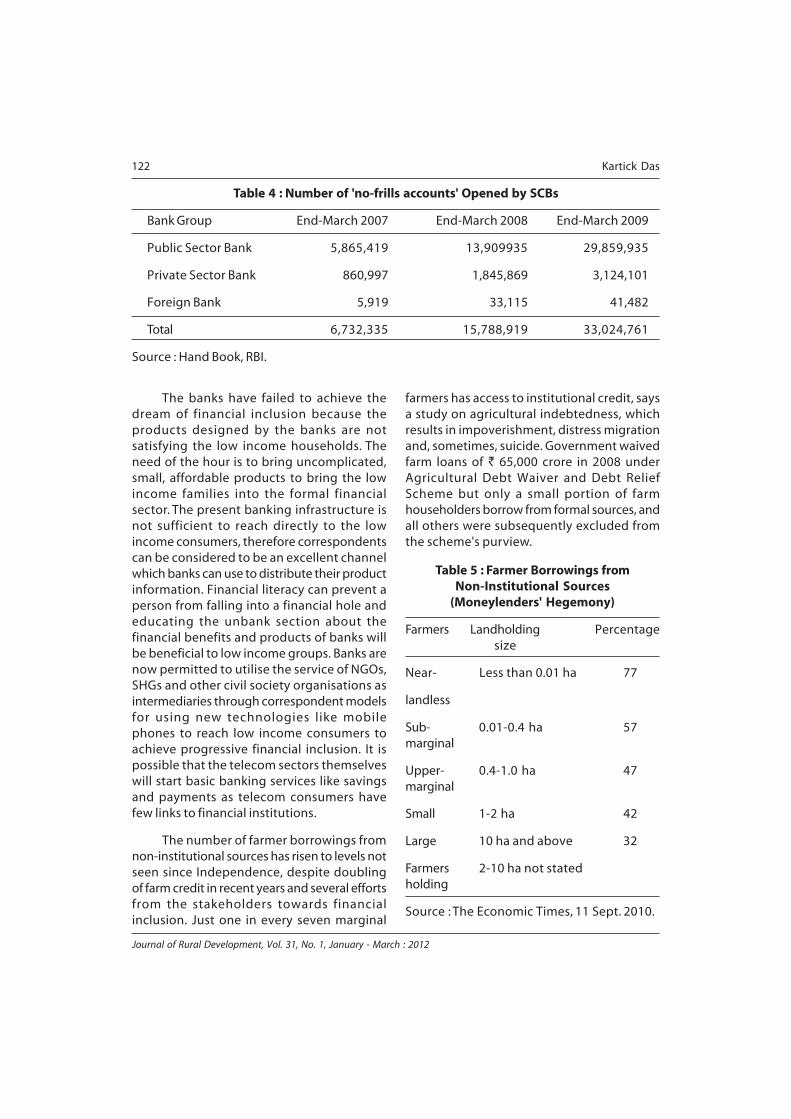
122 Kartick Das
Journal of Rural Development, Vol. 31, No. 1, January - March : 2012
Table 4 : Number of 'no-frills accounts' Opened by SCBs
Bank Group End-March 2007 End-March 2008 End-March 2009
Public Sector Bank 5,865,419 13,909935 29,859,935
Private Sector Bank 860,997 1,845,869 3,124,101
Foreign Bank 5,919 33,115 41,482
Total 6,732,335 15,788,919 33,024,761
Source : Hand Book, RBI.
The banks have failed to achieve thedream of financial inclusion because theproducts designed by the banks are notsatisfying the low income households. Theneed of the hour is to bring uncomplicated,small, affordable products to bring the lowincome families into the formal financialsector. The present banking infrastructure isnot sufficient to reach directly to the lowincome consumers, therefore correspondentscan be considered to be an excellent channelwhich banks can use to distribute their productinformation. Financial literacy can prevent aperson from falling into a financial hole andeducating the unbank section about thefinancial benefits and products of banks willbe beneficial to low income groups. Banks arenow permitted to utilise the service of NGOs,SHGs and other civil society organisations asintermediaries through correspondent modelsfor using new technologies like mobilephones to reach low income consumers toachieve progressive financial inclusion. It ispossible that the telecom sectors themselveswill start basic banking services like savingsand payments as telecom consumers havefew links to financial institutions.
The number of farmer borrowings fromnon-institutional sources has risen to levels notseen since Independence, despite doublingof farm credit in recent years and several effortsfrom the stakeholders towards financialinclusion. Just one in every seven marginal
farmers has access to institutional credit, saysa study on agricultural indebtedness, whichresults in impoverishment, distress migrationand, sometimes, suicide. Government waivedfarm loans of ` 65,000 crore in 2008 underAgricultural Debt Waiver and Debt ReliefScheme but only a small portion of farmhouseholders borrow from formal sources, andall others were subsequently excluded fromthe scheme's purview.
Table 5 : Farmer Borrowings fromNon-Institutional Sources
(Moneylenders' Hegemony)
Farmers Landholding Percentagesize
Near- Less than 0.01 ha 77
landless
Sub- 0.01-0.4 ha 57marginal
Upper- 0.4-1.0 ha 47marginal
Small 1-2 ha 42
Large 10 ha and above 32
Farmers 2-10 ha not statedholding
Source : The Economic Times, 11 Sept. 2010.

Journal of Rural Development, Vol. 31, No. 1, January - March : 2012
Financial Inclusion - A Gateway to Sustainable Development for the Impoverished 123
Table 6 : Farmers by Share of Landholdings
Farmers Landholding Percentagesize
Marginal Less than 1 ha 60.6
Small 1-99 ha 20.0
Semi-medium 2-4.99 ha 12.4
Medium 5-9.99 ha 5.9
Large 10 ha and above 1.1
Source : The Economic Times, 11 Sept. 2010.
PSU banks have a wide network ofbranches and account for nearly 70 per centof the market share in terms of credit anddeposits and therefore, initiatives by PSU bankscould impact RBI drive on financial inclusion.Banks were initially given a target of extending15 per cent of the total advances as directfinance to the agriculture sector to beachieved by March 1985. This target wassubsequently raised to 18 per cent to beachieved by March 1990. In terms of theguidelines issued by Reserve Bank of India inOctober 1993, both direct and indirectadvances for agriculture are taken togetherfor assessing the target of 18 per cent, withthe condition that for the purpose ofcomputing their performance in lending toagriculture and lending to indirect agricultureshould not exceed one-fourth of the totalagriculture lending target of 18 per cent ofnet bank credit so as to ensure that the focusof banks on direct lending to agriculture is notdiluted. However, all agricultural advancesunder the categories 'direct' and 'indirect' will
be reckoned in computing performance underthe overall priority sector target of 40 per centof the net bank credit. The public sector bankshave been formulating Special AgriculturalCredit Plans (SACP) since 1994-95 with a viewto achieving distinct and marked improvementin the flow of credit to agriculture. Under SACP,banks are required to fix self-set targets forachievement during the financial year. Thetargets fixed by banks show an increase ofabout 20 to 25 per cent over thedisbursements made in the previous year.
Micro-finance Movement
Micro-finance is defined as the provisionof thrift, credit and other financial services andproducts of very small amounts to the poor inrural, semi-urban or urban areas so as to enablethem to raise their income levels and improvetheir living standard (Joshi: 2006). Micro-finance refers to a movement that wants toprovide low-income households a wide rangeof financial services, including not just creditbut also savings, insurance and fund transfer.Foreseeing the need for structural change toincrease access to finance, Muhammad Yunuspopularised the concept of Micro-finance andtoday Grameen Bank of Bangladesh issuccessfully serving over 7.34 million peoplewith a recovery rate of 98.35 per cent (Yunus:2008). The Indian Micro Finance Institutions(MFIs) are among the fastest growing sectors(see Table-7) and most efficient in the worldtoday and will continue to develop into animportant delivery mechanism to reach out tothe poor and empowering women. The role ofMFIs is to enhance human capital and to evolvethe bankable clients to make povertyirrelevant.

124 Kartick Das
Journal of Rural Development, Vol. 31, No. 1, January - March : 2012
Table 7 : MFIs- on the Growth Path
Top seven MFIs Active Growth Return of Return onborrowers (%) assets (%) equity (%)
2009 (million)
SKS 5.75 139.4 5.0 21.6
Spandana Sphoorty Financial 3.66 56.8 9.0 55.7
Share Microfin 2.35 44.9 5.5 45.2
Bardhan 2.30 124.6 3.5 38.2
Asmitha 1.34 60.0 4.3 40.1
Basix 1.11 65.4 3.1 23.3
Ujjivan Financial Services 0.56 498.8 3.2 9.5
Growth is compounded annualised for five years.
MFIs arranged in decreasing order of active borrowers.
Source : Mix Market.
Micro-finance is under-nourished todayand the task is almost limitless - inclusion of60 per cent of India's population in thefinancial services and to provide finance toover 2.2 crore poor households that arefinancially excluded. The funds MFIs havetoday can take them to just 20 per centhouseholds and about 80 per cent of fundsare disbursed through profit oriented MFIsregistered with RBIs as Non-Banking FinancialCorporations (NBFCs), which are not allowedto use the banking system to lend loans. If thecentral bank considers the NBFC-MFI demandto allow them to function as businesscorrespondents for banks, they will directlycontribute to the financial inclusion in the strictsense of the term.
The first significant breakthrough infinancial inclusion came from an NGO(MYRADA) working in Karnataka, whichdeveloped the Self-Help Groups (SHG)methodology in 1992 to link rural populationto the formal financial system and now about
8.6 crore households have access to bankingthrough SHGs. The SHGs-bank linkageprogramme continued to be the main micro-finance model by which the formal bankingsystem reaches the micro-entrepreneurs.Since launching it as pilot project, it has provedits efficacy as a mainstream programme forbanking by the poor who mainly comprise themarginal farmers, landless labourers, artisansand craftsmen and others engaged in smallbusiness like hawking and vending in the ruralareas. The main advantages of the programmeare timely repayment of loans to banks,reduction in transaction costs both to the poorand the banks, doorstep saving and creditfacility for poor and exploitation of theuntapped business potential of the rural areas.
SHGs are playing a very active role in theprocess of financial inclusion and it is clearfrom the facts that there are 61 lakh savings-linked SHGs and 42 lakh credit-linked SHGs ason March 31, 2009 (Kapoor: 2010). The SHGmodel with bank lending to groups of women

Journal of Rural Development, Vol. 31, No. 1, January - March : 2012
Financial Inclusion - A Gateway to Sustainable Development for the Impoverished 125
without collateral has become an acceptedpart of rural finance. With traditionally loss-making rural banks shifting their portfolio awayfrom the rural poor in the post-reform period,SHG-based micro-finance have become animportant alternative to traditional lending interms of reaching the poor without incurringa fortune in operational costs. The RBI,NABARD, state governments and numerouscivil society organisations have recognised theSHG approach in their initiatives. In spite ofthe impressive figures, access to finance isgrossly inadequate in India to fill the gapbetween demand and supply but it holds thepromise to act as a great opportunity for thefinancial sector.
Suggestive Measures
Poverty is a crucial problem in alldeveloping countries in the present day world.It is felt that the problem of poverty can besolved through inclusive growth. Sustainablelivelihood opportunities can be provided tothe deprived sections by means of deposit,insurance, access to affordable credit and thepayment system. As we move to greater grossdomestic product (GDP) growth rates, thechallenge we face is to ensure that all of us,especially the most disadvantaged groupsbenefit from this economic growth.
* It is important that all the participativestakeholders like, RBI, NABARD, stategovernments, numerous civil societyorganisations and other developmentalagencies, need to work together intandem to drive the efforts towardsachieving total financial inclusion andhave to recognise the SHG approach intheir initiatives.
* The biggest challenge in financialinclusion is how to provide bankingservices in the hinterland and how tominimise high operational costsassociated with the low value large
volume transactions. The best way toaddress this challenge is by riding piggy-back on some existing technical andcommercial infrastructure. It is importantthat there are adequate road, rail, digitalconnectivity and adequate power andinfrastructure facilities which areimportant pre-requisites for operation ofbanking services.
* The commercial banks, as per RBIguidelines, are required to ensure that40 per cent of total credit is provided tothe priority sectors. The bank tries toachieve these targets indirectly insteadof trying to meet these targets on theirown. The government must not allowbanks to buy priority sector lending ofRRBs sponsored by them.
* The financial intermediaries are notuniformly geared up to include allhouseholds in the financial services.While the commercial banks have takensignificant initiatives in this direction,the RRBs and the cooperative banksneed to gear up their efforts in this area.
* Any regulatory framework for MFIs mustcheck corporate misgovernance andensure that micro-finance agencies donot indulge into predatory lending.Micro-finance can be attributed to theprinciple of solidarity lending, whichhappens through self-help groups,which lower the cost to a financialinstitution related to assessing,managing and collecting loans.
* The RBI should take steps to allow profit-oriented MFIs to be businesscorrespondents of banks for financialinclusion and this would enable theirclients to access insured deposits,national payments system andremittance services.

126 Kartick Das
Journal of Rural Development, Vol. 31, No. 1, January - March : 2012
* Our fiscal policies should continue tostrengthen the framework of Indianbanks. Pro-poor monetary and financialliberalisation policies should improveagriculture credit to small and marginalfarmers and also informal sector.Monetary policy should contain inflationparticularly food prices and also reducespread between lending and depositinterest rates.
* The Government has exuberantlyexpanded resources into 'flagshipschemes' and other expenditureprogrammes. The important thing todayis to shift focus from spending toobtaining a better return for theinvestment.
* For inclusive growth, private enterprisesshould develop customised and cost-effective products and services for low-income households. It is important thatsimple and flexible products andservices are provided at affordable costfor the people.
India has reaped the benefit ofeconomic reforms after the opening up of theeconomy in 1991, reflected in the fact thatthe economy of India is the eleventh largesteconomy by nominal GDP and the fourthlargest by purchasing power parity in the world.However, there is quite a distance to betravelled when it comes to reforms, in thefinancial sector. The financial sector reformsstarted in early 1990s to ensure financialinstitutions operate on the basis of flexibilityand autonomy with a view to ensuringefficiency, productivity and profitability. Overthe past two decades, there have beensignificant reforms, especially allowed FDI upto 26 per cent in insurance companies in 1999and 74 per cent in private sector banks. Thereis a broad view among economists,policymakers and financial sector players thatthe government should precede further to
reforms in the financial sector as now there isno resistance from left parties. The roadmapfor financial sector reforms has been definedby P.H. Patil, Percy Mistry and Raghuram Rajanin their report and this report needs to betabled in the Parliament and passed, otherwisethe intention of the Government will bequestioned. The key reforms which theGovernment ought to focus in coming daysneed a big push for financial sector reforms,the bill to increase maximum foreignshareholding in insurance companies, increasethe share of India's largest life insurer, LIC, andcreate a pension fund regulator and to reformarchaic banking laws, which has been pendingfor the last six years. At present, 26 per centFDI is allowed in the insurance sector. TheInsurance Bill, when enacted, would allowrising the FDI cap for the industry to 49 percent. However, it has been awaiting approvalsince 2008 as it was delayed by strongopposition from the left parties. Increase inFDI will have multiple benefits, which includesa boost to the insurance sector and willchannelise household savings into long-terminvestments.
Conclusion
India has been emerging as asuperpower against all odds. Despite therelative satisfactory performance in some ofthe macro-economic variables and spendingthousands of crores of rupees on subsidisingfoodgrain and other social welfareprogrammes aimed at improving the nation'ssocial indicators, India ranks 119 among 169nations in human development index (Miller2010). Financial inclusion is in the top priorityfor policymakers today to achieve inclusivegrowth and that cannot happen withoutensuring banking services at affordable coststo the weaker sections of society who do nothave any access to the formal financial system.Unless we are able to meet the credit needsof our people, we can never hope to grow in asustainable way. Despite multiple agencies

Journal of Rural Development, Vol. 31, No. 1, January - March : 2012
Financial Inclusion - A Gateway to Sustainable Development for the Impoverished 127
giving credit to the rural sector, the critical gapin rural credit still exists resulting in theexploitation of the rural masses by money-lenders. People without bank accounts areoften the most vulnerable and impoverished(Nath: 2010). Many studies have found that thelack of knowledge is important reason forfinancial exclusion. Credit counselling servicesin addition to financial literacy and financialeducation are being perceived as importanttools to enable people to overcome theproblem of indebtedness and seek re-accessto banking system ( Throat: 2008). Theknowledge, capital and technology to addressthese challenges is not fully aligned and used.In order to give financial education and reachthe maximum number of people in an efficientmanner, banks need to have credit counsellingcentre, robust risk management practices,technology, skilled manpower and very soundmarketing practices. All the key departmentsof the government and the regulators of the
concerned sectors should make a collaborativeeffort to attain the financial inclusion throughfinancial literacy so that we have a populationaware of the need to appropriately save, investand insure and also stay debt free.
To conclude, financial inclusion is a greatstep to alleviate poverty and to ensuring thatthe financial system plays its due role is oneof the biggest challenges facing the emergingeconomies like India. However, if allstakeholders realise that 'financial inclusion' isgood business ground in which the majorityof her people will decide the winners andlosers, then regulatory and policy frameworksthat promote accessibility and responsiblebanking can definitely lead to the desiredresults. With a more enabling environment, thenext few years promise to be exciting for thedelivery of financial services to attainsustainable development for theimpoverished.
References
1. Ahuja, R. (2010), "Art and Science of Development Practice", YOJANA, Vol. 54, February, pp. 41-46.
2. CIA - The World Fact Book - Rank Order - GDP Purchasing Power Parity, Available on https://www.cia.gov/library/publications/worldfactbook/rankorder/2001.
3. Dasgupta, R. (2005), "Micro Finance in India: Empirical Evidence, Alternate Models, and Policy Imperatives",Economic and Political Weekly, 40(12), March 19, pp. 1229-1237.
4. Dev, S. Mahendra (2007), "Inclusive Growth in India", New Delhi, Oxford University Press.
5. Editorial, The Economic Times, 14 November 2010.
6. Estimates of Birth Rates and Death Rates (2007), SRS Bulletin October 2007, Sample Registration System,Office of Registrar General, New Delhi.
7. Gupta, S. (2011), "BCs Mean Business for Banks", The Economic Times, Kolkata, 16 June.
8. Joshi, D.P. (2006), "Social Banking", Foundation Books Pvt. Ltd., New Delhi.
9. Kannan, K.P. (2007), "Interrogating Inclusive Growth : Some Reflection on Exclusionary Growth andProspects for Inclusive Development in India", V.B. Singh Memorial Lecture, 48th Annual Conference ofthe Indian Society of Labour Economics, Tiruchirapalli, 5-7 January.
10. Kapoor, R. (2010), "Frugal Innovations for Financial Inclusion", The Economic Times, Kolkata, 11 May.
11. Khan, M.Y. (2010), "A U-turn banking", The Economic Times, Kolkata, 1 October.

128 Kartick Das
Journal of Rural Development, Vol. 31, No. 1, January - March : 2012
12. King, Robert. G. and R. Levine (1993), "Finance and Growth : Schumpeter Might Be Right", The QuarterlyJournal of Economics, August, pp. 717-737.
13. Kodan, Anand et al (2010), "Scheduled Commercial Banks : Growth Trends", Yojana, Vol. 54, February, pp.47-50.
14. Levine, R. and S. Zervous (1998), "Stock Markets, Banks and Economic Growth", American Economic Review,Vol.88, pp. 537-558.
15. Mahajan, V. (2010), "MFIs as Engine of Inclusive Growth", The Economic Times, Kolkata, 28 June.
16. Mandira Sarma and Jesim Pais (2008), "Financial Inclusion and Development: A Cross Country Analysis",Preliminary Draft for Presentation at the Annual Conference of the Human Development and CapabilityAssociation, New Delhi, 10-13 September 2008.
17. Metha, S. (2010), "Frugal Innovations for Financial Inclusion", The Economic Times, Kolkata, 11 May.
18. Miller, S.V. (2010), "Inclusive Growth : The Missing Ingredient in Bihar's Success Story", The EconomicTimes, Sunday, 10 December.
19. Mohan R. (2004), "Financial Sector Reforms and Monetary Policy : The Indian Experience", RBI Bulletin,October.
20. Monaij, J. (ed., 2005), "The Politics of Economic Reforms in India", New Delhi, Sage Publications.
21. Nagayya, D. and Ch. B. Nageswara Rao (2010), "Micro Finance and Financial Inclusion", in J.U. Ahmed, D.Bhagat and G. Singaiah (eds.), Micro Finance in India - Issues and Challenges, DVS Publishers, Guwahati.
22. Peachy, S. and A. Roe (2004), "Access to Finance - What Does it Mean and How Do Savings Bank FosterAccess?" Brussels, World Savings Bank Institute.
23. Rajan, R.G. and L. Zingales (2003), "Saving Capitalism from Capitalists", Crown Business, New York.
24. Rao, C.H.H. and H. Linnemann (eds., 1996), "Economic Reforms and Poverty Alleviation in India", NewDelhi, Sage Publications.
25. Rangarajan, C (2008), "Report of the Committee on Financial Inclusion", Government of India, Report onCurrency and Finance, Annual, 2009.
26. Sainath, P. (2004), "The Feel Good Factor", Frontline, Vol. 21, No. 5, 12 March, pp. 28-35.
27. Throat, U. (2008), "Inclusive Growth - The Role of Banks in Emerging Economies", IndependenceCommemoration Lecture, Sri Lanka, Colombo, February, 28, 2008. Available on http://www.rbi.org.in/scripts/bs_viewspeeches.aspx.
28. Vasimalai, M.P. and K. Narender (2007), "Micro Finance for Poverty Reduction: The Kalanjiam Way -Experience of the Kalanjiam Community Banking Programme Promoted by DHAN Foundation", Economicand Political Weekly, 42(13), March 31, pp. 1190-1195.
29. Venkataramaraju, D. and Ramesh, S.V. (2010), "Financial Inclusion - Strategies and Regulations", Journal ofAccounting and Finance, Vol. 25, No. 1, October, pp. 105-114.
30. Yunus, M. (2008), Interview, Published in Yojana, January, pp. 7-9.

Book Reviews 129
Journal of Rural Development, Vol. 31, No. 1, January - March : 2012
Journal of Rural Development, Vol. 31, No. (1) pp. 129 - 138NIRD, Hyderabad.
BOOK REVIEWS
Towards Financial Inclusion in India,by K.G.Karmakar, G.D.Banerjee, N.P.Mohapatra,Publisher : SAGE Publications India Pvt. Ltd.,Pages : 575, Price : ` 995.
‘Towards Financial Inclusion in India’ isan analytical presentation of complex issuesinvolved with financial inclusion process andsocial re-engineering. This book contains allthe valuable information from authenticsources and helps in identifying theknowledge and practice gaps that requirefurther research and study to prescribeappropriate remedies in connection withfinancial inclusion.
It appears that this book is one of thebest reference books on defining on attaininghundred per cent Financial Inclusion, mappingdemand side requirements to attain theinclusion process, gauging the innovationsavailable in the supply side and forecastingthe challenges to be faced in the future.Needless to add, this book is a must for everymicro-finance practitioner who accesses thefactor responsible for inclusion process in ageographical region as well as vis-à-vis thesector as a whole. The richness of the booklies in its diversity of perspectives, sectorialcontents and breadth of issues covered as wellas the depth of analyses. It is a rare blendingof qualitative analysis with policy and actionrelevance inputs for the micro-finance sectorin toto.
The book started with defining FinancialInclusion process and ended with initiativesto face the challenges of the future in themicro-finance sector. In total, there are fourparts in the book containing 29 chapters in all,each part redefining an important aspect ofthe financial inclusion process. Some notablepoints from some parts are illustrated belowreflecting the richness of the book.
For example in Part I, entitled as ‘FinancialInclusion Analysed’, the authors have providedpractical suggestions for strengthening therural banking system which can be supportedin maximising its contribution to providingfinancial services to low-income clients.Similarly, in the last chapter of Part I on’Institutional Changes Required for FinancialInclusion’, the authors critically analysed therole of Regional Rural Banks and CooperativeCredit Institutions and stated that consequentto the amalgamation and reform process, theseinstitutions have lost touch with the originalobjective of promoting these institutions aslow-cost instruments of financial inclusion forthe rural people.
In Part II on ‘Mapping Demand SideRequirements’, the authors have aptlysuggested that small and marginal farmershave very little access to institutional creditand this needs to be addressed throughinterventions and processes of innovativeschemes. In the fourteenth Chapter on‘Inclusion Technique for Farmers’, the authorshave stated that there is a need to havealternative sources of income by the farmerslike dairy, animal husbandry, fisheries, poultryand so on, so that in case of natural calamitiesin one sector, income from other sources isavailable.
In Part III on ‘Supply Side Innovations,’the authors have stressed that supply of rawmaterials and marketing of products are majorproblems for micro and small enterprises.Hence, Joint Liability Groups can play a majorrole and should be provided with adequateworking capital to run the activities as per thelaid down procedures. Further, it has beenhighlighted that the main lesson fromformation of various groups and cooperativesfor capacity building of the poor, marginal and

130 Book Reviews
Journal of Rural Development, Vol. 31, No. 1, January - March : 2012
small farmers cannot be simply seen asextension of routine departmental activity butexperiences of already existed cooperativesshould be utilised for organising marginal andsmall farmers into groups through a dedicatedagency meant for their promotion andcapacity building.
In Part IV on ‘Challenges for the Future’,the authors stated that the administrativeissues and implementation issues arenecessary to be addressed if innovations areto be grounded at the grassroots level for thebenefit of the last mile client. The authorssuggested that this has to be achieved at theearliest because ‘Financial Inclusion is not anoption but a Compulsion’. In the twenty-ninthChapter on ‘Initiatives for Financial Inclusion:The Road Map’, the authors recommended thatnotwithstanding the regulatory, operationaland other aspects in focus, financial inclusionis a complex issue which cannot be solvedsingle-handedly by any stakeholder in thesystem. Formal financial institutions such asbanks, insurance companies, mutual funds,pension companies, and Central and stategovernments will have to join hands with smallservice providers to achieve total inclusion.
The book is a must reference for thosewho want to delve into the gamut of financialinclusion process as well as interested to knowthe status of various policy decisions taken bythe Reserve Bank of India and NABARD infacilitating the growth and achievement offinancial inclusion process in rural pockets ofIndia. The authors should be highly appreciatedas the book simplifies the most difficult andcontentious issues in a most comprehensivemanner and highlights the process in a mostfascinating manner.
Dr. B.K. Swain
Administration and DevelopmentPlanning in India, by V.Nath, ConceptPublishing Company Pvt. Ltd,New Delhi, 2011,PP-604, `1500.
The book is of enormous thematicrelevance to both policymakers andpractitioners, more so in the present contextwherein all efforts are made to reach the lastman in the last deciles with developmentalbenefits. The author expresses his anguish thatsomewhere down the line a host of knownreasons continue to hinder the desired impactand thus defeating the best of the universallyacknowledged strategies adopted both inplanning and implementation process. Thisvolume is a collection of one such practitionerbelonging to the prestigious administrativeservice and had the privilege of directlyassociating with organisation of economicplanning process, implementation ofdevelopment plans and role of administrationin these processes.
The book is divided into five sections. Thefirst section includes author’s association withUN institute of Training in Economic and SocialPlanning in the Middle East on administrativeaspects of planning-Theory and Practice. Also,the section includes organisation of planningin France, India, Soviet Union and Yugoslavia.
Section two on Administration andDevelopment Planning in India: Areas ofConcern has ten chapters which includesa) Administrative Reforms and creation ofsmall state 1947-2000; b) Area Development :Planning at District and Block levels; c) TheFunctioning and Duties of the Collector as aLeader; d) District Administration in Rajasthanin the 1960s : Reminiscences of a FormerCollector; e) Training of Officers of the IndianAdministrative Services; f ) Panchayati Raj-ThePromise and the Prospects; g)DecentralisedDistrict Planning under EconomicLiberalisation; h)The Role of TechnicalDepartments under Panchayati Raj; i) Regionsfor Planning and j) Changes in Political Culturebetween the 1950s and 1990s. Chapter Fivehas assumed great contemporary relevancein the light of the ongoing Telengana agitationand consequent demands for Statehood being

Book Reviews 131
Journal of Rural Development, Vol. 31, No. 1, January - March : 2012
expressed in many areas of the country. Theauthor points out, the issue of reorganisationof States dates back to the 1920s as the IndianNational Congress indicated its commitmentto the formation of linguistic States.
Looking at area developmentexperiences and practices followed duringthe community development era andimmediately thereafter, the book discussesboth the block and the district as to whichshould be the primary unit for planning, asalso which Is more appropriate as the unit forimplementation and suggests that such adiscussion should be taken separately for eachdevelopment programme or majorgovernmental activity.
Two chapters focus on the function andduties of the Collector and Collector’s role asa leader. The first was written in mid- 1960,while the second at the turn of the century in2000-2001. The changes in the role andfunction of the Collector due to theintroduction of Parliamentary Democracy andthe advent of statutory Panchayati Raj, theCollector’s relations with the state governmentand how the collector started functioning asthe District Development Officer coordinatingall development works in addition toperforming his other traditional duties, havebeen ably brought out.
The collector on district administrationin Rajasthan in the 1960s (Chapter-8) writtenin the form of reminiscences as a formercollector has discussed the functioning of thecollector in the context of Dr. Nath’s postingas collector, Sawai Madhopur between 1960and 1962.
One chapter discusses both theinduction level and in-service training ofofficers of the Indian Administrative Service.It suggests that after about 10 to 12 years ofservice, officers should be divided into thefollowing four streams based on each officer’saptitude, work experience and potential :(a) management and economic policy stream,
(b) agriculture, environment and ruraldevelopment stream, (c) social service stream,and (d) law and order stream. Once selectedfor each stream, officers should also beextensively trained accordingly both throughinstitutional training and work attachmentsand study tour within and outside the countryrelated to their particular stream.
The book is an excellent review onplanning and administrative changes whichwere brought about since Independence, anideal piece of work with a reflection of bothan academic and from practitioners’perspective too.
Dr. K. Jayalakshmi
Micro-finance and WomenEmpowerment, by B.Malleshwari, SerialPublications, New Delhi, 2010, 252 pages.
Micro-credit or micro-finance for thepoor and women has received extensiverecognition as a strategy for poverty alleviationand for economic empowerment of the poorin general and a woman in particular throughmechanism of SHGs. This book is an importantcontribution in this regard.
The book is based on the research studyconducted by the author on Micro FinanceProgramme and Women Empowerment inbackward regions of AP. It discussesmechanism of Micro Finance (MF) andevolution of SHG along with a critical analysisof differential impact of MF on target groupbeneficiaries and non-beneficiaries withregard to employment creation, incomegeneration and savings, and expenditurepattern and asset creations.
The book also discussed about theproblems of women beneficiaries (marketing,lack of remunerative price, inadequate loanamount deployed to them) and offeredsuggestions for the effective operation of SHGand their role in the economic empowermentof poor rural women through productive useof MF.

132 Book Reviews
Journal of Rural Development, Vol. 31, No. 1, January - March : 2012
The book is divided into 7 chapters. Firstchapter introduces discussion on MF/creditinstitutions and SHG and its impact on the issueof poverty alleviation. A brief review ofliterature on SHGs, MF etc. has also been done.Second chapter gives an overview of MF andits linkage to women empowerment and triesto link the relationship of MF as a strategy ofpoverty alleviation and economicempowerment of the poor and women. Withregard to women empowerment the chapteralso provides details of various programmesimplemented for the benefit of improvingwomen’s economic status such as IRDP,TRYSEM, SITRA, EAS, MSY APRLP, RashtriyaMahilakosh, Swavlamban, Swashakti etc. It alsodiscusses progress of MF in India and its growthin Andhra Pradesh where the study is based.
Third chapter gives the profile of thedistrict selected for the conduct of the studyalong with providing a scenario of SHGs,progress of SHG and SHG-bank linkage in theselected areas. The discussion highlights thatMF played crucial role in poverty alleviation inthe district and enlarging the coverage of un-reached under the banking fold. There are51998 total SHGs covering 571978 women.The SHG programme mainly attracted peoplein the age group of 26-40 yrs and there are279/302 bank branches that are participatingin SHG-bank linkage programme in theselected Chittoor district of the AP. Fourthchapter focuses on growth of SHGs in threeselected mandals and also gives details onsocio-economic features of sample womenrespondents (Total 450 women respondents.360 SHG members and beneficiaries and 90non-beneficiaries). It is found that moremembers in selected SHGs came from SC&BC.More number of beneficiaries and non-beneficiaries were in the age group of 26-45yrs- a right age to actively participate inincome-generating activities. More number ofbeneficiaries are from nuclear families. It isalso seen that many joined the SHG as theyare living under subsistence level and are
willing to improve their standard of living byparticipating in income generating activities.
Fifth chapter provides findings of theempirical study in different selected mandalsin different aspects. It is seen that in terms ofemployment generation, employment level ofthe beneficiaries has increased considerablyin comparison with the non-beneficiarieswhose employment level did not changemuch due to being associated with SHG.Similarly average household income ofbeneficiaries has also increased by above 20per cent. Average household expenditure hasalso improved post-SHG period for those linkedto SHGs. At the same time better saving habitsamong SHG members were also visible thatresulted in asset creation due to re-investmentof surplus derived from savings, therebyshowing their improved economic well-being/economic security.
Sixth chapter discusses about Self-helpGroup members’ repayment behaviour, theirperceptions and involvement in decision-making process. It is found by the author thatmost of the member beneficiaries repaid loanamount on monthly instalment basis.Repayment performance is high in cultivatorsin terms of occupation-wise and BC in termsof caste category.
Drought condition, seasonal markets,heavy family expenditure and spending onchildren’s education are seen as the importantreasons accounting for the poor repayment ofloan by the beneficiaries.
It is also noticed that womenbeneficiaries’ involvement in householddecisions over various issues increased/improved after their involvement in SHGs andthe same is not true for the non-beneficiaries.So the impact of SHG on decision-making ofthe sample beneficiaries was positive inrespect of decisions taken either by womenindividually or in consultation with herhusband.

Book Reviews 133
Journal of Rural Development, Vol. 31, No. 1, January - March : 2012
Since SHGs have improved their statusin household matters and also financially, anequal number of respondent beneficiariesexpressed their satisfaction with theimplementation of SHG but on the other hand,it is also seen that equal number of respondentwomen were not satisfied with the trainingimparted to them.
Seventh chapter provides summary offindings and conclusions of the empirical study.Besides, it also puts forward some suggestionsfor the effective role that SHG programme canplay in the economic empowerment andimprovement of the quality of life of the poor/low-income rural women.
Dr. Gyanmudra
Socio-economic Profile Of RuralIndia : Series-II; Volume Two; North-EastIndia, Edited by Prof. S C Patra and AshishVachani, IAS, Concept Publishing Company (P)Ltd. New Delhi, Pages 309, Price : `800.
Development is a multi-dimensionalphenomenon. Some of its major dimensionsinclude the level of economic growth, levelof education, level of health services, degreeof modernisation, status of women, level ofnutrition, quality of housing, distribution ofgoods and services, access to communicationetc. The progress of socio-economicdevelopment among all the states in India isnot uniform. This book examines the existingsocio-economic conditions of selected Statesof North East India development and therebyidentifying the indicators responsible for thediversity in development.
By using several indicators, the authorsderived good indices for broadly acceptedcomponents such as social, cultural, economiccondition, resource management, and heritagesystem of the people. The findings of theanalysis in the book support the generalperception about the North Eastern States inIndia that are marked with wide disparity insocio-economic development. The factors,
which are found out to be more important foroverall development process, relate to basicneeds like education, availability of food,minimum purchasing power, and facilities likedrinking water, health care infrastructure etc.
Sustainable Development is nothing butmanagement and conservation of naturalresource base along with the orientation oftechnological and institutional changes in sucha manner as to ensure the attainment andcontinued satisfaction of number of people’sneeds for present and future generation. Thepresent discourse of this book elaborates theneed for establishing the sustainabledevelopment process at the variousconsiderations – social, economic, political andenvironmental etc. particularly, the authorsviewed that Common Property Resources,which are by and large natural resources mustbe protected and enriched for overall growthof the selected States. Such efforts will notonly lead to optimum utilisation of resourcesbut also generate more employmentopportunities for the rural people.
In the introductory chapter, authorsbriefed about the overview on the entire northeastern region. The authors by covering variousaspects of conserving the natural resourcebase through the elements involved in thewhole gamut of those activities encompassthe role of an agronomist, irrigation engineer,a scientist, a cooperative expert, an economistand a social scientist.
This book throws light on the forest andagricultural resources in the four major Statesviz., Assam, Nagaland, Manipur and Tripura. Theproduction and destruction of resources arethe two extreme points and in between thesetwo the cultivation takes several forms in orderto serve tribal mankind. This publicationhighlights some of the natural resources andtheir systems in relation to a tribe who plays avital role in shaping and utilising different kindsof resources, as spatial linkages on economic,social and political grounds.

134 Book Reviews
Journal of Rural Development, Vol. 31, No. 1, January - March : 2012
There are four status papers covering thesaid states in the north east India, and stringed-up elaborately to discuss the basic conceptsof sustainability and the evolutionaryperspectives of sustainable development inthe selected states.
Overall, the history of forest dwellers,resources and approaches for ecosystem wereanalysed based on the problems anddistribution of forest type and its productsnecessitating the conservation of forest in thecontext of North East India. The portion of thebook explains the agricultural resources andprocess of land utilisation, agricultural holdingsand its situation, cropping pattern and productmarketing of both agro and agri-based productcycles. The authors stress the need forprevention of water resources by elaboratingthe existing status and problems in theirrigation systems and reservoirs too.
Obviously, this book presents brilliantideas for conservation and management ofresources and presenting analysis of thevarious elements involved in integrateddevelopment of resources and resourcesystems that the subject specialist, researcher,planner and policy maker will find this bookinteresting and useful.
Dr. R. Murugesan
Environment and Social Concerns,Edited by Venu Trivedi and VK Shrivastava,Concept Publishing Company Pvt. Ltd. NewDelhi – 110059, 2011.
Environment and issues associated withit are garnering tremendous amount ofattention in the recent past. The globalconcern for environment was emanated dueto destructive path of development processeswithout caring for future generations andgreed for present day development. As a result,the environment issues were totally neglectedleading to severe depletion of naturalresources causing alarm throughout the world.
However, the publication assumes greaterattention since it also deals with the socialconcerns while caring for the environment. Asthe social concerns do play vital role inensuring environment, the book devotedmuch on social concerns related toenvironment. In fact, the publication was anoutcome of Conference on “EnvironmentProblems and Initiatives” held at Indore in theyear 2007.
The book is a compilation of 22 paperspresented in the Conference spread over fivesections. The first section on Social Concernsconsists of four papers, the second section onDimensions of Environmental Problems 11papers, the third section on Techno-politicalResponses consists of 3 papers, the fourthsection was devoted to Focus on Indore Cityand Its Environment consists of 3 papers andthe last section on Public Image consists ofonly one paper. Thus, the bulk of the paperswere devoted to environmental concerns,perhaps due to the very prime issue ofenvironment. The book also consists of Englishversion of abstracts of 15 papers submitted inHindi and recommendations thereof.
The papers submitted on differentthemes were preceded by write-up by theauthors in the form of Introduction chapterdealing with various issues associated withenvironment and social concerns at nationaland global perspectives.
Though the four papers presented underthe section may not deal with wide gamut ofissues, yet the section provides a bird’s eyeview of importance of social issues inprotecting the environment.
To sum up, all the papers under thesection dealt micro-level issues that aredirectly related to causes of environmentalpollution. Most of the papers in the sectionwere good sources of micro-level issues butthey are not exhaustive in nature to capturethe comprehensive issues.

Book Reviews 135
Journal of Rural Development, Vol. 31, No. 1, January - March : 2012
The third section of the book wasdevoted to “Techno-Political Responses” inregard to controlling the environmentaldamage and effectiveness of differentcategory of measures.
The fourth section of the publication isdevoted to the issues related to Indore city.There were three papers under the section.
The lone paper under the last section on“Environment, Social Concern and Initiative :A Bird’s Eye View” by Saroj Yadav basically dealswith the components of environment care. Thepaper points out that emphasis on povertyalleviation, diffusion of information onenvironment awareness in the society is quiteessential.
The last section of the publicationconsists of gist of papers submitted during theConference.
In all , the publication provides anopportunity to understand the issues relatedto environment and social concerns. Thoughthe book has the issue of social concerns, mostof the papers published are mostly with theenvironment issues and emphasis on socialconcern was quite imbalanced. However, forthose who are interested in environmentconcerns, the book provides new insights.
Dr. G. Rajani Kanth
Participatory Monitoring andEvaluation, Edited by M.J.Chandre Gowda,Concept Publishing Company PVT LTD, NewDelhi, ` 500.
Monitoring and Evaluation (M & E) arethe two closely associated terms in any projectimplementation process. Participation isincreasingly being recognised as an integralpart of the M & E process, since it offers newways of assessing and learning from changethat are more inclusive and more responsiveto the needs and aspirations of those mostdirectly affected. Participatory Monitoring andEvaluation (PM& E) is geared towards not only
measuring the effectiveness of a project, butalso towards building ownership andempowering beneficiaries; buildingaccountability and transparency; and takingcorrective actions to improve performance andoutcomes. Participatory monitoring andevaluation enables the stakeholders to engagein M&E, exchange the contents, the processand the results to take up corrective actions iffound any deviations in the implementationprocess. The four principles of PM&E areParticipation, Negotiation, Learning andFlexibility which are very important forrealising the expected results of a project. Ifthe monitors and evaluators thoroughly knowabout these principles and process will helpto achieve the objectives of the projects. Theseelements are properly dealt in this book and itis very much useful for the beginners or firsttime readers on the topics of PM&E. This bookprovides a complete package for monitoringand evaluation, covering concepts, tools andmethods and case studies to demonstrate thepractising of monitoring and evaluation ineveryday scenario. The book is a detailedreference material of concepts, approachesand methods related to PME as well as impactassessment. More emphasis is given to ImpactAssessment in this publication for importancein understanding why programmes do notreach the people for whom theseprogrammes are meant and fail to achieve thechanges aimed at the planning and designingstage. It is also required to know thesignificance of the changes that havehappened amidst the quagmire developmentscenario projected in most situations.
The suggested tools are for bothqualitative i.e. to know ‘how and why’ of theproject implementation and quantitativemethods i.e. to know what, who, where, howmany, how much of a phenomenon, to testthe internal and external validity of theevaluation process. Participatory approacheslike Participatory Impact Monitoring andAssessment (PIMA) and Logical Framework

136 Book Reviews
Journal of Rural Development, Vol. 31, No. 1, January - March : 2012
Approach (LFA) have great value foracademicians, practitioners and administratorswhich are systematically dealt in this book.Step-by-step detailing of planning andimplementation of Farmers Field School (FFS)and Participatory Technology Development(PTD) is just the right reference material foragricultural development agencies,researchers and students.
The chapter “Monitoring, Evaluation andImpact Assessment” describes the concept ofevaluation in great detail. Enumeration of typesand stages of evaluation is followed by a briefclarification on levels and degrees ofevaluation. Chapter on ‘Participatory PovertyAssessment (PPA)’ delves at length on thewidespread anomalies in the poverty impactmeasurement methodologies and thesignificance of the new approach introducedby the World Bank, which uses bothquantitative and qualitative methods. Thechapter containing a case study on impactevaluation using participatory tools like matrixanalysis, time-line analysis and spider webdiagrams reiterates the simple yet tremendousutility of such tools for both ordinary audiencesand first-time evaluators.
The Participatory Impact Monitoring andAssessment (PIMA) elaborates the need foremphasising impact assessment and the sameto be done on a participatory basis. It also insiststhat, despite the increasing number andsophistication of management tools andmethodologies, monitoring the impacts ofdevelopment efforts continue to be a complexand neglected task. The possible reasons forsuch neglect, the operation definition of PIMA,its objectives, and clearly identifying theindicators for impact assessment, withappropriate examples, provide enoughsafeguards for a beginner. The differencebetween log frame and Logical FrameworkApproach and the details on the basicprinciples – a concise and a stand-alone logframe designed with the participation of
beneficiaries and its use in monitoring andevaluation – set the tone for furtherelaboration of the approach. The chapter onFarmers Field School (FFS), an establishedparticipatory method for effective learning,explains FFS as a non-formal and learner-centred educational process. The chapter ongrounded theory tries to score a point for theless-used, but highly potential theory-basedevaluation, particularly for the people involvedin programme implementation but areperplexed to know what is or is not workingand why. It not only distinguishes betweensubstantive and formal theories, but also tellsthe readers the way the grounded theorybenefits from both the theories. The bookprovides a complete package for monitoringand evaluation for the programmeimplementers who are perplexed to knowwhat is or is not working and why, theGrounded theory may show the way.
Dr. R.Chinnadurai
Economic Analysis of Institutions :A Practical Guide, by V. Santhakumar, SagePublishers, New Delhi.
The book claims to provide case studiesbased tool kit to help readers analyseinstitutional changes, reforms and efforts toimprove governance in India. The authorapplies the concepts of new institutionaleconomics to a number of real world problemsand public policy relevant derived from eightcase studies involving issues of environmentand natural resources, higher education,international migration, agricultural research,reformation of electricity and water supplyinstitutional framework, etc., for developingeconomies like India.
The first part of the book providessuccinct summary of the relevant theoreticalinsights of ‘New Institutional Economics’ whichwas popular in the nineties. The authorconcerned about the functioning of thevarious institutions based on practical
Book Reviews 137
Journal of Rural Development, Vol. 31, No. 1, January - March : 2012
experiences and as policy analysis andaddresses basics of institutions like their need,nature, rules and efficiency and inefficiency.The second part is the application of thesebasics to eight institutions as cases toemphasise that institutional economics meritsstrong base in public economics.
The chapter on self–financing collegesdeals with the whole gamut of issues fromquality of higher education, accessibility to thepoor students, use of public resources andgovernment intervention in terms of policyand resource allocation. The author feels thatgreater part of the problems in highereducation lies in the inability of thegovernment to sustain quality education andat the same time making it possible for poorstudents to have access to these institutions.
Decentralisation of services like drinkingwater has been the concern of both nationaland sub-national governments. The chapter onpublic water supply deals with desirability oftransferring the responsibility of water supplyto city governments though constitutionmandates it. After analysing the role ofdifferent actors, the author demarcates mostof the activities to city governments exceptwater-charge collection to private firms andplanning and design to state governments.
The chapter on the management offorests deals with the different aspects ofpublic ownership and its impact on society. InIndia, the institutional inability to enforce moreflexible rules encourages the adoption ofrestrictive practices.
The appropriateness of institutions,private or public, that support agriculturalresearch has been debated based on thehistorical experiences. While dealing withmarket failures of production research, publicinstitutions are set up and in turn they wereaffected by problems of ineffectiveness. Thisis addressed by bringing in citizen participation.However, in recent times private players are
interested in areas like bio-technology and therest of areas are left to public agencies only.
In the present situation of increasingglobalisation, it is bound to emerge issues ofemigration and immigration. The advantagesand disadvantages of emigration andimmigration depend on issues related to theinterest of governments and citizens. The basicconcern is for jobs in other countries whichmay constitute brain drain or earning moneyfor the country. Different instruments areevolved for regulating emigration andmigration depends on the situation. The authorfeels that there is an economic rationale fornot allowing many immigrants even thoughtheir entry can be beneficial for the citizensof the developed world.
Many regulatory commissions have beenin existence including in India, to deal withelectricity distribution and efficient recoveryof its costs. Despite regulators fixing tariffwhich are to meet the cost of production anddistribution, government intervention in thismatter based on social demand make theindependent regulation ineffective.
The basic issues of fisheries in India arerelated to fishing by traditional fishermen andmechanised trawlers. Excessive fishing inshallow or territorial waters lead to depletionin common resources which in turn ultimatelyaffects not only the traditional fishermenimmediately but also mechanised trawlers inthe long run. While traditional fishermen arguefor community rights for long term sustainableuse of commons and other section is againstregulations and cite the plight of theiremployees and their contribution to theeconomy. The author suggests for alternativeinstitutional framework which is to addresscontesting concerns and calls for approach ofcommunity based transferrable quota systemto address the problems of traditional fishery.
Recent times witnessed manyenvironmental movements in India for

138 Book Reviews
Journal of Rural Development, Vol. 31, No. 1, January - March : 2012
implementing regulation and policiesprescribed by the governments. Citizen actionagainst pollution in India, the author feels thatit may not resolve the problem in a sociallyefficient manner as court intervention in somecases may delay the solution and some maytake advantage in stopping the establishmentindustry which wants to establish pollutioncontrol systems.
These case studies make good readingfor understanding how institutions evolve and
function in the current times. The book wouldhave done better had it dealt with impact ofthese institutions on use of public goods byordinary citizens. However, the book is verymuch relevant in the context of raisingawareness among citizens, increasingassertiveness based on the rights of differentstakeholders and emphasising on privateinvestments and their role in operating publicresources.
Dr. V.Annamalai