Embed Size (px)
Citation preview
Field sales and markeing teams need to examine the root causes of why they struggle to accelerate business growth. In this e-book, we’ll examine the reasons why new selling dynamics intensify the lack of alignment between sales and markeing. Then we’ll discuss how a mobile sales enablement soluion can address and resolve these issues. With this informaion, ield sales and markeing teams can address common obstacles that keep them from working beter together.
www.showpad.com4 Drivers of Mobile Sales Enablement
4 DRIVERS OF
MOBILE SALES ENABLEMENT SUCCESS
Showpad is one of the most successful
tools that we have implemented in
years. It is very well adopted within
Aurora, very intensively used and
we get a lot of positive feedback from
sales reps and customers.
Simon Coombes, TechnologyDirector at Aurora Group
Align Marketing and Sales, Today!
Work Smarter, Close Deals Faster
Marketers struggle to create and distribute effective content to their sales team. They can’t ensure that the latest content is used and consistent messaging is delivered. On average, 90% of content that is created by marketers goes unused.
Sales reps struggle to quickly find the right content to use in their meetings and share with prospects. On average, sales reps spend only 22% of their time actually selling, wasting the rest of their time on follow-ups, administrative tasks and searching for or creating relevant content.
This disconnect between marketing and sales leads to great inefficiencies. Marketing wastes time creating unused content. Sales loses time trying to find effective content and gauge how to follow-up with prospects.
Showpad gives marketing control over content and messaging while providing the sales team with effective material to pres-ent and share with prospects.
The prospect’s interaction with content can then be tracked post meeting to help sales identify key customers and fol-low-up steps. Marketing can also track content performance, using insight to create more powerful content.
By streamlining the entire sales process, Showpad will enable your company to sell smarter and close deals, faster.
Showpad Benefits• Make sales more productive and
marketing more effective.• Consistent messaging and brand
representation.• Dynamic sales conversation.• Shorter sales cycles and larger
deals.• Decrease cost of sales and sales
training.• Accurate forecasting.
START YOUR FREE TRIALwww.showpad.com [email protected] @showpad
What They’re Saying
®
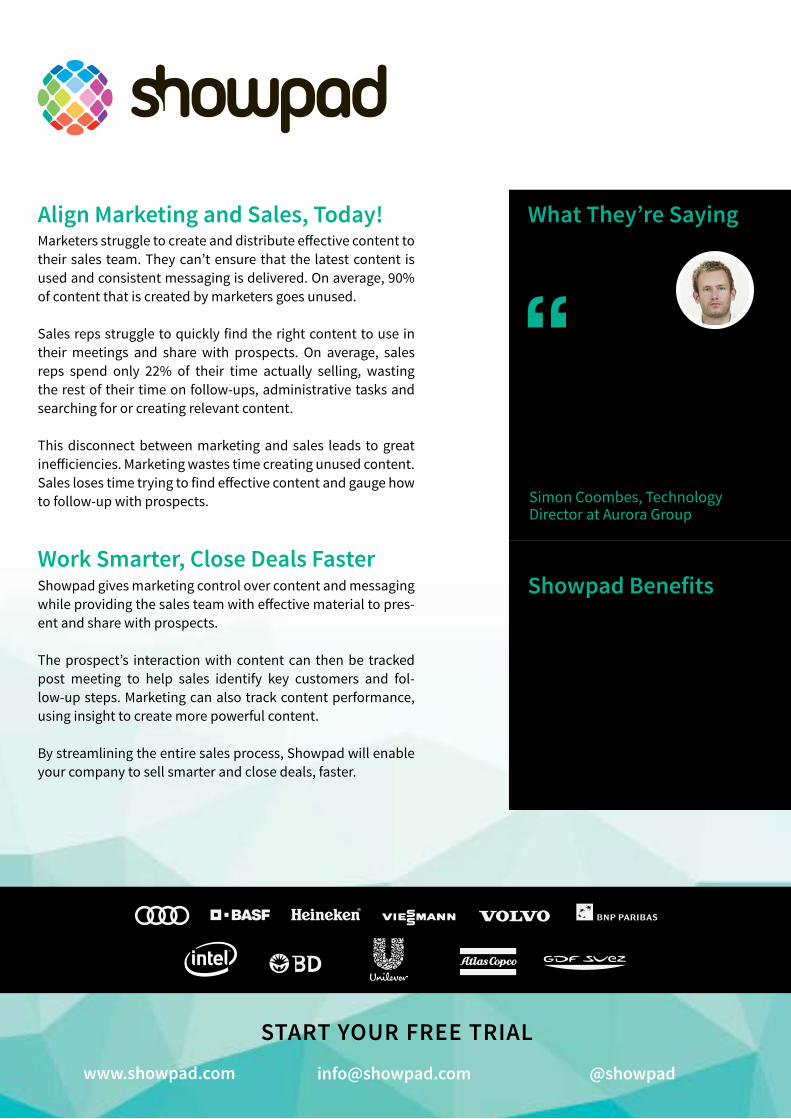
How Does it Work?
Showpad for Sales
Showpad for Marketing
Get Started Quickly and Accelerate Your Sales
In Showpad, marketing builds an organized, branded experience featuring the latest content. Sales can then easily access, present and share content with prospects anywhere, anytime, on any device. When the sales meeting is over, prospect’s interaction with the content is tracked, providing sales with actionable insights for next steps. Marketing can also track content performance, using insight to create more powerful content. By streamlining the entire sales process, Showpad will enable your company to close more deals, faster.
• Spend less time looking for the right content• Have more engaging/dynamic sales conversations that win deals• Access any type of sales collateral online or offline on any device• Close deals faster by seeing what prospects are doing with shared content• Provide accurate forecasts
• Unify messaging and communications• Make sure the sales team is always 100% equipped with the latest content• Get insights into how sales reps are using and customers are interacting with your selling materials• Optimize your sales content for better conversion based on knowing what works
It’s easy to get started with Showpad. Request your 14-day free trial today at www.showpad.com and discover how we will help your sales and marketing teams work better together.
START YOUR FREE TRIAL
Online Platform Apps on Any Device
www.showpad.com [email protected] @showpad
© 2014 Demand Metric Research Corporation in Partnership with Ascend2. All Rights Reserved.
Benchmark Report
The Metrics of Bad Sales Interactions:
Sponsored By:
TABLE OF CONTENTS
3
5
7
9
12
17
Introduction
Executive Summary
The Sales Process
Sales Performance
“Bad” Sales Meetings
Marketing Performance
27
29
30
Acknowledgements
About Demand Metric
Appendix – Survey Background
23
25
Turning the Tables
Analyst Bottom Line
28 About Showpad
INTRODUCTION
Sales and Marketing have long been convenient scapegoats for one another. When one fails to perform, the finger of blame is
often pointed at the other. Observers of the marketing and sales processes in any organization are usually quick to
determine that when there is failure to perform, rarely is just one of these entities wholly at fault. And yet the Blame
Game persists.
What isn’t disputed is that in B2B sales and marketing organizations, the individual sales representative is the focal
point of sales interactions with clients. When a field sales rep walks into a meeting with a client or prospect, the success of
that interaction rests of the shoulders of that sales rep. When the rep performs well, the chance for revenue increases. But when
the rep doesn’t perform well in a sales meeting, regardless of the reason, the chance for revenue is jeopardized.
In a study sponsored by Showpad, Demand Metric conducted a survey to explore the impact of a “bad” sales
interaction, whereby a “bad” interaction signifies a poor performing sales conversation that excludes a vendor from
consideration. The purpose of this study is not to treat sales reps as scapegoats, but to determine how sales opportunities are
affected by bad sales meetings, and hopefully gain insights about how to prevent bad meetings.
These insights can help the marketing and sales functions understand how to better collaborate to ensure the highest
possible incidence of sales meetings with favorable outcomes.
3
INTRODUCTION
To accomplish this goal, the study collected data in an attempt to understand the dynamics of a bad sales interaction:
What is the average close rate for a sales meeting on a qualified prospect?
How frequently do opportunities arise to sell products or services to a specific customer?
What are the leading reasons given for failure to close sales?
How often do bad sales meetings occur?
What is the impact of a bad sales interaction on a given opportunity?
On average, how long does it take to recover from a bad sales meeting?
When Marketing fails to perform, what are the reasons?
How effective are the assets that Marketing creates for Sales, and how frequently are they used?
How effectively do Marketing and Sales collaborate in the development of these assets?
These results provide insights and data for comparison, planning and improving the quality of sales interactions.
4
EXECUTIVE SUMMARY
The sample group for this study consisted of three, almost equal-sized groups identified by these roles: Executive
(President, CEO or owner), Marketing and Sales. This sample distribution provides an opportunity to do some useful
comparisons, which this report will present.
The analysis of this study’s data provides these key findings:
The median close rate for Sales when they engage with a qualified prospect is between 21 and 30 percent.
Price, a historical friction point between Management and Sales, was identified as the main reason that sales don’t close with
qualified prospects.
Failure of the sales team/rep to perform, the reasons for which this study summarizes in Figure 2, is the second most
frequently cited reason for failing to close sales with qualified prospects.
There is a significant disagreement between Sales and Marketing about the underlying reasons for the failure of the
sales team/rep to perform. Sales points to lack of marketing support as the primary reason. Marketing ranks lack of
empowerment to negotiate and lack of sales skill or ability almost equally as reasons.
Over 60% of participants in this study sometimes, often or always experience bad sales meetings.
5
EXECUTIVE SUMMARY
72% of sales and marketing professionals agree that there is an immediate loss of revenue after a bad sales meeting.
For 70% of organizations in this study, the recovery from a bad sales interaction can take from a few months to a few years.
The biggest predictor of bad sales meetings in this study was the failure of the marketing team to perform.
The lack of Sales and Marketing alignment is evident in the significantly different perspectives on the quality of assets
Marketing creates for Sales, and the degree of collaboration between these two functions.
This report details the results and insights from the analysis of the study data. For more detail on the survey participants, please
refer to the Appendix.
6
8%
14%
22%
16%
11%
8%
6%
10%
4%
0%
1%
0% 5% 10% 15% 20% 25%
I don't know
10% or less
11 to 20%
21 to 30%
31 to 40%
41 to 50%
51 to 60%
61 to 70%
71 to 80%
81 to 90%
Over 90%
Sales Closure Rate
THE SALES PROCESS
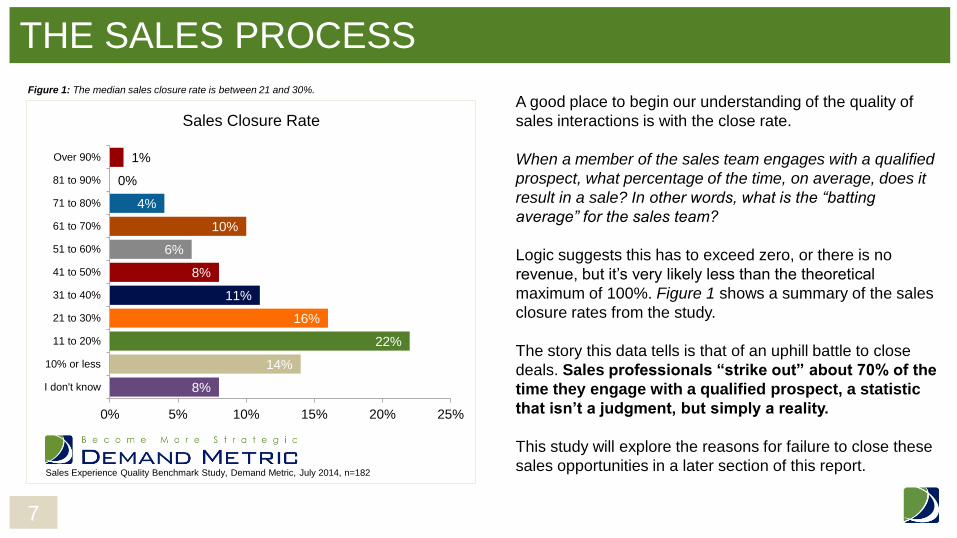
Figure 1: The median sales closure rate is between 21 and 30%.
Sales Experience Quality Benchmark Study, Demand Metric, July 2014, n=182
7
A good place to begin our understanding of the quality of
sales interactions is with the close rate.
When a member of the sales team engages with a qualified
prospect, what percentage of the time, on average, does it
result in a sale? In other words, what is the “batting
average” for the sales team?
Logic suggests this has to exceed zero, or there is no
revenue, but it’s very likely less than the theoretical
maximum of 100%. Figure 1 shows a summary of the sales
closure rates from the study.
The story this data tells is that of an uphill battle to close
deals. Sales professionals “strike out” about 70% of the
time they engage with a qualified prospect, a statistic
that isn’t a judgment, but simply a reality.
This study will explore the reasons for failure to close these
sales opportunities in a later section of this report.
THE SALES PROCESS
To get a more complete picture of the sales landscape, it is also helpful to understand how often the opportunity
presents itself for the sales team to sell products or services to a specific individual prospect. For some businesses, this
opportunity arises every day, and for others, the opportunities may come along only once every few years.
For B2B organizations, which tend to have solutions with longer sales cycles, may see the opportunity arise to sell to a specific
client only once every few years. In fact, over one-third of B2B organizations report that their sales opportunities with
individual prospects present themselves quarterly at best, and of this group, 15% say their opportunities arise yearly at
best.
Because their opportunities to sell are less frequent, these B2B organizations are highly motivated to make the most of every
opportunity.
The picture that this data paints of the average B2B sales team is of the opportunity to engage in a sales dialogue with
a specific prospect about twice a year, and perhaps closing one sale from these interactions. This picture provides
context for reviewing the other findings from this study.
8
9%
14%
15%
15%
18%
21%
31%
35%
60%
0% 20% 40% 60% 80%
Company reputation
Product or service availability
Product or service quality issues
Other reasons
Failure of marketing team to perform
Terms or conditions of doing business
Lack of compelling product/service
Failure of sales team to perform
Product or service price
Why Sales Isn't Closing with Qualified Prospects
SALES PERFORMANCE
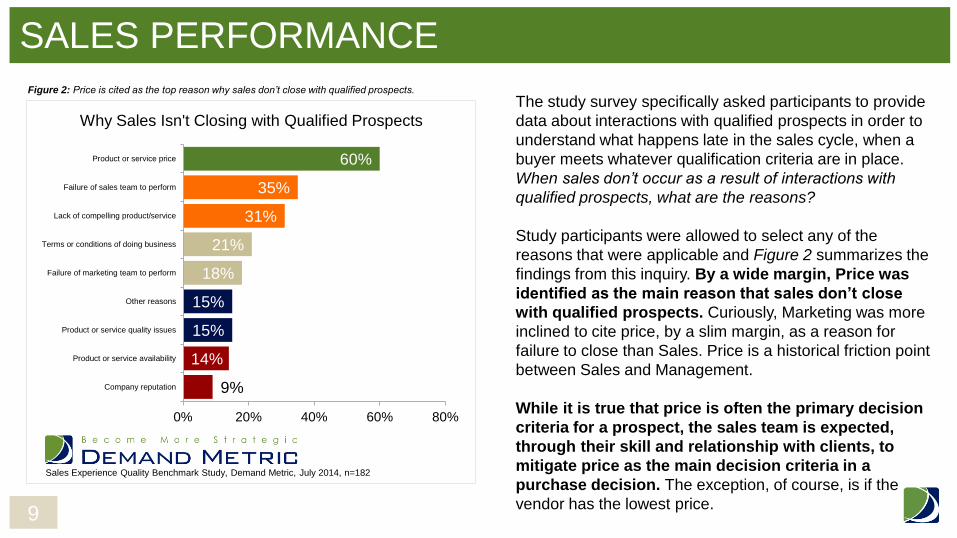
Figure 2: Price is cited as the top reason why sales don’t close with qualified prospects.
The study survey specifically asked participants to provide
data about interactions with qualified prospects in order to
understand what happens late in the sales cycle, when a
buyer meets whatever qualification criteria are in place.
When sales don’t occur as a result of interactions with
qualified prospects, what are the reasons?
Study participants were allowed to select any of the
reasons that were applicable and Figure 2 summarizes the
findings from this inquiry. By a wide margin, Price was
identified as the main reason that sales don’t close
with qualified prospects. Curiously, Marketing was more
inclined to cite price, by a slim margin, as a reason for
failure to close than Sales. Price is a historical friction point
between Sales and Management.
While it is true that price is often the primary decision
criteria for a prospect, the sales team is expected,
through their skill and relationship with clients, to
mitigate price as the main decision criteria in a
purchase decision. The exception, of course, is if the
vendor has the lowest price.
9
Sales Experience Quality Benchmark Study, Demand Metric, July 2014, n=182
SALES PERFORMANCE
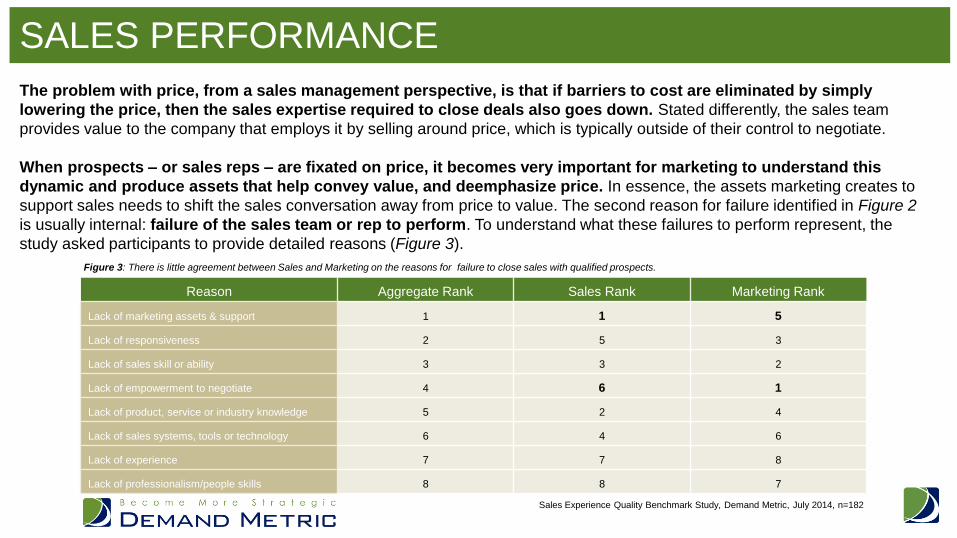
The problem with price, from a sales management perspective, is that if barriers to cost are eliminated by simply
lowering the price, then the sales expertise required to close deals also goes down. Stated differently, the sales team
provides value to the company that employs it by selling around price, which is typically outside of their control to negotiate.
When prospects – or sales reps – are fixated on price, it becomes very important for marketing to understand this
dynamic and produce assets that help convey value, and deemphasize price. In essence, the assets marketing creates to
support sales needs to shift the sales conversation away from price to value. The second reason for failure identified in Figure 2
is usually internal: failure of the sales team or rep to perform. To understand what these failures to perform represent, the
study asked participants to provide detailed reasons (Figure 3).
Reason Aggregate Rank Sales Rank Marketing Rank
Lack of marketing assets & support 1 1 5
Lack of responsiveness 2 5 3
Lack of sales skill or ability 3 3 2
Lack of empowerment to negotiate 4 6 1
Lack of product, service or industry knowledge 5 2 4
Lack of sales systems, tools or technology 6 4 6
Lack of experience 7 7 8
Lack of professionalism/people skills 8 8 7
Figure 3: There is little agreement between Sales and Marketing on the reasons for failure to close sales with qualified prospects.
Sales Experience Quality Benchmark Study, Demand Metric, July 2014, n=182
The schism between Marketing and Sales is on full display in this data. In this Blame Game, sales professionals cite the
lack of marketing assets and support as top reason they fail to close sales. This study did not explore more deeply to understand
whether this view is real or exaggerated. These rankings represent perceptions, and what we can conclude is that the sales
study participants place the blame for closing failure squarely on the shoulders of Marketing.
Marketing’s view of the top cause of failure – lack of empowerment to negotiate – doesn’t throw Sales under the bus
and is in fact sympathetic. But Marketing’s second-ranked reason is an indictment of Sales: lack of sales skill or ability.
In fact, these top two ranked reasons for failure were virtually tied in the rankings.
There was general agreement that lack of experience and lack of professionalism/people skills ranked low as reasons
for failing to close sales with qualified prospects. Study participants had the opportunity to enter explanatory text if they
selected the “Other reasons” response options, and here is a sampling of the reasons they provided:
“Lack of a better value proposition”
“Lack of knowledge on prospect organization”
“Other reason is lack of reputation or brand
or company”
11
SALES PERFORMANCE
“Product portfolio is too small”
“Prospect needs not aligned with our solution”
“New space/new product – not many companies
feel pain yet”
3%
29%
48%
12% 1% 7%
0%
20%
40%
60%
Never Rarely Sometimes Often Always I don't know
Frequency of Bad Sales Meetings
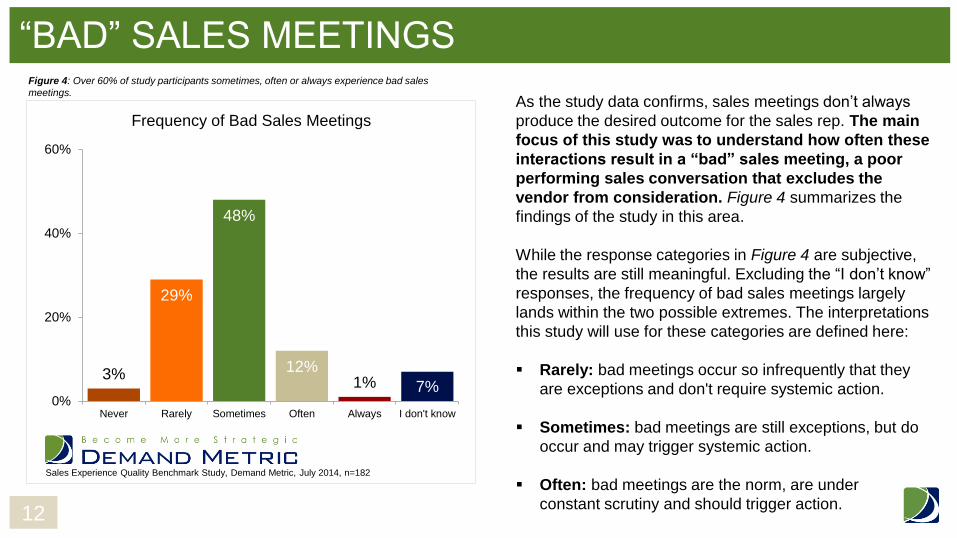
“BAD” SALES MEETINGS
As the study data confirms, sales meetings don’t always
produce the desired outcome for the sales rep. The main
focus of this study was to understand how often these
interactions result in a “bad” sales meeting, a poor
performing sales conversation that excludes the
vendor from consideration. Figure 4 summarizes the
findings of the study in this area.
While the response categories in Figure 4 are subjective,
the results are still meaningful. Excluding the “I don’t know”
responses, the frequency of bad sales meetings largely
lands within the two possible extremes. The interpretations
this study will use for these categories are defined here:
Rarely: bad meetings occur so infrequently that they
are exceptions and don't require systemic action.
Sometimes: bad meetings are still exceptions, but do
occur and may trigger systemic action.
Often: bad meetings are the norm, are under
constant scrutiny and should trigger action.
12
Sales Experience Quality Benchmark Study, Demand Metric, July 2014, n=182
Figure 4: Over 60% of study participants sometimes, often or always experience bad sales
meetings.
Further analysis of this data on the frequency of bad sales meetings confirms what should surprise no one: as the frequency of
bad meetings increases, the sales closure rate (Figure 1) drops. This relationship is intuitive, but is also confirmed as
statistically valid.
Other significant findings from analyzing the bad meeting frequency data in Figure 4 with the reasons for sales failures in Figure
2 revealed three statistically significant cause-and-effect relationships between the data:
The biggest predictor of a bad sales meeting is ”Failure of the marketing team to perform”.
As logic suggests, when “Failure of the sales team to perform” is the reason, the frequency of bad sales meetings increases.
When “Product or service quality issues” is the reason, the frequency of bad sales meetings increases.
Of these three relationships, the sales team is only in control of one them – their own performance. The other two
relationships to bad sales meetings, including the biggest one, are outside their control.
13
“BAD” SALES MEETINGS
26%
59%
9% 4%
2%
0%
20%
40%
60%
Sales cyclelengthens
Immediateopportunity lost
Future opportunitieslost until sponsor
leaves
All futureopportunities lost
Other impacts
Result of a Bad Sales Meeting
“BAD” SALES MEETINGS
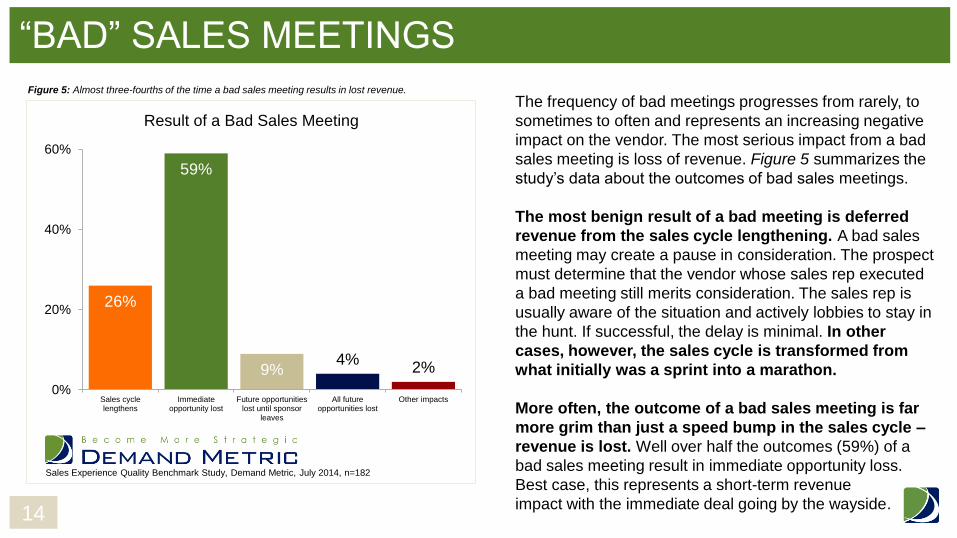
Figure 5: Almost three-fourths of the time a bad sales meeting results in lost revenue.
The frequency of bad meetings progresses from rarely, to
sometimes to often and represents an increasing negative
impact on the vendor. The most serious impact from a bad
sales meeting is loss of revenue. Figure 5 summarizes the
study’s data about the outcomes of bad sales meetings.
The most benign result of a bad meeting is deferred
revenue from the sales cycle lengthening. A bad sales
meeting may create a pause in consideration. The prospect
must determine that the vendor whose sales rep executed
a bad meeting still merits consideration. The sales rep is
usually aware of the situation and actively lobbies to stay in
the hunt. If successful, the delay is minimal. In other
cases, however, the sales cycle is transformed from
what initially was a sprint into a marathon.
More often, the outcome of a bad sales meeting is far
more grim than just a speed bump in the sales cycle –
revenue is lost. Well over half the outcomes (59%) of a
bad sales meeting result in immediate opportunity loss.
Best case, this represents a short-term revenue
impact with the immediate deal going by the wayside. 14
Sales Experience Quality Benchmark Study, Demand Metric, July 2014, n=182
“BAD” SALES MEETINGS
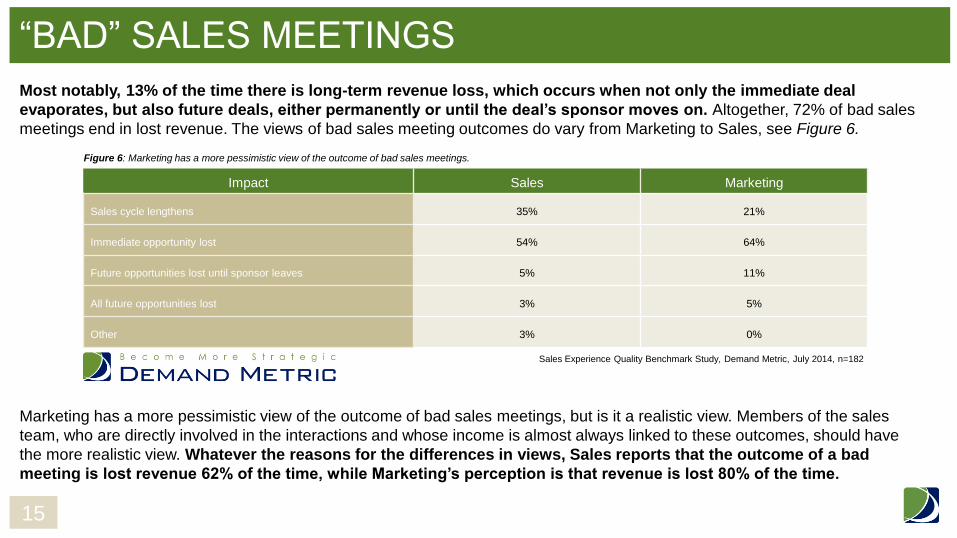
Most notably, 13% of the time there is long-term revenue loss, which occurs when not only the immediate deal
evaporates, but also future deals, either permanently or until the deal’s sponsor moves on. Altogether, 72% of bad sales
meetings end in lost revenue. The views of bad sales meeting outcomes do vary from Marketing to Sales, see Figure 6.
Marketing has a more pessimistic view of the outcome of bad sales meetings, but is it a realistic view. Members of the sales
team, who are directly involved in the interactions and whose income is almost always linked to these outcomes, should have
the more realistic view. Whatever the reasons for the differences in views, Sales reports that the outcome of a bad
meeting is lost revenue 62% of the time, while Marketing’s perception is that revenue is lost 80% of the time.
Impact Sales Marketing
Sales cycle lengthens 35% 21%
Immediate opportunity lost 54% 64%
Future opportunities lost until sponsor leaves 5% 11%
All future opportunities lost 3% 5%
Other 3% 0%
Figure 6: Marketing has a more pessimistic view of the outcome of bad sales meetings.
Sales Experience Quality Benchmark Study, Demand Metric, July 2014, n=182
15
10%
20%
52%
12%
6% 0%
20%
40%
60%
A few days A few weeks A few months A few years We can't recover
Bad Sales Meeting Recovery Interval
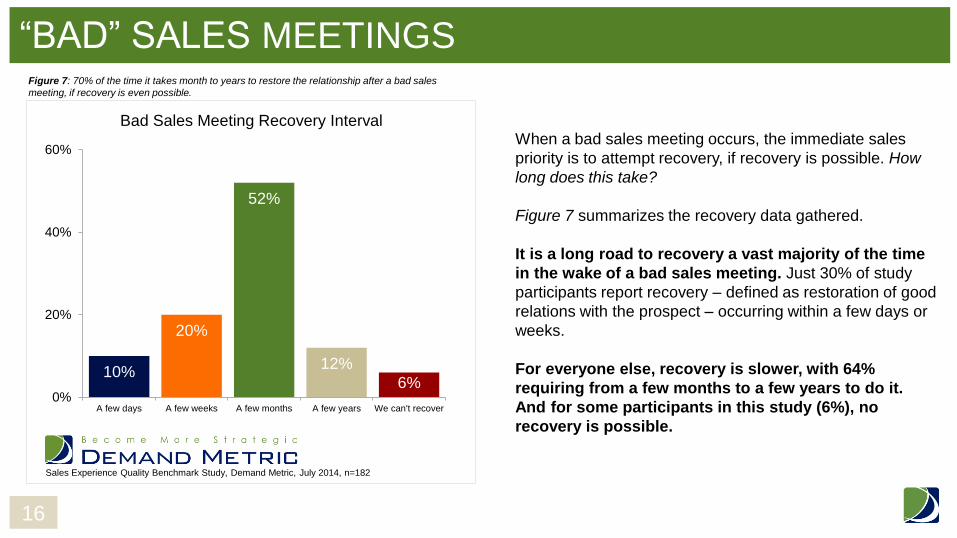
“BAD” SALES MEETINGS
When a bad sales meeting occurs, the immediate sales
priority is to attempt recovery, if recovery is possible. How
long does this take?
Figure 7 summarizes the recovery data gathered.
It is a long road to recovery a vast majority of the time
in the wake of a bad sales meeting. Just 30% of study
participants report recovery – defined as restoration of good
relations with the prospect – occurring within a few days or
weeks.
For everyone else, recovery is slower, with 64%
requiring from a few months to a few years to do it.
And for some participants in this study (6%), no
recovery is possible.
16
Sales Experience Quality Benchmark Study, Demand Metric, July 2014, n=182
Figure 7: 70% of the time it takes month to years to restore the relationship after a bad sales
meeting, if recovery is even possible.
MARKETING PERFORMANCE
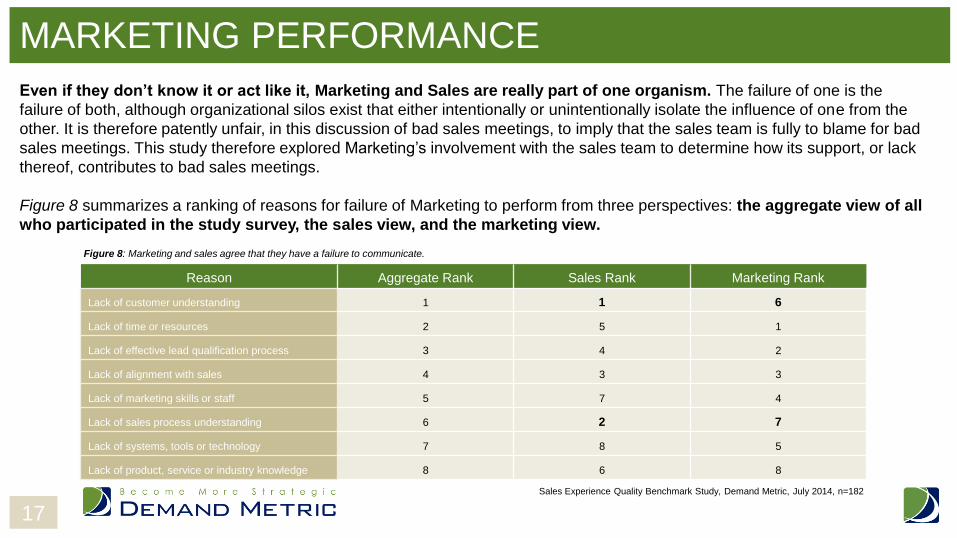
Even if they don’t know it or act like it, Marketing and Sales are really part of one organism. The failure of one is the
failure of both, although organizational silos exist that either intentionally or unintentionally isolate the influence of one from the
other. It is therefore patently unfair, in this discussion of bad sales meetings, to imply that the sales team is fully to blame for bad
sales meetings. This study therefore explored Marketing’s involvement with the sales team to determine how its support, or lack
thereof, contributes to bad sales meetings.
Figure 8 summarizes a ranking of reasons for failure of Marketing to perform from three perspectives: the aggregate view of all
who participated in the study survey, the sales view, and the marketing view.
Reason Aggregate Rank Sales Rank Marketing Rank
Lack of customer understanding 1 1 6
Lack of time or resources 2 5 1
Lack of effective lead qualification process 3 4 2
Lack of alignment with sales 4 3 3
Lack of marketing skills or staff 5 7 4
Lack of sales process understanding 6 2 7
Lack of systems, tools or technology 7 8 5
Lack of product, service or industry knowledge 8 6 8
Figure 8: Marketing and sales agree that they have a failure to communicate.
Sales Experience Quality Benchmark Study, Demand Metric, July 2014, n=182
17
MARKETING PERFORMANCE
Perhaps ironically, Sales and Marketing seem to agree that they have a failure to communicate or align. As a top three
reason cited by both roles, it should merit enough attention to eliminate or at least minimize it as a reason for Marketing’s failure.
What should trouble the CEO and leaders of both Marketing and Sales the most is the difference in rankings for two of the
reasons in this list: lack of customer understanding and lack of sales process understanding.
Sales professionals cite Marketing’s lack of customer understanding as the top reason why Marketing fails, but this
reason doesn’t make Marketing’s top five list. Marketing and Sales should absolutely share the same, detailed and accurate
understanding of the customer. Their inability to do so points to serious alignment issues and results in either marketing assets
that miss the mark, flawed sales strategies and tactics, or both.
In similar fashion, Marketing must understand the sales process intimately. If it doesn’t, it can only guess at which
kinds of assets might work well in support of sales’ efforts.
18
3%
43%
27%
19%
8% 9%
67%
9% 13% 2%
0%
20%
40%
60%
80%
Very effective Somewhateffective
Neutral Somewhatineffective
Very ineffective
Marketing Asset Effectiveness Views
Sales Marketing
MARKETING PERFORMANCE
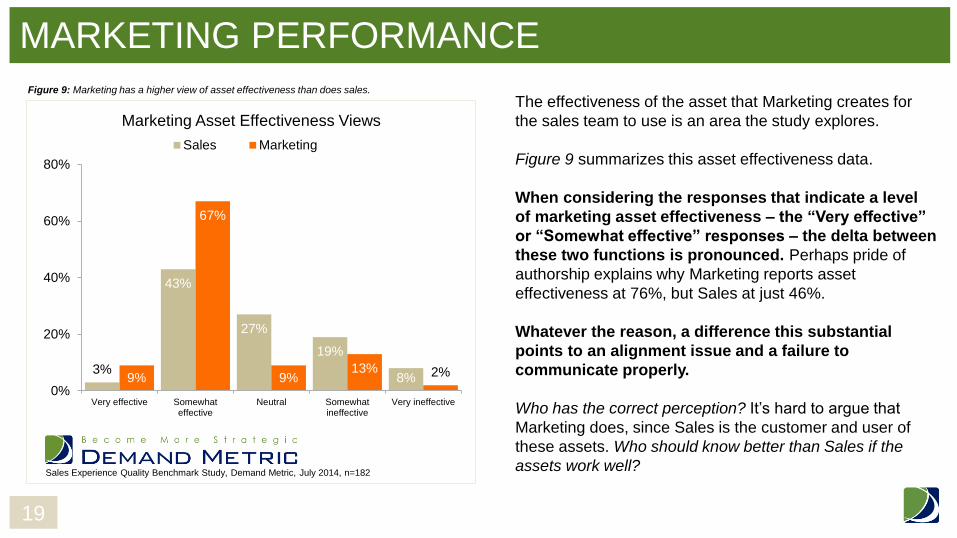
Figure 9: Marketing has a higher view of asset effectiveness than does sales.
The effectiveness of the asset that Marketing creates for
the sales team to use is an area the study explores.
Figure 9 summarizes this asset effectiveness data.
When considering the responses that indicate a level
of marketing asset effectiveness – the “Very effective”
or “Somewhat effective” responses – the delta between
these two functions is pronounced. Perhaps pride of
authorship explains why Marketing reports asset
effectiveness at 76%, but Sales at just 46%.
Whatever the reason, a difference this substantial
points to an alignment issue and a failure to
communicate properly.
Who has the correct perception? It’s hard to argue that
Marketing does, since Sales is the customer and user of
these assets. Who should know better than Sales if the
assets work well?
19
Sales Experience Quality Benchmark Study, Demand Metric, July 2014, n=182
20%
36%
28%
11%
5% 0%
10%
20%
30%
40%
Very frequently Somewhatfrequently
In between Somewhatinfrequently
Very infrequently
Frequency of Marketing Assets Usage
MARKETING PERFORMANCE
20
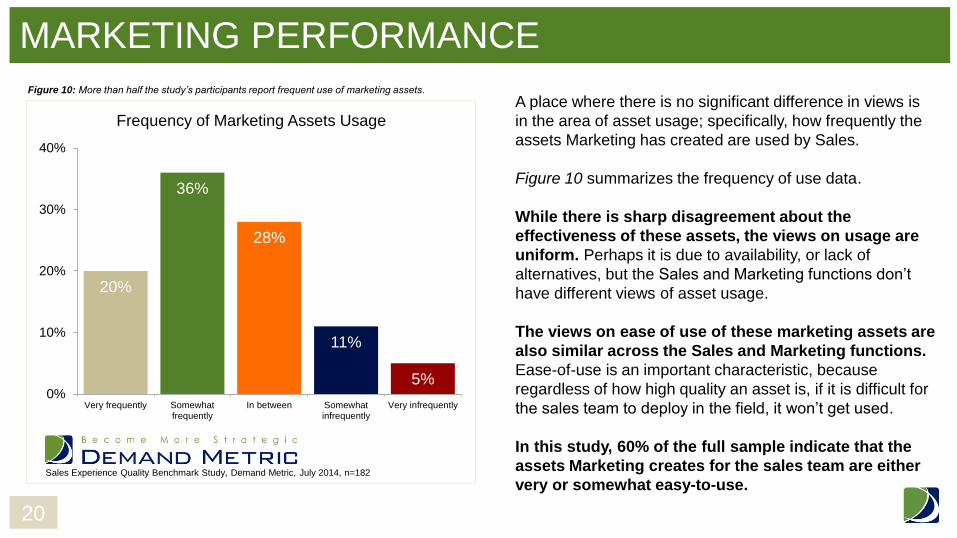
Figure 10: More than half the study’s participants report frequent use of marketing assets.
A place where there is no significant difference in views is
in the area of asset usage; specifically, how frequently the
assets Marketing has created are used by Sales.
Figure 10 summarizes the frequency of use data.
While there is sharp disagreement about the
effectiveness of these assets, the views on usage are
uniform. Perhaps it is due to availability, or lack of
alternatives, but the Sales and Marketing functions don’t
have different views of asset usage.
The views on ease of use of these marketing assets are
also similar across the Sales and Marketing functions.
Ease-of-use is an important characteristic, because
regardless of how high quality an asset is, if it is difficult for
the sales team to deploy in the field, it won’t get used.
In this study, 60% of the full sample indicate that the
assets Marketing creates for the sales team are either
very or somewhat easy-to-use.
Sales Experience Quality Benchmark Study, Demand Metric, July 2014, n=182
MARKETING PERFORMANCE
21
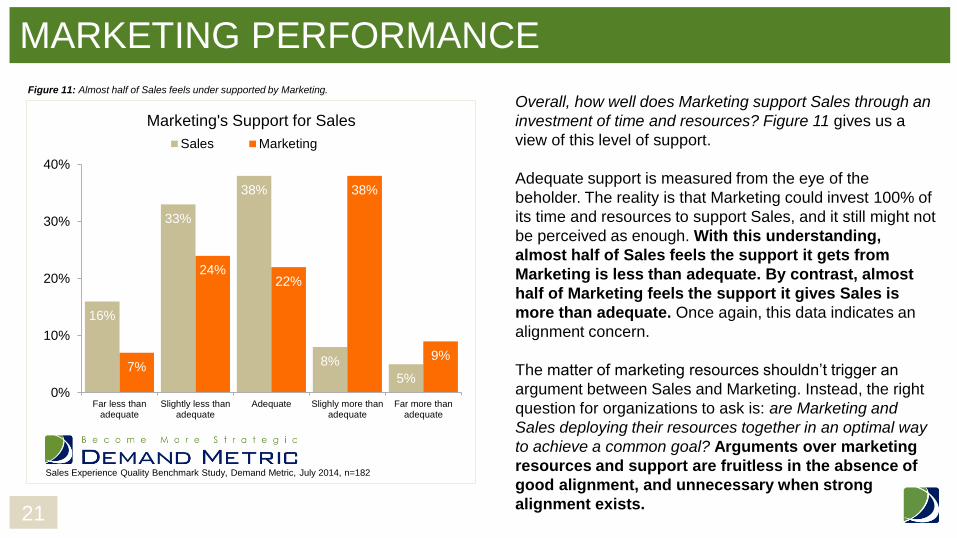
Figure 11: Almost half of Sales feels under supported by Marketing.
Overall, how well does Marketing support Sales through an
investment of time and resources? Figure 11 gives us a
view of this level of support.
Adequate support is measured from the eye of the
beholder. The reality is that Marketing could invest 100% of
its time and resources to support Sales, and it still might not
be perceived as enough. With this understanding,
almost half of Sales feels the support it gets from
Marketing is less than adequate. By contrast, almost
half of Marketing feels the support it gives Sales is
more than adequate. Once again, this data indicates an
alignment concern.
The matter of marketing resources shouldn’t trigger an
argument between Sales and Marketing. Instead, the right
question for organizations to ask is: are Marketing and
Sales deploying their resources together in an optimal way
to achieve a common goal? Arguments over marketing
resources and support are fruitless in the absence of
good alignment, and unnecessary when strong
alignment exists.
Sales Experience Quality Benchmark Study, Demand Metric, July 2014, n=182
16%
33%
38%
8%
5% 7%
24% 22%
38%
9%
0%
10%
20%
30%
40%
Far less thanadequate
Slightly less thanadequate
Adequate Slighly more thanadequate
Far more thanadequate
Marketing's Support for Sales
Sales Marketing
MARKETING PERFORMANCE
22
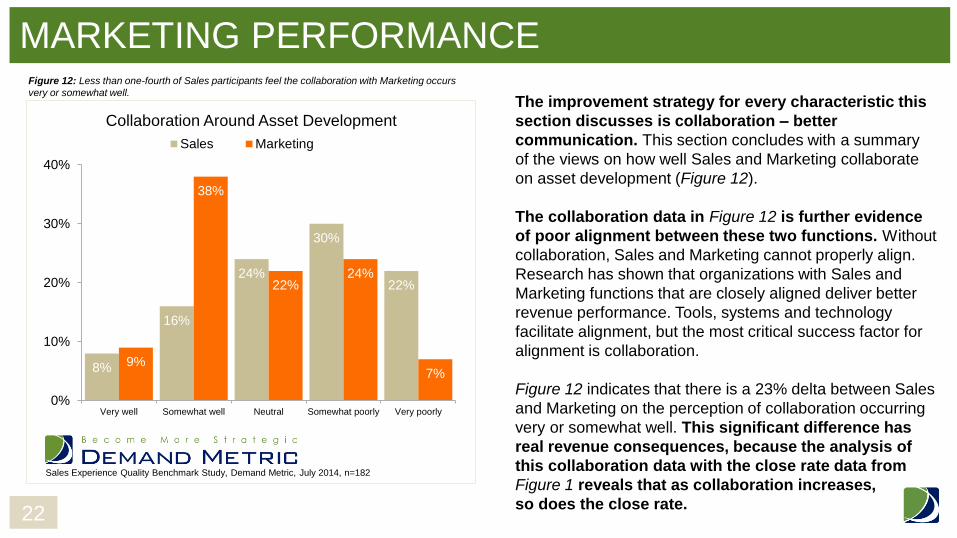
The improvement strategy for every characteristic this
section discusses is collaboration – better
communication. This section concludes with a summary
of the views on how well Sales and Marketing collaborate
on asset development (Figure 12).
The collaboration data in Figure 12 is further evidence
of poor alignment between these two functions. Without
collaboration, Sales and Marketing cannot properly align.
Research has shown that organizations with Sales and
Marketing functions that are closely aligned deliver better
revenue performance. Tools, systems and technology
facilitate alignment, but the most critical success factor for
alignment is collaboration.
Figure 12 indicates that there is a 23% delta between Sales
and Marketing on the perception of collaboration occurring
very or somewhat well. This significant difference has
real revenue consequences, because the analysis of
this collaboration data with the close rate data from
Figure 1 reveals that as collaboration increases,
so does the close rate.
Sales Experience Quality Benchmark Study, Demand Metric, July 2014, n=182
Figure 12: Less than one-fourth of Sales participants feel the collaboration with Marketing occurs
very or somewhat well.
8%
16%
24%
30%
22%
9%
38%
22% 24%
7%
0%
10%
20%
30%
40%
Very well Somewhat well Neutral Somewhat poorly Very poorly
Collaboration Around Asset Development
Sales Marketing
TURNING THE TABLES
23
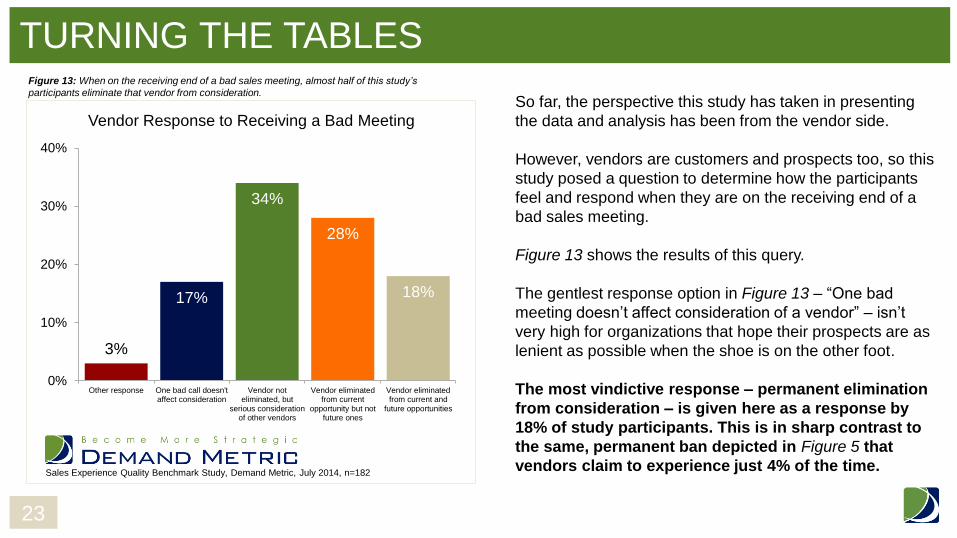
So far, the perspective this study has taken in presenting
the data and analysis has been from the vendor side.
However, vendors are customers and prospects too, so this
study posed a question to determine how the participants
feel and respond when they are on the receiving end of a
bad sales meeting.
Figure 13 shows the results of this query.
The gentlest response option in Figure 13 – “One bad
meeting doesn’t affect consideration of a vendor” – isn’t
very high for organizations that hope their prospects are as
lenient as possible when the shoe is on the other foot.
The most vindictive response – permanent elimination
from consideration – is given here as a response by
18% of study participants. This is in sharp contrast to
the same, permanent ban depicted in Figure 5 that
vendors claim to experience just 4% of the time. Sales Experience Quality Benchmark Study, Demand Metric, July 2014, n=182
Figure 13: When on the receiving end of a bad sales meeting, almost half of this study’s
participants eliminate that vendor from consideration.
3%
17%
34%
28%
18%
0%
10%
20%
30%
40%
Other response One bad call doesn'taffect consideration
Vendor noteliminated, but
serious considerationof other vendors
Vendor eliminatedfrom current
opportunity but notfuture ones
Vendor eliminatedfrom current and
future opportunities
Vendor Response to Receiving a Bad Meeting
TURNING THE TABLES
Further analysis of the data in Figure 13 revealed an interesting relationship with marketing asset ease of use data. The
participants in Figure 13 that selected the “One bad meeting doesn’t affect consideration” response option rated the
ease of use of their marketing assets lowest. Conversely, the participants that selected “Vendor eliminated from
current and future consideration” response option rated their marketing assets highest on ease of use.
What does this mean?
The answer to some degree is speculative because the study data didn’t explore this further, but here is a hypothesis:
perhaps difficult-to-use marketing assets influenced those who selected the lenient response. This relationship may
reflect some sympathy because of an understanding of how difficult-to-use assets impact sales meeting outcomes.
Conversely, perhaps easy-to-use marketing assets influenced those who selected the most vindictive response. With
easy-to-use marketing assets, perhaps the mentality is there is no excuse for executing a bad sales meeting.
24
ANALYST BOTTOM LINE
With very few exceptions, bad sales meetings are part of the scenery for most sales organizations. When they occur, almost
three-fourths of the time they result in an immediate loss of revenue.
A number of reasons exist for bad sales meetings, and this study has identified many of them. Business cultural norms tend to lay
the blame for a bad meeting at the feet of the sales rep. Failure to execute at some level is usually assumed, perhaps it is a lack of
people skills, negotiating ability, failure to memorize the elevator pitch or handling objections effectively. As this study has also
revealed, Marketing is quick to point to finger at Sales for failures on the front line. Sales is quick to point the finger of
blame right back at Marketing.
This Blame Game and bickering reveals a lack of alignment between two functions that should partner and share the same goals.
It also masks a rather unpleasant truth this study unearthed: the biggest predictor of a bad sales meeting is the failure of
the marketing team to perform.
The study reveals the seriousness of the alignment problem in a number of areas, perhaps most representative is the perception of
asset quality, depicted in Figure 7, where Marketing has the rosiest view of the quality of their work, and Sales the harshest view.
It’s unrealistic to think that vendors can totally vanquish poor performing sales conversations, but there is a remedy to help
minimize them. It begins with leadership of Sales AND Marketing that is intolerant of the Blame Game, and that insists on
alignment. Alignment is the result of several things – shared goals and systems, leadership, and a culture of collaboration.
25
ANALYST BOTTOM LINE
Intuition tells us, and the analysis of this study’s data confirms, that as collaboration between Sales and Marketing
increases, the sales close rate increases as well. This fact takes collaboration out of the realm of a “touchy-feely” characteristic
that is nice to have, and makes it an imperative. Organizations must make whatever technology investments or leadership
changes necessary to foster collaboration and achieve alignment.
The simple truth this study confirms is: the failure of Sales is also the failure of Marketing. Organizations whose Sales
and Marketing teams are allowed to maintain an “us” versus “them” mentality will never perform at their highest level.
26
ACKNOWLEDGEMENTS
Demand Metric is grateful to Showpad for sponsoring this benchmarking study and for those participants that took the time to
provide their input to it.
Demand Metric acknowledges the advice and assistance of Dr. Tom Brown, Noble Foundation Chair in Marketing Strategy and
Professor of Marketing in the Spears School of Business at Oklahoma State University, in facilitating and providing counsel on
the analysis of these survey results.
27
ABOUT SHOWPAD
Showpad is the leader in mobile sales enablement. The Showpad platform delivers contextual content to sales teams or channel
partners on any device so they can sell anytime and anywhere. Powerful reporting helps enterprise businesses understand
content usage and productivity to align sales and marketing efforts toward revenue goals while reducing content struggle.
Founded in Belgium, with U.S. headquarters in San Francisco, Showpad empowers marketing and sales teams at more than 500
top companies around the world, including Heineken, Audi, and Bayer Pharmaceuticals, to optimize customer opportunities and
increase sales.
For more information, visit www.showpad.com.
28
ABOUT DEMAND METRIC
Demand Metric is a marketing research and advisory firm serving a membership community of over 40,000 marketing
professionals and consultants in 75 countries.
Offering consulting methodologies, advisory services, and 500+ premium marketing tools and templates, Demand Metric
resources and expertise help the marketing community plan more efficiently and effectively, answer the difficult questions about
their work with authority and conviction and complete marketing projects more quickly and with greater confidence, boosting the
respect of the marketing team and making it easier to justify resources the team needs to succeed.
To learn more about Demand Metric, please visit: www.demandmetric.com.
29
APPENDIX – SURVEY BACKGROUND
30
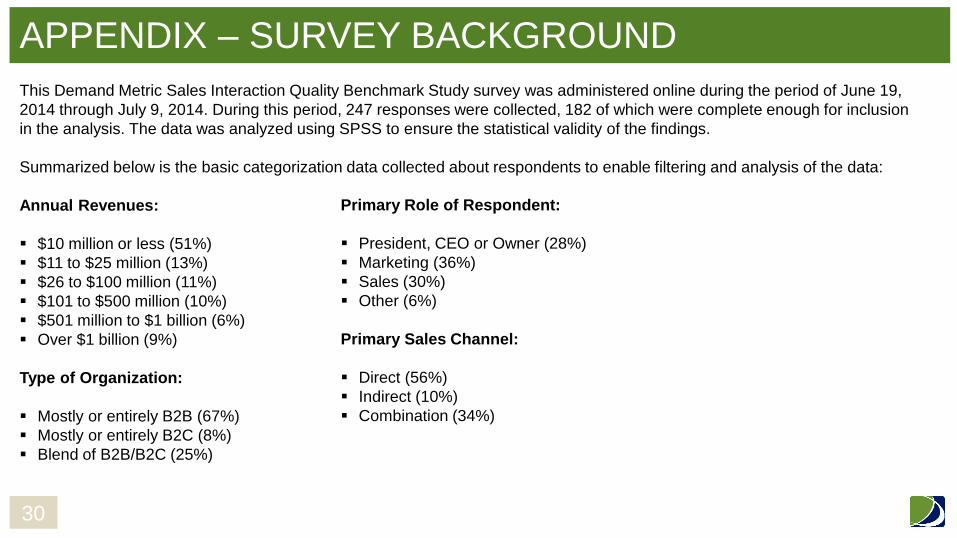
This Demand Metric Sales Interaction Quality Benchmark Study survey was administered online during the period of June 19,
2014 through July 9, 2014. During this period, 247 responses were collected, 182 of which were complete enough for inclusion
in the analysis. The data was analyzed using SPSS to ensure the statistical validity of the findings.
Summarized below is the basic categorization data collected about respondents to enable filtering and analysis of the data:
Annual Revenues:
$10 million or less (51%)
$11 to $25 million (13%)
$26 to $100 million (11%)
$101 to $500 million (10%)
$501 million to $1 billion (6%)
Over $1 billion (9%)
Type of Organization:
Mostly or entirely B2B (67%)
Mostly or entirely B2C (8%)
Blend of B2B/B2C (25%)
Primary Role of Respondent:
President, CEO or Owner (28%)
Marketing (36%)
Sales (30%)
Other (6%)
Primary Sales Channel:
Direct (56%)
Indirect (10%)
Combination (34%)

For more information, visit us at:
www.demandmetric.com
Demand Metric Research Corporation 562 Wellington Street
London, ON, Canada N6A 3R5
© 2013 Demand Metric Research Corporation. All Rights Reserved.
Benchmark Report
© 2014 Demand Metric Research Corporation in Partnership with Ascend2. All Rights Reserved.
Showpad. Sales made easy.
Case Study: Carl Zeiss Industrial
Metrology, LLC Ramps Distributor Sales
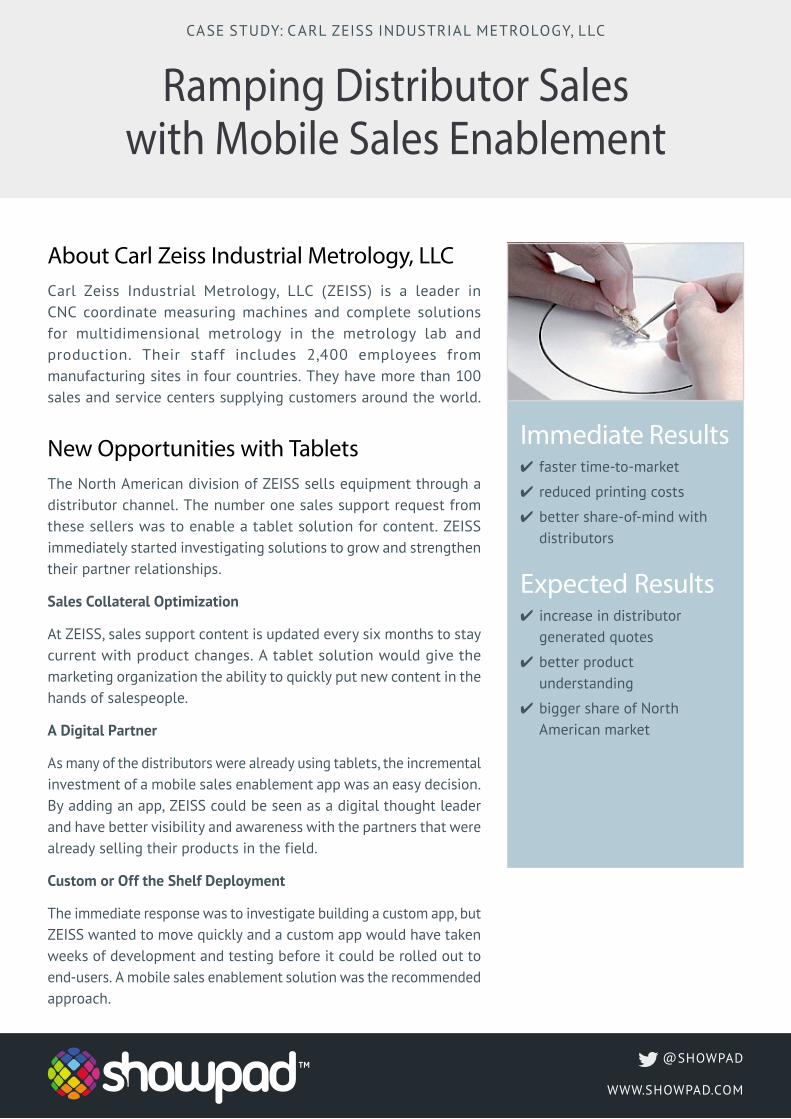
Ramping Distributor Sales with Mobile Sales Enablement
About Carl Zeiss Industrial Metrology, LLCCarl Zeiss Industrial Metrology, LLC (ZEISS) is a leader in CNC coordinate measuring machines and complete solutions for multidimensional metrology in the metrology lab and production. Their staff includes 2,400 employees from manufacturing sites in four countries. They have more than 100 sales and service centers supplying customers around the world.
New Opportunities with TabletsThe North American division of ZEISS sells equipment through a distributor channel. The number one sales support request from these sellers was to enable a tablet solution for content. ZEISS immediately started investigating solutions to grow and strengthen their partner relationships.
Sales Collateral Optimization
At ZEISS, sales support content is updated every six months to stay current with product changes. A tablet solution would give the marketing organization the ability to quickly put new content in the hands of salespeople.
A Digital Partner
As many of the distributors were already using tablets, the incremental investment of a mobile sales enablement app was an easy decision. By adding an app, ZEISS could be seen as a digital thought leader and have better visibility and awareness with the partners that were already selling their products in the field.
Custom or Off the Shelf Deployment
The immediate response was to investigate building a custom app, but ZEISS wanted to move quickly and a custom app would have taken weeks of development and testing before it could be rolled out to end-users. A mobile sales enablement solution was the recommended approach.
CASE STUDY: CARL ZEISS INDUSTRIAL METROLOGY, LLC
Immediate Results ✔ faster time-to-market
✔ reduced printing costs
✔ better share-of-mind with distributors
Expected Results ✔ increase in distributor generated quotes
✔ better product understanding
✔ bigger share of North American market
@SHOWPAD
WWW.SHOWPAD.COM
ResultsZEISS selected Showpad’s mobile sales enablement soluton for their North American distributors and achieved quick results.
Ease of Deployment
Showpad was rolled out quickly and positive, anecdotal feedback was received immediately from sellers. Most Showpad customers are fully deployed in three weeks and some as fast as one day.
Cost Reduction and Real-Time Content Delivery
Even when new product introductions caused 60% of existing collateral to change, ZEISS was able to reduce printing and shipping costs from the first deployment. But more importantly, they were able to provide material much faster and add unique content based on distributor requests.
ZEISS even added their installation guides and operator manuals to Showpad so that distributors could use the detailed product information to respond to more technical requests from their customers.
Permission Based Content
Some ZEISS distributors sell competitive products. The division and channel feature in Showpad allows them to deliver specific content based on pre-determined profile information. ZEISS can enable all of their distributors to be effective while being senstive to strategic advantages between their dealers.
Content Usage Analytics
Now ZEISS can review accurate reports on what content is being used —or ignored. Marketing can create content that enables successful sales conversations and eliminate unused material. They can align work that measurably helps their partners drive more sales quotes.
No Coding Necessary
By not having to develop and maintain their own custom app, ZEISS can focus on increasing their North American market share through enabled, efficient distributor selling, without impacting their internal IT organization.
In the first month after rolling out Showpad, I received a number of phone calls from regional sales managers telling me how great it was to have all of our material available and so well organized.”
John Lewis, Marketing Manager
Carl Zeiss Metrology, LLC
CASE STUDY: CARL ZEISS INDUSTRIAL METROLOGY, LLC
@SHOWPAD
WWW.SHOWPAD.COM

Showpad. Sales made easy.
Case Study: Electrabel GDF Suez Uses Showpad To Increase
Sales Efficiency by 25%
Setting up a Mobile Digital Office at Electrabel GDF SUEZ
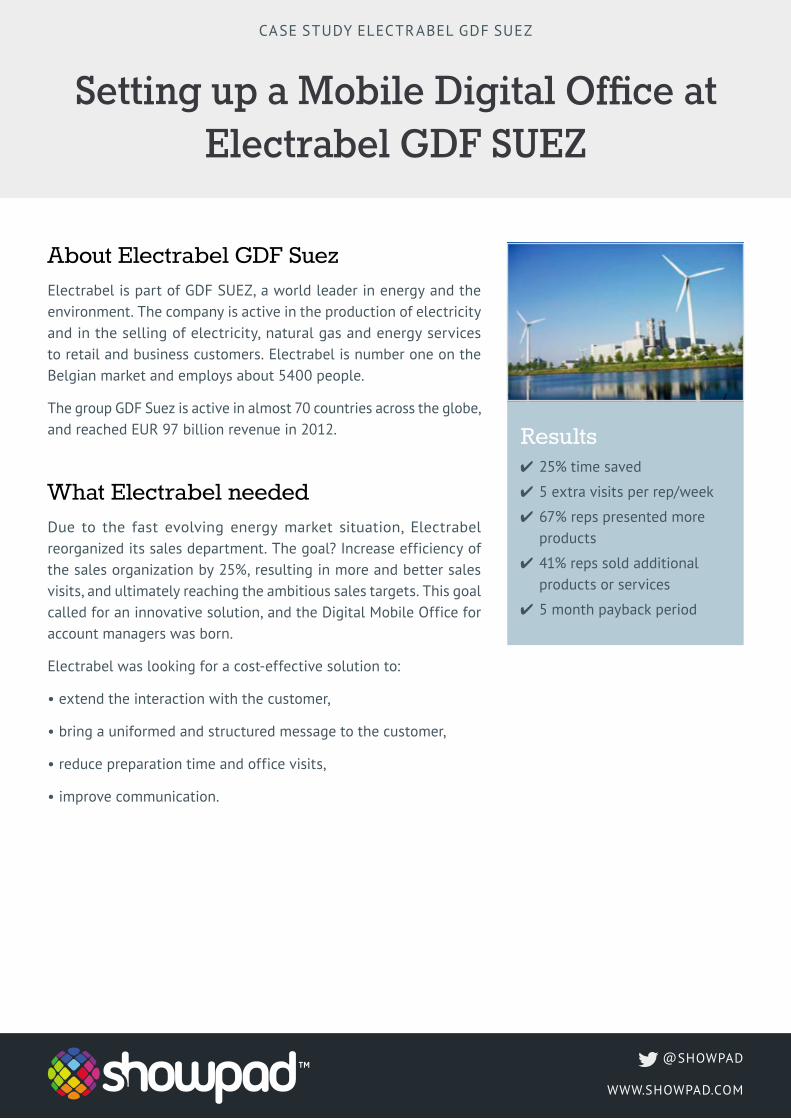
About Electrabel GDF SuezElectrabel is part of GDF SUEZ, a world leader in energy and the environment. The company is active in the production of electricity and in the selling of electricity, natural gas and energy services to retail and business customers. Electrabel is number one on the Belgian market and employs about 5400 people.
The group GDF Suez is active in almost 70 countries across the globe, and reached EUR 97 billion revenue in 2012.
What Electrabel neededDue to the fast evolving energy market situation, Electrabel reorganized its sales department. The goal? Increase efficiency of the sales organization by 25%, resulting in more and better sales visits, and ultimately reaching the ambitious sales targets. This goal called for an innovative solution, and the Digital Mobile Office for account managers was born.
Electrabel was looking for a cost-effective solution to:
•extend the interaction with the customer,
•bring a uniformed and structured message to the customer,
•reduce preparation time and office visits,
•improve communication.
CASE STUDY ELECTRABEL GDF SUEZ
Results ✔ 25% time saved
✔ 5 extra visits per rep/week
✔ 67% reps presented more products
✔ 41% reps sold additional products or services
✔ 5 month payback period
@SHOWPAD
WWW.SHOWPAD.COM
What Electrabel didElectrabel set up a program to use tablets with Showpad as the app to access their digital content library, centrally managed by marketing. This “develop once, use many times” approach helped to create coherence and maintain quality in the sales speeches the account managers deliver. New content is regularly pushed to the tablets by marketing, keeping all sales material up-to-date, everywhere.
For this innovative project, Electrabel gave a small, dedicated project team a mandate and a deadline; thereby creating a “start-up company” way of working that generated results fast.
The solution and project proved to be easy to copy, as other business lines share the challenge of creating a better presence in the field whilst keeping the budget under control.
Results and NumbersInternal efficiency:
• 25% time saved, resulting in 5 additional customer visits on average per account manager per week
• low startup fee - short 5 month payback period
• NPV (net present value) of EUR 4000 per account manager over 3 years
• 345kg less CO2 emissions per account manager each year
• 2300 sheets of paper printed less per account manager each year
Sales impact:
• 58% of the account managers report easier contract negotiations.
• 16% of contracts positively impacted
• 41% of the account managers report selling more additional products and services
• 13% of sales visits more successful
• 67% of the account managers present additional products and services than initially foreseen before the meeting
• 25% of sales visits conducted with additional products and services presented
Implementation is easy
and can be adapted to
each country or business
line. The solution can
re-use existing content,
which reduces costs and
increases time to market,
resulting in an overall
profitability.”
Hendrik Van Asbroeck
Manager Sales BeLux
CASE STUDY ELECTRABEL GDF SUEZ
@SHOWPAD
WWW.SHOWPAD.COM
Why Electrabel likes Showpad•Short time to market: Showpad is an app readily available on the
Internet, avoiding long and expensive in-house developments.
•Electrabel sales approach: the app can be customized and personalized in order to perfectly suit the specific sales approach of the account managers at Electrabel
•Flexible and transparant cost: the use of Showpad is based on a monthly fixed fee per user license, including all maintenance and upgrade costs, and providing full flexibility to increase or decrease the amount of users without loss on investments.
•“Develop once, use many times”: the marketing department creates and manages the content, and puts it at the disposal of the sales reps through their tablets. The content is locked for changes.
•Always up to date, everywhere: content updates are pushed to the tablets via mobile 3G or Wi-Fi connection, ensuring sales content is always up-to-date.
•The best sales speech in class: The Showpad online platform lets you monitor the usage of the sales content. This way, the marketing department can take targeted actions knowing what content is used and what isn’t. Account Managers can then be coached accordingly.
•Paperless customer visits: The digitalization of the printed sales brochures reduces Electrabel’s ecological footprint, facilitates distribution of the content and reduces printing costs.
CASE STUDY ELECTRABEL GDF SUEZ
@SHOWPAD
WWW.SHOWPAD.COM
www.showpad.com
Infraredx is a cardiovascular imaging company pioneering the personalized diagnosis of coronary artery disease. Infraredx sales reps deal with a very complex medical device sale, a sales process demanding the support of hard facts and scientific use cases. The company’s success relies on the accessibility of mass amounts of up-to-date content and succinct sales meetings.
COMPLEXITY VS. TIMEDue to the fast-paced and demanding nature of the medical industry, physicians’ schedules are very busy, giving the reps very limited time to meet with them. Senior Product Marketing Manager at Infraredx, Matthew Penzone, explains, “On average, medical device sales reps only have about five minutes to meet with physicians. The physicians have no time to formally meet, so if our sales reps aren’t prepared to pitch our solution to the physicians on the fly, there is no opportunity to sell.” O� en, these golden time slots were spent booting up computers or locating which pamphlet out of the hundreds to use. Infraredx sales reps were frequently losing sales opportunities due to a lack of time and organization.
In addition, as a player in such a complex and ever-changing industry, it’s essential for the company’s success that sales reps have access to the most up-to-date content. Lacking access to the most current content could be detrimental to the company’s adherence to regulatory requirements. It became clear to the Infraredx team that a solution for organized, easily accessible and up-to-date content was needed… and quick!
SHOWPAD: THE PERFECT SOLUTIONInfraredx found Showpad to be the perfect fit. Showpad enabled the marketing team at Infraredx to perform two pertinent tasks:
Case StudyInfraredx transforming its sales team by using Showpad
About• www.infraredx.com• Medical Devices• Cardiovascular Imaging
Goals• Provide the sales team with up-to-
date content in real time• Provide sales reps with all relevant
content for their short sales meetings• Provide sales reps with meaningful
insight to follow up with prospects post-meeting.
Approach• Mobile driven sales enablement
solution to provide sales reps with everything they need to sell smarter and close more deals faster.
Results• Marketing can provide sales reps with
up-to-date content in real time• Sales reps are prepared to present
relevant content within minutes• Sales reps can capture important
information during the short sales meeting
• Sales reps can track prospects’ interaction and follow up accordingly
medical device sales reps only have a few minutes to meet with
physiciansMatthew Penzone -Senior Product Marketing Manager at Infraredx
www.showpad.com
SHOWPAD: THE PERFECT SOLUTION (CONT.)1) Distribute up-to-date content to sales reps in real time.
2) Group content into specific folders, simplifying the sales rep’s job in locating important information in a timely manner.
With Showpad, sales reps no longer struggle to locate specific files beforehand and aren’t required to bring any additional collateral to their sales meeting. With Showpad, they are confident that all important collateral lies within the platform. With the marketing content in one centralized place, they are now able to pitch their product and its value in five minutes or less. Matthew Penzone further explained the benefits of easily accessible content, “As for closing deals, sales reps can now quickly access information in their sales meetings which is extremely helpful to use for rebuttal in competitive sales situations.”
TIME IS MONEYBy equipping sales reps with an organized platform that enables them to quickly locate up-to-date content, Infraredx succeeded in shortening their time spent preparing for meetings. This allowed for conversation flow and greater success in closing deals. With Showpad, the sales reps are shown as the experts in their industry knowing where to access information and answer the customer’s questions quickly.
OrganizationInfraredx
Date founded 1998
LocationBurlington, MA, United States
IndustryMedical Devices
Size51-200
sales reps can now quickly access information in their sales meetings which is extremely
helpful to use for rebuttal in competitive sales situations
Matthew Penzone -Senior Product Marketing Manager at Infraredx