Embed Size (px)
Citation preview
Upper Carson River Watershed Stream Corridor Assessment
June 2004 Page 73
4. Detailed Field Study Results White Paper One provided the framework for the second more detailed phase of fieldwork. This
included a detailed characterization of reference and priority restoration reaches. The purpose of the detailed priority reach characterization was to collect key geomorphic parameters at certain impacted and reference reaches that could be used to develop restoration alternatives and guide future restoration actions. This chapter discusses the methods, results, and interpretation of the hydrologic, hydraulic, and geomorphic data collected at each of the detailed study reaches listed in Section 3.3 of this report.
4.1 Methods and Data During the preliminary survey, the assessment team gathered data to provide a general
characterization of streams in the assessment area, such as channel type (Rosgen 1996). The preliminary assessment enabled the team to prioritize areas of the watershed for in-depth analysis, and to determine what additional information is required to make informed decisions about watershed management and restoration. Watershed analyses conducted in the detailed assessment fall into four categories: broad-scale watershed characteristics; historic information; existing detailed studies; and data collected as part of this study. These types of analysis are considered further in this section.
4.1.1 Broad Watershed Characteristics
General characteristics of the watershed that influence the stream channel’s form and function will be analyzed, primarily using existing data sets (hydrologic analysis in existing reports, soil surveys, etc.). Specific analyses included:
Landform characteristics—elevation, relief, general shape, orientation, general geology (rock
types, major faults) and general soil patterns (Schumm 1977; Garbrecht and Starks 1995). General climatic and precipitation patterns. Hydrology—stream flow patterns, such as magnitude and duration of base flow, magnitude
of spring snowmelt floods, and the frequency and magnitude of rain-on-snow floods (Dunne and Leopold 1978). Also, the general interaction between water and hill slopes was explored.
Recent geomorphic development and function. The influence of glacial moraines, outwash, and other glacial features on the current streams was analyzed. Also, cyclic climatic patterns over long time-spans (hundreds and thousands of years) were described. Their influence on sediment and water supply, and thus on-stream channels, was also explored (Benda 1990; Grant and Swanson 1995; Harris 1998).
General biology—broad vegetation, wildlife and fish communities were characterized. Also, their interaction with hydrologic processes and geomorphic development were examined.
4.1.2 Historic Analysis
The historic analysis had three basic objectives:
describe the form and function of the watershed prior to disturbance by humans; describe patterns of human development in the watershed; and, describe the effects of human disturbance on fluvial geomorphic processes, stream
morphology, and watershed ecosystems.

Upper Carson River Watershed Stream Corridor Assessment
June 2004 Page 74
This analysis, discussed in detail in Chapter 5 of this report, utilized information such as historic aerial photos, ground photos, written accounts of the watershed prior to extensive human development, and interviews with long-time local residents. Regional sources of information, such as published research on fire frequency were also reviewed.
4.1.2.1 Historic Ecosystem and Geomorphic Function
Basic physical and biological processes affecting the form and function of the watershed and fluvial geomorphology were emphasized. They included:
fire frequency and intensity; patterns of sediment supply to stream channels; flood frequency and effects on streams; historic plant and animal communities, including beavers, and their relationship to channel
form and function; and, manipulation of the environment by Native Americans
Results of these analyses are discussed in detail in Chapter 5 of this report.
4.1.2.2 Patterns of Human Development
Many types of human development have the potential to affect ecosystem or fluvial form and function. Intensive logging, for example, may change forest structure and increase sediment supply to streams, and the transport of logs by rafting in the streams can affect channel morphology and aquatic habitat. General historic patterns of human development in the watershed were analyzed for potential effects on the watershed, including mining, timber harvest, agriculture, and roads (Bowling and Lettenmaier 2001; Luce and Black 2001; Ryan and Grant 1991; Montgomery et. al. 1995; Likens and Borman 1974; Hawkins et. al. 1994). Results of these analyses are discussed in detail in Chapter 5 of this report.
4.1.2.3 Effects of Human Disturbance on Stream Morphology
In selected locations, where the preliminary survey suggests that human disturbance has had substantial impacts on stream or ecosystem function, a more site-specific analysis of changes over time was conducted. Sequences of aerial photos, dating back to 1940, were analyzed for the following areas:
Hope Valley; the middle reaches of Hot Springs Creek; the East Fork Carson from Hangman’s Bridge upstream to the Wolf Creek confluence; and, some portions of the upper watershed where human disturbance may have resulted in
increased sediment supply to stream channels. Analysis of the aerial photo sequences pointed out the type and location of changes in stream
morphology (plan form, in channel bar deposits). Coupled with information from other sources, such as the occurrence of large floods and patterns of human development, this analysis provided a clearer picture of how stream channels change over time, and the relative influence of human activities. Results of these analyses are discussed in detail in Chapter 5 of this report.

Upper Carson River Watershed Stream Corridor Assessment
June 2004 Page 75
4.1.3 Analysis of Existing Data
Throughout the preliminary assessment, the team gathered existing information on the watershed and its streams. Detailed data on water quality, fisheries, aquatic insects, habitat condition, hydrology, and other watershed issues is available from several sources, including the California Department of Fish and Game and the California Water Quality Control Board. Much of this information has been acquired, and was summarized. A substantial amount of work has already been done by other agencies on some issues, including stream flows in the West Fork and water quality on the East Fork.
4.1.4 Collection of Field Data
The focus of the field assessment in detailed study reaches was the collection of relevant geomorphic and channel geometry data. The goal was to assess changes in hydraulic conditions that ultimately manifest themselves in changes to sediment conditions, bank stability, and overall geomorphic function. Channel geometry and hydraulics are compared to either reference reaches assessed during the detailed study or published conditions described in the geomorphic and restoration literature.
4.1.4.1 Geomorphology and Aquatic Habitat Analysis
Detailed field assessments were conducted in selected reaches. These reaches included disturbed areas and reference areas. Collected geomorphic data included longitudinal profiles, cross sections, and pebble counts (Dunne and Leopold 1978; Wolman 1954; Church et al. 1987). Estimated bank full discharge was calculated, and substrate stability under bank full conditions was analyzed. Aquatic habitat analysis included pool frequency and quality, habitat complexity, and substrate characteristics (Flosi et al. 1998).
A longitudinal profile and four to six cross sections were measured at each study site. The length
of the longitudinal profile, the number of cross sections, and the distance between cross sections was dependent upon the overall scale and complexity of the channel features. Typically, an appropriate channel length to survey the measured elements should be 10 to 15 times the measured bankfull width (Dunne and Leopold 1978; Leopold et al. 1964; Flosi et al. 1998). The following information was derived from longitudinal profile measurements and cross section data:
bankfull width; bankfull depth; bankfull width to depth ratio; floodprone width (wetted width at two times the bankfull depth); pool-riffle spacing; and, average channel slope.
In some cases, bankfull indicators were not present at the cross section. In those locations,
geomorphic parameters were not calculated. Where there were inconsistencies in bankfull elevations between right and left bank measurements, the bankfull elevation was averaged.
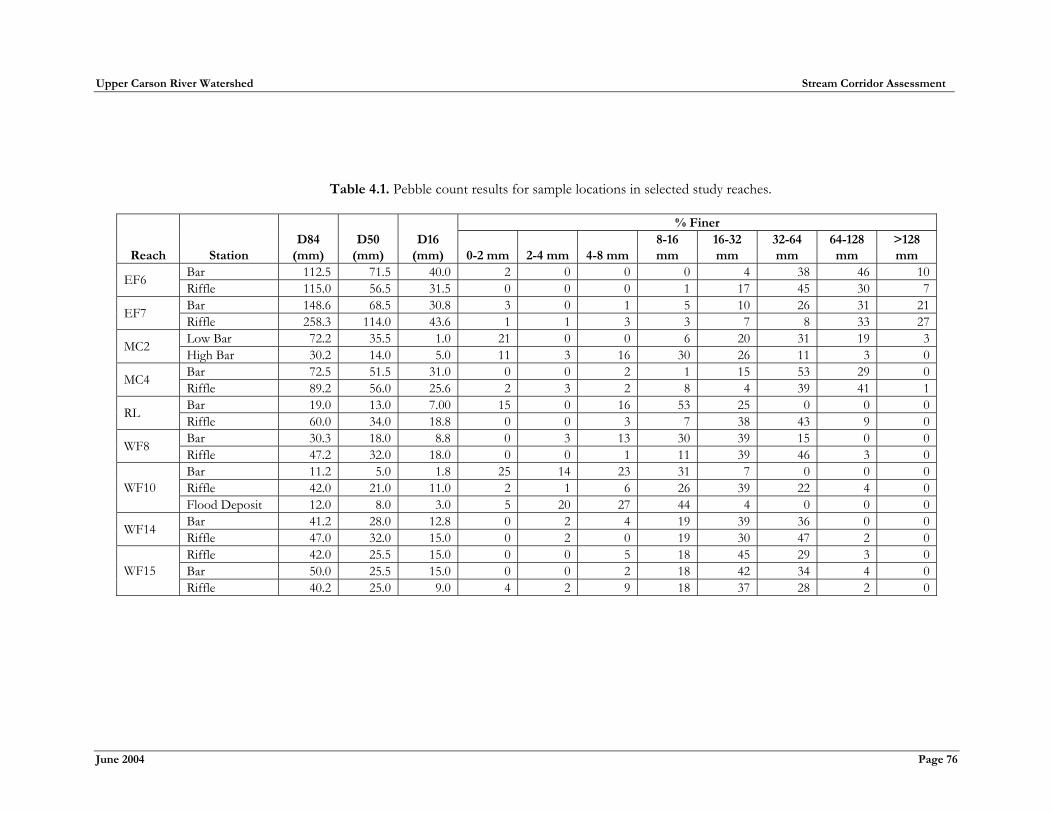
Bed material was also sampled at each of the detailed study reaches using the pebble count
method (Wolman 1954). At each site, a representative riffle and bar was sampled. A riffle and bar was chosen because they represent threshold conditions for bed mobility and bed load transport, respectively. Estimates of D16, D50, and D84 were calculated for each sample and are presented in Table 4.1, along with the percentage of material within each size class. D16, D50, and D84 describe a grain size distribution through a percent finer notation. For example, D16 describes the grain size at which 16 percent of the sample is finer than the noted value.
Upper Carson River Watershed Stream Corridor Assessment
June 2004 Page 76
Table 4.1. Pebble count results for sample locations in selected study reaches. % Finer
Reach Station D84
(mm) D50
(mm) D16
(mm) 0-2 mm 2-4 mm 4-8 mm 8-16 mm
16-32 mm
32-64 mm
64-128 mm
>128 mm
Bar 112.5 71.5 40.0 2 0 0 0 4 38 46 10EF6 Riffle 115.0 56.5 31.5 0 0 0 1 17 45 30 7Bar 148.6 68.5 30.8 3 0 1 5 10 26 31 21EF7 Riffle 258.3 114.0 43.6 1 1 3 3 7 8 33 27Low Bar 72.2 35.5 1.0 21 0 0 6 20 31 19 3MC2 High Bar 30.2 14.0 5.0 11 3 16 30 26 11 3 0Bar 72.5 51.5 31.0 0 0 2 1 15 53 29 0MC4 Riffle 89.2 56.0 25.6 2 3 2 8 4 39 41 1Bar 19.0 13.0 7.00 15 0 16 53 25 0 0 0RL Riffle 60.0 34.0 18.8 0 0 3 7 38 43 9 0Bar 30.3 18.0 8.8 0 3 13 30 39 15 0 0WF8 Riffle 47.2 32.0 18.0 0 0 1 11 39 46 3 0Bar 11.2 5.0 1.8 25 14 23 31 7 0 0 0Riffle 42.0 21.0 11.0 2 1 6 26 39 22 4 0WF10 Flood Deposit 12.0 8.0 3.0 5 20 27 44 4 0 0 0Bar 41.2 28.0 12.8 0 2 4 19 39 36 0 0WF14 Riffle 47.0 32.0 15.0 0 2 0 19 30 47 2 0Riffle 42.0 25.5 15.0 0 0 5 18 45 29 3 0Bar 50.0 25.5 15.0 0 0 2 18 42 34 4 0WF15 Riffle 40.2 25.0 9.0 4 2 9 18 37 28 2 0
Upper Carson River Watershed Stream Corridor Assessment
June 2004 Page 77
Based on available channel geometry information, hydraulic conditions along each channel reach
were estimated through the use of HEC-RAS, the U.S. Army Corps of Engineers one-dimensional hydraulic model. Cross sections were entered into HEC-RAS and separate models were built for each using reach-specific modeling parameters. Model complexity was kept at a minimum; the focus was to generally assess hydraulic condition in relation to channel geometry (e.g. – recurrence interval of floodplain activation, shear stress, and bed mobility).
To assess hydraulics under a range of flow conditions it was necessary to develop the hydrology
of individual reaches. Information sufficient to estimate flood recurrence values was only available for two locations, one on the East Fork at Markleeville and the other on the West Fork at Woodfords. All study reaches are upstream of these measured locations and in many cases encompass much smaller drainage areas. As a result, data derived for the measured gages should not be used directly at these sites.
To overcome these limitations, published regional regression equations were used that estimate
flood recurrence values based on readily available information (Waananen and Crippen 1977). The regional regression equations derived for the Sierra Nevada Region estimate the 2-, 5-, 10-, 25-, 50-, and 100-year flood recurrence value based on estimates of annual average rainfall, basin relief, and drainage area. These parameters were derived for each detailed study reach using a USGS Digital Elevation Model and local rainfall records obtained from the National Weather Service.
The literature suggests that the 1.5-year flood often corresponds well with the bankfull channel.
The 1.5-year flood was estimated by plotting results for the 2-year to 100-year recurrence estimates, with the assumption that the line describing low magnitude floods (between the 2- and 10-year recurrence) is likely to be linear, whereas the line describing high magnitude floods is likely to be logarithmic.
Table 4.2 summarizes results of the flood recurrence analysis. The range of flows described in
Table 4.2 for each detailed survey location was used to run the HEC-RAS model for each reach. Primary output parameters derived from the model included water surface elevation (water depth), mean velocity, and mean shear stress. These hydraulic parameters were used to estimate the discharge and associated flood recurrence interval at key flow stages, namely bankfull and top of bank.
The bankfull stage is the elevation at which water leaves the channel and flows onto the
floodplain. In some channels floodplain surfaces are quite small and may be within what is typically considered the stream channel. Large, level valley flat surfaces at a higher elevation may exist and these are considered terraces; even larger floods seldom access them. There are many indicators of the bankfull stage. These include the tops of active bars within the channel, or the elevation of persistent vegetation such as sedges. There is a fairly consistent relationship between bankfull indicators and the recurrence interval of floods at that stage in streams throughout the western U. S.; bankfull stage tends to have a recurrence interval of about 1-5 years, with an average of about 1.5 years (Leopold et al. 1964).
Where the system is at grade with surrounding valley flat surfaces, the top of the banks of the
channel is the same as the bankfull stage. However, channels are often downcut with respect to large valley flats. In these cases, the bankfull stage may be well below the surrounding valley flat. Downcutting with respect to the valley floor may be caused by either natural conditions, or may be caused by human disturbance.
Climate change, for example, may cause natural downcutting, while destabilization of streambanks
through human disturbance can also result in downcutting. To assess these relationships, we identified bankfull features in the field, and calculated the discharge and the flood recurrence interval for both bankfull stage and the stage at the top of the banks, where the channel flooded onto larger valley flats.

Upper Carson River Watershed Stream Corridor Assessment
June 2004 Page 78
Table 4.2. Estimated flood recurrence values for selected study reaches.
ID Reach Description Drainage
Area PrecipAltitude Index
Q1.5 (cfs)
Q2 (cfs)
Q5 (cfs)
Q10 (cfs)
Q25 (cfs)
Q50 (cfs)
Q100 (cfs)
2 WF6 Crystal Springs Bridges 64.1 28.2 7.1 381.9 1009.2 1533.1 2668.3 3596.9 5025.83 WF8 Lower Hope Valley 37.4 28.2 7.5 153.1 225.9 622.8 960.0 1686.3 2291.2 3228.94 WF8/9 Hope Valley Springs 36.2 28.2 7.5 219.8 607.0 936.2 1645.0 2235.8 3151.75 WF10 Upper Hope Valley 13.7 28.2 7.6 67.9 93.0 272.5 428.7 760.9 1044.5 1487.36 RL Red Lake Creek 8.4 28.2 7.7 45.2 59.6 180.3 286.7 511.7 706.2 1011.17 WF14 Faith Valley 8.6 28.2 7.8 45.8 60.4 182.7 290.5 518.7 716.1 1025.68 WF15 Faith Valley Reference 7.2 28.2 8.0 39.1 50.6 155.3 248.3 445.0 616.2 885.5
9 MC2 Markleeville Guard Station Bridge 60.3 28.2 6.7 377.6 992.8 1505.2 2613.0 3517.0 4904.0
10 MC2 Markleeville Creek 23.1 28.2 6.9 109.8 159.3 445.4 689.4 1210.0 1645.8 2319.711 MC4 Hot Springs (meadow) 16.4 28.2 6.9 82.9 117.2 335.0 522.2 920.2 1256.3 1777.512 EF6 Caltrans Curve 207.3 28.2 6.9 643.6 1093.6 2682.5 3974.7 6827.3 9087.1 12533.713 EF5 East Fork Road 199.9 28.2 7.0 1049.3 2584.3 3834.6 6593.6 8783.4 12126.214 EF7/8 Centerville Flat Road 180.1 28.2 7.1 564.7 944.5 2347.3 3493.8 6019.9 8033.0 11111.215 WC2 Wolf Creek 29.8 28.2 7.3 190.7 529.8 818.6 1437.9 1955.2 2756.5
Note 1 - East Carson River below Markleeville: estimated peak discharge in January 1997 was 18,900 cfs with an estimated recurrence of <75 years; estimated 100 year peak is 26,200 cfs.
Note 2 - West Fork at Woodfords: estimated peak discharge in January 1997 was 8,100 cfs with an estimated recurrence of
>100 years; estimated 100 year peak is 6,270 cfs. Note 3 - Values for the 2-, 5-, 10-, 25-, 50-, and 100-year flood recurrence were estimated using regional regression equations
developed by Waananen and Crippen (1974). The 1.5-year flood recurrence was estimated using a linear regression of the low magnitude (2-year and 10-year)flood values.
Upper Carson River Watershed Stream Corridor Assessment
June 2004 Page 79
Another focus of the current assessment was to analyze overall trends in shear and water depth at
the study reach scale using the cross-section data and hydraulic modeling tool. The range of flows reviewed for each study reach was dependent upon available elevation data. Along some reaches (such as meadows in Hope and Faith Valleys) the unconfined nature of the flow - once the elevation of the top of bank was exceeded - limited estimation of hydraulic parameters at higher stages of flow. Shear values were used in conjunction with grain size information to assess bed mobility at each reach. Cross section specific bed mobility estimates were averaged to produce an estimate of the percentage of the bed that would be expected to move under a range of flow conditions. These data were analyzed to provide insight into channel function. Grain size mobility was estimated using the Shields equation (Shields, 1936; Simons and Senturk, 1992). Results of this analysis are presented in Table 4.3.
4.1.4.2 Hydraulic Analysis
Limited hydraulic modeling was conducted at selected bridges and roadway encroachments along the stream corridor. The purpose of the hydraulic analysis was to determine:
stage/discharge relationships; hydraulic forces on the streambed and banks; and, other relevant flow characteristics.
Cross sections were measured at appropriate locations to create the preliminary hydraulic model.
Once the hydraulic analysis was complete, the output was incorporated into the stream geomorphic analysis, which included assessing natural versus artificial plan form changes to the stream, changes in bed load transport, and floodplain disruptions.
4.1.4.3 Vegetation
Methods proposed to assess vegetation are quantitative in nature, providing baseline data for each study reach. The Proper Functioning Condition (PFC) assessment protocol developed by NRCS (1998 and 1999) recognizes that vegetative data is important to quantitatively support effects of vegetation on bank stability and succession. The cross section composition method (Winward 2000) was recommended by NRCS as a reasonable means of developing that information.
The cross section composition sampling method was employed coincident with cross sections
sampled during the fluvial geomorphic assessment. Community typing provides information regarding vertical and horizontal structure, plant species composition and potentially successional status. Unknown plant species were collected, identified to species level, and verified with herbarium specimens as necessary. Photographs were taken at each end point and at stream crossings to document the riparian complex community types present. Within each type, the presence of weedy or unique species was noted, whether dominant or not.
Identified community types are typical of the Eastern Sierra and are described in detail in the
Riparian Community Type Classification for Humboldt and Toiyabe National Forests, Nevada and Eastern California (Manning and Padgett 1995). This publication and the Eastern Sierra Nevada Riparian Field Guide (Weixelman et al. 1999) were used to verify successional trajectories and community types.
Vegetation composition data represents a snapshot in time, documenting community types
present along the cross-sectional gradient. That data can be used to rate the successional status of an area. Also, the data can be compared with relatively undisturbed areas, known reference areas, and communities of a known successional status. Such comparisons can inform on the overall condition and/or
Upper Carson River Watershed Stream Corridor Assessment
June 2004 Page 80
successional stage of an area. This in turn helps to define the need for changes in land management, or riparian restoration/enhancement opportunities.
The vegetation cross-section analysis entailed a hard look at plant species composition to
determine the successional status of each community type encountered along every cross-section transect. According to Weixelman et al. (1999):
“Plant species are indicators of their environment. Some species are best used as indicators of ecological type, the landscape setting and potential of a site, while others indicate specific disturbances or the colonization of disturbed areas.” To designate the successional status of each community type encountered, plant species providing
the most vegetative cover were identified and associates were recorded. Also recorded was the amount of vegetative cover provided by each plant species, the appropriateness of that plant in its current setting, the plant indicator status and/or the community type indicator status.
Note that community types may have one or more layers: a tree layer, a shrub layer and an
herbaceous layer. The herbaceous (grasses, flowering plants and grasslikes) layer is the understory of shrub or tree dominated community types. The composition of plant species exhibited in the understory is important because it is one way to differentiate tree and shrub dominated types from each other.
Plant indicator status was determined by reviewing indicator values for typical herbaceous riparian vegetation that the USFS has derived in conjunction with other rangeland managers. Status indicators are as follows:
low - reflects low seral conditions, or conditions with limited similarity to the potential natural community (PNC);
moderate- reflects moderate similarity to PNC; and, high – relects high similarity to PNC (Weixelman et al. 1999).
The successional stage of riparian community types was also been assigned late or early ratings if it is known when a community type occurs within a successional regime (Winward 2000).
Invaluable for analysis was comparison of the identified community types with those documented previously in Riparian Community Type Classification for Humboldt and Toiyabe National Forests, Nevada and Eastern California (Manning and Padgett 1995). Also helpful was the USFS Ecological Site Inventory of riparian areas in portions of the assessment area. Based on years of observations and field observation, these data take into account both natural process and human induced successional trajectories within various community types.
Information generated from the USFS ecological site inventory was used to develop a condition
rating based on species composition, position in landscape, and soil characteristics. Successional status for each community type was summed as a percentage for each reach, and an overall successional status was derived for each reach. Collected data provided additional verification for condition and successional status, and may provide future projects with appropriate reference standards.
A Woody Species Regeneration transect was documented where recruitment was evident. These
transects are meant to sample the density and age class distribution of perennial woody species (trees and shrubs). Categories of woody plants include clumped, multi-stemmed species (most willows), rhizomateous species (wolf willow, planeleaf willow, wild rose) and single stemmed species (cottonwoods, alder, quaking aspen, coyote willow).

Upper Carson River Watershed Stream Corridor Assessment
June 2004 Page 81
Table 4.3. Bed mobility to discharge relationships for selected study reaches.
1.5-year Interval 2-year Interval 5-year Interval 10-year Interval 25-year Interval 50-year Interval 100-year Interval
Rea
ch
Dis
char
ge (
cfs)
Gra
in S
ize
(mm
)
% o
f M
ater
ial
Mov
ed in
Rif
fle
Dis
char
ge (
cfs)
Gra
in S
ize
(mm
)
% o
f M
ater
ial
Mov
ed in
Rif
fle
Dis
char
ge (
cfs)
Gra
in S
ize
(mm
)
% o
f M
ater
ial
Mov
ed in
Rif
fle
Dis
char
ge (
cfs)
Gra
in S
ize
(mm
)
% o
f M
ater
ial
Mov
ed in
Rif
fle
Dis
char
ge (
cfs)
Gra
in S
ize
(mm
)
% o
f M
ater
ial
Mov
ed in
Rif
fle
Dis
char
ge (
cfs)
Gra
in S
ize
(mm
)
% o
f M
ater
ial
Mov
ed in
Rif
fle
Dis
char
ge (
cfs)
Gra
in S
ize
(mm
)
% o
f M
ater
ial
Mov
ed in
Rif
fle
East Fork Carson Fork 6 643.6 60 52.75 1093.6 74 63.25 2682.5 112 83.75 3974.7 139 92.75 6827.3 194 99.25 9087.1 229 100.00 12533.7 272 100.007 564.7 54 21.00 944.5 73 28.50 2347.3 124 50.75 3493.8 156 62.00 6019.9 203 70.50 8033 228 73.50 11111.2 247 78.00
7 (1) 564.7 51 N/A 944.5 71 N/A 2347.3 124 N/A 3493.8 149 N/A 6019.9 181 N/A 8033 195 N/A 11111.2 219 N/AMarkleeville Creek
2 109.8 38 94.50 159.3 45 96.25 445.4 73 97.00 689.4 80 98.25 1210 91 96.75 1645.8 95 96.75 2319.7 120 96.004 82.9 38 27.00 117.2 45 33.5 335 73 68.75 522.2 80 76.50 920.2 91 86.25 1256.3 95 90.75 1777.5 120 96.25
Red Lake Creek 1 45.2 25 28.83 59.6 26 31.50 180.3 30 39.50 286.7 37 51.00
West Fork Carson River 8 153.1 15 10.75 225.9 19 16.25 622.8 26 30.75 960 25 30.50
10 67.9 4 2.25 93 4 2.50 272.5 6 4.50 428.7 7 6.75 760.9 10 16.75 1044.5 13 23.50 1487.3 17 36.7514 45.8 13 14.25 60.4 14 16.50 182.7 24 33.25 290.5 22 33.25 518.7 25 36.00 716.1 29 46.75 1025.6 34 57.75
15 (2) 39.1 26 44.33 50.6 28 49.67 155.3 26 47.33 248.3 31 56.33 445 39 67.6715 (3) 39.1 20 41.00 50.6 22 48.50 155.3 42 71.50 248.3 55 73.00 445 66 77.50
Note 1 – Reach 7 evaluated without a levee. Note 2 – Reach 15 evaluated below the beaver dam. Note 3 – Reach 15 evaluated above the beaver dam. Note 4 – Blank cells represent the limit of the hydraulic analysis in unconfined reaches.
Upper Carson River Watershed Stream Corridor Assessment
June 2004 Page 82
Specific stem counting procedures are required for each category. Stems are recorded by plant species as sprouts, young, mature, decadent and dead. The woody species regeneration sampling method has been employed by the Toiyabe National Forest during its efforts to document community types. This method is also recommended by the NRCS (1998 and 1999) as a means of rating the potential of a system to respond to change over time.
4.2 Reach Summaries “White Paper One” included general reach summaries based on preliminary observations and
data collection at all 32 reaches identified within the assessment area. Based on results of the preliminary survey, a total of nine detailed study reaches were selected for further study, including seven impacted and two reference reaches. Summaries of the data analysis are presented in the remainder of this section including general conclusions and considerations of the restoration potential of each reach.
Upper Carson River Watershed Stream Corridor Assessment
June 2004 Page 83
4.2.1 Reach WF8
Rosgen Channel Type: E4, transitional to F4 Valley Form: Meadow Bankfull Flow (based on field indicators): 200 cfs (Q1.5 - Q2) Top of Bank Flow: 700 cfs (Q5 – Q10) Bed Mobility When Flow is at Top of Bank: 30% Restoration Objective: Increase bank stability
Geomorphic Characteristics: Reach WF8 of the West Fork Carson River encompasses the lower portion of Hope Valley, from the Highway 88/89 intersection to the Highway 88 Bridge (see Figure 2.2 and maps contained in Section 3.2.1.8 of this report). A longitudinal profile and cross sections of the reach are provided in Figure 4.1, while discharge and sheer data are presented in Figure 4.2. The stream here flows through a wide meadow. The Rosgen entrenchment ratio is high—larger floods access much of the surrounding valley floor. The bed is dominated by gravel, and the width-to-depth ratio is moderate. The resulting Rosgen classification is C4.
Bankfull indicators are found at an elevation below the surrounding valley flat. The discharge at
the bankfull stage, 200 cfs, has a recurrence interval of between 1.5 and 2.0-years as is typical of most streams. The top of the banks is generally at a higher elevation, the stage of the five to 10-year flood. This suggests that the stream may be somewhat incised with respect to the valley flat, although the incision is not great enough to substantially affect channel classification by decreasing the entrenchment ratio.
Channel stability is moderate. Streambanks are generally stable,
although many outside bends are eroding to some degree. Much of the bed is relatively immobile at bankfull and top of bank flows, suggesting that bedload transport of sediment is less pronounced in this reach than in reaches further upstream (see Table 4.3). As a result, the channel is less dynamic, and changes less during floods than upstream reaches.
Aquatic Habitat Characteristics: Pools are relatively large in this reach, and deep compared to
the next reach upstream. However, the pools are relatively simple and provide little direct overhead cover for fish other than water depth. Substrate is well-sorted and there does not appear to be an excess amount of fine sediment.
Vegetation Characteristics: Eleven vegetation community types were documented within the
assessment area, primarily herbaceous meadow dominated by sedge species. One community type sampled adjacent to the channel at the top of bank was dominated by sedge and Kentucky bluegrass (Poa pratensis). While Kentucky bluegrass is a rhizomateous species that can tolerate heavy grazing, its presence provides little protection for the riverbank, as the root system is shallow. Bank failure is common where this grass provides dominant cover. The presence of needle grass (Acnatherum nelsonii) may indicate past disturbance, as this species is known to colonize disturbed soils. However, its strong root system is valuable for erosion control. The thistle previously noted in this meadow is elk thistle (Cirsium scariosum), a native species, and is not considered an invasive or noxious weed. However, the prevalence of cover provided by this species may indicate it as an “increaser” in response to past grazing pressure.
Rooted aquatic vegetation was present throughout this reach, with water buttercup (Ranunculus
aquatilus) and Nuttall’s waterweed (Elodea nuttalli) forming large mats in the stream. The distribution of woody species exhibited the following patterns:
older willows were located in topographic lows (old channels remnants);
Reach WF8 appears to be recovering and
should be monitored.

Upper Carson River Watershed Stream Corridor Assessment
June 2004 Page 84
Figure 4 .1. Longitudinal profile and cross-section geometry for Reach WF8.
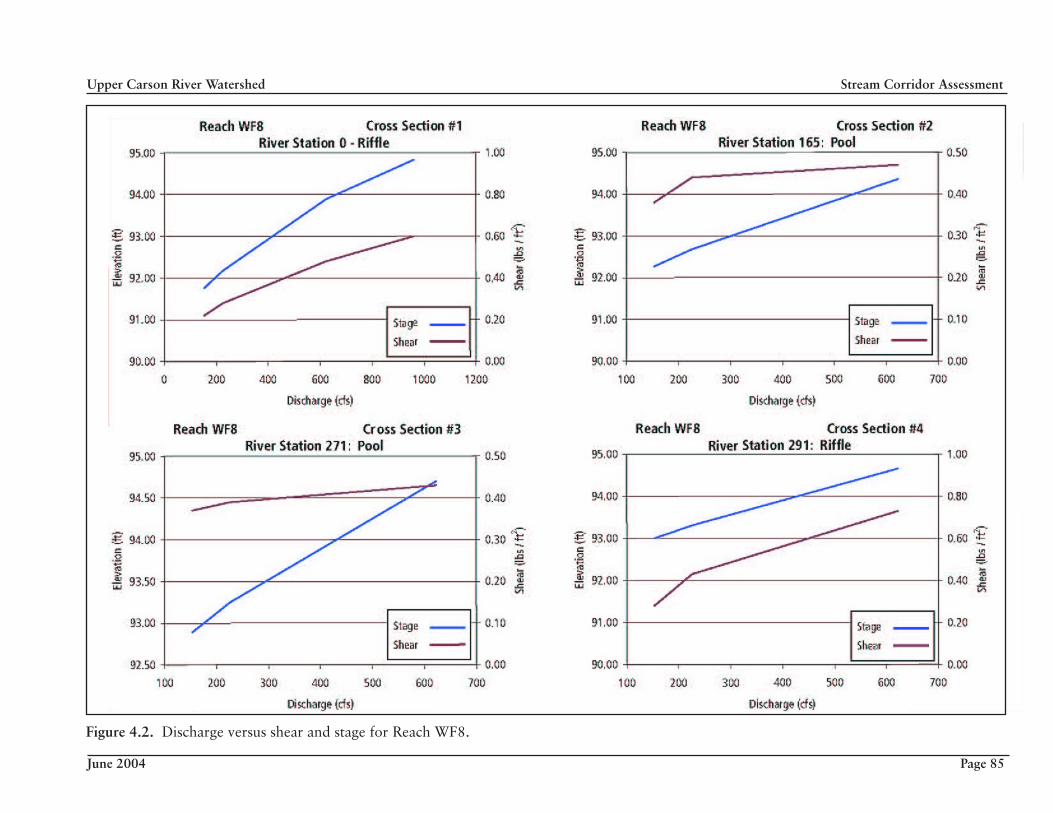
Figure 4.2. Discharge versus shear and stage for Reach WF8.
Upper Carson River Watershed Stream Corridor Assessment
June 2004 Page 85
Upper Carson River Watershed Stream Corridor Assessment
June 2004 Page 86
mature willows that had resprouted, willow sprouts and saplings with additional herbaceous plant species were located on active sand/gravel bars; and,
adjacent, higher elevation abandoned bars were becoming revegetated with a combination of upland pioneering herbaceous species, and with robust, well-established mature willow clumps.
It appeared that point bars and elevations equal to the normal high water mark are providing the
ecological niche for willow establishment. Banks are not generally vegetated with willows. The presence of mostly herbaceous meadow characterized by sedge species in proximity to the channel indicated more saturated conditions that may not allow for the establishment of willow species. Minor bank sloughing noted along the reach may be a result of adjustment to historic land use and the prevalence of Kentucky bluegrass. The presence of yarrow, dandelion, pale agoseris and cinquefoil also indicate that the meadow is still recovering from past land use, as these are increaser plant species.
The USFS Ecology Team conducted plant community sampling along this reach area
(comparable plot 97765). Their findings indicated that the meadow area was dominated by big bluegrass and that Baltic rush, pale agoseris and knotweed also were present. The USFS plot was assigned a moderate ecological status rating. Data developed as part of the present study (Table 4.4) indicate that the area is dominated by early and mid successional status ratings. Vegetation in the area is adjusting to past disturbances and current fluvial processes.
Table 4.4. Reach WF8 successional status data.
Successional
Status Percent
Occurrence Early 53.2 Mid 26.4 High 20.2
Analysis and Summary: Based on vegetation and geomorphic characteristics, the channel in this
reach is probably somewhat incised relative to the surrounding valley flat. The presence of old channels and willows on the valley flat suggest that the valley flat functioned as floodplain relatively recently. Although incision may have had natural causes, it is more likely the result of historic land use, particularly high grazing levels that occurred before the turn of the century (see the next chapter for information on historic land use and potential effects on streams). Streambanks are moderately unstable due to the downcutting, and instream habitat is less complex and provides less cover than would be expected in undisturbed meadow streams.
The trend of channel conditions is likely toward recovery. No grazing has occurred on this
meadow for over 20 years and qualitative observations from many observers suggest that streambanks have become more stable. We were unable to find any quantitative data to verify this trend; subsequent photo monitoring would be valuable to verify that the trend is occurring and continues into the future. While it appears that channel condition continues to improve, recovery is slow, probably in great part due to the high elevation and rather harsh growing environment. Larger floods, such as the January 1997 flood, likely set recovery back.
Based on survey results, the best approach to restoring the Reach WF8 stream channel would be
to implement management and projects that improve streambank stability and encourage a reduction in the width to depth ratio. This would increase the frequency of pools, increase habitat complexity, and reduce the amount of fine sediment entering the channel. Improved streambank stability would also reduce the negative impact of larger floods, and allow slow restoration of the channel-floodplain relationship.
Upper Carson River Watershed Stream Corridor Assessment
June 2004 Page 87
4.2.2 Reach WF10
Rosgen Channel Type: C4/5 Valley Form: Meadow Bankfull Flow (based on field indicators): 175 cfs (Q2 – Q5) Top of Bank Flow: 1,500 cfs (Q100) Bed Mobility When Flow is at Top of Bank: 36% Restoration Objective: Increase bank stability, increase floodplain surfaces
Geomorphic Characteristics: Reach WF10 of the West Fork Carson River encompasses the
upper portion of Hope Valley (see Figure 2.2 and maps contained in Section 3.2.1.8 of this report). A longitudinal profile and cross sections of the reach are provided in Figure 4.3, while discharge and sheer data are presented in Figure 4.4. A representative section of this long reach was selected for detailed survey. As in the lower portion of Hope Valley, the West Fork here flows through a wide meadow. However, the Rosgen entrenchment ratio is lower in this reach, indicating that larger floods access less of the surrounding valley floor. The bed is dominated by gravel, and the width-to-depth ratio is moderate. The resulting Rosgen classification is C4.Bankfull indicators are found well below the elevation of the surrounding valley flat. The discharge at the bankfull stage, 175 cfs, has a recurrence interval of between 2 and 5 years as is typical of most streams. Although the top of bank elevation is variable in this reach, on average the channel will carry 1,500 cfs, the equivalent of a 100-year flood in this portion of the watershed, before spilling onto adjacent valley flats. The streambanks are generally much higher in this reach than in WF8, and incision appears to be farther advanced.
Channel stability is moderate to low. Streambanks on nearly all outside bends are eroding. Like in
WF8, much of the bed is relatively immobile at bankfull and top of bank flows, suggesting that bedload transport of sediment is less pronounced in this reach than in reaches further upstream (Table 4.3). This reach and WF8 move about a third of the bed when flow is at the top of the banks, but this flow has a 10-year recurrence interval in WF8, while in this reach the top of bank flow has a 100-year recurrence interval due to higher entrenchment. In WF8, floods bigger than the 10-year recurrence interval flood flow onto the floodplain, reducing erosive forces within the channel. In this reach, floods greater than the 10-year recurrence interval flood are contained within the channel, up to nearly the 100-year flood. Erosive stress is concentrated, and it is likely that this reach changes substantially during bigger floods.
The current channel appears inset within a larger channel and floodplain surface. Higher terrace
surfaces are seldom accessed by floods, but show evidence of relatively recent channels and abandoned meander bends. Large bar deposits adjacent to the existing channel likely formed during rain-on-snow events such as those that occurred in 1963 and 1997. Sediment within these bar deposits may be derived from local bank and bed material as the channel widened and eroded adjacent banks to form floodplain. Additional evidence suggests that channel equilibrium has been altered and the channel is adjusting. Localized aggradation (raising of the streambed), which is relatively uncommon in stable, equilibrium channels, is common in this reach. Aggradation is evidenced by low development of the pool-riffle sequence, a significant amount of fine-grained material in the channel, and widened cross-sections with reduced shear and very little bed mobility, even during high magnitude discharge events.
Aquatic Habitat Characteristics: Pool frequency and depth are both lower in this reach than
in WF8. Like in WF8, the pools that are formed tend to be simple and provide little cover for fish other than depth. Riparian vegetation provides little additional cover because most of the outside bends are eroding and the streambanks are high. Relatively high levels of fine sediment were found in riffle areas in this reach. This is probably due to the fact that the channel is not efficient at tranporting, sorting and storing sediment. High levels of fine sediment in the substrate negatively impact aquatic macroinvertebrate (insects) production and the ability of trout to reproduce.
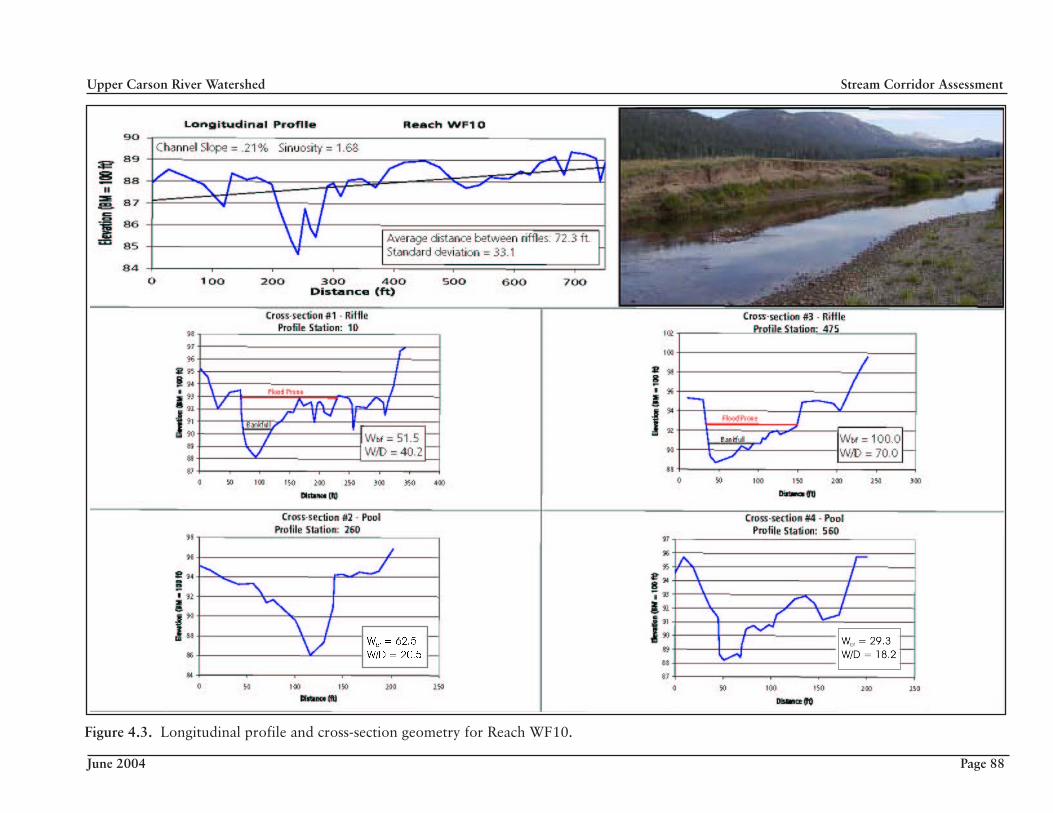
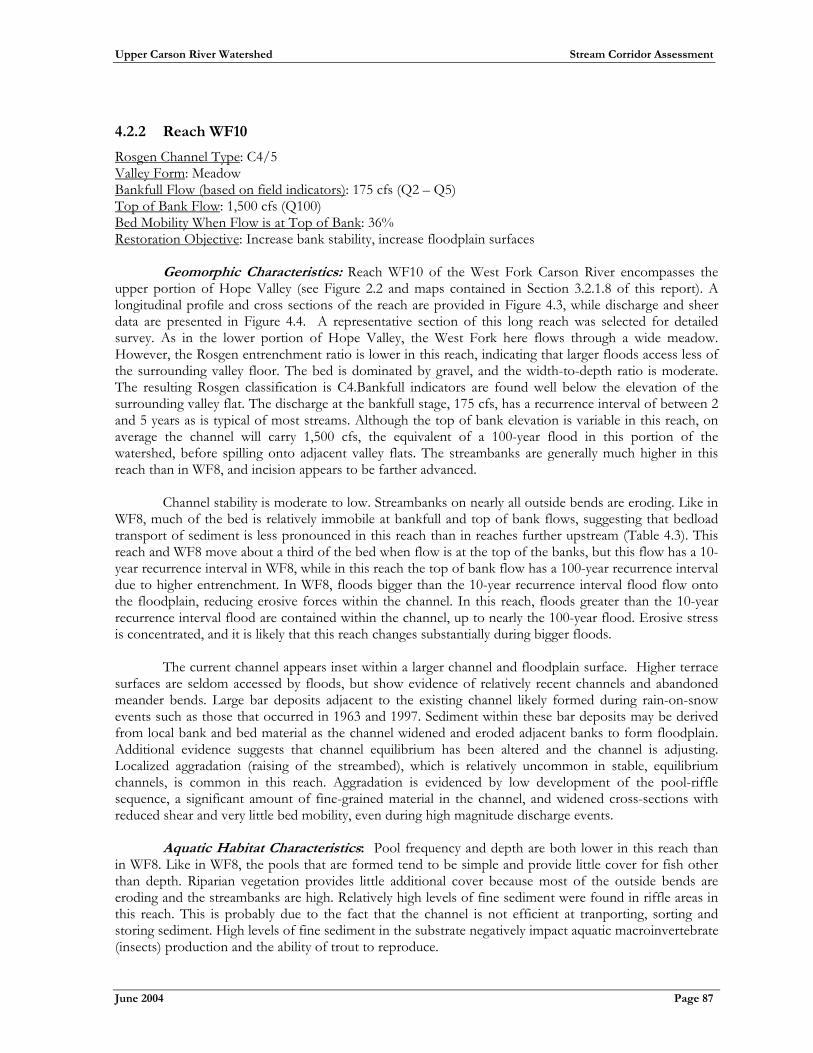
Figure 4.3. Longitudinal profile and cross-section geometry for Reach WF10.
Upper Carson River Watershed Stream Corridor Assessment
June 2004 Page 88
Figure 4.4. Discharge versus shear and stage for Reach WF10.
Upper Carson River Watershed Stream Corridor Assessment
June 2004 Page 89
Upper Carson River Watershed Stream Corridor Assessment
June 2004 Page 90
Vegetation Characteristics: Thirteen vegetation community types were identified within the assessment area. Similar to WF8, a sedge dominated meadow was adjacent to the river channel. To the west, the meadow was more saturated, with moisture still seeping through to the banks even in September. The east side meadow was drier; a higher percentage of bare soil and “pioneering” plant species were observed. Unlike WF8, willows were located within the bank to bank cross section, but were not observed in abandoned channels. There was evidence of past disturbance at the top of bank, where an annual mustard and a native sedge species provided the dominant vegetative cover. Typically, Lemmon’s and Geyer’s willows were becoming established on point bars and at elevations equal to the high water mark. Some gravel bars had mature willows established at higher elevations, with sprouts and saplings located in closer proximity to water.
Needle grass in drier parts of the meadow may indicate past disturbance, as this species is known
to colonize disturbed soils. Its strong root system is valuable for erosion control. Its prevalence as an upland species may also indicate transition to a drier meadow due to channel down cutting. Active bank sloughing was observed at two locations. Along this reach, the river appears to be recovering from past incision, developing vegetation that will stabilize it over time. Mesic carex sod provided stabilization where slopes were not vertical, but had already sloughed in response to channel down cutting.
USFS Ecology Team conducted plant community sampling along this reach area (plots 97711 and
97812). They assigned the Lemmon’s willow-mesic graminoid dominated plot a low ecological status rating, while the Lemmon’s willow/wooly sedge plot was assigned a moderate rating. Data developed as part of the present study (Table 4.5) indicate that the area is dominated by early and mid successional status ratings. Vegetation in the area is adjusting to past disturbances and current fluvial processes.
Table 4.5. Reach WF10 successional status data.
Successional
Status Percent
OccurrenceEarly 50.1 Mid 43.1 High 6.8
Analysis and Summary: This survey suggests that Reach WF10 is not in equilibrium with the
current sediment supply. Throughout our survey reach, the channel is regularly aggrading and degrading in localized areas, adjusting hydraulic characteristics to a constantly changing supply of local sediment. There is also evidence that the stream has incised relatively recently in relation to the surrounding floodplain. This evidence includes numerous abandoned channels and riparian shrub communities on what is now a terrace next to the active floodplain. Although similar features are seen in some locations in Reach WF8, they are much more pronounced in WF10.
Part of the dynamic nature of Reach WF10 is due to its location in the watershed. The upstream
end of Reach WF10 is at a significant transition in watershed gradient, from a steep, confined reach upstream that efficiently transports sediment to the relatively flat, less confined Reach WF10. Sediment is typically stored at these locations, which causes some dynamism in WF10. However, the abandoned channels and riparian shrubs on higher terraces suggest that the channel in WF10 has been more stable in the relatively recent past. Like in Reach WF8, this suggests that although incision may have had natural causes, it is more likely the result of historic land use, particularly high grazing levels, especially in the late 1800’s.
However, channel instability is higher in this reach than in WF8, which is not likely explained by
grazing impacts, as the levels of grazing were probably similar in the two reaches. Reach WF10 may have been affected by the construction of the highway, gravel pit and bridge downstream, but our assessment
Upper Carson River Watershed Stream Corridor Assessment
June 2004 Page 91
suggests than any effects from these activities were likely localized. Reach WF10 is separated from the disturbances of highway construction by a stable reach (WF9), and it is unlikely that substantial effects propagated upstream through this reach. Higher instability in Reach WF10 is most likely explained by the relative position of the reach in the watershed, where it is more naturally dynamic. The effect of land use practices was amplified by natural dynamism, resulting in more channel instability. It is important to note that similar levels of land use may have different effects in different geomorphic settings.
The higher instability in Reach WF10 has reduced rates of channel equilibrium recovery. Larger
rain-on-snow floods cause so much erosion that much of the channel improvement and stabilization that occurs between floods is lost. Natural recovery rates have been much slower in this reach than in WF8, and can be expected to be slower in the future.
As in WF8, channel recovery rates would be increased through management and projects that
improve streambank stability and encourage a reduction in the width to depth ratio. This would increase the frequency of pools, increase habitat complexity, and reduce the amount of fine sediment entering the channel. Improved streambank stability would also reduce the negative impact of larger floods, and allow slow restoration of the channel-floodplain relationship. However, in this reach larger floods have more erosive power due to the substantial incision. If channel recovery continues to be retarded by erosion during larger floods, active projects to create additional floodplain may be warranted. Photo monitoring in this reach would assist in determining rates of channel recovery.

Upper Carson River Watershed Stream Corridor Assessment
June 2004 Page 92
4.2.3 Reach WF14
Rosgen Channel Type: F4 Valley Form: Meadow Bankfull Flow (based on field indicators): 150 cfs (Q2 – Q5) Top of Bank Flow: 1,000 cfs (Q100) Bed Mobility When Flow is at Top of Bank: 57% Restoration Objective: Lengthen channel, grade stabilization
Geomorphic Characteristics: Reach WF14 of the West Fork of the Carson River flows through
the lower portion of Faith Valley (see Figure 2.2 and maps contained in Section 3.2.1.13 of this report). A longitudinal profile and cross sections of the reach are provided in Figure 4.5, while discharge and sheer data are presented in Figure 4.6. Although general channel and floodplain characteristics are similar to those in the upper part of Faith Valley, this portion of the channel was designated as a separate reach due to the presence of large bar deposits that are not as evident upstream. The entrenchment ratio is very low in this reach, indicating that flood flows do not access the surrounding valley flat. The streambed is predominantly composed of gravel-sized particles, and the bankfull width-to-depth ratio is moderate. The resulting Rosgen channel classification is F4.
This reach is more entrenched than downstream reaches. Bankfull indicators are found well
below the elevation of the surrounding valley flat. The discharge at the bankfull stage, 150 cfs, has a recurrence interval of between 2 and 5 years, again typical of most streams. However, the discharge at the top of the banks is 1,000 cfs, the equivalent of a 100-year flood in this portion of the watershed. The streambanks are high due to channel entrenchment.
Channel stability is moderate to low. Many streambanks on outside bends are eroding. Large
gravel bars are found throughout this reach, and our analysis of bed mobility suggests that more bedload is in transport in this reach than in downstream areas. Beavers have been active throughout this reach, and improve channel stability over the short-term. Over longer timeframes, the failure of beaver dams has probably also served to decrease channel stability. Although channel stability is not high, pools are common and are of relatively high quality. Riparian shrubs are more widely distributed on streambanks in this reach than in downstream reaches, and are actively stabilizing eroding banks.
Aquatic Habitat Characteristics: Pool frequency and depth are higher in this reach than in
downstream areas. Pools are relatively complex, providing instream cover. Riparian shrubs add additional cover on outside bends. The proportion of fine sediment in riffles and bars is relatively low.
Vegetation Characteristics: Seven Vegetation community types were identified within this
reach. Herbaceous (graminoids and forbs) to sedge dominated meadows were buffered by willow present along the channel bank. Fairly recent disturbance was evidenced by high percentage of bare soil with a sparse percentage of annuals providing dominant cover in two community types. One of these community types exhibited a willow overstory. The presence of Kentucky bluegrass adjacent to the channel bank, and yarrow and cinquefoil as prevalent forbs in four community types indicated response to past land use (livestock grazing) as these are increaser species.
On gravel bars and at elevations equal to the high water mark, sparse to moderate herbaceous
cover with some willow sprouts and saplings was noted. Willows formed thickets at the top of bank that extended horizontally for a few hundred feet, sometimes with currant bushes growing underneath them. On the west side, some willow clumps were quite old as they were located on 2-4 foot mounds consisting of old stems and decayed material elevated above the existing soil level.