Embed Size (px)
Citation preview

Across the Spectrum: The Wide Range of Jobs Immigrants Do
A Fiscal Policy Institute Report www.fiscalpolicy.org
April, 2010

The principal author of this report is David Dyssegaard Kallick. The Fiscal Policy Institute’s chief economist and deputy director, James Parrott, oversaw the work at every stage. Research associate Jonathan DeBusk conducted the data analysis. Jo Brill, communications director, helped with formatting and proofreading. The work was overseen by Frank Mauro, executive director of the Fiscal Policy Institute. Fiscal Policy Institute’s Immigration Research Initiative is guided by advice and input from our expert advisory panel. Current members are listed on the last page of this report. Thanks to Audrey Singer and Jill Wilson of the Brookings Institution’s Metropolitan Policy Program for guidance on the analysis of American Community Survey microdata by Metropolitan Statistical Area. Charts with 21 detailed occupations for immigrants in each of the 25 largest metro areas are available upon request. Core funding for the Fiscal Policy Institute’s Immigration Research Initiative is provided by the Carnegie Corporation of New York, and additional funding is provided by the Horace Hagedorn Foundation. Contact: David Dyssegaard Kallick Director of the Fiscal Policy Institute’s Immigration Research Initiative 212-721-7164 [email protected] www.fiscalpolicy.org/immigration.html

Across the Spectrum
FPI April 2010 1
Introduction Across the Spectrum looks at the wide range of jobs immigrants hold in the 25 largest metropolitan areas of the United States. Across the Spectrum updates the data used in our December 2009 report, Immigrants and the Economy, and looks at it from a different perspective.1 In the 2009 report, we examined the important role immigrants are playing in a wide range of metropolitan areas. We looked at the immigrant share of economic output, which we found was consistently in line with the immigrant share of population. We looked at the correlation of aggregate metro area economic growth and growth in immigrant share of the labor force, finding unsurprisingly that immigration and economic growth go hand in hand. And, examining 5 broad and 21 detailed occupations, we looked at what share of each occupation was held by immigrants. In this report, we take much of the same information and examine the range of occupations held by immigrants. Rather than asking, for example, what share of technicians are immigrants, we ask here what share of immigrants are technicians. Contrary to common misperception, immigrants are spread quite broadly across a wide range of occupations in most metropolitan areas. In some metro areas, such as Pittsburgh, Cleveland and St. Louis, immigrants are in fact quite strikingly concentrated in higher-skilled occupations; in others, such as Dallas or Phoenix, they are more concentrated toward the lower end of the skill spectrum. Interestingly, it is often in the metro areas with slowest economic growth that immigrants are most concentrated at the top of the skills spectrum. The reason is clear enough: immigration and growth go hand in hand, so areas with low levels of growth, such as metro Pittsburgh, wind up with a comparatively small number of immigrants. Doctors, engineers, and executives still come to the area to work at institutions drawing from a global talent pool. But, immigrants looking for jobs in lower-skilled occupations—for example, in food services or as construction laborers— are not likely to go to areas with very low growth. It’s not so much that metro Pittsburgh has a very large number of high-skilled immigrants as that immigration overall is comparatively low. In a booming metro area, both higher- and lower-skilled immigrants will be part of the economic picture. The analysis presented here includes as immigrants all people residing in the United States who were born in another country. It includes documented and undocumented immigrants, recent arrivals as well as long-term residents, citizens and non-citizens. Where possible, we use data from the Pew Hispanic Center to give an analogous picture of undocumented immigrants.
1 Immigrants and the Economy is available online at www.fiscalpolicy.org/immigration.html.

Across the Spectrum
FPI April 2010 2
1. The country’s 25 largest metropolitan areas In the 25 largest Metropolitan Statistical Areas of the United States, the immigrant share of the population varies greatly, from 37 percent in metro Miami to 3 percent in metro Pittsburgh. (Figure 1.) Metropolitan areas include both central cities and the suburbs that surround them, and they are defined in large measure by commuting patterns. Metropolitan areas are thus a good way to consider local labor markets. Because they are defined this way, there is also greater comparability among metro areas than among other units of analysis, for example, cities. The counties included in each metropolitan statistical area can be found in
Appendix A of Immigrants and the Economy.
Immigrant share of population varies greatly in 25 metro areas 2006-2008
Figure 1. Source: American Factfinder, 2006-08 American Community Survey 3-year data.

Across the Spectrum
FPI April 2010 3
2. Immigrants are spread across the economic spectrum Examining five broad occupational categories gives a general overview of the occupations immigrants have in the 25 largest metro areas. Figure 2 shows the share of immigrants working in each of five occupational categories: 1) Managerial and professional specialty occupations (e.g., executives, financial managers, doctors, and engineers); 2) Technical, sales (both higher- and lower-level sales positions), and administrative support job; 3) Service jobs (e.g., food services, building services, protective services); 4) Blue-collar jobs in construction and production; and 5) Farming, fishing, and forestry.
The impression that sometimes emerges in public discussions is that immigrants are primarily working in low-skilled jobs, but this broad overview shows that this is far from the case. Immigrants are spread surprisingly evenly across the first four broad occupational categories, with a small share in farming, fishing, and forestry. In the 25 metro areas as a whole, a quarter of all immigrants work in managerial and professional specialty occupations (24 percent) and roughly another quarter (23 percent) work in technical, sales, and administrative support occupations. Somewhat less than a quarter (21 percent) work in service jobs,
Figure 2. Universe is immigrants 16 years or older employed in the civilian labor force. In metropolitan areas, farming, fishing and forestry jobs are largely in landscaping and gardening. Source: Fiscal Policy Institute analysis of 2006-08 ACS.
26%
22%
22%
17%
32%
19%
22%
32%
23%
31%
36%
29%
16%
16%
28%
25%
26%
33%
24%
38%
18%
50%
23%
39%
35%
24%
23%
24%
24%
21%
18%
23%
19%
30%
24%
23%
23%
25%
26%
17%
22%
24%
23%
23%
24%
25%
24%
19%
25%
20%
22%
21%
23%
22%
25%
20%
20%
18%
20%
20%
21%
22%
17%
24%
17%
21%
22%
18%
20%
23%
23%
19%
19%
18%
25%
13%
21%
15%
17%
21%
21%
24%
31%
35%
44%
21%
39%
25%
21%
34%
20%
21%
21%
38%
39%
25%
27%
24%
21%
27%
19%
35%
11%
28%
23%
24%
29%
30%
1%
3%
2%
3%
3%
3%
2%
2%
3%
1%
2%
3%
8%
6%
3%
1%
5%
3%
4%
1%
3%
0%
8%
1%
2%
3%
4%
0% 10% 20% 30% 40% 50% 60% 70% 80% 90% 100%
New York
Los Angeles
Chicago
Dallas
Philadelphia
Houston
Miami
Washington
Atlanta
Boston
Detroit
San Francisco
Phoenix
Riverside
Seattle
Minneapolis
San Diego
St. Louis
Tampa
Baltimore
Denver
Pittsburgh
Portland
Cincinnati
Cleveland
25 metro areas
United States
Managerial and professional specialty occupations Technical, sales, and administrative support occupations Service occupations Blue-collar occupations Farming, fishing, and forestry
Immigrant occupations in 25 largest metro areas 2006-08
Across the Spectrum
FPI April 2010 4
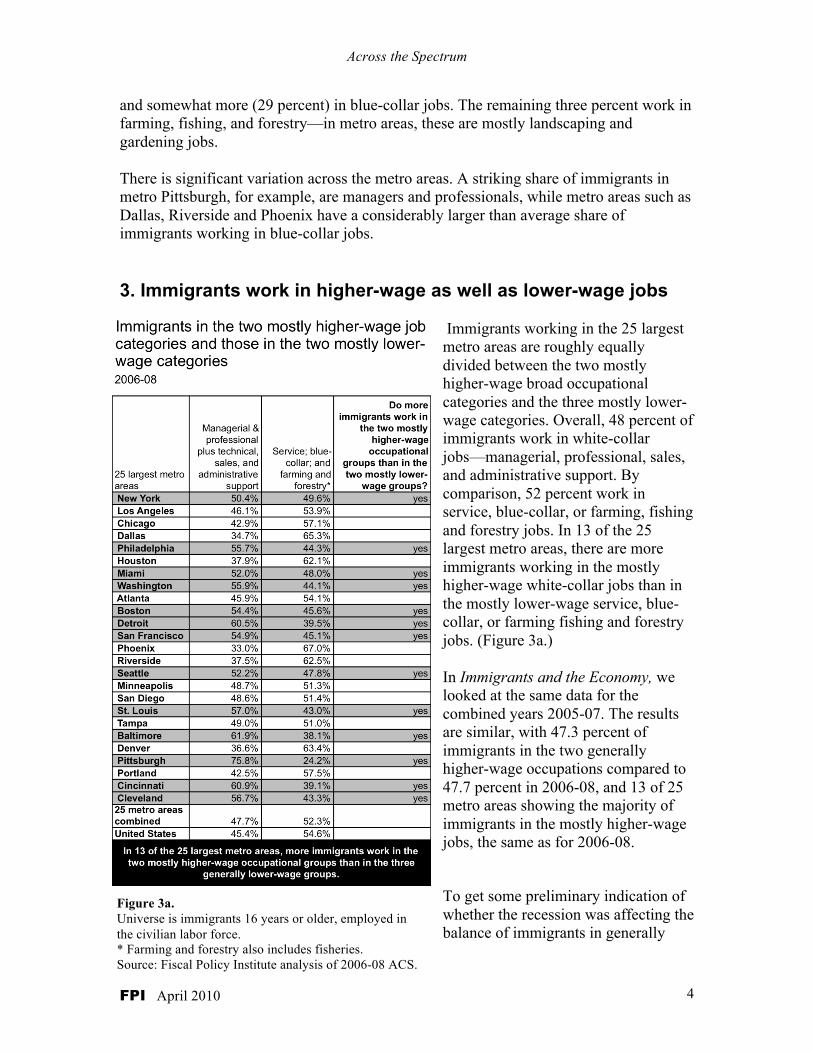
and somewhat more (29 percent) in blue-collar jobs. The remaining three percent work in farming, fishing, and forestry—in metro areas, these are mostly landscaping and gardening jobs. There is significant variation across the metro areas. A striking share of immigrants in metro Pittsburgh, for example, are managers and professionals, while metro areas such as Dallas, Riverside and Phoenix have a considerably larger than average share of immigrants working in blue-collar jobs. 3. Immigrants work in higher-wage as well as lower-wage jobs
Immigrants working in the 25 largest metro areas are roughly equally divided between the two mostly higher-wage broad occupational categories and the three mostly lower-wage categories. Overall, 48 percent of immigrants work in white-collar jobs—managerial, professional, sales, and administrative support. By comparison, 52 percent work in service, blue-collar, or farming, fishing and forestry jobs. In 13 of the 25 largest metro areas, there are more immigrants working in the mostly higher-wage white-collar jobs than in the mostly lower-wage service, blue-collar, or farming fishing and forestry jobs. (Figure 3a.) In Immigrants and the Economy, we looked at the same data for the combined years 2005-07. The results are similar, with 47.3 percent of immigrants in the two generally higher-wage occupations compared to 47.7 percent in 2006-08, and 13 of 25 metro areas showing the majority of immigrants in the mostly higher-wage jobs, the same as for 2006-08.
To get some preliminary indication of whether the recession was affecting the balance of immigrants in generally
Figure 3a. Universe is immigrants 16 years or older, employed in the civilian labor force. * Farming and forestry also includes fisheries. Source: Fiscal Policy Institute analysis of 2006-08 ACS.

Across the Spectrum
FPI April 2010 5
higher-wage jobs, we also looked at data for the single year of 2008. The ACS asks respondents throughout the year about earnings over the previous 12 months, so 2008 data reflect earnings in 2007 as well. For this reason, and because some areas did not enter the recession until mid 2008, the data do not capture the recession very well. What the 2008 data show is consistent with the other two samples. In 2008, the share of immigrants in mostly higher-wage jobs is 48.1 percent, and the number of metro areas in which the majority of immigrants work in mostly higher-wage occupations is 14—one
more than in the 2006-08 sample because of a very slight increase in the share of immigrants in higher-wage jobs in metro Tampa. To get a true picture of whether this is affected by the recession will require data from the not-yet-released 2009 ACS. What’s clear from this broad overview is that immigrants are spread across the occupational spectrum; they are not concentrated just or even primarily in low-wage jobs. At the same time, it is important to note that immigrants are still not as likely as U.S.-born workers to be in higher-wage jobs. For a discussion of how immigrants fare compared to U.S.-born workers, please see Immigrants and the Economy.
Figure 3b. Universe is immigrants 16 years or older, employed in the civilian labor force. * Farming and forestry also includes fishing. Source: Fiscal Policy Institute analysis of 2008 ACS.

Across the Spectrum
FPI April 2010 6
4. A closer look: detailed occupations of immigrants Broad occupational categories allow for an overview of many metro areas at the same time. The detailed occupations that fit into those broad categories give a more in-depth view of where immigrants work. In the 25 metro areas combined, 11 percent of all immigrants work in executive, administrative, and managerial jobs—the largest of any single occupation. Another 10 percent work in administrative support jobs, followed by 7 percent each in food preparation services and skilled construction trades jobs (such as carpenters or electricians). (Figure 4.)
Very few immigrants are firefighters, police, or supervisors of protective services, but immigrants are otherwise spread widely across all occupations. These 21 detailed occupations fit into the 5 broad occupational categories in Figure 2, according to the color coding of the bars. Detailed occupations may not sum exactly to broad categories because of rounding. For a full breakdown of the occupational categories, see Appendix B of Immigrants and the Economy.
Figure 4. Universe is immigrants 16 years or older, employed in the civilian labor force. Farming, fishing and forestry includes landscaping and gardeners. Source: Fiscal Policy Institute analysis of 3-year data, 2006-2008 ACS.
Immigrant occupations in 25 largest metro areas Detailed occupations, 2006-08
11%
5%
2%
6%
4%
4%
6%
10%
6%
0.4%
4%
7%
3%
3%
7%
2%
4%
2%
4%
6%
3%
0% 3% 6% 9% 12% 15%
Executive, administrative, managerial
Professional specialty (incl. doctors, engineers, lawyers)
Registered nurses, pharmacists, and health therapists
Teachers, professors, librarians, social scientists, social workers, & artists
Technicians (incl.health, engineering & science)
Sales (supervisors, real estate, finance & insurance)
Sales (clerks & cashiers)
Administrative support (incl. clerical)
Private household & personal service
Firefighters, police & supervisors of protective services
Guards, cleaning, and building services
Food preparation services
Dental, health, & nursing aides
Mechanics & repairers
Construction trades
Precision production
Machine operators
Fabricators
Drivers (incl. heavy equiptment operators)
Construction laborers & other material handlers
Farming, forestry & agriculture

Across the Spectrum
FPI April 2010 7
The share of immigrants in higher-skilled jobs is even more pronounced in a handful of metro areas where the overall number of immigrants is rather small. In Pittsburgh, with the highest concentration of immigrants in the higher-wage jobs, 16 percent of all immigrants work in executive, administrative, and managerial positions, and another 20 percent work in the professional specialties. (See appendix.)
In St. Louis, another metro area with a very high share of immigrants in highly skilled jobs, ten percent of immigrants work in executive, administrative and managerial jobs, another 14 percent in the professional specialties, and another 7 percent each as technicians and in the category that includes teachers, professors, librarians, social workers, and artists. (Figure 5.)
Figure 5. Universe is immigrants 16 years or older, employed in the civilian labor force. In metro St. Louis, differences between numbers less than three percent are not statistically significant. Source: Fiscal Policy Institute analysis of 3-year data, 2006-08 ACS.
10%
14%
2%
7%
7%
4%
5%
7%
6%
0.3%
3%
8%
2%
3%
3%
3%
4%
2%
3%
3%
3%
0% 3% 6% 9% 12% 15%
Executive, administrative, managerial
Professional specialty (incl. doctors, engineers, lawyers)
Registered nurses, pharmacists, and health therapists
Teachers, professors, librarians, social scientists, social workers, & artists
Technicians (incl.health, engineering & science)
Sales (supervisors, real estate, finance & insurance)
Sales (clerks & cashiers)
Administrative support (incl. clerical)
Private household & personal service
Firefighters, police & supervisors of protective services
Guards, cleaning, and building services
Food preparation services
Dental, health, & nursing aides
Mechanics & repairers
Construction trades
Precision production
Machine operators
Fabricators
Drivers (incl. heavy equiptment operators)
Construction laborers & other material handlers
Farming, forestry & agriculture
Immigrant occupations in St.Louis metro area Detailed occupations, 2006-08

Across the Spectrum
FPI April 2010 8
At the other end of the spectrum is a metro area such as Dallas. There, the occupation with the largest number of immigrants is skilled construction trades (13 percent), with another 10 percent working as construction laborers or other materials movers. (Figure 6.) Yet, even in metro Dallas, a significant number of immigrants work in higher-skilled jobs. Eight percent of immigrant workers in metro Dallas are employed in executive, administrative, and managerial jobs, for example—the same number as are employed in food preparation services.
A table with data for each of the 25 largest metro areas is in the appendix to this report. Charts for individual metro areas based on the data here are available upon request. Figure 6.
Universe is immigrants 16 years or older, employed in the civilian labor force. Source: Fiscal Policy Institute analysis of 3-year data, 2006-2008 ACS.
8%
4%
1%
4%
3%
3%
4%
7%
5%
0.1%
4%
8%
1%
4%
13%
3%
6%
4%
5%
10%
3%
0% 3% 6% 9% 12% 15%
Executive, administrative, managerial
Professional specialty (incl. doctors, engineers, lawyers)
Registered nurses, pharmacists, and health therapists
Teachers, professors, librarians, social scientists, social workers, & artists
Technicians (incl.health, engineering & science)
Sales (supervisors, real estate, finance & insurance)
Sales (clerks & cashiers)
Administrative support (incl. clerical)
Private household & personal service
Firefighters, police & supervisors of protective services
Guards, cleaning, and building services
Food preparation services
Dental, health, & nursing aides
Mechanics & repairers
Construction trades
Precision production
Machine operators
Fabricators
Drivers (incl. heavy equiptment operators)
Construction laborers & other material handlers
Farming, forestry & agriculture
Immigrant occupations in Dallas metro area Detailed occupations, 2006-08

Across the Spectrum
FPI April 2010 9
5. Legal status makes a difference The analysis so far has included all immigrants, documented and undocumented. Below, we use data from the Pew Hispanic Center to look at undocumented immigrants. Immigrants who are not authorized to work in the United States are far more likely to be in lower-skilled jobs than immigrants overall. In general, undocumented immigrants have lower educational levels than legal immigrants, and employers of higher-skilled workers may be less likely to risk hiring undocumented immigrants. Nonetheless, it is worth noting that not all undocumented immigrants are in jobs requiring lower skill levels. The Pew Hispanic Center has estimated that about four percent of undocumented immigrants (also called “unauthorized immigrants”) work in management, business, and finance. Another five percent work in professional and related jobs. Far more, of course, work in generally lower-wage jobs in services (30 percent), construction (21 percent), and production (12 percent). The data source and occupational categories are different than those used in the FPI study, so the numbers cannot be directly compared, but the overall relationship is clear: most immigrants work in lower-skilled jobs, but the number in higher-skilled jobs is not trivial. (Figure 7.) As Jeffrey S. Passel of the Pew Hispanic Center explains it, “The large majority of
Figure 7. Source: “A Portrait of Unauthorized Immigrants in the United States,” Jeffrey S. Passel and D'Vera Cohn, Pew Research Center, 2009. Based on 2008 CPS March Supplement.
Unauthorized immigrants are mostly, but far from all, in lower-skilled jobs

Across the Spectrum
FPI April 2010 10
unauthorized immigrants work in low-skilled occupations. But there are a number, for example students who have overstayed visas or unauthorized immigrants who have started businesses, who work in higher-skilled jobs.”

Across the Spectrum
FPI April 2010 11
6. Variation by country of origin Figure 8 shows the broad occupational categories of immigrants by country of birth, with the countries listed in descending order of the number of immigrants from each country working in the 25 largest metro areas. Mexican, Salvadoran, Dominican, and Honduran workers are clearly more concentrated among blue-collar and service jobs. Immigrants from the Philippines, Korea, Canada,
Figure 8. Universe is immigrants 16 years or older employed in the civilian labor force. In metro areas, farming, fishing and forestry jobs are largely in landscaping and gardening. Source: Fiscal Policy Institute analysis of 2006-08 ACS.
7%
38%
50%
8%
37%
23%
24%
40%
14%
8%
26%
24%
17%
55%
24%
12%
20%
8%
47%
34%
35%
24%
36%
14%
32%
36%
16%
26%
25%
30%
34%
24%
14%
28%
27%
23%
28%
20%
20%
27%
13%
29%
26%
28%
23%
33%
24%
17%
5%
31%
22%
24%
16%
13%
34%
28%
28%
24%
37%
7%
20%
26%
26%
30%
12%
17%
18%
21%
13%
48%
12%
9%
40%
15%
27%
29%
13%
28%
44%
18%
24%
21%
9%
35%
40%
26%
46%
11%
23%
19%
29%
16%
7%
0%
0%
4%
0%
1%
1%
0%
1%
7%
1%
1%
2%
1%
0%
1%
1%
3%
1%
1%
1%
3%
1%
0% 10% 20% 30% 40% 50% 60% 70% 80% 90% 100%
Mexico Philippines
India El Salvador
China Vietnam
Cuba Korea
Dominican Republic Guatemala
Jamaica Colombia
Haiti Canada Poland
Ecuador Peru
Honduras Germany
Italy All other immigrants
All immigrants All U.S.-born
Managerial and professional specialty occupations Technical, sales, and administrative support occupations Service occupations Blue-collar occupations Farming, fishing, and forestry
Jobs of immigrants by country of birth 25 metro areas combined, 2006-08

Across the Spectrum
FPI April 2010 12
Russia, and Germany are clearly more concentrated among white-collar jobs. The overall balance of immigrant occupations is roughly matched among immigrants from countries such as Jamaica, Colombia, and Poland. Immigrants come from all around the world to work in the country’s 25 largest metro areas. Workers born in Mexico make up 27 percent of all immigrants working in the 25 largest metro areas. But after Mexico, no single country predominates: the next-largest countries of birth are the Philippines, India, El Salvador, and China, each with four percent of all immigrants working in the 25 largest metro areas. There are three percent or less from a wide range of other countries. 7. Education levels of immigrant workers Figure 9 shows the range of education levels of immigrants and U.S.-born workers. Economic analyses of immigration frequently focus on low-skilled immigrants. While that is appropriate in gauging the labor market impacts in particular parts of the economy,
Figure 9. Universe is immigrants 16 years and older, employed in the civilian labor force. Source: Fiscal Policy Institute analysis of 2006-08 ACS.
About half of immigrant workers have at least some college education

Across the Spectrum
FPI April 2010 13
it is also important to recognize that this is a very partial view of the role of immigrants in the economy. In the 25 largest metro areas combined, exactly half of immigrants have at least some college education, while the other half have a high school degree or less. The number with at least some college varies from lows in Phoenix (34 percent) and Dallas (35 percent) to highs in Baltimore (69 percent) and Pittsburgh (79 percent). Immigrants are by no means just or even primarily workers with low levels of education. On the other hand, it is also clear that U.S.-born workers have considerably higher educational levels than immigrants in almost all metro areas. The exceptions are Baltimore, Pittsburgh, Cincinnati, and Cleveland—again, slower-growing metro areas with relatively small overall levels of immigration. 8. Immigration and economic growth Immigrants and the Economy examined the relationship of immigration to economic growth. Figure 10a updates this analysis using data from the 2008 ACS. The analysis of 2008 data shows the same general pattern as the analysis of 2005-07 data in Immigrants and the Economy: immigration and economic growth of metro areas go hand in hand. Where there is faster economic growth, the immigrant share of the labor force increases faster, and conversely where there is slow economic growth there is modest growth in immigrant share of the labor force. This is particularly true at the two ends of the growth spectrum. The fastest-growing metro areas—Phoenix, Denver, Atlanta, Portland, Houston, Dallas—all have very strong growth in immigrant share of the labor force. On the other hand, the slowest-growing metro areas—Cleveland, Pittsburgh and Detroit—have among the slowest growth in immigrant share of the economy. That is not to say that immigration causes growth, but rather that immigration is part of the story of economic growth. Immigrants are drawn by economic expansion, and once they are in a metro area they earn and spend money, expand consumer demand, start small businesses to meet new needs, and fuel further growth. It should be noted that economic growth does not guarantee that pay or other employment conditions improve significantly for workers. A metro area such as Pittsburgh may be eager for more residents and workers to help expand the tax base. But Pittsburgh residents will also be concerned about whether that growth is good for their wages. Figure 10a shows that growth in earnings per worker can go up together with overall growth, as in Phoenix and Denver; or, earnings per worker can move very slowly even with overall economic growth, as in metro Riverside. Other local conditions besides just immigration play a more important role in determining whether or not wages go up. Certainly economic growth and immigration growth are not incompatible with strong wage increases, but neither do they guarantee strong increases.

Across the Spectrum
FPI April 2010 14
Similarly, it is important to note that economic growth in the short term can cause problems in the long term. The economic growth of metro Phoenix, for example, was clearly part of an unsustainable housing bubble. Immigrants were drawn to and contributed to this bubble economy, but it could hardly be argued that they created it. Because the Great Recession has had a dramatic impact that is not uniform across metro areas, we also reproduced the same chart using just the 2008 ACS. As noted above, the 2008 ACS does not capture the full impact of the recession. Many metro areas were
Growth in immigrant share of labor force and metro area economic growth go hand in hand 1990 to 2006-08
Figure 10a. Source: FPI analysis of 1990 Census and 2006-08 3-year ACS data. Growth is measured in inflation-adjusted dollars. Universe for labor force is people 16 years of age and older and in the civilian labor force. Growth in earnings per worker based on wage and salary earnings for workers employed in the civilian labor force aged 16 and older reporting at least $100 in wage and salary income. Universe for proprietors’ income is people 16 and older who reported proprietors' income. Economic growth of metro area is measured as percent growth in aggregate wage and salary earnings plus proprietors' income. Earnings per worker divides aggregate earnings by total civilian labor force. The denominator thus includes employees, self-employed workers, and business owners, as well as unemployed workers.

Across the Spectrum
FPI April 2010 15
expanding for part of 2008 and in recession for part of the year, and the ACS asks respondents about earnings in the previous 12 months, so the data from the 2008 ACS partly reflect 2007 earnings. As a result, while the data in Figure 10b do not show the effects of the recession, they do indicate that the findings about the correlation of immigration and growth are robust. The findings noted above hold generally true for Figure 10b as well. Comparing the findings on growth with the findings in Figure 2 on occupations held by immigrants, it is interesting to see that many of the slowest-growing metro areas are the
Growth in immigrant share of labor force and metro area economic growth go hand in hand 1990 to 2008
Figure 10b. Source: FPI analysis of 1990 Census and 2008 ACS data. Growth is measured in inflation-adjusted dollars. Universe for labor force is people 16 years of age and older and in the civilian labor force. Growth in earnings per worker based on wage and salary earnings for workers employed in the civilian labor force aged 16 and older reporting at least $100 in wage and salary income. Universe for proprietors’ income is people 16 and older who reported proprietors' income. Economic growth of metro area is measured as percent growth in aggregate wage and salary earnings plus proprietors’ income. Earnings per worker divides aggregate earnings by total civilian labor force. The denominator thus includes employees, self-employed workers, and business owners, as well as unemployed workers.

Across the Spectrum
FPI April 2010 16
ones where the largest share of immigrants are in higher-wage jobs. What is perhaps surprising at first blush is clearer upon further analysis. Metro areas such as Cleveland, Pittsburgh, or Detroit have comparatively few immigrants. Institutions there such as universities, hospitals, and large companies draw on a global talent pool for doctors, engineers, and executives as do similar institutions around the country. Yet, with very little overall economic growth, immigrants looking for jobs in restaurants or construction are not likely to come to these metro areas. Perhaps more appropriate than saying these metro areas have a large share of highly skilled immigrants would be to say that they have a missing cohort of low-skilled immigrants. In metro Cleveland, for example, there are about 9,000 immigrants working in executive, administrative or managerial jobs, and another 8,000 in professional specialties. Both are considerably smaller numbers than in most metro areas. But, with few immigrants overall, these two detailed occupations alone make up 17,000 out of the 66,000 immigrants working in metro Cleveland.

Across the Spectrum
FPI April 2010 17
Conclusion It is a popular misconception that immigrants are overwhelmingly concentrated in construction, food service, janitorial, or other low-wage jobs. While there are indeed many immigrants working in each of these jobs, in the 25 largest metro areas combined there are about as many immigrants working in white-collar jobs as there are in blue-collar, service, farming, fishing and forestry jobs combined. In 14 of the 25 largest metro areas, there are more immigrants in white-collar jobs than in all other jobs combined. Immigration is also closely connected with metro area economic growth. In areas where the economy has grown significantly over the past two decades, immigration has also grown significantly; in places where the economy has not grown as much, neither has immigration. This close association of immigration and growth is readily explained: immigrants go where there are jobs, and when they do they earn money, buy goods and services, bring new ideas, start businesses, and generally contribute to economic growth. This is not to say that immigrants cause growth, but rather that immigration and economic growth go hand in hand. It is also important to bear in mind that economic growth is not always accompanied by strong growth in wages or improvements in working conditions for workers. Strong growth in immigrant share of the labor force can be compatible with strong growth in average earnings, but it is no guarantee of growth in wages, even where the overall metro area economy may be growing quickly. Finally, it is interesting to note that the metro areas where immigrants are most concentrated in higher-wage jobs are also the metro areas that have seen the slowest economic growth over the past two decades. Of course, this is not because more skilled immigrants put a damper on growth. It’s because those metro areas are attracting a modest number of highly skilled immigrants, but very few less-skilled immigrants—understandably enough, since less-skilled immigrants are unlikely to go to metro areas where they would have a very hard time finding jobs.

Across the Spectrum
FPI April 2010 18
Appendix Figure 10 shows the detailed occupations for the 25 largest metropolitan areas of the United States. Charts from this data are available upon request.

Across the Spectrum
FPI April 2010 19
Expert Advisory Panel FPI’s Immigration Research Initiative Algernon Austin, director of the Race, Ethnicity, and the Economy program of the Economic Policy Institute. Muzaffar Chishti, director of the Migration Policy Institute’s office at the New York University School of Law. Gregory DeFreitas, professor of economics and director of the labor studies program, Hofstra University. He is author of Inequality at Work: Hispanics in the U.S. Economy, and editor of Young Workers in the Global Economy.
Maralyn Edid, senior extension associate, Cornell University’s ILR School. Héctor Figueroa, secretary-treasurer, 32BJ of the Service Employees International Union. Nancy Foner, distinguished professor of sociology at Hunter College and the Graduate Center of the City University of New York, and author of From Ellis Island to JFK: New York's Two Great Waves of Immigration and In a New Land: A Comparative View of Immigration. Philip Kasinitz, professor of Sociology, CUNY Graduate Center, and author of Caribbean New York: Black Immigrants and the Politics of Race and co-author (with John H. Mollenkopf, Mary C. Waters, and Jennifer Holdaway) of Inheriting the City: The Children of Immigrants Come of Age.
Peter Kwong, professor of urban affairs, Hunter College, and co-author (with Dušanka Miščević) of Chinese America, The New Chinatown, Forbidden Workers: Illegal Chinese Immigrants and American Labor. Ray Marshall, Former Secretary of Labor, Audre and Bernard Rapoport Centennial Chair in Economics and Public Affairs at the University of Texas, Austin, and chair of the AFL-CIO Immigration Task Force.
John H. Mollenkopf, distinguished professor of Political Science and Sociology at the Graduate Center of the City University of New York and director of the Center for Urban Research, and coauthor (with Philip Kasinitz, Mary C. Waters, and Jennifer Holdaway) of Inheriting the City: The Children of Immigrants Come of Age.
Jeffrey S. Passel, senior demographer, Pew Hispanic Center. Max J. Pfeffer, Professor of Development Sociology at Cornell University.
Rae Rosen, senior economist and assistant vice president, Federal Reserve Bank of New York.
Heidi Shierholz, economist, Economic Policy Institute. Roger Waldinger, distinguished professor of Sociology at UCLA, and author of Strangers at the Gates: New Immigrants in Urban America, Through the Eye of the Needle: Immigrants and Enterprise in New York’s Garment Trades, and Still the Promised City?: African Americans and New Immigrants in Post-Industrial New York.