Embed Size (px)
Citation preview
3Q17 Opportunity Day
1
14 Nov 2017
Prepared by Group Investor Relations
INTOUCH Investment Structure
1)
1) Listed Company on the Stock Exchange of Thailand
40.45% 41.14% 99.99%
1)1)
1)
1) 1)
Mobile: No.1
revenue and
subscriber market
shares
FBB: Started in
2014, covering 28
provinces
Only satellite
operator in
Thailand
5 satellites both
conventional and
broadband
satellites are in
the orbital slot
TV Home
Shopping: Started
in 2016
No.4 revenue
market share
Started in 2012
Focus in TMT area
11 startups under
current investment
51%
2
Prepared by Group Investor Relations
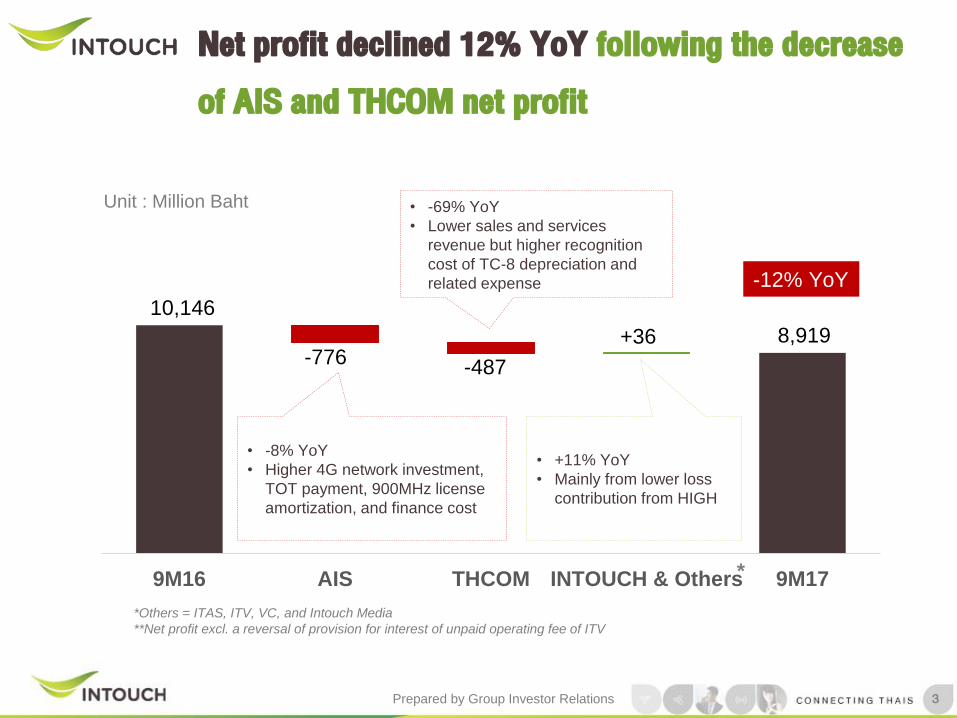
Net profit declined 12% YoY following the decrease of AIS and THCOM net profit
Unit : Million Baht
9M16 AIS THCOM INTOUCH & Others 9M17
*Others = ITAS, ITV, VC, and Intouch Media
**Net profit excl. a reversal of provision for interest of unpaid operating fee of ITV
10,146
-776-487
+36 8,919
*
-12% YoY
• -8% YoY
• Higher 4G network investment,
TOT payment, 900MHz license
amortization, and finance cost
• -69% YoY
• Lower sales and services
revenue but higher recognition
cost of TC-8 depreciation and
related expense
• +11% YoY
• Mainly from lower loss
contribution from HIGH
3
Prepared by Group Investor Relations
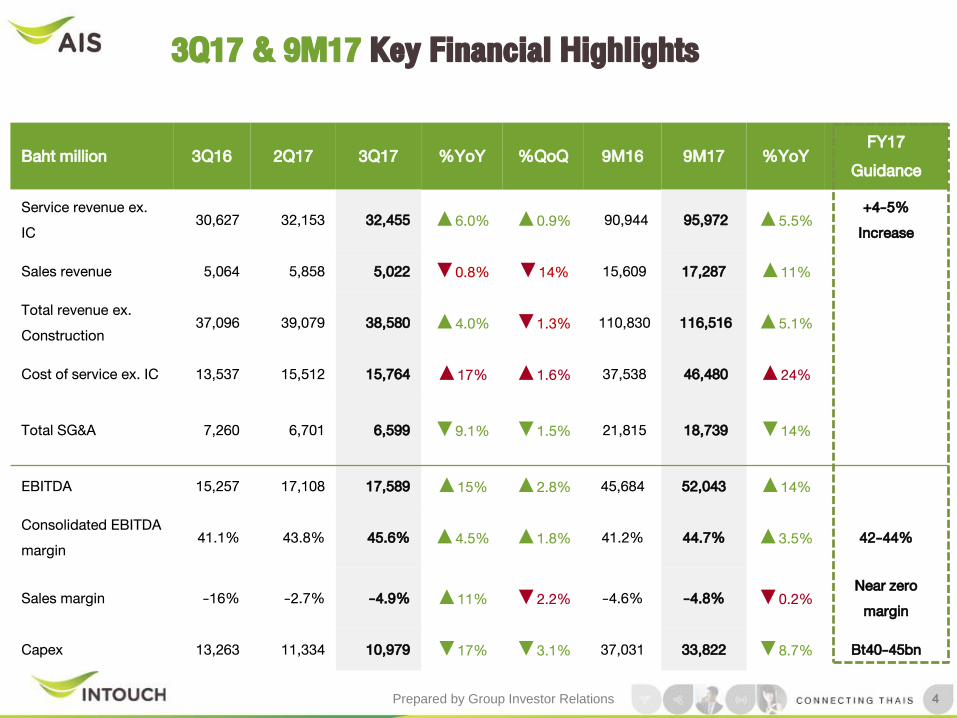
Baht million 3Q16 2Q17 3Q17 %YoY %QoQ 9M16 9M17 %YoYFY17
Guidance
Service revenue ex. IC
30,627 32,153 32,455 ▲6.0% ▲0.9% 90,944 95,972 ▲5.5%+4-5%
Increase
Sales revenue 5,064 5,858 5,022 ▼0.8% ▼14% 15,609 17,287 ▲11%
Total revenue ex. Construction
37,096 39,079 38,580 ▲4.0% ▼1.3% 110,830 116,516 ▲5.1%
Cost of service ex. IC 13,537 15,512 15,764 ▲17% ▲1.6% 37,538 46,480 ▲24%
Total SG&A 7,260 6,701 6,599 ▼9.1% ▼1.5% 21,815 18,739 ▼14%
EBITDA 15,257 17,108 17,589 ▲15% ▲2.8% 45,684 52,043 ▲14%
Consolidated EBITDA margin
41.1% 43.8% 45.6% ▲4.5% ▲1.8% 41.2% 44.7% ▲3.5% 42-44%
Sales margin -16% -2.7% -4.9% ▲11% ▼2.2% -4.6% -4.8% ▼0.2%Near zero
margin
Capex 13,263 11,334 10,979 ▼17% ▼3.1% 37,031 33,822 ▼8.7% Bt40-45bn
3Q17 & 9M17 Key Financial Highlights
4
Prepared by Group Investor Relations
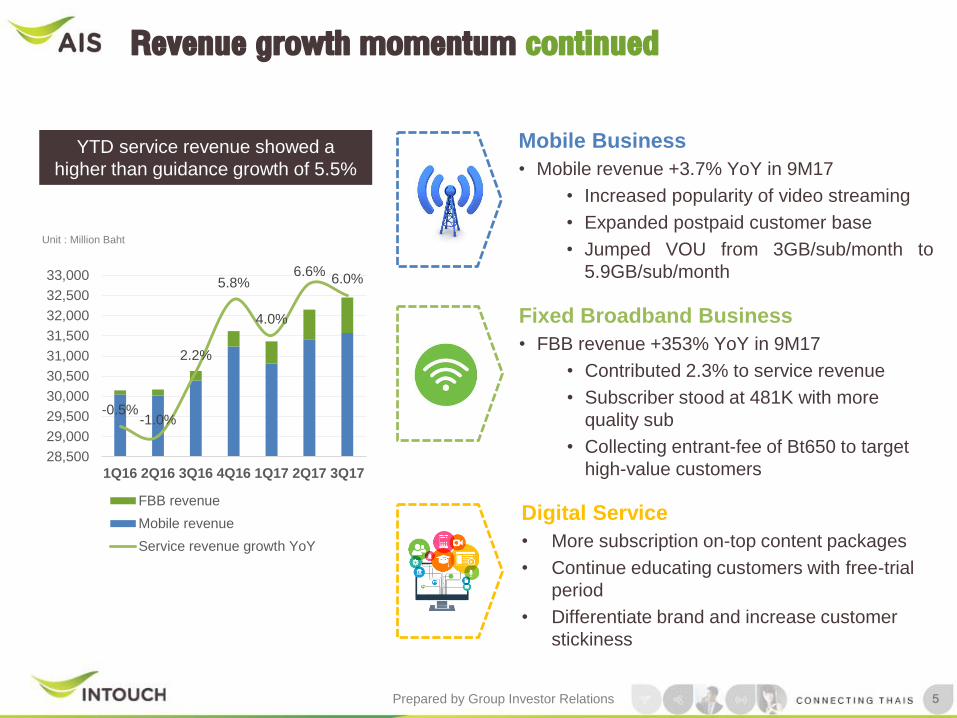
Revenue growth momentum continued
Mobile Business
• Mobile revenue +3.7% YoY in 9M17
• Increased popularity of video streaming
• Expanded postpaid customer base
• Jumped VOU from 3GB/sub/month to
5.9GB/sub/month
Fixed Broadband Business
• FBB revenue +353% YoY in 9M17
• Contributed 2.3% to service revenue
• Subscriber stood at 481K with more
quality sub
• Collecting entrant-fee of Bt650 to target
high-value customers
Digital Service
• More subscription on-top content packages
• Continue educating customers with free-trial
period
• Differentiate brand and increase customer
stickiness
-0.5%-1.0%
2.2%
5.8%
4.0%
6.6%6.0%
28,500
29,000
29,500
30,000
30,500
31,000
31,500
32,000
32,500
33,000
1Q16 2Q16 3Q16 4Q16 1Q17 2Q17 3Q17
FBB revenue
Mobile revenue
Service revenue growth YoY
Unit : Million Baht
YTD service revenue showed a
higher than guidance growth of 5.5%
5
Prepared by Group Investor Relations6
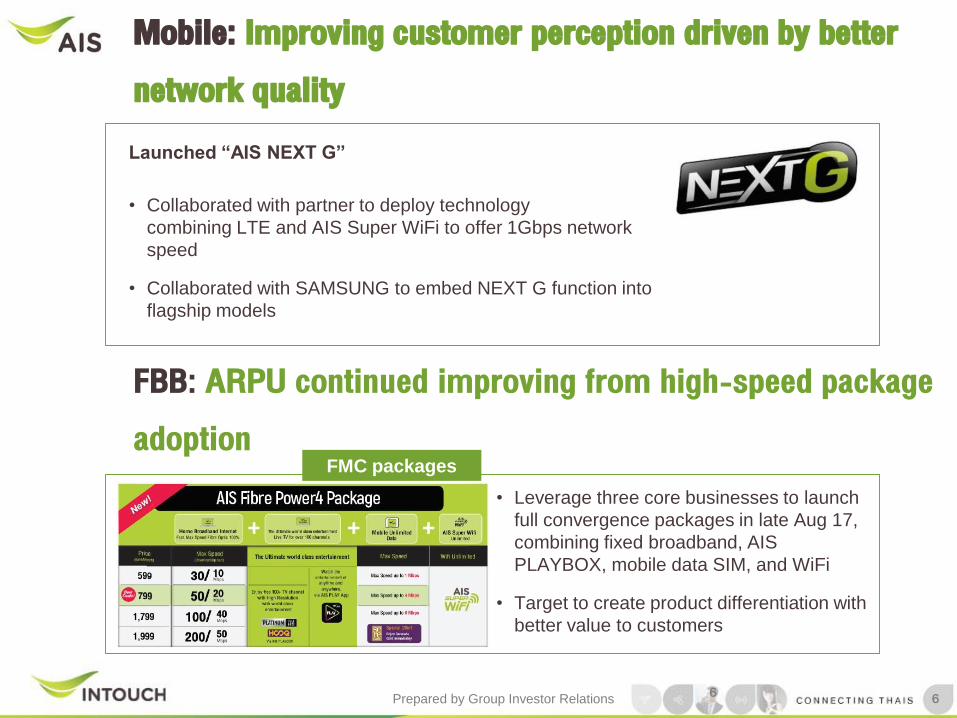
Launched “AIS NEXT G”
• Collaborated with partner to deploy technology
combining LTE and AIS Super WiFi to offer 1Gbps network
speed
• Collaborated with SAMSUNG to embed NEXT G function into
flagship models
Mobile: Improving customer perception driven by better network quality
FMC packages
• Leverage three core businesses to launch
full convergence packages in late Aug 17,
combining fixed broadband, AIS
PLAYBOX, mobile data SIM, and WiFi
• Target to create product differentiation with
better value to customers
FBB: ARPU continued improving from high-speed package adoption
6
Prepared by Group Investor Relations
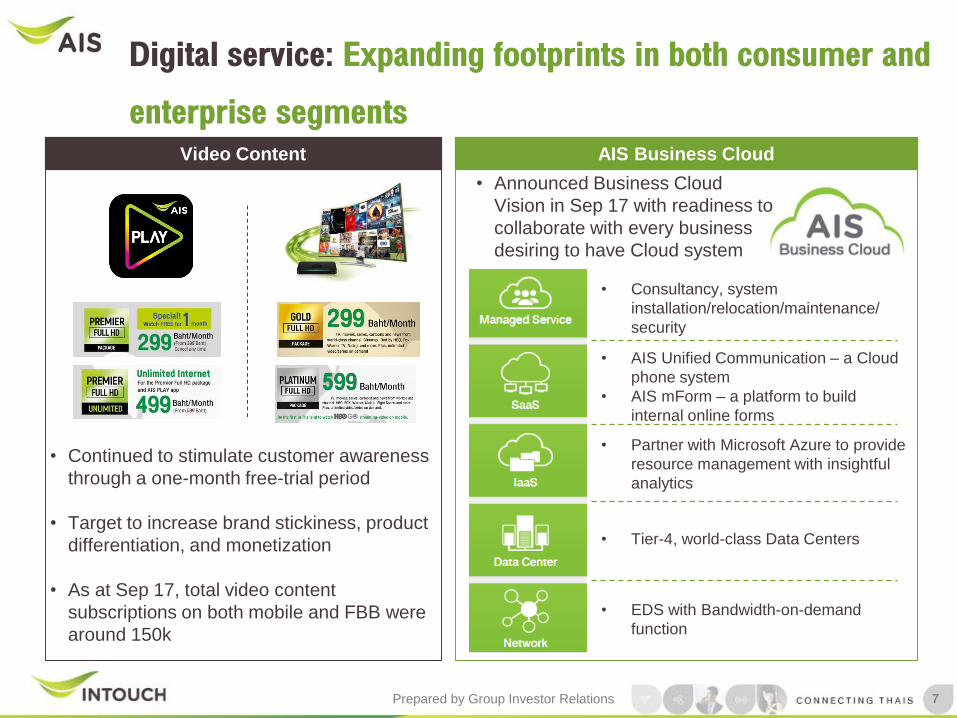
Digital service: Expanding footprints in both consumer and enterprise segments
• Continued to stimulate customer awareness
through a one-month free-trial period
• Target to increase brand stickiness, product
differentiation, and monetization
• As at Sep 17, total video content
subscriptions on both mobile and FBB were
around 150k
• EDS with Bandwidth-on-demand
function
• Announced Business Cloud
Vision in Sep 17 with readiness to
collaborate with every business
desiring to have Cloud system
• Tier-4, world-class Data Centers
• Partner with Microsoft Azure to provide
resource management with insightful
analytics
• AIS Unified Communication – a Cloud
phone system
• AIS mForm – a platform to build
internal online forms
• Consultancy, system
installation/relocation/maintenance/
security
Video Content AIS Business Cloud
7
Prepared by Group Investor Relations
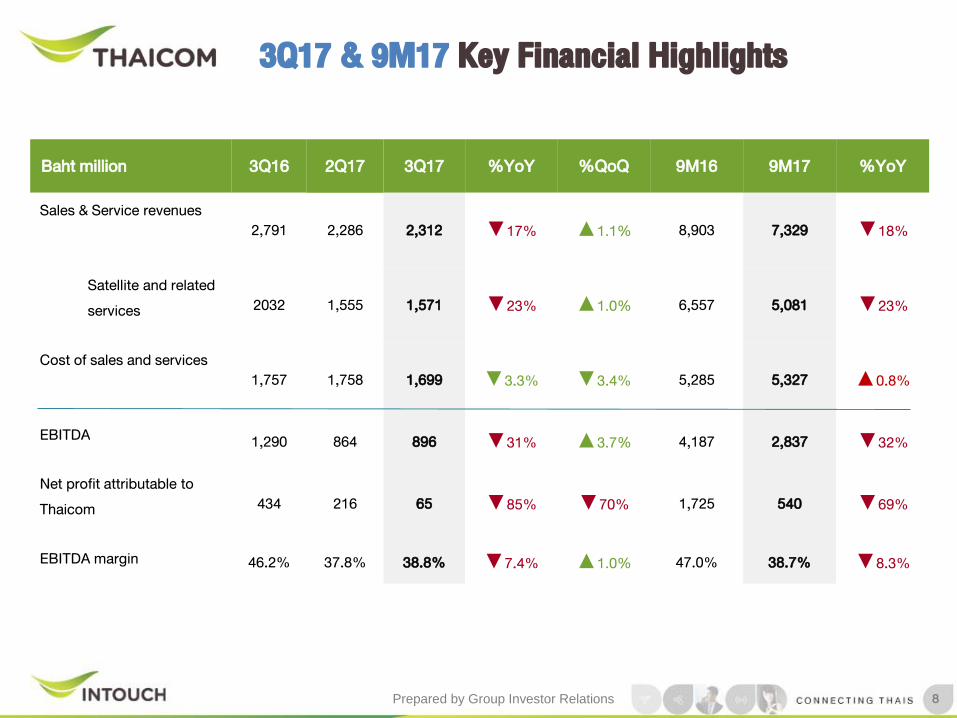
Baht million 3Q16 2Q17 3Q17 %YoY %QoQ 9M16 9M17 %YoY
Sales & Service revenues2,791 2,286 2,312 ▼17% ▲1.1% 8,903 7,329 ▼18%
Satellite and related services 2032 1,555 1,571 ▼23% ▲1.0% 6,557 5,081 ▼23%
Cost of sales and services1,757 1,758 1,699 ▼3.3% ▼3.4% 5,285 5,327 ▲0.8%
EBITDA 1,290 864 896 ▼31% ▲3.7% 4,187 2,837 ▼32%
Net profit attributable to Thaicom 434 216 65 ▼85% ▼70% 1,725 540 ▼69%
EBITDA margin 46.2% 37.8% 38.8% ▼7.4% ▲1.0% 47.0% 38.7% ▼8.3%
3Q17 & 9M17 Key Financial Highlights
8
Prepared by Group Investor Relations
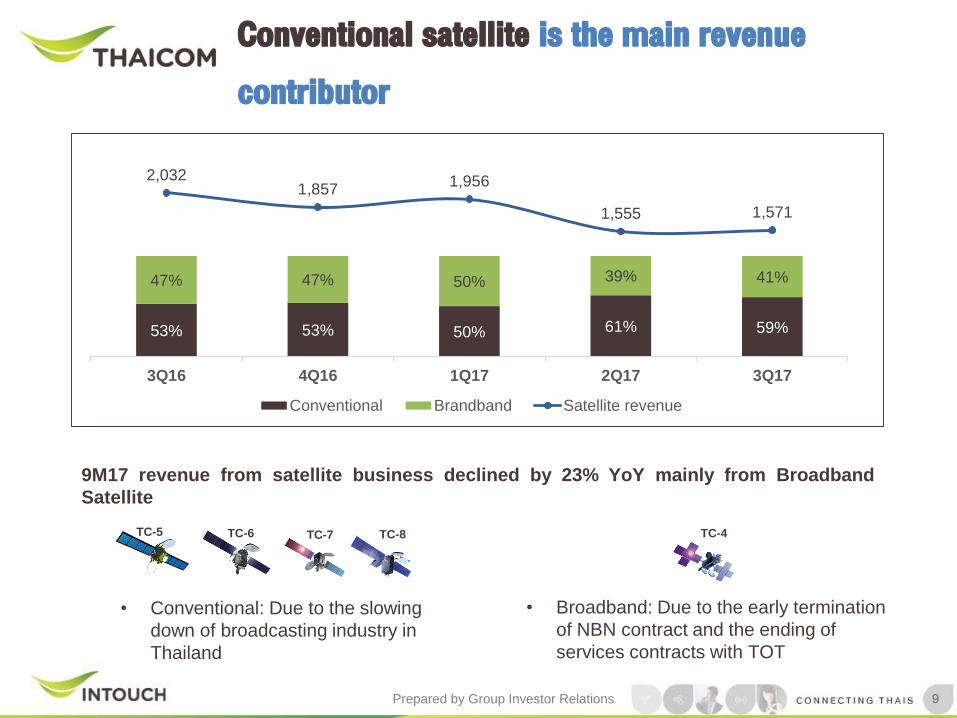
TC-5 TC-6 TC-8 TC-4TC-7
Conventional satellite is the main revenue contributor
53% 53% 50% 61% 59%
47% 47% 50% 39% 41%
2,0321,857
1,956
1,555 1,571
3Q16 4Q16 1Q17 2Q17 3Q17
Conventional Brandband Satellite revenue
• Conventional: Due to the slowing
down of broadcasting industry in
Thailand
9M17 revenue from satellite business declined by 23% YoY mainly from Broadband
Satellite
• Broadband: Due to the early termination
of NBN contract and the ending of
services contracts with TOT
9
Prepared by Group Investor Relations
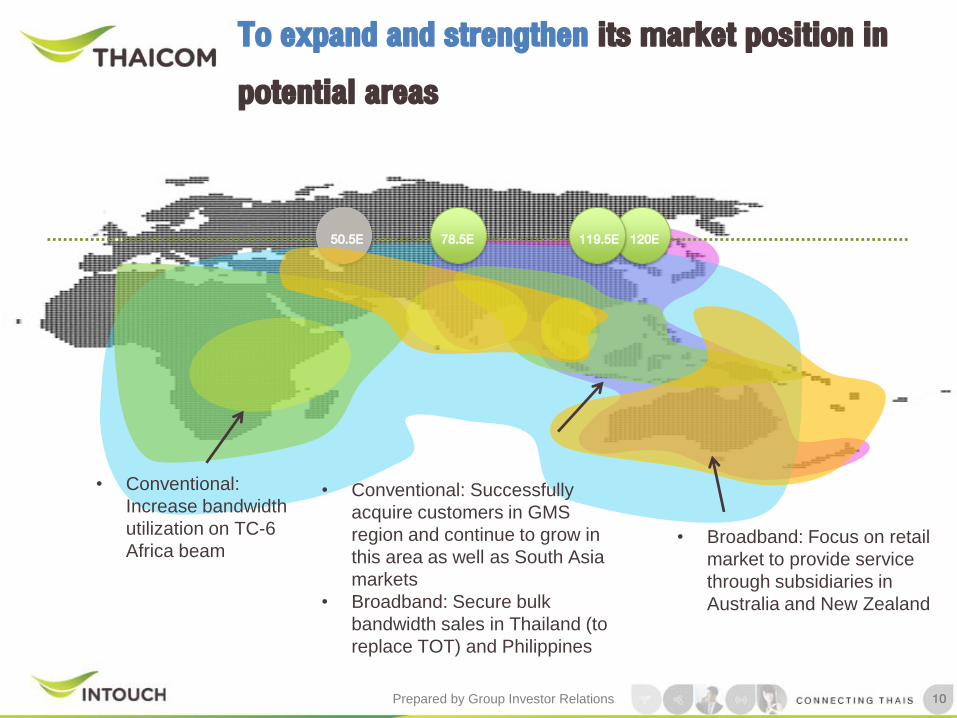
50.5E 78.5E
• Broadband: Focus on retail
market to provide service
through subsidiaries in
Australia and New Zealand
120E119.5E
• Conventional: Successfully
acquire customers in GMS
region and continue to grow in
this area as well as South Asia
markets
• Broadband: Secure bulk
bandwidth sales in Thailand (to
replace TOT) and Philippines
To expand and strengthen its market position in potential areas
• Conventional:
Increase bandwidth
utilization on TC-6
Africa beam
10
Prepared by Group Investor Relations
0.30.70.7
1.01.00.80.9
1.21.21.0
1.51.61.71.71.71.7
1.91.71.6
2.01.8
Jan-1
6
Feb
-16
Ma
r-1
6
Apr-
16
Ma
y-1
6
Jun-1
6
Jul-1
6
Aug-1
6
Sep-1
6
Oct-
16
No
v-1
6
De
c-1
6
Jan-1
7
Feb
-17
Ma
r-1
7
Apr-
17
Ma
y-1
7
Jun-1
7
Jul-1
7
Aug-1
7
Sep-1
7
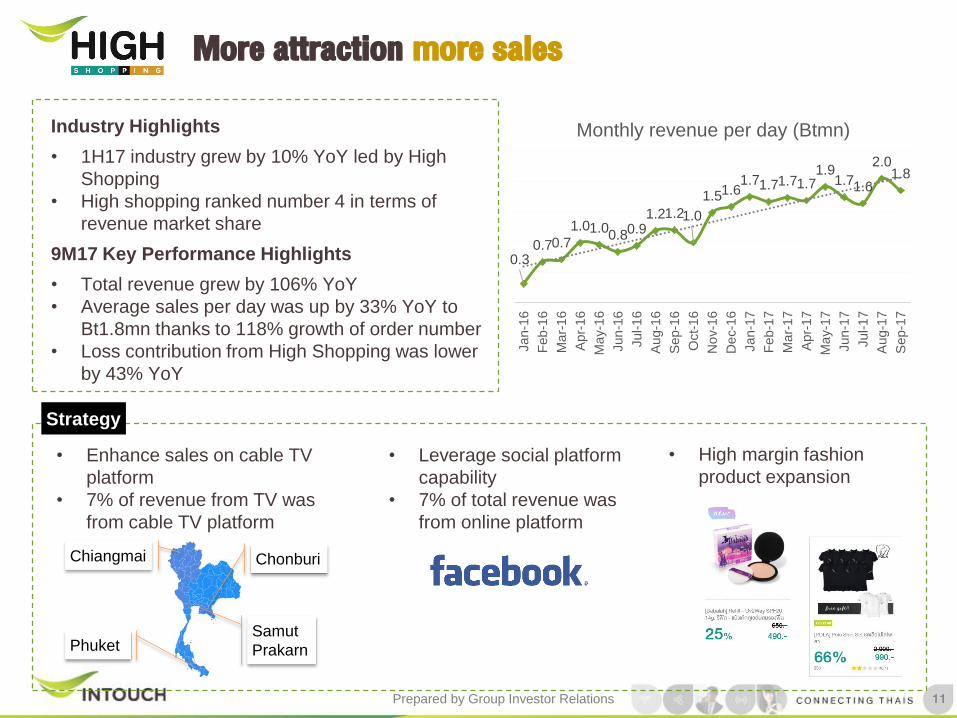
Monthly revenue per day (Btmn)
More attraction more sales
Industry Highlights
• 1H17 industry grew by 10% YoY led by High
Shopping
• High shopping ranked number 4 in terms of
revenue market share
9M17 Key Performance Highlights
• Total revenue grew by 106% YoY
• Average sales per day was up by 33% YoY to
Bt1.8mn thanks to 118% growth of order number
• Loss contribution from High Shopping was lower
by 43% YoY
• Enhance sales on cable TV
platform
• 7% of revenue from TV was
from cable TV platform
Strategy
• Leverage social platform
capability
• 7% of total revenue was
from online platform
• High margin fashion
product expansion
Phuket
ChonburiChiangmai
Samut
Prakarn
11
Prepared by Group Investor Relations
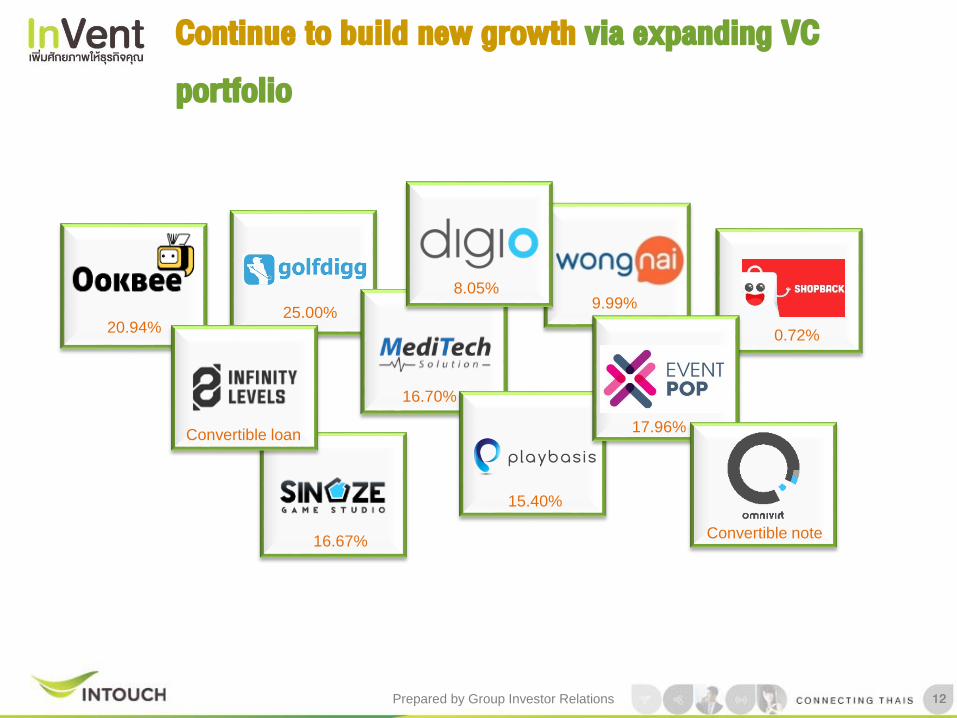
Continue to build new growth via expanding VC portfolio
20.94%
Convertible loan
16.67%
15.40%
17.96%
0.72%
9.99%8.05%
25.00%
16.70%
Convertible note
12
Prepared by Group Investor Relations 13
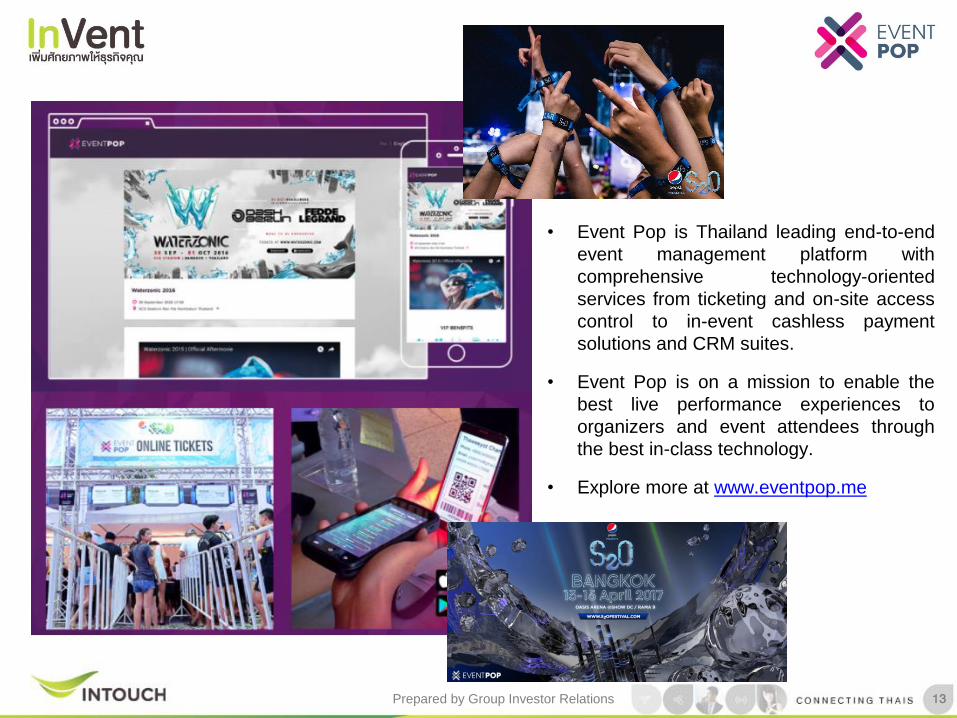
• Event Pop is Thailand leading end-to-end
event management platform with
comprehensive technology-oriented
services from ticketing and on-site access
control to in-event cashless payment
solutions and CRM suites.
• Event Pop is on a mission to enable the
best live performance experiences to
organizers and event attendees through
the best in-class technology.
• Explore more at www.eventpop.me
Prepared by Group Investor Relations 14
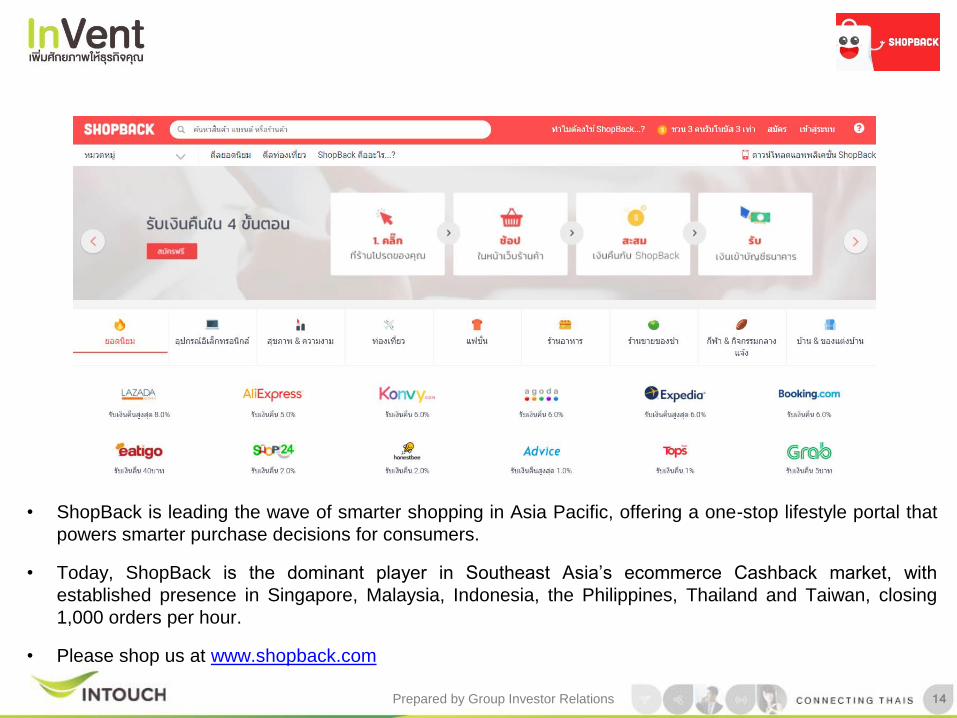
• ShopBack is leading the wave of smarter shopping in Asia Pacific, offering a one-stop lifestyle portal that
powers smarter purchase decisions for consumers.
• Today, ShopBack is the dominant player in Southeast Asia’s ecommerce Cashback market, with
established presence in Singapore, Malaysia, Indonesia, the Philippines, Thailand and Taiwan, closing
1,000 orders per hour.
• Please shop us at www.shopback.com

Q&A
15

Prepared by Group Investor Relations
Appendix
16
Prepared by Group Investor Relations
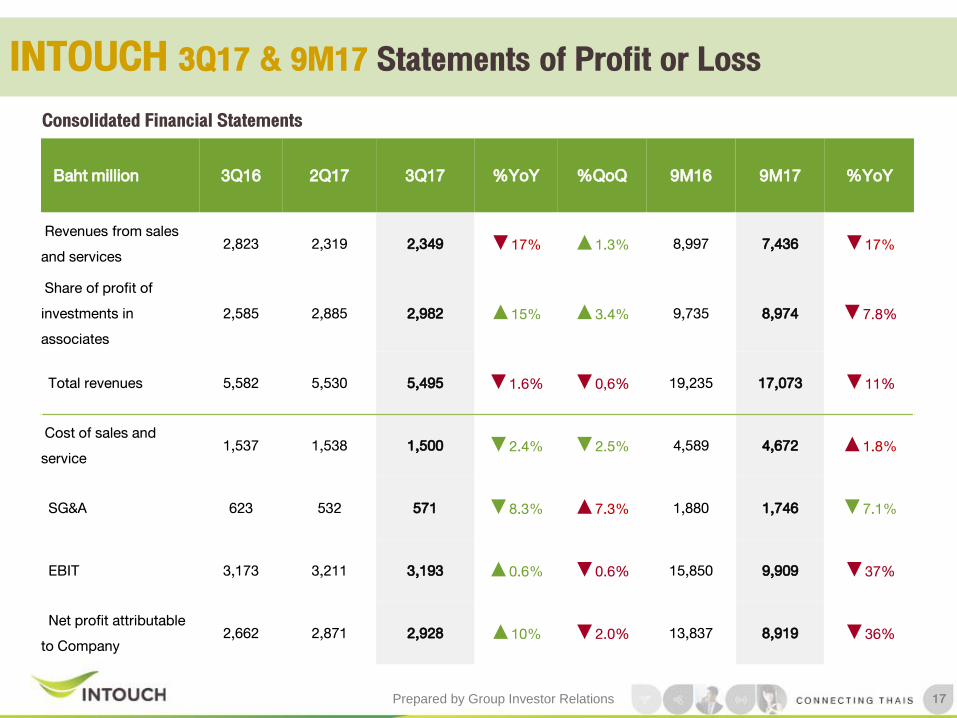
Baht million 3Q16 2Q17 3Q17 %YoY %QoQ 9M16 9M17 %YoY
Revenues from sales and services
2,823 2,319 2,349 ▼17% ▲1.3% 8,997 7,436 ▼17%
Share of profit of investments in associates
2,585 2,885 2,982 ▲15% ▲3.4% 9,735 8,974 ▼7.8%
Total revenues 5,582 5,530 5,495 ▼1.6% ▼0,6% 19,235 17,073 ▼11%
Cost of sales and service
1,537 1,538 1,500 ▼2.4% ▼2.5% 4,589 4,672 ▲1.8%
SG&A 623 532 571 ▼8.3% ▲7.3% 1,880 1,746 ▼7.1%
EBIT 3,173 3,211 3,193 ▲0.6% ▼0.6% 15,850 9,909 ▼37%
Net profit attributable to Company
2,662 2,871 2,928 ▲10% ▼2.0% 13,837 8,919 ▼36%
INTOUCH 3Q17 & 9M17 Statements of Profit or LossConsolidated Financial Statements
17
Prepared by Group Investor Relations
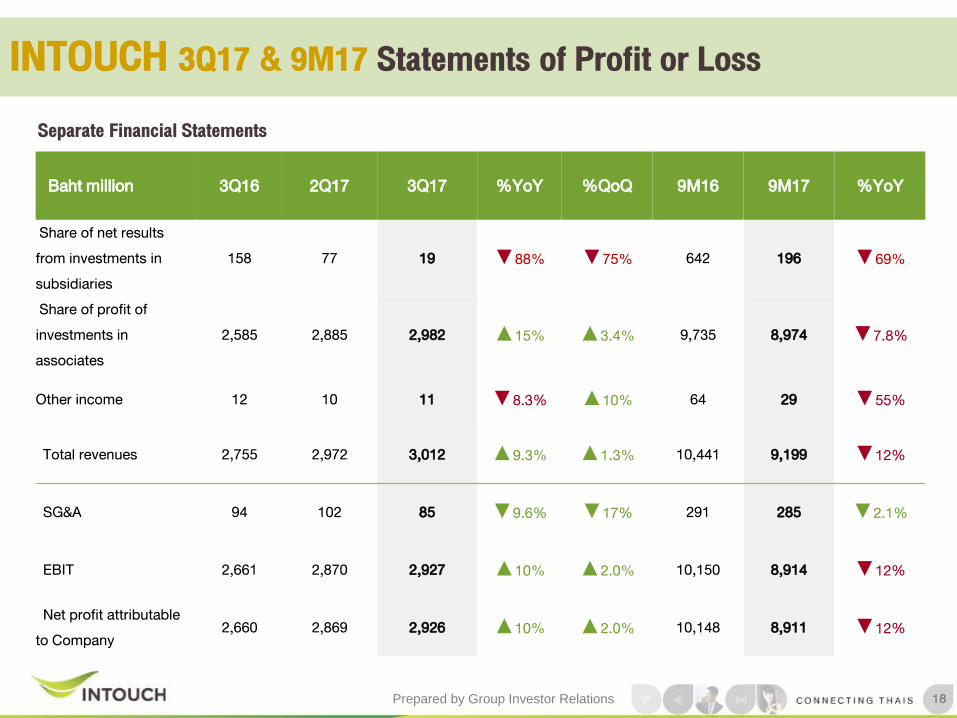
Baht million 3Q16 2Q17 3Q17 %YoY %QoQ 9M16 9M17 %YoY
Share of net results from investments in subsidiaries
158 77 19 ▼88% ▼75% 642 196 ▼69%
Share of profit of investments in associates
2,585 2,885 2,982 ▲15% ▲3.4% 9,735 8,974 ▼7.8%
Other income 12 10 11 ▼8.3% ▲10% 64 29 ▼55%
Total revenues 2,755 2,972 3,012 ▲9.3% ▲1.3% 10,441 9,199 ▼12%
SG&A 94 102 85 ▼9.6% ▼17% 291 285 ▼2.1%
EBIT 2,661 2,870 2,927 ▲10% ▲2.0% 10,150 8,914 ▼12%
Net profit attributable to Company
2,660 2,869 2,926 ▲10% ▲2.0% 10,148 8,911 ▼12%
INTOUCH 3Q17 & 9M17 Statements of Profit or LossSeparate Financial Statements
18

Prepared by Group Investor Relations
Baht millionConsolidated Separate
Dec-16 Sep-17 Dec-16 Sep-17Cash & cash equivalents and current investment
9,160 8,376 1,751 2,224
Investments in subsidiaries and associates
- - 26,340 25,823
Investments in associates and joint ventures
19,897 19,565 - -
Property and equipment 9,441 8,957 - -
Intangible assets under operating agreements
9,205 7,692 - -
Other assets 6,904 6,217 98 101Total assets 54,607 50,807 28,189 28,148
Interest-bearing debt 10,168 7,740 - -
Other liabilities 6,764 5,952 136 414Total liabilities 16,932 13,692 136 414Total shareholders’ equity 37,675 37,115 28,053 27,734Net profit attributable to Company 54,607 50,807 28,189 28,148
INTOUCH 9M17 Statements of Financial Position
19
Prepared by Group Investor Relations
“Some statements made in this presentation are forward-looking statements with the relevant assumptions,which are subject to various risks and uncertainties. These include statements with respect to our corporateplans, strategies and beliefs and other statements that are not historical facts. These statements can be identifiedby the use of forward-looking terminology such as “may”, “will”, “expect”, “anticipate”, “intend”, “estimate”,“continue” “plan” or other similar words.
The statements are based on our management’s assumptions and beliefs in light of the information currentlyavailable to us. These assumptions involve risks and uncertainties which may cause the actual results,performance or achievements to be materially different from any future results, performance or achievementsexpressed or implied by such forward-looking statements. Please note that the company and executives/staff donot control and cannot guarantee the relevance, timeliness, or accuracy of these statements.”
Disclaimer
20