Embed Size (px)
Citation preview
19/07/2016
1
© 3M 2016. All Rights Reserved
3M Health Care AcademySM
© 3M 2016. All Rights Reserved
Verification of Environmental Cleaning & theImpact on Patient SafetyJuly 20, 2016
Steve Zeplin, RN, MSN, CSPDT
© 3M 2016. All Rights Reserved 2
House Keeping
Continuing EducationEach 1 hour web meeting qualifies for 1 contact hour for nursing. 3M Health Care Provider is approved by the California Board of Registered Nurses CEP 5770.
19/07/2016
2
© 3M 2016. All Rights Reserved 3
Disclosure
• Steve Zeplin, RN, MSN, CSPDT
• Employee of 3M
• Sponsored by 3M
© 3M 2016. All Rights Reserved 4
Objectives
• Review the fundamentals of cleaning verification
• Compare the different strategies for verifying environmental cleaning
• Summarize industry recommendations for environmental cleaning verification
• Analyze the evidence that cleaning verification impacts patient safety
19/07/2016
3
© 3M 2016. All Rights Reserved
Risk…..
© 3M 2016. All Rights Reserved
What is one of the greatest risks to patients after admission to the hospital?
Admission to a room previously occupied by a patient who was
colonized or infected with a multi-drug resistant organism.
Otter et al. Am J Infect Control 2013;41(5 Suppl):S6-11.Datta et al. Arch Intern Med 2011;171:491-494.Passaretti et al. Clin Infect Dis 2013;56:27-35.
19/07/2016
4
© 3M 2016. All Rights Reserved
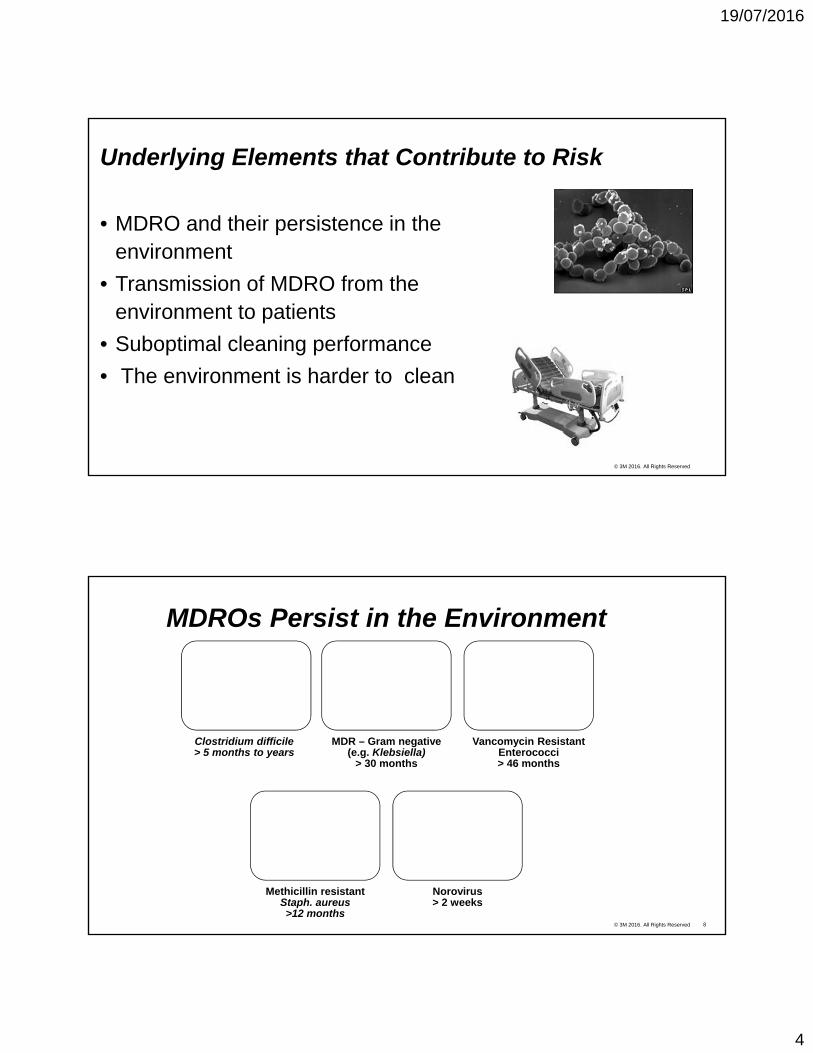
Underlying Elements that Contribute to Risk
• MDRO and their persistence in the environment
• Transmission of MDRO from the environment to patients
• Suboptimal cleaning performance
• The environment is harder to clean
© 3M 2016. All Rights Reserved 8
Clostridium difficile> 5 months to years
MDR – Gram negative (e.g. Klebsiella)
> 30 months
Vancomycin Resistant Enterococci> 46 months
Methicillin resistant Staph. aureus>12 months
Norovirus> 2 weeks
MDROs Persist in the Environment
19/07/2016
5
© 3M 2016. All Rights Reserved
Transmission from environment to patient.Where does evidence come from?
Modeling of Transmission Routes
Observational Epidemiological Studies
Intervention Studies
Outbreak Reports
JA Otter et al. 2013 AJIC 41 S6-S11
© 3M 2016. All Rights Reserved 10
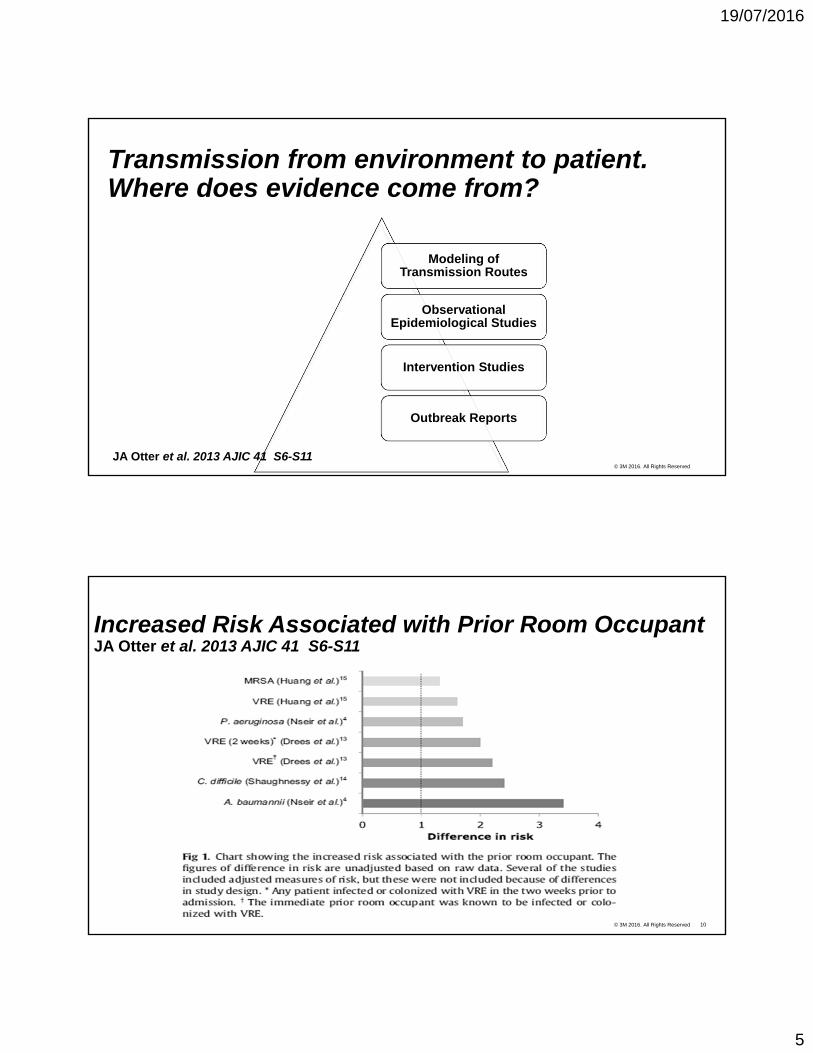
Increased Risk Associated with Prior Room OccupantJA Otter et al. 2013 AJIC 41 S6-S11
19/07/2016
6
© 3M 2016. All Rights Reserved
Indirect Transmission from the Environment
“With the pre-dominant focus on clean hands, there is less
interest in the surfaces they touch. Even exceptional hand hygiene is rendered invalid if the first object handled transfers pathogens to the patient via fingertips….”
S. Dancer 2010. ICHE, 31(9) p. 958-960
© 3M 2016. All Rights Reserved
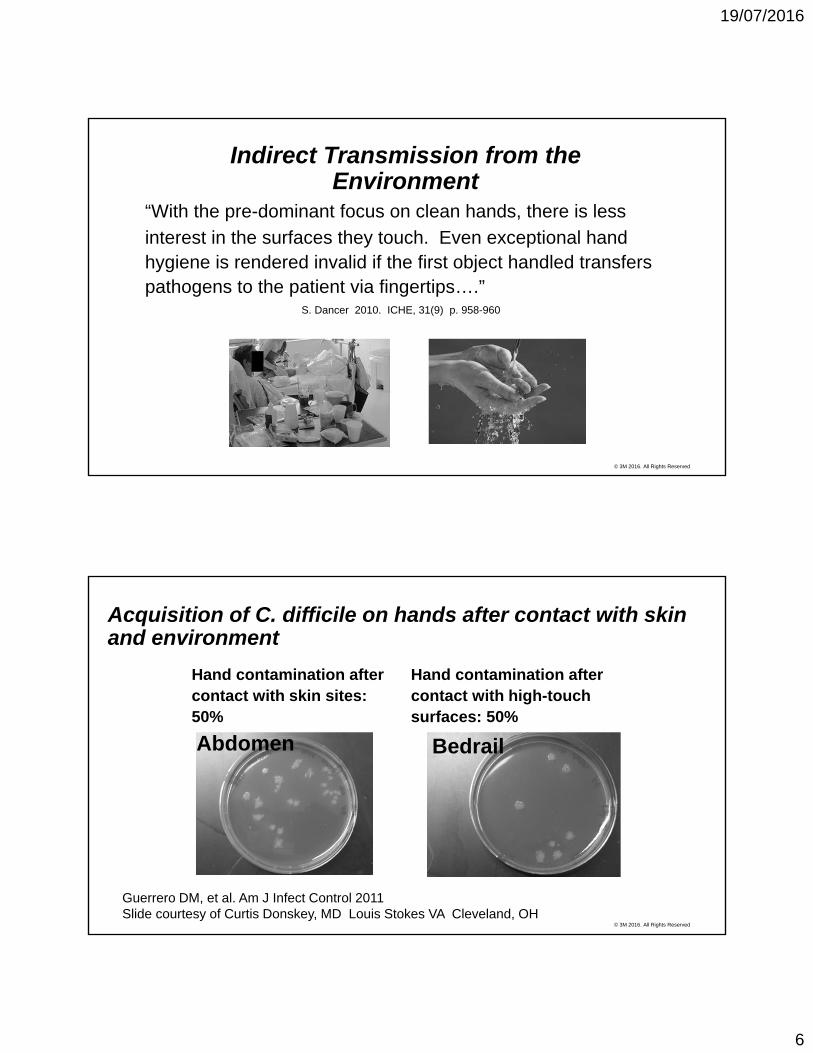
Acquisition of C. difficile on hands after contact with skin and environment
Hand contamination after contact with skin sites: 50%
Hand contamination after contact with high-touch surfaces: 50%
BedrailAbdomen
Guerrero DM, et al. Am J Infect Control 2011Slide courtesy of Curtis Donskey, MD Louis Stokes VA Cleveland, OH
19/07/2016
7
© 3M 2016. All Rights Reserved
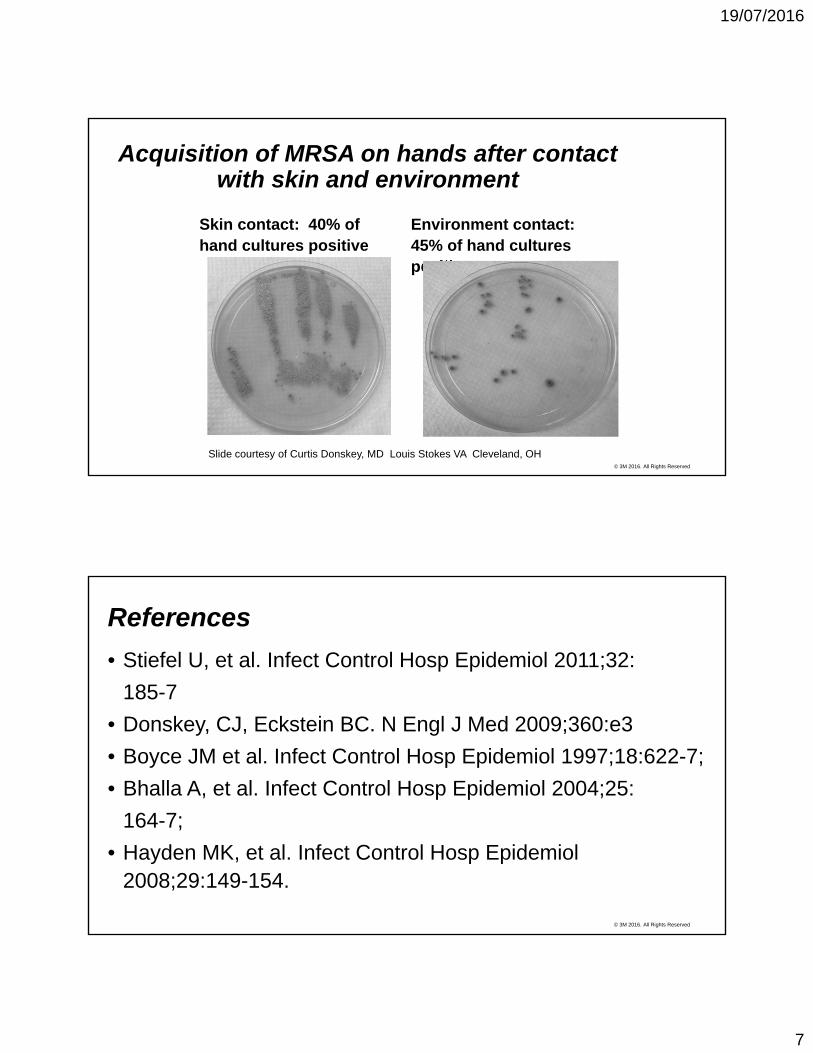
Acquisition of MRSA on hands after contact with skin and environment
Skin contact: 40% of hand cultures positive
Environment contact: 45% of hand cultures positive
Slide courtesy of Curtis Donskey, MD Louis Stokes VA Cleveland, OH
© 3M 2016. All Rights Reserved
References
• Stiefel U, et al. Infect Control Hosp Epidemiol 2011;32:
185-7
• Donskey, CJ, Eckstein BC. N Engl J Med 2009;360:e3
• Boyce JM et al. Infect Control Hosp Epidemiol 1997;18:622-7;
• Bhalla A, et al. Infect Control Hosp Epidemiol 2004;25:
164-7;
• Hayden MK, et al. Infect Control Hosp Epidemiol2008;29:149-154.
19/07/2016
8
© 3M 2016. All Rights Reserved 15
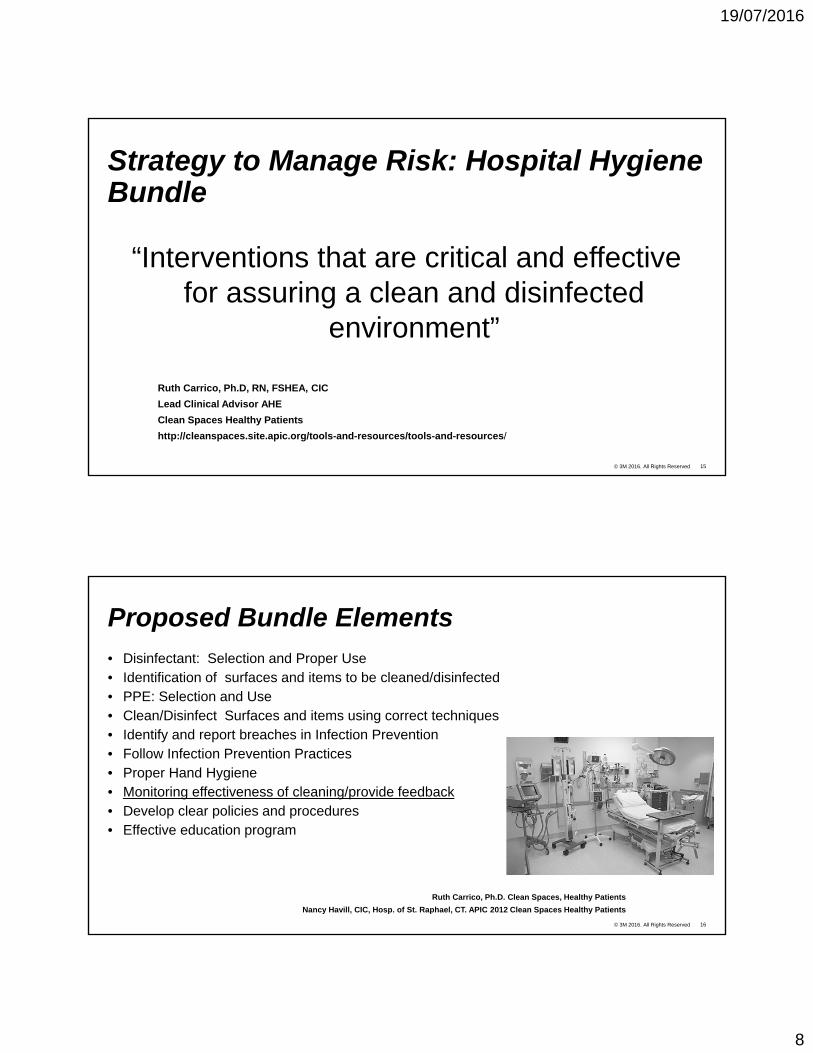
Strategy to Manage Risk: Hospital Hygiene Bundle
“Interventions that are critical and effective for assuring a clean and disinfected
environment”
Ruth Carrico, Ph.D, RN, FSHEA, CIC
Lead Clinical Advisor AHE
Clean Spaces Healthy Patients
http://cleanspaces.site.apic.org/tools-and-resources/tools-and-resources/
© 3M 2016. All Rights Reserved 16
Proposed Bundle Elements• Disinfectant: Selection and Proper Use• Identification of surfaces and items to be cleaned/disinfected• PPE: Selection and Use• Clean/Disinfect Surfaces and items using correct techniques• Identify and report breaches in Infection Prevention• Follow Infection Prevention Practices • Proper Hand Hygiene• Monitoring effectiveness of cleaning/provide feedback• Develop clear policies and procedures• Effective education program
Ruth Carrico, Ph.D. Clean Spaces, Healthy Patients
Nancy Havill, CIC, Hosp. of St. Raphael, CT. APIC 2012 Clean Spaces Healthy Patients
19/07/2016
9
© 3M 2016. All Rights Reserved 17
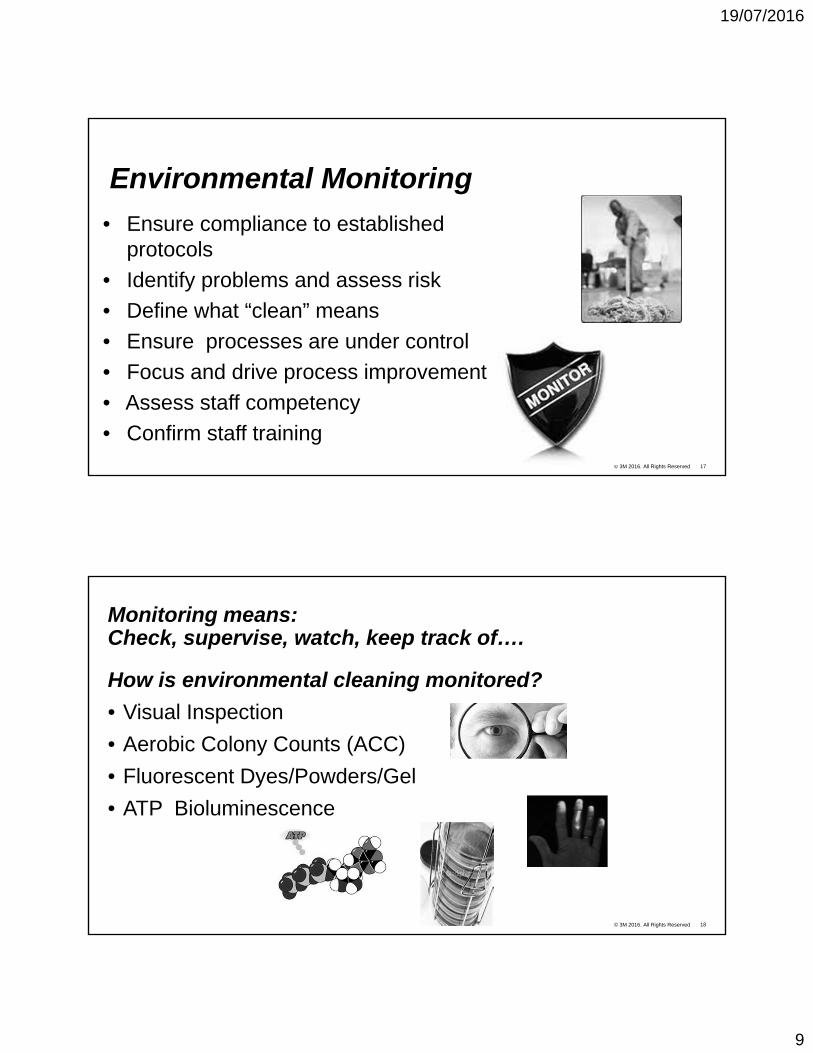
Environmental Monitoring
• Ensure compliance to established protocols
• Identify problems and assess risk
• Define what “clean” means
• Ensure processes are under control
• Focus and drive process improvement
• Assess staff competency
• Confirm staff training
© 3M 2016. All Rights Reserved 18
Monitoring means:Check, supervise, watch, keep track of….
How is environmental cleaning monitored?
• Visual Inspection
• Aerobic Colony Counts (ACC)
• Fluorescent Dyes/Powders/Gel
• ATP Bioluminescence
19/07/2016
10
© 3M 2016. All Rights Reserved 19
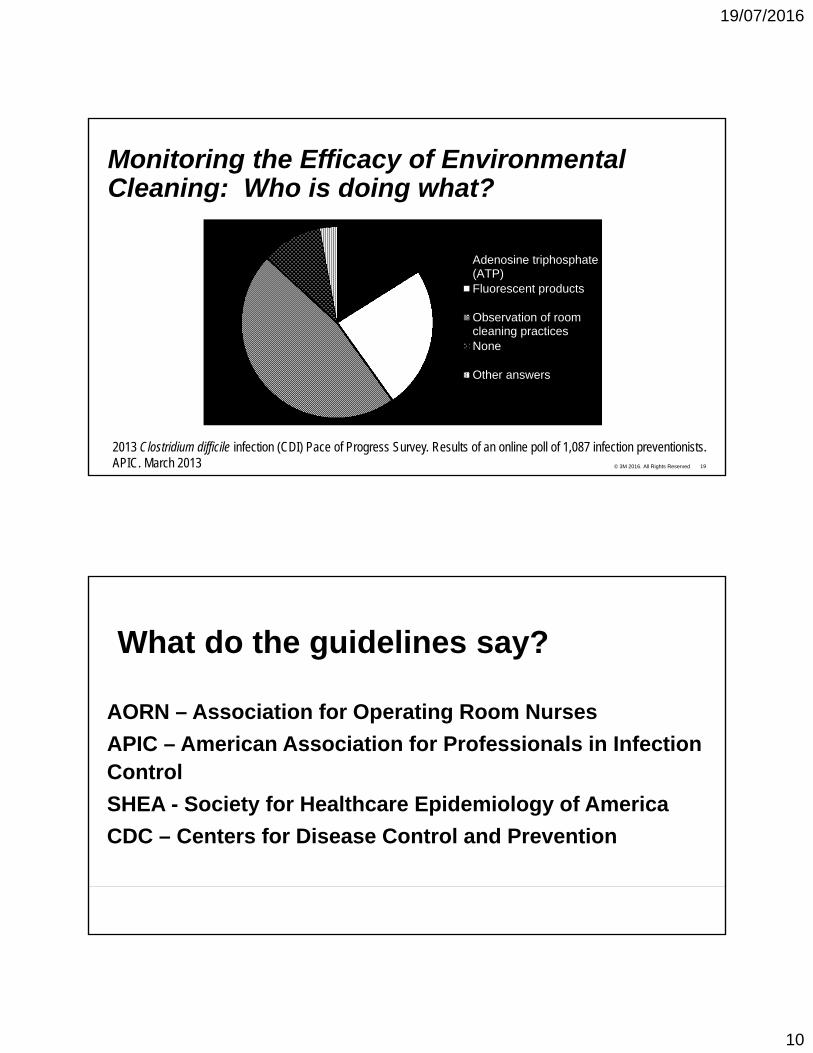
Monitoring the Efficacy of Environmental Cleaning: Who is doing what?
Adenosine triphosphate(ATP)Fluorescent products
Observation of roomcleaning practicesNone
Other answers
2013 Clostridium difficile infection (CDI) Pace of Progress Survey. Results of an online poll of 1,087 infection preventionists. APIC. March 2013
© 3M 2016. All Rights Reserved
What do the guidelines say?
AORN – Association for Operating Room Nurses
APIC – American Association for Professionals in Infection Control
SHEA - Society for Healthcare Epidemiology of America
CDC – Centers for Disease Control and Prevention
19/07/2016
11
© 3M 2016. All Rights Reserved 21
• Perioperative personnel should participate in a variety of quality assurance and performance improvement activities that are consistent with the health care organization’s plan to improve understanding of and compliance with environmental cleaning.
• Process monitoring must be a part of every perioperative setting as part of an overall environmental cleaning program. Process monitoring should include:
• Compliance with regulatory standards
• Review of products and manufacturers’ instructions for use
• Cleaning procedures
• Monitoring of cleaning and disinfection practices
• Reporting and investigation of adverse events (Example: outbreaks, product issues, corrective actions)
• Cleaning practices should be measured with qualitative and quantitative measures
AORN: Guidelines for Environmental Cleaning
© 3M 2016. All Rights Reserved
The Implementation Guide for Prevention of Clostridium difficilewww.apic.org/Professional-Practice/Implementation-guides.
This guide now contains numerous, multiple recommendations for incorporation of a monitoring program.
“Monitor adherence to cleaning and disinfection processes by personnel responsible for environmental cleaning.”
The Implementation Guide also has a section dedicated to environmental monitoring technologies.
APIC – Association for Professionals in Infection Control
19/07/2016
12
© 3M 2016. All Rights Reserved 23
SHEA Compendium 2014
Infection Control and Hospital Epidemiology July 2014, Vol. 35, No. 7
• Contains practice recommendations for prevention of HAIs
• Where applicable, implementation of monitoring to assess the efficacy of cleaning is now in recommendations.
• The Compendium is divided into several parts, monitoring recommendations/comments are located in those sections discussing MRSA and Clostridium difficile ( where environmental transmission is a concern).
SHEA: Society for Healthcare Epidemiology of America
© 3M 2016. All Rights Reserved 24
•This is NOT an official CDC guideline
•A tool kit that offers options for how to monitor environmental cleaning
•Be aware that there are inaccuracies in the descriptions on ATP technology and Microbial Culture and how they should be used.
•http://www.cdc.gov/hai/toolkits/Evaluating-Environmental-Cleaning.html
CDC: Options for Evaluating Environmental Cleaning
19/07/2016
13
© 3M 2016. All Rights Reserved
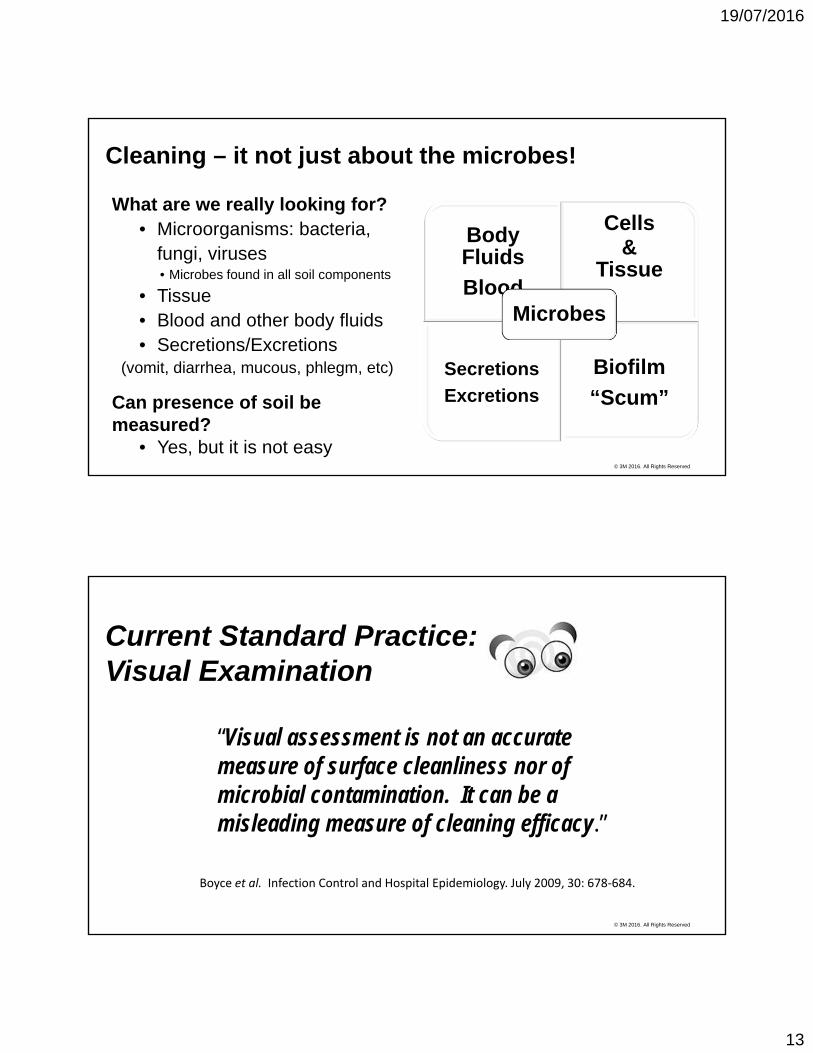
What are we really looking for?• Microorganisms: bacteria,
fungi, viruses• Microbes found in all soil components
• Tissue• Blood and other body fluids• Secretions/Excretions
(vomit, diarrhea, mucous, phlegm, etc)
Can presence of soil be measured?
• Yes, but it is not easy
Cleaning – it not just about the microbes!
Body Fluids
Blood
Cells &
Tissue
Secretions
Excretions
Biofilm
“Scum”
Microbes
© 3M 2016. All Rights Reserved
Current Standard Practice: Visual Examination
“Visual assessment is not an accurate measure of surface cleanliness nor of microbial contamination. It can be a misleading measure of cleaning efficacy.”
Boyce et al. Infection Control and Hospital Epidemiology. July 2009, 30: 678‐684.
19/07/2016
14
© 3M 2016. All Rights Reserved
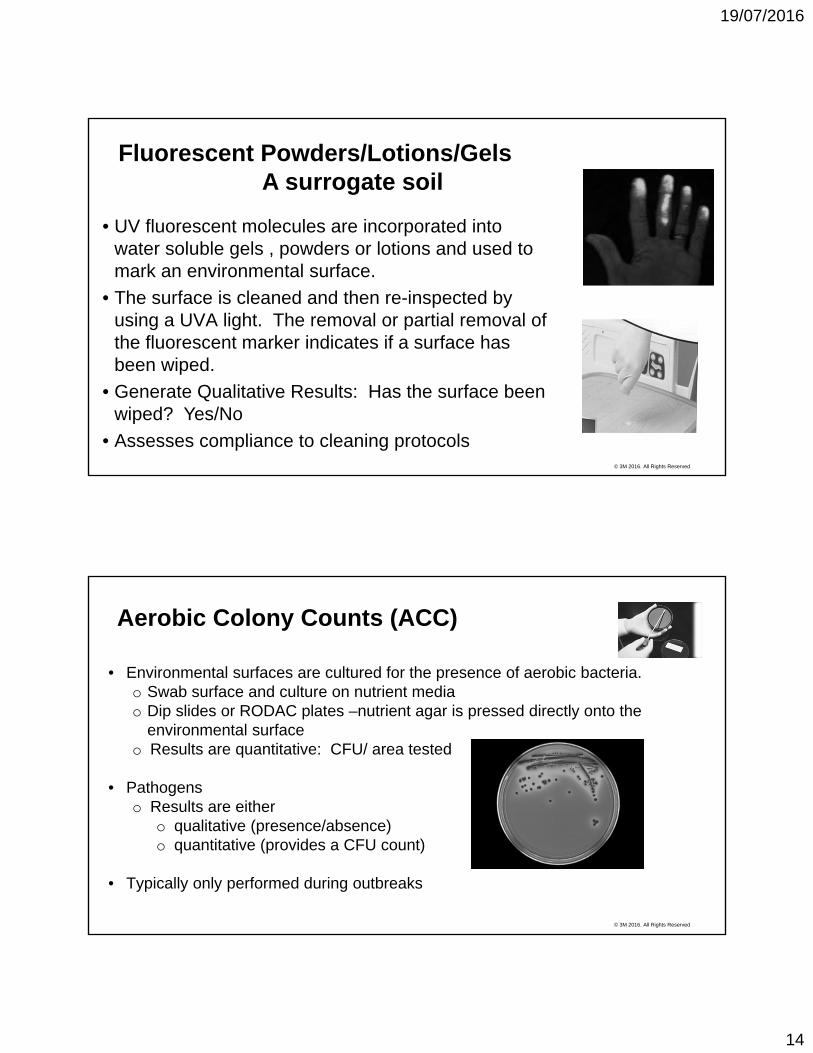
Fluorescent Powders/Lotions/GelsA surrogate soil
• UV fluorescent molecules are incorporated into water soluble gels , powders or lotions and used to mark an environmental surface.
• The surface is cleaned and then re-inspected by using a UVA light. The removal or partial removal of the fluorescent marker indicates if a surface has been wiped.
• Generate Qualitative Results: Has the surface been wiped? Yes/No
• Assesses compliance to cleaning protocols
© 3M 2016. All Rights Reserved
Aerobic Colony Counts (ACC)
• Environmental surfaces are cultured for the presence of aerobic bacteria.o Swab surface and culture on nutrient mediao Dip slides or RODAC plates –nutrient agar is pressed directly onto the
environmental surfaceo Results are quantitative: CFU/ area tested
• Pathogens o Results are either
o qualitative (presence/absence)o quantitative (provides a CFU count)
• Typically only performed during outbreaks
19/07/2016
15
© 3M 2016. All Rights Reserved
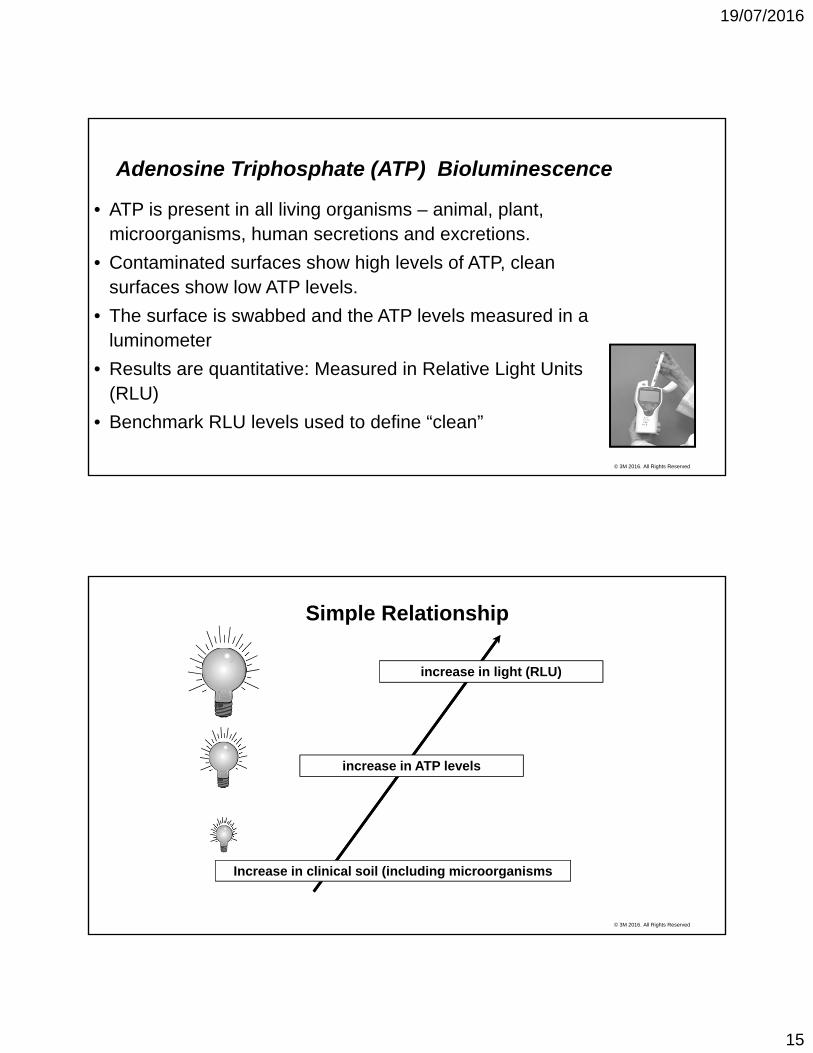
Adenosine Triphosphate (ATP) Bioluminescence
• ATP is present in all living organisms – animal, plant, microorganisms, human secretions and excretions.
• Contaminated surfaces show high levels of ATP, clean surfaces show low ATP levels.
• The surface is swabbed and the ATP levels measured in a luminometer
• Results are quantitative: Measured in Relative Light Units (RLU)
• Benchmark RLU levels used to define “clean”
© 3M 2016. All Rights Reserved
Simple Relationship
Increase in clinical soil (including microorganisms
increase in ATP levels
increase in light (RLU)
19/07/2016
16
© 3M 2016. All Rights Reserved
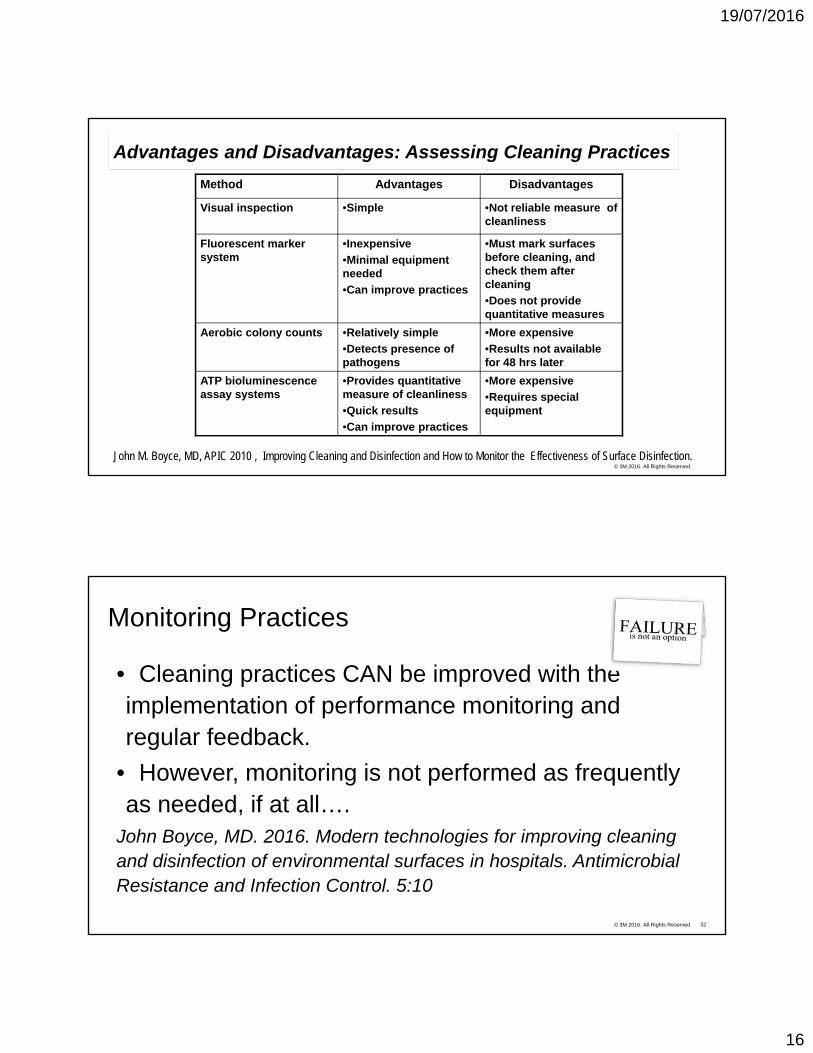
Advantages and Disadvantages: Assessing Cleaning Practices
Method Advantages Disadvantages
Visual inspection •Simple •Not reliable measure of cleanliness
Fluorescent marker system
•Inexpensive
•Minimal equipment needed
•Can improve practices
•Must mark surfaces before cleaning, and check them after cleaning
•Does not provide quantitative measures
Aerobic colony counts •Relatively simple
•Detects presence of pathogens
•More expensive
•Results not available for 48 hrs later
ATP bioluminescence assay systems
•Provides quantitative measure of cleanliness
•Quick results
•Can improve practices
•More expensive
•Requires special equipment
John M. Boyce, MD, APIC 2010 , Improving Cleaning and Disinfection and How to Monitor the Effectiveness of Surface Disinfection.
© 3M 2016. All Rights Reserved 32
Monitoring Practices
• Cleaning practices CAN be improved with the implementation of performance monitoring and regular feedback.
• However, monitoring is not performed as frequently as needed, if at all….
John Boyce, MD. 2016. Modern technologies for improving cleaning and disinfection of environmental surfaces in hospitals. Antimicrobial Resistance and Infection Control. 5:10
19/07/2016
17
© 3M 2016. All Rights Reserved 33
Why do we not monitor?
• Time and $$
• Must be done on an on-going basis to be effective
• Lack of correlation to microbial counts taken as a negative
• Move to use of new technologies
o new disinfectants
o self-disinfecting surfaces (copper, silver)
o no-touch automated disinfection (UV-C, VHP)
© 3M 2016. All Rights Reserved
Should ATP measurements correlate with bacterial counts?A common concern, a common misconception….
Correlation should not be expected because:
ATP measures organic contamination from all living sources
• Microorganisms, human cells, secretions, excretions, body fluids, food residue
Bacterial counts measures bacteria only
• Correlation should not be expected as these two methods measure different things (well documented fact)
19/07/2016
18
© 3M 2016. All Rights Reserved 35
• Aerobic Plate Counts
• Only measures levels of live bacteria
• Bacterial counts are zero but the surface could still be contaminated with o viruses (HIV, HepB,C)
o anaerobic bacteria (C. diff)
o Fungi, parasites
• ATP Bioluminescence
• Measures removal of all organic soil including blood
• Remove the soil, remove the bugs…..o viruses (HIV, HepB,C)
o anaerobic bacteria (C. diff)
o Fungi, parasites
Simple Scenario: A surface is soiled with bloodBacterial results are zero, ATP results are high
© 3M 2016. All Rights Reserved 36
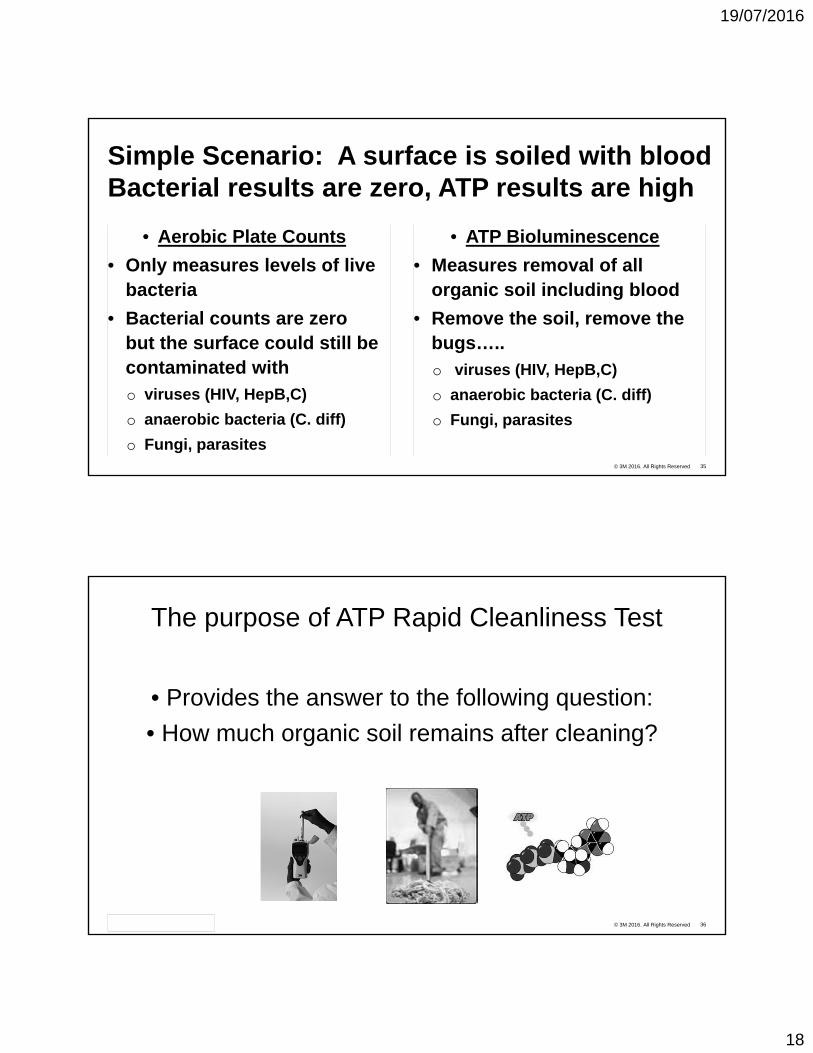
The purpose of ATP Rapid Cleanliness Test
• Provides the answer to the following question:
• How much organic soil remains after cleaning?
19/07/2016
19
© 3M 2016. All Rights Reserved 37
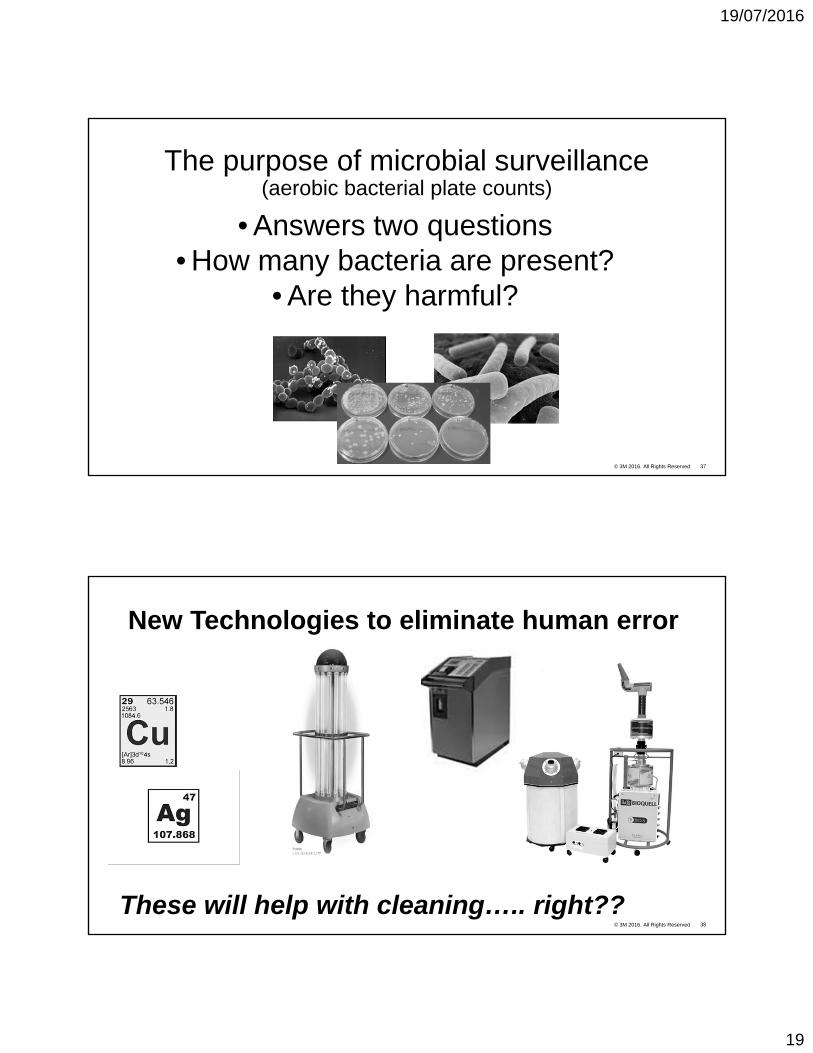
The purpose of microbial surveillance (aerobic bacterial plate counts)
• Answers two questions • How many bacteria are present?
• Are they harmful?
© 3M 2016. All Rights Reserved 38
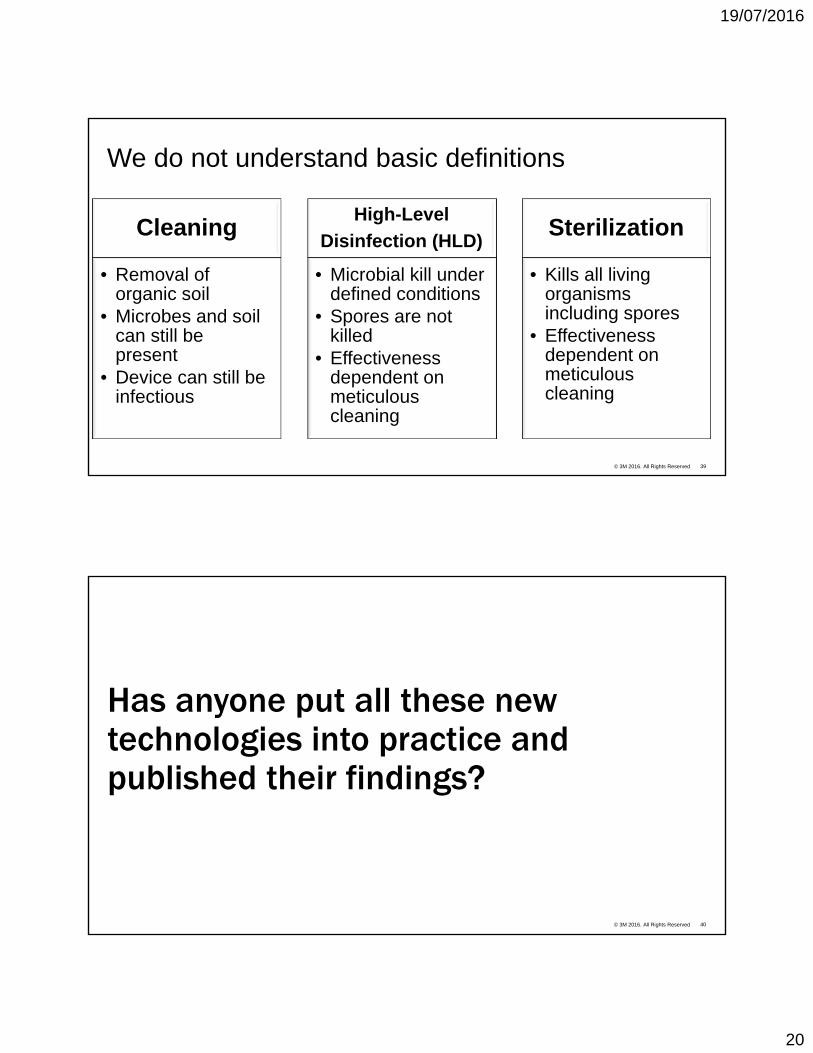
New Technologies to eliminate human error
These will help with cleaning….. right??
19/07/2016
20
© 3M 2016. All Rights Reserved 39
We do not understand basic definitions
Cleaning
• Removal of organic soil
• Microbes and soil can still be present
• Device can still be infectious
High-Level
Disinfection (HLD)
• Microbial kill under defined conditions
• Spores are not killed
• Effectiveness dependent on meticulous cleaning
Sterilization
• Kills all living organisms including spores
• Effectiveness dependent on meticulous cleaning
© 3M 2016. All Rights Reserved 40
Has anyone put all these new technologies into practice and published their findings?
19/07/2016
21
© 3M 2016. All Rights Reserved 41
Louis Stokes VA Medical CenterAn Environmental Disinfection Odyssey
An Environmental Disinfection Odyssey: Evaluation of Sequential Interventions to Improve Disinfection of Clostridium difficile Isolation Rooms. Brett Sitzlar, BS; Abhishek Deshpande, MD, PhD; Dennis Fertelli; Sirisha Kundrapu,MD; Ajay K. Sethi, PhD; Curtis J. Donskey, MD. Infection Control and Hospital Epidemiology, Vol. 34, No. 5, Special Topic Issue: The Role of the Environment in Infection Prevention (May 2013), pp. 459-465http://www.jstor.org/stable/10.1086/670217 .
© 3M 2016. All Rights Reserved
Why do the study? Problems with Clostridium difficile (C. diff)• Outbreak of Clostridium difficile infection (CDI) (2002-
2004)
• High endemic rate: 15 in 10,000 patient days
• Environmental cultures were positive for C. diff after terminal cleaning
• What cleaning/disinfection improvements would result in
consistently negative environmental cultures?
• Performed sequential interventions and
then looked at effects on C. diff culture
results and rate of CDI.
19/07/2016
22
© 3M 2016. All Rights Reserved
© 3M 2016. All Rights Reserved
19/07/2016
23
© 3M 2016. All Rights Reserved
© 3M 2016. All Rights Reserved
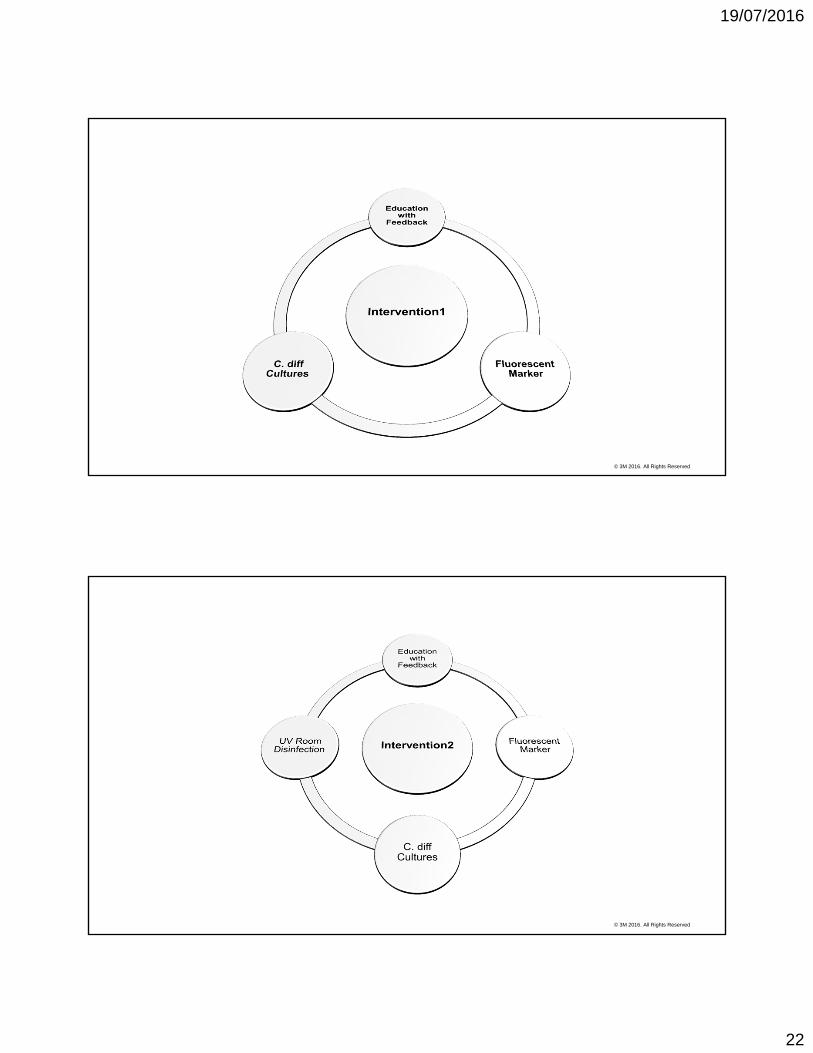
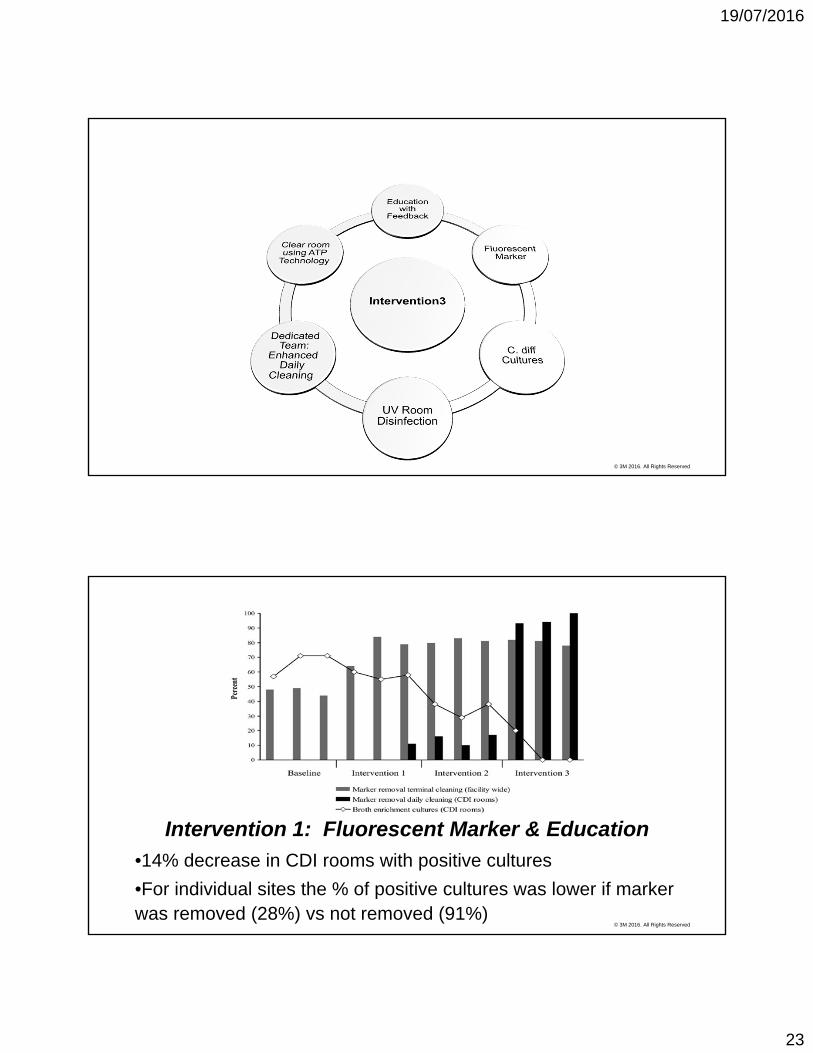
Intervention 1: Fluorescent Marker & Education
•14% decrease in CDI rooms with positive cultures
•For individual sites the % of positive cultures was lower if marker was removed (28%) vs not removed (91%)
19/07/2016
24
© 3M 2016. All Rights Reserved
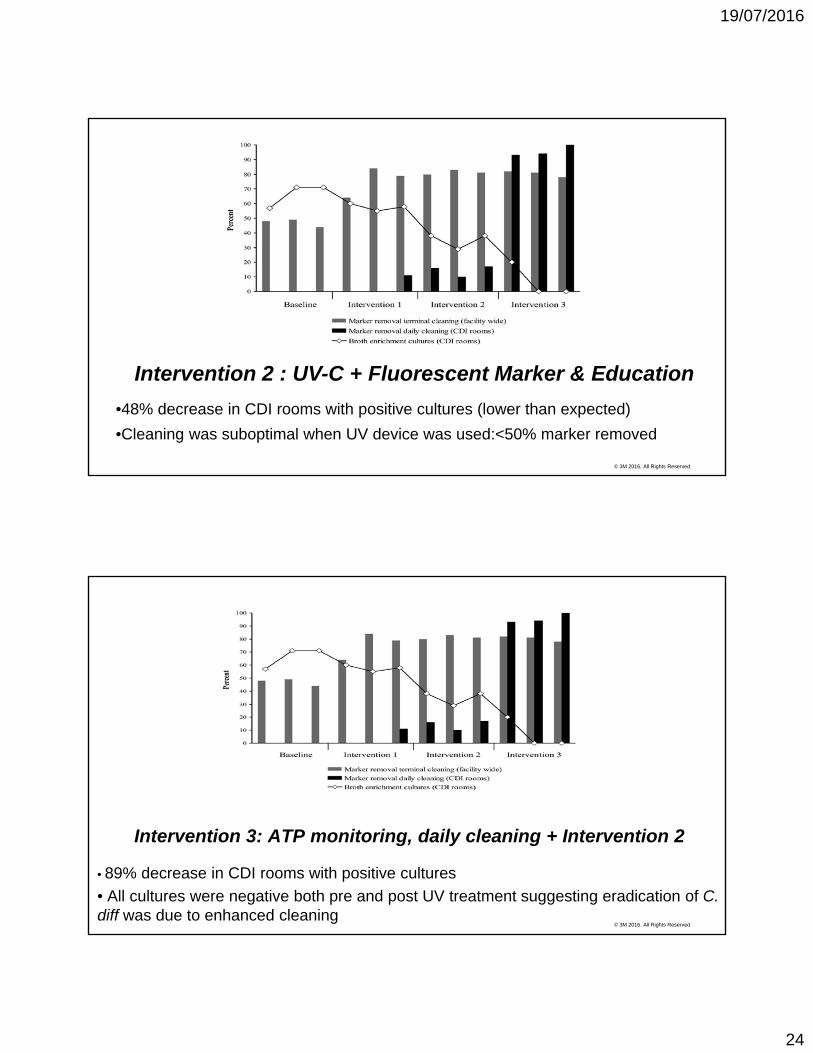
Intervention 2 : UV-C + Fluorescent Marker & Education
•48% decrease in CDI rooms with positive cultures (lower than expected)
•Cleaning was suboptimal when UV device was used:<50% marker removed
© 3M 2016. All Rights Reserved
Intervention 3: ATP monitoring, daily cleaning + Intervention 2
• 89% decrease in CDI rooms with positive cultures
• All cultures were negative both pre and post UV treatment suggesting eradication of C. diff was due to enhanced cleaning
19/07/2016
25
© 3M 2016. All Rights Reserved 49
Health-care associated CDI rates
• During Period 1 and 2 rates remained stable at
10 per 10,000 days of care.
• During Period 3 rates dropped to 6 per 10,000 days of care.
• Authors suggest more study is needed to see if the drop in CDI rates could be sustained.
© 3M 2016. All Rights Reserved
Conclusions• Education alone does not work
• Fluorescent marker (FM) technology greatly improved compliance with wiping correct surfaces but only had “modest impact on residual C. diff spore contamination.”
• Supports growing body of work that shows FM do not provide assurance that pathogens are removed from a surface
• FM shows a surface has been wiped, not that it is clean
• UV devices can be helpful but use with strong caution• Cleaning efforts declined due to misconception that the UV device BOTH
cleaned and disinfected surfaces
• UV devices may be more effective on surfaces with direct exposure vsindirect exposure
19/07/2016
26
© 3M 2016. All Rights Reserved
Conclusions: Two strategies worked to achieve consistently negative C. diff cultures
• Dedicated CDI daily disinfection team• Keeps C. diff levels down, decreases chance of HCW hand contamination
• Provides multiple opportunities to remove environmental contamination
• Dedicated team removes issues of worker variability
• Rooms cleared by EVS supervisor or Infection Control• ATP readings (< 250 RLU) provided objective measure of cleanliness and
allowed for implementation of standardized process for clearing rooms
• Required little time (1-2 hours per week)
• Provided opportunity for direct observation and real-time feedback to EVS staff
© 3M 2016. All Rights Reserved
My Comments
• Monitoring technologies: ATP vs FM • One is not better than the other, they address different questions
• Monitoring & NTD Technologies do not replace:• Proper cleaning
• Communication
• Education
• Be aware of the limitations of each approach
• A combination of technologies looks to be most effective
19/07/2016
27
© 3M 2016. All Rights Reserved
Conclusions
Studies indicate that environmental cleaning and disinfection interventions can reduce the acquisition of healthcare-associated infections.
Ongoing Education & Training
Environmental Monitoring with Feedback
No Touch Disinfection Technologies
Dedicated cleaning teams
Enhanced cleaning and disinfection protocols
© 3M 2016. All Rights Reserved 54
HAI Elimination is a Continuous Improvement Process
19/07/2016
28
© 3M 2016. All Rights Reserved
Thank you