Embed Size (px)
Citation preview
Clinical Neurophysiology 120 (2009) 1061–1069
Contents lists available at ScienceDirect
Clinical Neurophysiology
journal homepage: www.elsevier .com/locate /c l inph
3D source localization derived from subdural strip and grid electrodes:A simulation study
Matthias Dümpelmann a,*, Jürgen Fell a, Jörg Wellmer a, Horst Urbach b, Christian E. Elger a
a Department of Epileptology, University of Bonn, Sigmund-Freud-Str. 25, D-53105 Bonn, Germanyb Department of Radiology, University of Bonn, Sigmund-Freud-Str. 25, D-53105 Bonn, Germany
a r t i c l e i n f o
Article history:Accepted 16 March 2009Available online 25 April 2009
Keywords:Invasive electrodesSource localizationEpilepsySimulation
1388-2457/$36.00 � 2009 International Federation odoi:10.1016/j.clinph.2009.03.014
* Corresponding author. Tel.: +49 228 287 19343; fE-mail address: [email protected] (M. D
a b s t r a c t
Objective: Little experience exists in the application of source reconstruction methods to recordings fromsubdural strip and grid electrodes. This study addressed the question, whether reliable and accurate 3Dsource localization is possible from the Electrocorticogram (ECoG).Methods: The accuracy of source reconstruction was investigated by simulations and a case study. Sim-ulated sources were used to compute potentials at the electrode positions derived from the MRI of apatient with subdural electrodes. Used procedures were the linear estimation (minimum norm) algo-rithm and the MUSIC (MUltiple SIgnal Classification) scan.Results: Maxima of linear estimation were attracted to adjacent electrodes. Reliable localization with alocalization error 615 mm was only achieved for about 35% of the original source positions. Maximaof the MUSIC metric were identical to original positions for simulations without noise. Noise reducedthe percentage of reliable solutions down to a 79.0%. Electrode contacts distant to the source had smallinfluence on localization accuracy. The case study supported simulation results.Conclusion: Reliable source reconstruction derived from ECoG can be achieved by the application of theMUSIC algorithm. Linear estimation needs additional compensation mechanisms.Significance: MUSIC based 3D localization based on ECoG has the potential improving epilepsy diagnosisand cognitive research.� 2009 International Federation of Clinical Neurophysiology. Published by Elsevier Ireland Ltd. All rights
reserved.
1. Introduction
Source localization on the basis of EEG and MEG recordings hasbecome an established tool in clinical diagnosis and cognitive re-search. A recent review about the application of EEG source localiza-tion in epilepsy diagnosis (Plummer et al., 2008) reported a numberof 150 scientific papers on EEG based source localization. Clinical useof MEG in epilepsy diagnoses almost solely comes along with theapplication of source localization methods (Barkley and Baumgart-ner, 2003). A comprehensive review of application areas of sourcelocalization as well as for clinical purposes as well as in cognitive re-search is given by Michel et al. (2004). The review includes also anoverview about the modeling of the electromagnetic and geometri-cal properties of the head and about state of the art inverse models.
EEG recorded by subdural strip and grid electrodes is used inpresurgical evaluation of patients suffering from pharmaco-resis-tant focal epilepsy in case non-invasive studies remain non-con-cordant or inconclusive regarding the irritative zone, the seizureonset zone or the eloquent cortex (Rosenow and Lüders, 2001).
f Clinical Neurophysiology. Publish
ax: +49 228 287 16294.ümpelmann).
Application of source localization methods on data recorded bysubdural grid and strip electrodes is up to now quite rare. A reviewabout volume conductor volumes by Fuchs et al. (2007a) givessimulation results for spherical and boundary element models(BEM) for electrocorticoencephalographic (ECoG) recordings andshows the application of source reconstruction derived from gridrecordings of epileptic spike data. The same authors address inan earlier simulation study (Fuchs et al., 2007b) problems andsolutions for source localization derived from ECoG. Methods andmodels presented in these two studies were applied to the locali-zation of the P50 component in an auditory sensory gating exper-iment (Korzyukov et al., 2007).
The used inverse models in these studies are based on a sourcemodel, which is derived from a cortical segmentation. Local activ-ity regions, which are called ‘‘cortical patches” by the authors, aremoved along the cortex to reconstruct the activity distribution.Only a recent study (Zhang et al., 2008) showed that 3D sourcelocalization of deep sources derived from ECoG recordings is possi-ble. This paper extends the work of Zhang et al. with regards to twoimportant aspects. It investigates not only a standard localizationalgorithm using a distributed source model, but also a scanningprocedure with potential ability to reveal complex spatio-temporal
ed by Elsevier Ireland Ltd. All rights reserved.
1062 M. Dümpelmann et al. / Clinical Neurophysiology 120 (2009) 1061–1069
activations. Furthermore, this study does not only evaluate theaccuracy of source reconstruction for a few source positions (Zhanget al., 2008) but for regular distributed source positions on a dense3D lattice covering the complete brain volume without adding fur-ther constraints for the source positions.
The distributed source reconstruction algorithm used in thestudy is the well known linear estimation or minimum norm ap-proach as presented by Hämäläinen and Ilmoniemi (1984). Herea number of elementary dipoles are distributed on a given set ofpositions. The underlying assumption is that the neuronal genera-tors of the measured activity are spatially distributed. In general noassumption is made about the extent or the shape of the source.The density of the dipole positions should be sufficiently high tocover the spatial frequency of the source configuration. For thesedipoles magnitude and orientation are determined under the con-straint that the square of their magnitudes is minimized. In con-trast to the mentioned studies in our study the elementarydipoles are distributed on a regular 3D lattice inside the completebrain volume and not only in the cortex or a few points in thebrain. To keep the algorithm simple it was only tried to removethe tendency of linear estimation methods to attract their maximato the electrode positions (Fuchs et al., 1999) and to remove thesensitivity of the results to noise (Knösche, 1997; Fuchs et al.,1999).
The second used approach is the MUSIC (MUltiple SIgnal Classi-fication) algorithm as described by Mosher et al. (1992, 1999). Thismethod has the potential to separate between various independentfocal sources. MUSIC approximates the measured data by a linearcombination of spatio-temporal components spanning the so-called signal subspace. Then subsequently for a set of points threeorthogonal unity dipoles are placed and the corresponding ECoGsignals are computed. These computed signals span another sub-space, called the source subspace. For the resulting MUSIC metricthe angle between the signal and the computed source subspaceis evaluated. Scanning the brain volume with a dense set of probepoints is then able to localize several independent sources. A pre-requisite is that the time course of these sources is not highly cor-related. Applications of the MUSIC algorithm in clinical epilepsyare given by Gavaret et al. (2004, 2006) and Jansen et al. (2006).The use of the derived recursively applied and projected (RAP)-MUSIC algorithm for the localization of epileptic spikes was pre-sented by Kobayashi et al. (2002a,b), whereas an example for theapplication of MUSIC in cognitive research is given by Knöscheet al. (2005).
Using the two described 3D source reconstruction methods inan extensive simulation study the potentials and problems of local-izing deep sources from ECoG recordings should become visible.
Simulated data instead of real data were used since they arebetter suited for a systematic evaluation of localization accuracies.To test the reconstruction methods on real data these strategieswere applied to epileptic spike data in a case study.
2. Methods
2.1. Simulation
Basis for the simulation study were the MRIs of a patient under-going the presurgical evaluation program at the Department ofEpileptology of the University of Bonn. The patient was a 46-year-old man suffering from complex partial seizures since age of11. MRI imaging showed left sided hippocampal sclerosis with aleft temporo-polar blurring of the grey–white matter junctionand questionable thickening of the left inferior temporal gyrus. Sei-zures recorded with scalp EEG showed bilateral fronto-temporalictal activity without clear lateralization. Seizure semiology did
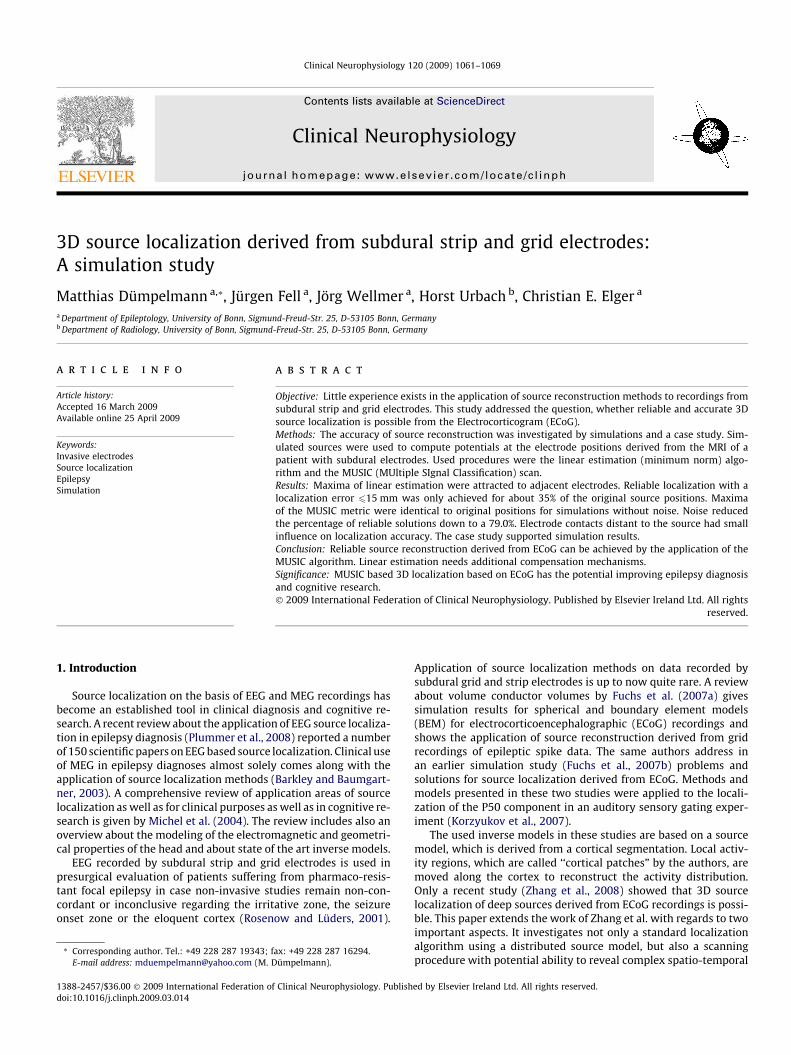
not give convincing evidence for a temporal origin. PET imagingshowed left temporo-mesial and polar hypometabolism as wellas left parieto-occipital hypometabolism. As a result of theseequivocal findings it was concluded to continue presurgical evalu-ation with a coverage of both frontal lobes and both temporal lobesincluding temporo-parietal areas with subdural grid and strip elec-trodes. In total 102 contacts were distributed over the left frontaland temporal lobe (32 contact grid electrode, 2 � 8 contact stripelectrodes, 2 � 4 contact electrodes) and right temporal lobe andfrontal lobe (2 � 8 contact strip electrodes, 1 � 6 contact strip elec-trode, 2 � 4 contact strip electrode) and the left parieto-occipitalarea (2 � 8 contact strip electrode) as shown in Fig. 1. Interictalspike-wave-complexes were recorded in left temporo-mesial con-tacts and rarely in the vicinity of the 32 contact grid electrode.Three recorded seizures started also in left temporo-mesial con-tacts with a spread after 30 s to the grid contacts and to right temp-oro-mesial contacts.
A realistic boundary element model (BEM) was derived from aT1 weighted 3D MRI data set by segmentation of the brain tissue.The BEM model consisted of one homogenic compartment madeup of 3446 vertices and 6888 triangles. The refinement of theBEM model was comparable to the high resolution BEM modelused as a reference in an accuracy study of Fuchs et al. (2007a).The head model was used for simulation purposes (forward com-putation of potentials at contacts of strip and grid electrodes) aswell as for subsequent inverse localization of the simulatedsources. Segmentation and head model generation were performedusing the ASA (A.N.T. Software B.V., Enschede, The Netherlands)package (Zanow and Knösche, 2004).
Electrode positions were extracted from a T1 weighted 3D MRIdata set registered after electrode implantation. Electrode posi-tions were determined using the MRI display of the ASA packageusing three orthogonal coupled views (coronary, sagittal and axial)of the 3D data set by a 3D crosshair navigator. Marked electrodepositions were verified using a curvilinear display of the brain giv-ing a 3D representation of the electrodes on the brain surface.Matching of the electrode positions and the head model was per-formed on the basis of the preauricular points and the nasion inboth 3D MRI data sets. Finally the electrode positions were pro-jected on the nearest node of the head model.
Artificial sources consisted of an idealized point like dipolarsource. The time course of the magnitude was an impulse functionof 20 data points with smooth onset and offset. Besides using theoriginal function two further realizations with added noise witha signal-to-noise ratio (SNR) of 4.0 and 2.0 were used. Potentialsfor the electrode contacts were calculated for 1342 different sourcepositions distributed on a regular 3D lattice inside the entire brainas well as for radial and tangential dipole orientations. Radialsource orientation was approximated by the vector between theorigin of the co-ordinate system and the source position. The originof the co-ordinate system is defined by the preauricular points andthe nasion. Tangential orientation approximation was derived byreplacing the x component of the radial orientation vector withthe y component and the y component with the negative x compo-nent. The z component of the tangential orientation vector was setto zero. The edge length of the cubical lattice was 10 mm. Besidessource positions in the cortex source points were located in thewhite matter but also in areas, which are potentially generatorsof activity relevant in e.g. in epilepsy diagnosis (temporo-mesial,insular region, ...).
Inverse calculations were based on the potentials of all elec-trode contacts or on two reduced sets of contacts. First, contactswere restricted to the left hemisphere only (72 contacts), which in-cludes the 32 contact grid electrode, to get an indication whethercovering both hemispheres is a prerequisite for 3D source localiza-tion inside the brain volume or at least improves the localization
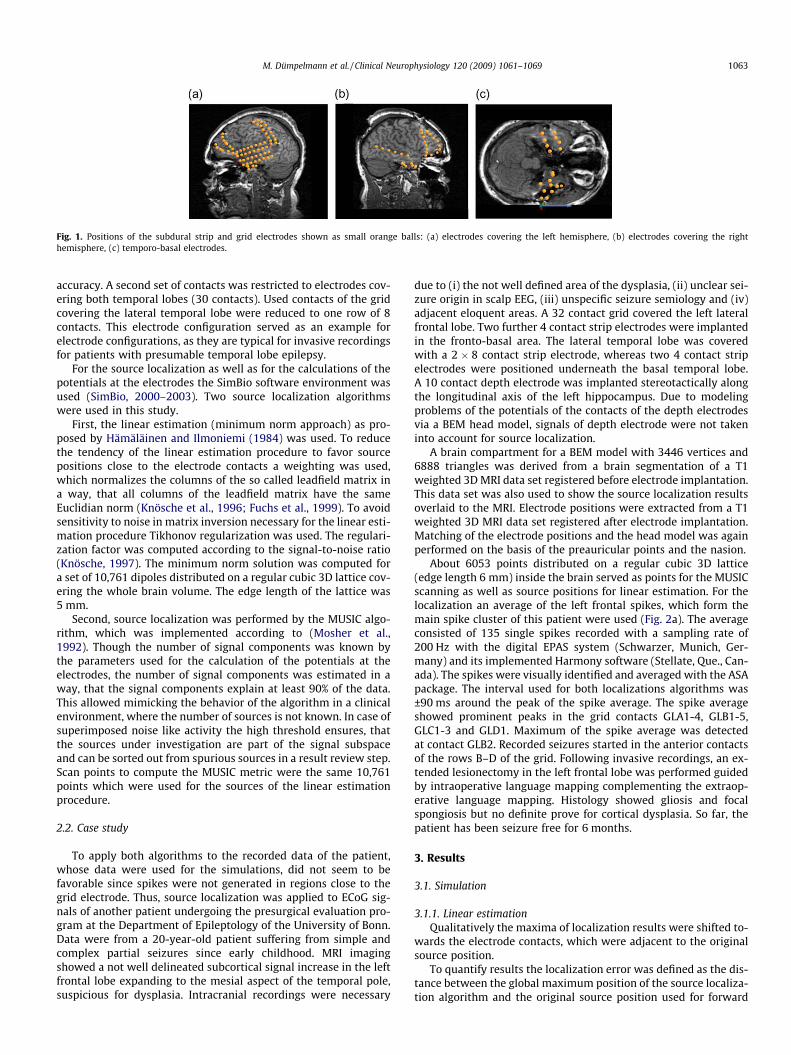
Fig. 1. Positions of the subdural strip and grid electrodes shown as small orange balls: (a) electrodes covering the left hemisphere, (b) electrodes covering the righthemisphere, (c) temporo-basal electrodes.
M. Dümpelmann et al. / Clinical Neurophysiology 120 (2009) 1061–1069 1063
accuracy. A second set of contacts was restricted to electrodes cov-ering both temporal lobes (30 contacts). Used contacts of the gridcovering the lateral temporal lobe were reduced to one row of 8contacts. This electrode configuration served as an example forelectrode configurations, as they are typical for invasive recordingsfor patients with presumable temporal lobe epilepsy.
For the source localization as well as for the calculations of thepotentials at the electrodes the SimBio software environment wasused (SimBio, 2000–2003). Two source localization algorithmswere used in this study.
First, the linear estimation (minimum norm approach) as pro-posed by Hämäläinen and Ilmoniemi (1984) was used. To reducethe tendency of the linear estimation procedure to favor sourcepositions close to the electrode contacts a weighting was used,which normalizes the columns of the so called leadfield matrix ina way, that all columns of the leadfield matrix have the sameEuclidian norm (Knösche et al., 1996; Fuchs et al., 1999). To avoidsensitivity to noise in matrix inversion necessary for the linear esti-mation procedure Tikhonov regularization was used. The regulari-zation factor was computed according to the signal-to-noise ratio(Knösche, 1997). The minimum norm solution was computed fora set of 10,761 dipoles distributed on a regular cubic 3D lattice cov-ering the whole brain volume. The edge length of the lattice was5 mm.
Second, source localization was performed by the MUSIC algo-rithm, which was implemented according to (Mosher et al.,1992). Though the number of signal components was known bythe parameters used for the calculation of the potentials at theelectrodes, the number of signal components was estimated in away, that the signal components explain at least 90% of the data.This allowed mimicking the behavior of the algorithm in a clinicalenvironment, where the number of sources is not known. In case ofsuperimposed noise like activity the high threshold ensures, thatthe sources under investigation are part of the signal subspaceand can be sorted out from spurious sources in a result review step.Scan points to compute the MUSIC metric were the same 10,761points which were used for the sources of the linear estimationprocedure.
2.2. Case study
To apply both algorithms to the recorded data of the patient,whose data were used for the simulations, did not seem to befavorable since spikes were not generated in regions close to thegrid electrode. Thus, source localization was applied to ECoG sig-nals of another patient undergoing the presurgical evaluation pro-gram at the Department of Epileptology of the University of Bonn.Data were from a 20-year-old patient suffering from simple andcomplex partial seizures since early childhood. MRI imagingshowed a not well delineated subcortical signal increase in the leftfrontal lobe expanding to the mesial aspect of the temporal pole,suspicious for dysplasia. Intracranial recordings were necessary
due to (i) the not well defined area of the dysplasia, (ii) unclear sei-zure origin in scalp EEG, (iii) unspecific seizure semiology and (iv)adjacent eloquent areas. A 32 contact grid covered the left lateralfrontal lobe. Two further 4 contact strip electrodes were implantedin the fronto-basal area. The lateral temporal lobe was coveredwith a 2 � 8 contact strip electrode, whereas two 4 contact stripelectrodes were positioned underneath the basal temporal lobe.A 10 contact depth electrode was implanted stereotactically alongthe longitudinal axis of the left hippocampus. Due to modelingproblems of the potentials of the contacts of the depth electrodesvia a BEM head model, signals of depth electrode were not takeninto account for source localization.
A brain compartment for a BEM model with 3446 vertices and6888 triangles was derived from a brain segmentation of a T1weighted 3D MRI data set registered before electrode implantation.This data set was also used to show the source localization resultsoverlaid to the MRI. Electrode positions were extracted from a T1weighted 3D MRI data set registered after electrode implantation.Matching of the electrode positions and the head model was againperformed on the basis of the preauricular points and the nasion.
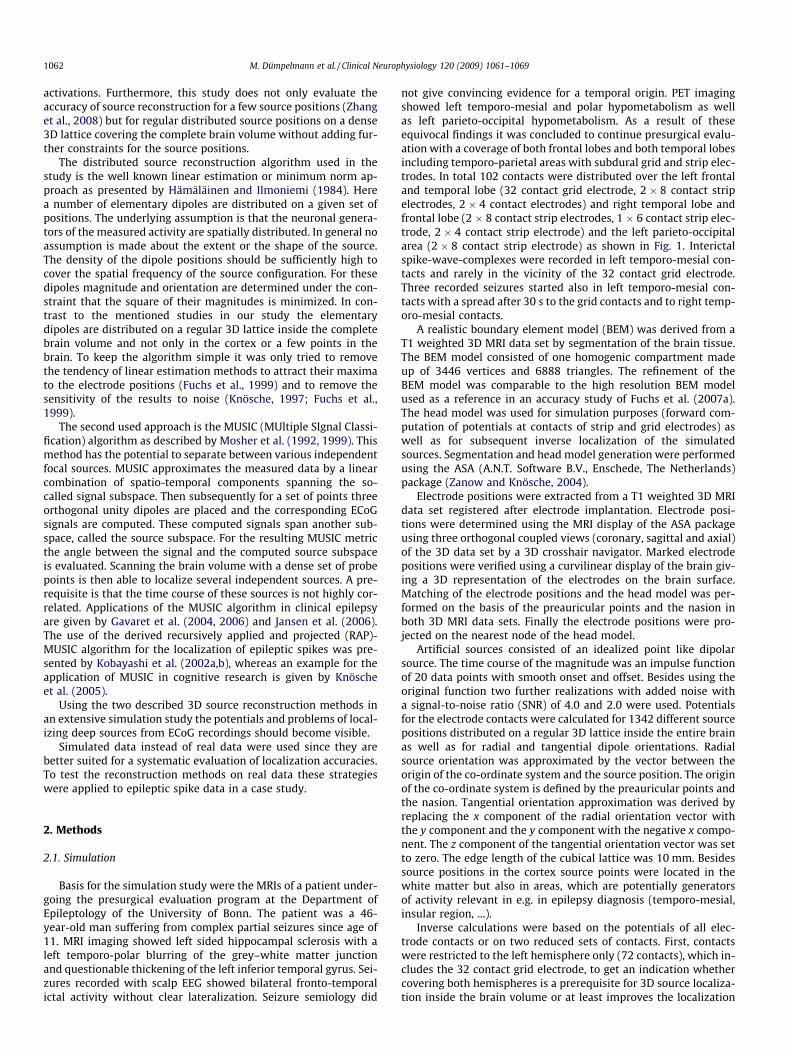
About 6053 points distributed on a regular cubic 3D lattice(edge length 6 mm) inside the brain served as points for the MUSICscanning as well as source positions for linear estimation. For thelocalization an average of the left frontal spikes, which form themain spike cluster of this patient were used (Fig. 2a). The averageconsisted of 135 single spikes recorded with a sampling rate of200 Hz with the digital EPAS system (Schwarzer, Munich, Ger-many) and its implemented Harmony software (Stellate, Que., Can-ada). The spikes were visually identified and averaged with the ASApackage. The interval used for both localizations algorithms was±90 ms around the peak of the spike average. The spike averageshowed prominent peaks in the grid contacts GLA1-4, GLB1-5,GLC1-3 and GLD1. Maximum of the spike average was detectedat contact GLB2. Recorded seizures started in the anterior contactsof the rows B–D of the grid. Following invasive recordings, an ex-tended lesionectomy in the left frontal lobe was performed guidedby intraoperative language mapping complementing the extraop-erative language mapping. Histology showed gliosis and focalspongiosis but no definite prove for cortical dysplasia. So far, thepatient has been seizure free for 6 months.
3. Results
3.1. Simulation
3.1.1. Linear estimationQualitatively the maxima of localization results were shifted to-
wards the electrode contacts, which were adjacent to the originalsource position.
To quantify results the localization error was defined as the dis-tance between the global maximum position of the source localiza-tion algorithm and the original source position used for forward
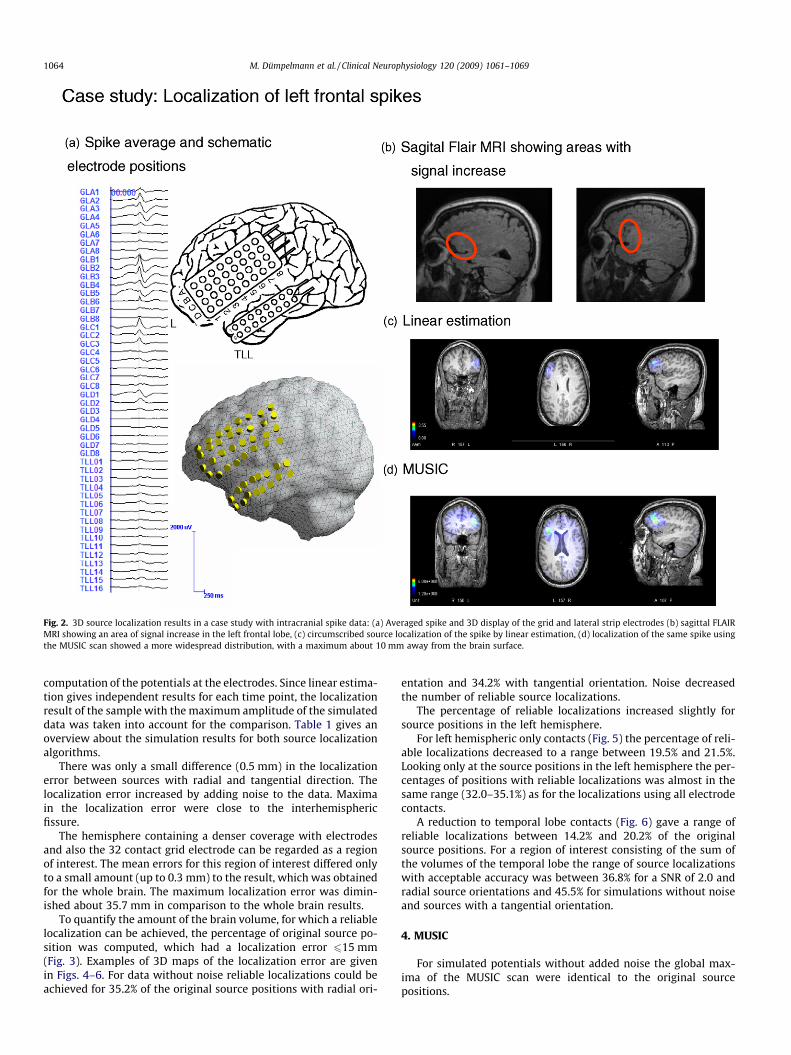
Fig. 2. 3D source localization results in a case study with intracranial spike data: (a) Averaged spike and 3D display of the grid and lateral strip electrodes (b) sagittal FLAIRMRI showing an area of signal increase in the left frontal lobe, (c) circumscribed source localization of the spike by linear estimation, (d) localization of the same spike usingthe MUSIC scan showed a more widespread distribution, with a maximum about 10 mm away from the brain surface.
1064 M. Dümpelmann et al. / Clinical Neurophysiology 120 (2009) 1061–1069
computation of the potentials at the electrodes. Since linear estima-tion gives independent results for each time point, the localizationresult of the sample with the maximum amplitude of the simulateddata was taken into account for the comparison. Table 1 gives anoverview about the simulation results for both source localizationalgorithms.
There was only a small difference (0.5 mm) in the localizationerror between sources with radial and tangential direction. Thelocalization error increased by adding noise to the data. Maximain the localization error were close to the interhemisphericfissure.
The hemisphere containing a denser coverage with electrodesand also the 32 contact grid electrode can be regarded as a regionof interest. The mean errors for this region of interest differed onlyto a small amount (up to 0.3 mm) to the result, which was obtainedfor the whole brain. The maximum localization error was dimin-ished about 35.7 mm in comparison to the whole brain results.
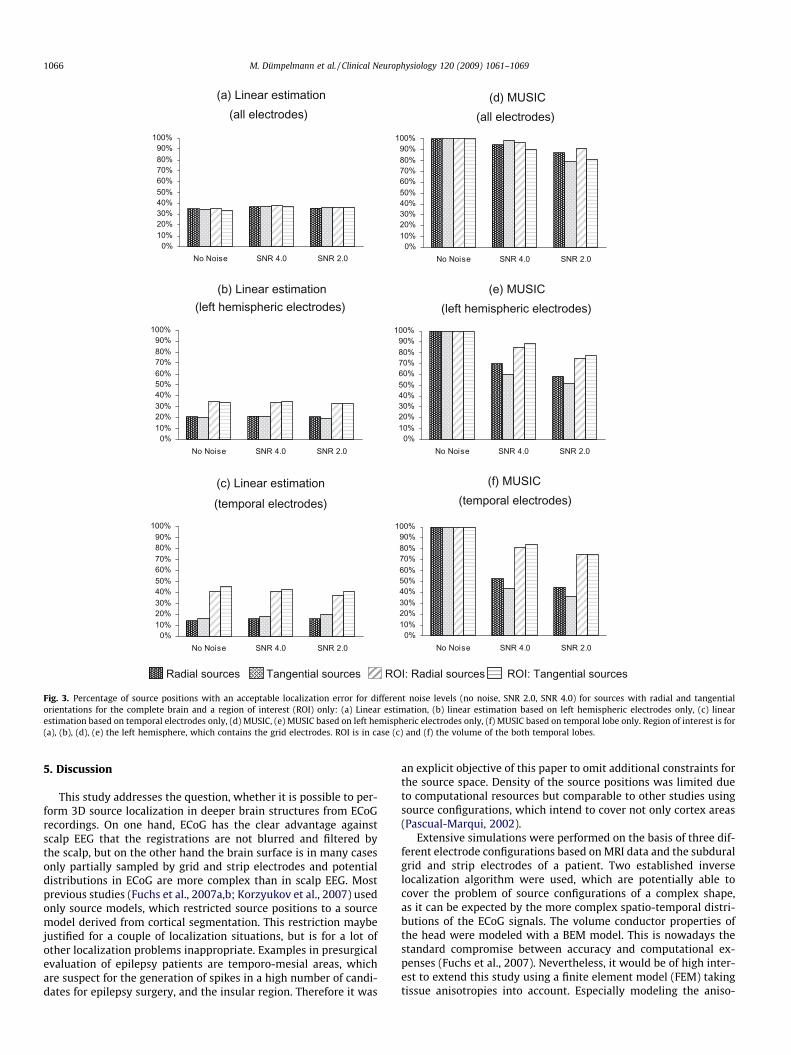
To quantify the amount of the brain volume, for which a reliablelocalization can be achieved, the percentage of original source po-sition was computed, which had a localization error 615 mm(Fig. 3). Examples of 3D maps of the localization error are givenin Figs. 4–6. For data without noise reliable localizations could beachieved for 35.2% of the original source positions with radial ori-
entation and 34.2% with tangential orientation. Noise decreasedthe number of reliable source localizations.
The percentage of reliable localizations increased slightly forsource positions in the left hemisphere.
For left hemispheric only contacts (Fig. 5) the percentage of reli-able localizations decreased to a range between 19.5% and 21.5%.Looking only at the source positions in the left hemisphere the per-centages of positions with reliable localizations was almost in thesame range (32.0–35.1%) as for the localizations using all electrodecontacts.
A reduction to temporal lobe contacts (Fig. 6) gave a range ofreliable localizations between 14.2% and 20.2% of the originalsource positions. For a region of interest consisting of the sum ofthe volumes of the temporal lobe the range of source localizationswith acceptable accuracy was between 36.8% for a SNR of 2.0 andradial source orientations and 45.5% for simulations without noiseand sources with a tangential orientation.
4. MUSIC
For simulated potentials without added noise the global max-ima of the MUSIC scan were identical to the original sourcepositions.
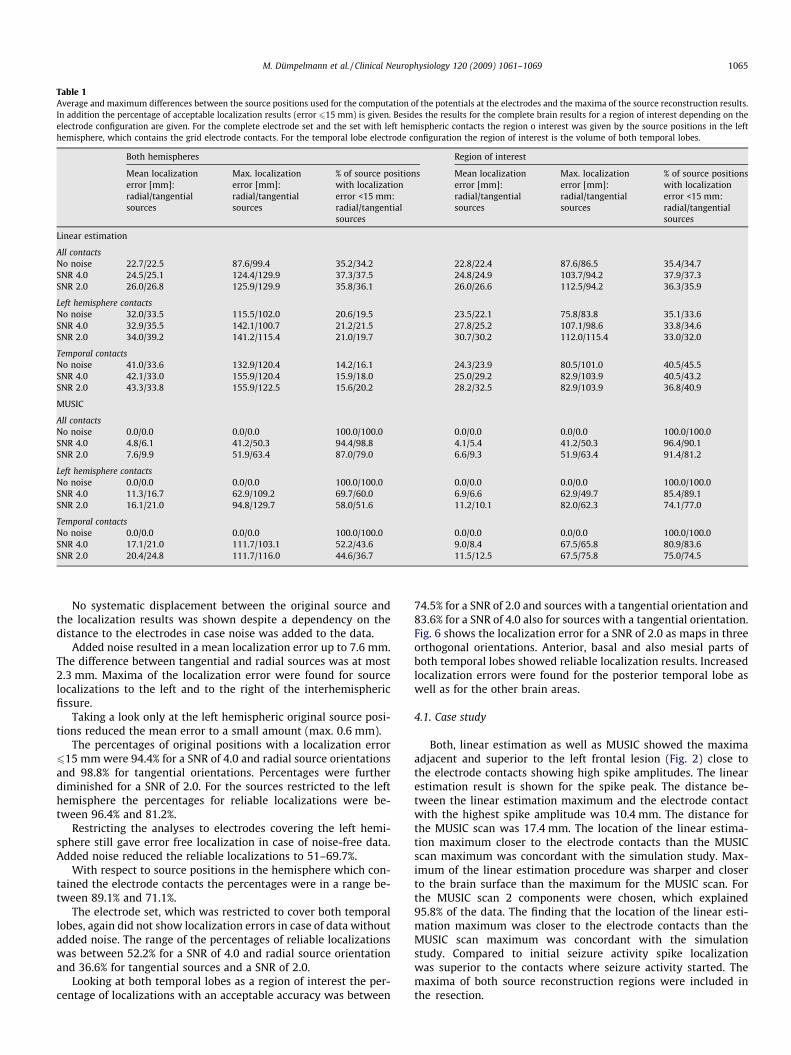
Table 1Average and maximum differences between the source positions used for the computation of the potentials at the electrodes and the maxima of the source reconstruction results.In addition the percentage of acceptable localization results (error 615 mm) is given. Besides the results for the complete brain results for a region of interest depending on theelectrode configuration are given. For the complete electrode set and the set with left hemispheric contacts the region o interest was given by the source positions in the lefthemisphere, which contains the grid electrode contacts. For the temporal lobe electrode configuration the region of interest is the volume of both temporal lobes.
Both hemispheres Region of interest
Mean localizationerror [mm]:radial/tangentialsources
Max. localizationerror [mm]:radial/tangentialsources
% of source positionswith localizationerror <15 mm:radial/tangentialsources
Mean localizationerror [mm]:radial/tangentialsources
Max. localizationerror [mm]:radial/tangentialsources
% of source positionswith localizationerror <15 mm:radial/tangentialsources
Linear estimation
All contactsNo noise 22.7/22.5 87.6/99.4 35.2/34.2 22.8/22.4 87.6/86.5 35.4/34.7SNR 4.0 24.5/25.1 124.4/129.9 37.3/37.5 24.8/24.9 103.7/94.2 37.9/37.3SNR 2.0 26.0/26.8 125.9/129.9 35.8/36.1 26.0/26.6 112.5/94.2 36.3/35.9
Left hemisphere contactsNo noise 32.0/33.5 115.5/102.0 20.6/19.5 23.5/22.1 75.8/83.8 35.1/33.6SNR 4.0 32.9/35.5 142.1/100.7 21.2/21.5 27.8/25.2 107.1/98.6 33.8/34.6SNR 2.0 34.0/39.2 141.2/115.4 21.0/19.7 30.7/30.2 112.0/115.4 33.0/32.0
Temporal contactsNo noise 41.0/33.6 132.9/120.4 14.2/16.1 24.3/23.9 80.5/101.0 40.5/45.5SNR 4.0 42.1/33.0 155.9/120.4 15.9/18.0 25.0/29.2 82.9/103.9 40.5/43.2SNR 2.0 43.3/33.8 155.9/122.5 15.6/20.2 28.2/32.5 82.9/103.9 36.8/40.9
MUSIC
All contactsNo noise 0.0/0.0 0.0/0.0 100.0/100.0 0.0/0.0 0.0/0.0 100.0/100.0SNR 4.0 4.8/6.1 41.2/50.3 94.4/98.8 4.1/5.4 41.2/50.3 96.4/90.1SNR 2.0 7.6/9.9 51.9/63.4 87.0/79.0 6.6/9.3 51.9/63.4 91.4/81.2
Left hemisphere contactsNo noise 0.0/0.0 0.0/0.0 100.0/100.0 0.0/0.0 0.0/0.0 100.0/100.0SNR 4.0 11.3/16.7 62.9/109.2 69.7/60.0 6.9/6.6 62.9/49.7 85.4/89.1SNR 2.0 16.1/21.0 94.8/129.7 58.0/51.6 11.2/10.1 82.0/62.3 74.1/77.0
Temporal contactsNo noise 0.0/0.0 0.0/0.0 100.0/100.0 0.0/0.0 0.0/0.0 100.0/100.0SNR 4.0 17.1/21.0 111.7/103.1 52.2/43.6 9.0/8.4 67.5/65.8 80.9/83.6SNR 2.0 20.4/24.8 111.7/116.0 44.6/36.7 11.5/12.5 67.5/75.8 75.0/74.5
M. Dümpelmann et al. / Clinical Neurophysiology 120 (2009) 1061–1069 1065
No systematic displacement between the original source andthe localization results was shown despite a dependency on thedistance to the electrodes in case noise was added to the data.
Added noise resulted in a mean localization error up to 7.6 mm.The difference between tangential and radial sources was at most2.3 mm. Maxima of the localization error were found for sourcelocalizations to the left and to the right of the interhemisphericfissure.
Taking a look only at the left hemispheric original source posi-tions reduced the mean error to a small amount (max. 0.6 mm).
The percentages of original positions with a localization error615 mm were 94.4% for a SNR of 4.0 and radial source orientationsand 98.8% for tangential orientations. Percentages were furtherdiminished for a SNR of 2.0. For the sources restricted to the lefthemisphere the percentages for reliable localizations were be-tween 96.4% and 81.2%.
Restricting the analyses to electrodes covering the left hemi-sphere still gave error free localization in case of noise-free data.Added noise reduced the reliable localizations to 51–69.7%.
With respect to source positions in the hemisphere which con-tained the electrode contacts the percentages were in a range be-tween 89.1% and 71.1%.
The electrode set, which was restricted to cover both temporallobes, again did not show localization errors in case of data withoutadded noise. The range of the percentages of reliable localizationswas between 52.2% for a SNR of 4.0 and radial source orientationand 36.6% for tangential sources and a SNR of 2.0.
Looking at both temporal lobes as a region of interest the per-centage of localizations with an acceptable accuracy was between
74.5% for a SNR of 2.0 and sources with a tangential orientation and83.6% for a SNR of 4.0 also for sources with a tangential orientation.Fig. 6 shows the localization error for a SNR of 2.0 as maps in threeorthogonal orientations. Anterior, basal and also mesial parts ofboth temporal lobes showed reliable localization results. Increasedlocalization errors were found for the posterior temporal lobe aswell as for the other brain areas.
4.1. Case study
Both, linear estimation as well as MUSIC showed the maximaadjacent and superior to the left frontal lesion (Fig. 2) close tothe electrode contacts showing high spike amplitudes. The linearestimation result is shown for the spike peak. The distance be-tween the linear estimation maximum and the electrode contactwith the highest spike amplitude was 10.4 mm. The distance forthe MUSIC scan was 17.4 mm. The location of the linear estima-tion maximum closer to the electrode contacts than the MUSICscan maximum was concordant with the simulation study. Max-imum of the linear estimation procedure was sharper and closerto the brain surface than the maximum for the MUSIC scan. Forthe MUSIC scan 2 components were chosen, which explained95.8% of the data. The finding that the location of the linear esti-mation maximum was closer to the electrode contacts than theMUSIC scan maximum was concordant with the simulationstudy. Compared to initial seizure activity spike localizationwas superior to the contacts where seizure activity started. Themaxima of both source reconstruction regions were included inthe resection.
0%10%20%30%40%50%60%70%80%90%
100%
0%10%20%30%40%50%60%70%80%90%
100%
0%10%20%30%40%50%60%70%80%90%
100%
0%10%20%30%40%50%60%70%80%90%
100%
0%10%20%30%40%50%60%70%80%90%
100%
0%10%20%30%40%50%60%70%80%90%
100%
No Noise SNR 4.0 SNR 2.0 No Noise SNR 4.0 SNR 2.0
No Noise SNR 4.0 SNR 2.0
No Noise SNR 4.0 SNR 2.0
No Noise SNR 4.0 SNR 2.0
No Noise SNR 4.0 SNR 2.0
Radial sources Tangential sources ROI: Radial sources ROI: Tangential sources
(a) Linear estimation(all electrodes)
(b) Linear estimation(left hemispheric electrodes)
(d) MUSIC(all electrodes)
(e) MUSIC(left hemispheric electrodes)
(c) Linear estimation
(temporal electrodes)
(f) MUSIC(temporal electrodes)
Fig. 3. Percentage of source positions with an acceptable localization error for different noise levels (no noise, SNR 2.0, SNR 4.0) for sources with radial and tangentialorientations for the complete brain and a region of interest (ROI) only: (a) Linear estimation, (b) linear estimation based on left hemispheric electrodes only, (c) linearestimation based on temporal electrodes only, (d) MUSIC, (e) MUSIC based on left hemispheric electrodes only, (f) MUSIC based on temporal lobe only. Region of interest is for(a), (b), (d), (e) the left hemisphere, which contains the grid electrodes. ROI is in case (c) and (f) the volume of the both temporal lobes.
1066 M. Dümpelmann et al. / Clinical Neurophysiology 120 (2009) 1061–1069
5. Discussion
This study addresses the question, whether it is possible to per-form 3D source localization in deeper brain structures from ECoGrecordings. On one hand, ECoG has the clear advantage againstscalp EEG that the registrations are not blurred and filtered bythe scalp, but on the other hand the brain surface is in many casesonly partially sampled by grid and strip electrodes and potentialdistributions in ECoG are more complex than in scalp EEG. Mostprevious studies (Fuchs et al., 2007a,b; Korzyukov et al., 2007) usedonly source models, which restricted source positions to a sourcemodel derived from cortical segmentation. This restriction maybejustified for a couple of localization situations, but is for a lot ofother localization problems inappropriate. Examples in presurgicalevaluation of epilepsy patients are temporo-mesial areas, whichare suspect for the generation of spikes in a high number of candi-dates for epilepsy surgery, and the insular region. Therefore it was
an explicit objective of this paper to omit additional constraints forthe source space. Density of the source positions was limited dueto computational resources but comparable to other studies usingsource configurations, which intend to cover not only cortex areas(Pascual-Marqui, 2002).
Extensive simulations were performed on the basis of three dif-ferent electrode configurations based on MRI data and the subduralgrid and strip electrodes of a patient. Two established inverselocalization algorithm were used, which are potentially able tocover the problem of source configurations of a complex shape,as it can be expected by the more complex spatio-temporal distri-butions of the ECoG signals. The volume conductor properties ofthe head were modeled with a BEM model. This is nowadays thestandard compromise between accuracy and computational ex-penses (Fuchs et al., 2007). Nevertheless, it would be of high inter-est to extend this study using a finite element model (FEM) takingtissue anisotropies into account. Especially modeling the aniso-
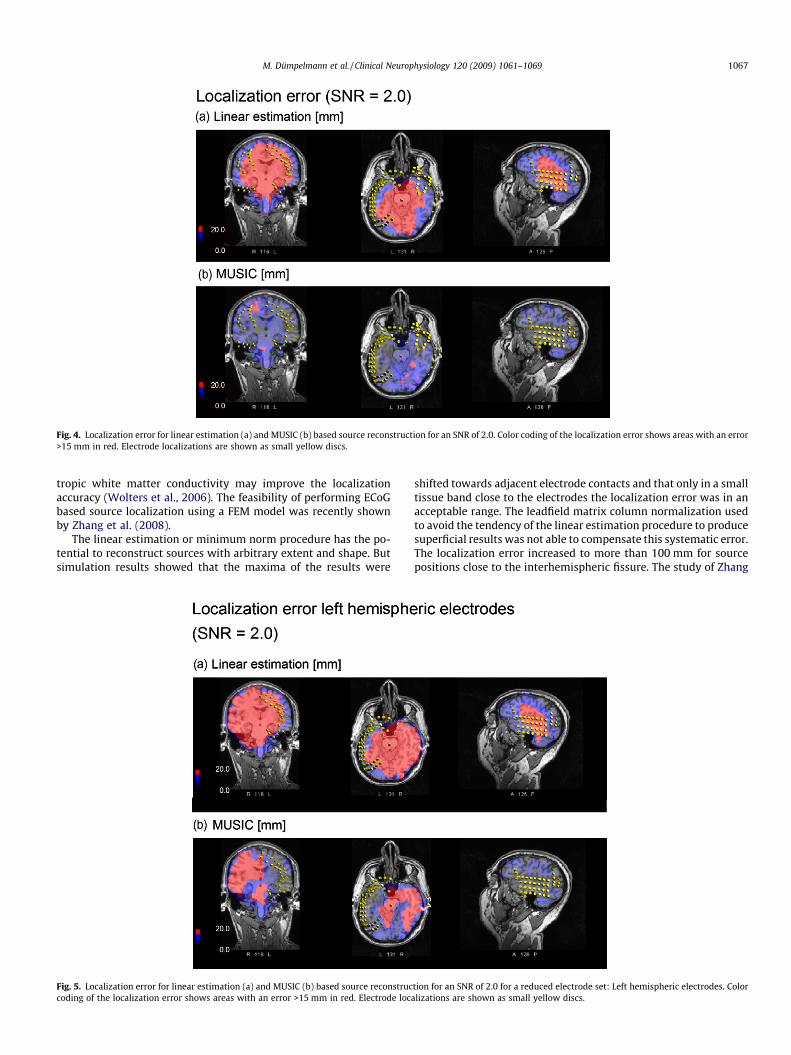
Fig. 4. Localization error for linear estimation (a) and MUSIC (b) based source reconstruction for an SNR of 2.0. Color coding of the localization error shows areas with an error>15 mm in red. Electrode localizations are shown as small yellow discs.
M. Dümpelmann et al. / Clinical Neurophysiology 120 (2009) 1061–1069 1067
tropic white matter conductivity may improve the localizationaccuracy (Wolters et al., 2006). The feasibility of performing ECoGbased source localization using a FEM model was recently shownby Zhang et al. (2008).
The linear estimation or minimum norm procedure has the po-tential to reconstruct sources with arbitrary extent and shape. Butsimulation results showed that the maxima of the results were
Fig. 5. Localization error for linear estimation (a) and MUSIC (b) based source reconstruccoding of the localization error shows areas with an error >15 mm in red. Electrode loca
shifted towards adjacent electrode contacts and that only in a smalltissue band close to the electrodes the localization error was in anacceptable range. The leadfield matrix column normalization usedto avoid the tendency of the linear estimation procedure to producesuperficial results was not able to compensate this systematic error.The localization error increased to more than 100 mm for sourcepositions close to the interhemispheric fissure. The study of Zhang
tion for an SNR of 2.0 for a reduced electrode set: Left hemispheric electrodes. Colorlizations are shown as small yellow discs.
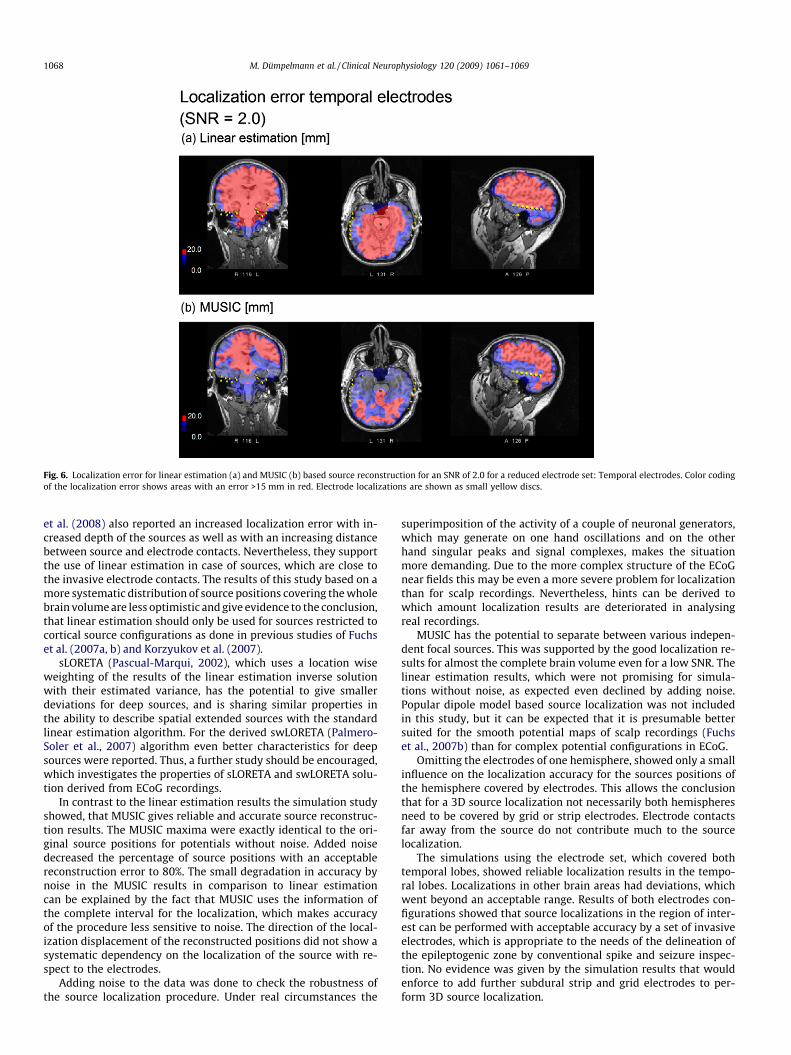
Fig. 6. Localization error for linear estimation (a) and MUSIC (b) based source reconstruction for an SNR of 2.0 for a reduced electrode set: Temporal electrodes. Color codingof the localization error shows areas with an error >15 mm in red. Electrode localizations are shown as small yellow discs.
1068 M. Dümpelmann et al. / Clinical Neurophysiology 120 (2009) 1061–1069
et al. (2008) also reported an increased localization error with in-creased depth of the sources as well as with an increasing distancebetween source and electrode contacts. Nevertheless, they supportthe use of linear estimation in case of sources, which are close tothe invasive electrode contacts. The results of this study based on amore systematic distribution of source positions covering the wholebrain volume are less optimistic and give evidence to the conclusion,that linear estimation should only be used for sources restricted tocortical source configurations as done in previous studies of Fuchset al. (2007a, b) and Korzyukov et al. (2007).
sLORETA (Pascual-Marqui, 2002), which uses a location wiseweighting of the results of the linear estimation inverse solutionwith their estimated variance, has the potential to give smallerdeviations for deep sources, and is sharing similar properties inthe ability to describe spatial extended sources with the standardlinear estimation algorithm. For the derived swLORETA (Palmero-Soler et al., 2007) algorithm even better characteristics for deepsources were reported. Thus, a further study should be encouraged,which investigates the properties of sLORETA and swLORETA solu-tion derived from ECoG recordings.
In contrast to the linear estimation results the simulation studyshowed, that MUSIC gives reliable and accurate source reconstruc-tion results. The MUSIC maxima were exactly identical to the ori-ginal source positions for potentials without noise. Added noisedecreased the percentage of source positions with an acceptablereconstruction error to 80%. The small degradation in accuracy bynoise in the MUSIC results in comparison to linear estimationcan be explained by the fact that MUSIC uses the information ofthe complete interval for the localization, which makes accuracyof the procedure less sensitive to noise. The direction of the local-ization displacement of the reconstructed positions did not show asystematic dependency on the localization of the source with re-spect to the electrodes.
Adding noise to the data was done to check the robustness ofthe source localization procedure. Under real circumstances the
superimposition of the activity of a couple of neuronal generators,which may generate on one hand oscillations and on the otherhand singular peaks and signal complexes, makes the situationmore demanding. Due to the more complex structure of the ECoGnear fields this may be even a more severe problem for localizationthan for scalp recordings. Nevertheless, hints can be derived towhich amount localization results are deteriorated in analysingreal recordings.
MUSIC has the potential to separate between various indepen-dent focal sources. This was supported by the good localization re-sults for almost the complete brain volume even for a low SNR. Thelinear estimation results, which were not promising for simula-tions without noise, as expected even declined by adding noise.Popular dipole model based source localization was not includedin this study, but it can be expected that it is presumable bettersuited for the smooth potential maps of scalp recordings (Fuchset al., 2007b) than for complex potential configurations in ECoG.
Omitting the electrodes of one hemisphere, showed only a smallinfluence on the localization accuracy for the sources positions ofthe hemisphere covered by electrodes. This allows the conclusionthat for a 3D source localization not necessarily both hemispheresneed to be covered by grid or strip electrodes. Electrode contactsfar away from the source do not contribute much to the sourcelocalization.
The simulations using the electrode set, which covered bothtemporal lobes, showed reliable localization results in the tempo-ral lobes. Localizations in other brain areas had deviations, whichwent beyond an acceptable range. Results of both electrodes con-figurations showed that source localizations in the region of inter-est can be performed with acceptable accuracy by a set of invasiveelectrodes, which is appropriate to the needs of the delineation ofthe epileptogenic zone by conventional spike and seizure inspec-tion. No evidence was given by the simulation results that wouldenforce to add further subdural strip and grid electrodes to per-form 3D source localization.
M. Dümpelmann et al. / Clinical Neurophysiology 120 (2009) 1061–1069 1069
The study of Zhang et al. (2008) compared ECoG based sourcereconstruction results to EEG based source reconstruction results.It was concluded, that a higher accuracy of ECoG based localizationcan be achieved for brain regions, which are well covered by thestrip and grid electrodes. Otherwise EEG based localizations willoutperform ECoG localization results. This result is in line withour observation, that reliable source reconstruction can beachieved for parts of the brain volume covered by subdural gridor strip electrodes. Since in clinical cases the placement of invasiveelectrodes is based on a set of carefully evaluated diagnostic find-ings from MRI, ictal features, scalp EEG und neuropsychologicalassessment, it is very likely that structures under investigationfor source localization are well covered by ECoG electrodes andare accessible for accurate source localization.
Differences in localization accuracy were small between a radialand a tangential orientation of the sources. Though tangentialsources showed in general an increased localization error no evi-dence is given to take a special care about the orientation of gen-erators with respect to the localization accuracy.
The presented case study showed that 3D source localizationfrom ECoG has the potential to add valuable additional informationin the localization of the generators of epileptogenic activity. It con-firms the results of the simulation study. Linear estimation maximawere drawn to adjacent electrodes. In contrast MUSIC shows itsmaximum in deeper structures. Both localization maxima wereclose to the contacts, which showed high average spike amplitudes.A discrepancy to the localization of the lesion and the contacts show-ing initial seizure activity was present. Findings gave again evidencethat spatial relationship between irritative zone, ictal onset zone andepileptogenic lesion exist and are still not well understood (Rosenowand Lüders, 2001). It is a little bit surprising, that the maximum of thelinear estimation result was sharper than the maximum of the MU-SIC scan since the latter method is known to be more suited for focalsources than for distributed source configurations. A possible expla-nation could be that the maximum of the linear estimation algo-rithm is highly concentrated at a source position in the focus area,which is close to an electrode, showing a steep descent with increas-ing distance to the electrode. The more diffuse MUSIC scan resultmaybe due to a limited SNR.
Future studies about 3D source localization should cover twotopics. First, it should be investigated whether the use of sLORETAand swLORETA can overcome the problem of the shift of sourcelocalization results towards adjacent electrodes. In a second inde-pendent research branch data from real recordings like evokedpotentials with know generator structures and epilepsy recordingswith an unequivocal relation between a structural alteration andthe generators of epileptogenic activity should be used to evaluatelocalization accuracies under realistic conditions. The promisingresults of the MUSIC algorithm should stimulate further studiesto transfer the results of the simulations to studies including high-er numbers of patients.
The presented simulation studies showed that reliable andaccurate 3D source localization from ECoG recordings using theMUSIC algorithm is possible. Thus, a solid basis is given to use3D source localization with real data recorded from patients. Stan-dard linear estimation procedures should be used only for sourcereconstruction algorithms, which are restricted to a cortical sourcespace. It can be concluded that MUSIC results from ECoG record-ings have the potential to improve the 3D localization of epilepto-
genic activity in presurgical evaluation of epilepsy patients. Theunique opportunity to use ECoG recordings to cognitive researchaccompanying the presurgical procedure can be broadened by 3Dlocalization of cognitive processes in recordings by subdural gridand strip electrodes.
References
Barkley GL, Baumgartner C. MEG and EEG in epilepsy. J Clin Neurophysiol2003;20(3):163–78.
Fuchs M, Wagner M, Köhler T, Wischmann HA. Linear and nonlinear current densityreconstructions. J Clin Neurophysiol 1999;16(3):267–95.
Fuchs M, Wagner M, Kastner J. Development of volume conductor and sourcemodels to localize epileptic foci. J Clin Neurophysiol 2007a;24(2):101–19.
Fuchs M, Wagner M, Kastner J. From ECoG near fields to EEG and MEG far fields. In:Cheyne D, Ross B, Stroink G, Weinberg H, editors. New frontiers inbiomagnetism, ICS 1300. Amsterdam: Elsevier; 2007b. p. 125–8.
Gavaret M, Badier JM, Marquis P, Bartolomei F, Chauvel P. Electric source imaging intemporal lobe epilepsy. J Clin Neurophysiol 2004;21(4):267–82.
Gavaret M, Badier JM, Marquis P, McGonigal A, Bartolomei F, Regis J, et al. Electricsource imaging in frontal lobe epilepsy. J Clin Neurophysiol 2006;23(4):358–70.
Jansen FE, Huiskamp G, van Huffelen AC, Bourez-Swart M, Boere E, Gebbink T, et al.Identification of the epileptogenic tuber in patients with tuberous sclerosis: acomparison of high-resolution EEG and MEG. Epilepsia 2006;47:108–14.
Hämäläinen M, Ilmoniemi RJ. Interpreting measured magnetic fields of the brain:estimates of current distributions. Technical Report TKK-F-A559, HelsinkiUniversity of Technology, Helsinki, 1984.
Kobayashi K, Akiyama T, Nakahori T, Yoshinaga H, Gotman J. Systematic sourceestimation of spikes by a combination of independent component analysis,RAP-MUSIC. I: principles and simulation study. Clin Neurophysiol2002a;113(5):713–24.
Kobayashi K, Akiyama T, Nakahori T, Yoshinaga H, Gotman J. Systematic sourceestimation of spikes by a combination of independent component analysis,RAP-MUSIC. II: preliminary clinical application. Clin Neurophysiol2002b;113(5):725–34.
Knösche TR, Praamstra P, Stegeman D, Peters M. Linear estimation discriminatesmidline sources and a motor cortex contribution to the readiness potential.Electroenceph clin Neurophysiol. 1996;99:183–90.
Knösche TR, Solutions of the neuroelectromagnetic inverse problem – an evaluationstudy. Ph.D. thesis, University of Twente Enschede, The Netherlands, 1997.
Knösche TR, Neuhaus C, Haueisen J, Alter K, Maess B, Witte OW, et al. Perception ofphrase structure in music. Hum Brain Mapp 2005;24(4):259–73.
Korzyukov O, Pflieger ME, Wagner M, Bowyer SM, Rosburg T, Sundaresan K, et al.Generators of the intracranial P50 response in auditory sensory gating.Neuroimage 2007;35(2):814–26.
Michel CM, Murray MM, Lantz G, Gonzalez S, Spinelli L, Grave de Peralta R. EEGsource imaging. Clin Neurophysiol 2004;115(10):2195–222.
Mosher JC, Lewis PS, Leahy RM. Multiple dipole modeling and localization fromspatio-temporal MEG data. IEEE Trans Biomed Eng 1992;39:541–57.
Mosher JC, Baillet S, Leahy RM. EEG source localization and imaging using multiplesignal classification approaches. J Clin Neurophysiol 1999;16:225–38.
Palmero-Soler E, Dolan K, Hadamschek V, Tass PA. SwLORETA: a novel approach torobust source localization and synchronization tomography. Phys Med Biol2007;52(7):1783–800.
Pascual-Marqui RD. Standardized low-resolution brain electromagnetictomography (sLORETA): technical details. Methods Find Exp Clin Pharmacol2002;24(Suppl. D):5–12.
Plummer C, Harvey AS, Cook M. EEG source localization in focal epilepsy: where arewe now? Epilepsia 2008;49(2):201–18.
Rosenow F, Lüders H. Presurgical evaluation of epilepsy. Brain2001;124(9):1683–700.
SimBio; A generic environment for bio-numerical simulation, IST-Program of theEuropean Commission, Project No.10378, 2000–2003. Available from: http://www.simbio.de.
Wolters CH, Anwander A, Tricoche X, Weinstein D, Koch MA, MacLeod RS. Influenceof tissue conductivity anisotropy on EEG/MEG field and return currentcomputation in a realistic head model: a simulation and visualization studyusing high-resolution finite element modeling. Neuroimage2006;15(30(3)):813–26.
Zanow F, Knösche TR. ASA – advanced source analysis of continuous and event-related EEG/MEG signals. Brain Topogr 2004;16(4):287–90.
Zhang Y, Van Drongelen W, Kohrman M, He B. Three-dimensional brain currentsource reconstruction from intra-cranial ECoG recordings. Neuroimage2008;15(42(2)):683–95.