Embed Size (px)
Citation preview
GPN2016-010
GPN Working Paper Series
3D Printing and Global Value Chains: How a new technology may restructure
global production
MÄRTHA REHNBERG* AND STEFANO PONTE**
* DareDisrupt
** Department of Business and Politics, Copenhagen Business School
September 2016
1
3D Printing and Global Value Chains: How a new technology may restructure global production
MÄRTHA REHNBERG* AND STEFANO PONTE**
* DareDisrupt
** Department of Business and Politics, Copenhagen Business School [email protected]
Manuscript for the GPN@NUS Working Paper series
Abstract From the birth of industrialization, access to new technology has been a decisive factor in how value added is created and distributed across networks of global production. This article provides a balanced assessment of the potential impact that one of these technologies (3D printing, or 3DP) may have on the structure of Global Value Chains (GVCs). It examines the upgrading opportunities that 3DP provides, and develops two scenarios of the possible impact of 3DP on GVC restructuring: a complementarity scenario, where 3DP is applied to shorten the development cycles of products that are mass-produced using traditional technology and organization; and a substitution scenario, where 3DP partially replaces traditional manufacturing. These two are likely to co-exist for a period of time, but each has distinctive implications in terms of distribution of value added along GVCs and geographically. Keywords 3D PRINTING, GLOBAL VALUE CHAINS, GOVERNANCE, UPGRADING, MANUFACTURING, INDUSTRIAL RESTRUCTURING
2
3D Printing and Global Value Chains: How a new technology may restructure global production
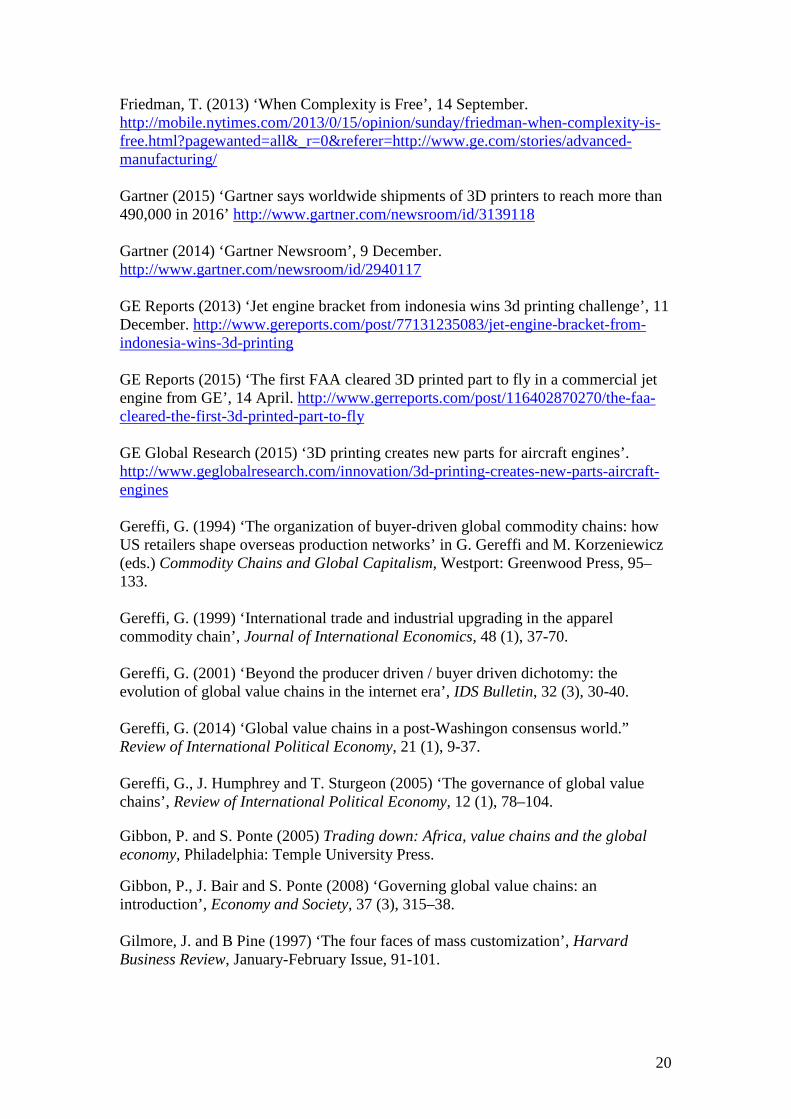
Technological advances have been crucial in changing the way in which production is organized across time and space. The steam engine, broadly applied throughout the 19th century, made transportation and manufacturing economic in ways that allowed the spatial separation of production from consumption. Information and communication technology (ICT) in the second half of the 20th century facilitated the global outsourcing and offshoring of manufacturing activities, and the organization of economic activity in Global Value Chains (GVCs) – chains of activities from extraction, to processing and consumption, that are dispersed globally but centrally governed by ‘lead firms’ (Gereffi 1994). The advent of the Internet has facilitated further restructuring, with outsourcing expanding also to services. The digitization of value chains and the growth of automated manufacturing technologies, such as Three-Dimensional Printing (3DP), are currently fueling new restructuring dynamics. The EU claims that the increasing adoption of 3DP will usher the ‘Factories of the Future’. Germany goes further to frame 3DP into a new manufacturing model, called ‘Industrie 4.0’. In the US, President Obama (2013) refers to 3DP as a tool for ‘making America a magnet for new jobs and manufacturing’, also highlighting real or imagined situations where ‘once-shuttered warehouse . . . [become] a state-of-the-art lab where new workers are mastering the art of 3D printing that has the potential to revolutionize the way we make everything’. General Electrics (GE) has recently presented its new LEAP Engine to the aerospace industry, which is equipped with 19 3D-printed fuel nozzles in alloyed metal – extending the product lifetime by a factor of five, decreasing weight by 25%, and reducing its assembly from 18 parts to one (GE Reports 2015). GE plans to execute its plan to 3D print in-house 30% of its product portfolio by 2020, thus joining fellow American business leaders such as Apple and Ford in their vision of a ‘Made in America’ (GE Reports 2015; Friedman 2013; Obama 2013). According to technology research advisory firm Gartner, the boom in 3DP has only just begun. Gartner (2015) estimates that worldwide shipments of 3D printers in 2015 was close to 250,000 units, and likely to double between 2016 and 2019 to reach a value of USD 5.6 billion. The demand for 3DP is not only driven by heavy players like GE, but also by private consumers, start-ups and learning institutes. The rise of so-called ‘Fablabs’, platforms for innovation and local entrepreneurship, suggests a possible ‘re-artisanalization’ of manufacturing, where 3DP could facilitate production moving out of industrial factories and back into the small and local workshops that characterized production before the industrial revolution. Today, more than 600 Fablabs exist globally, and almost half of them can be found in Europe (Appendix 1). Popular media has coupled 3DP with the word ‘revolution’, be it ‘industrial revolution’ (The Economist 2012), ‘manufacturing revolution’ (AT Kearney 2015), or part of ‘the fourth industrial revolution’, as suggested by the World Economic Forum (Schwab 2016). But research institutes sill struggle to accurately measure the market for 3D printing. JP Morgan forecasts a growth to 7 billion USD by 2020, whereas Morgan Stanley’s estimate is 22 billion USD (Forbes 2015). In terms of impact on other industries globally, McKinsey (2014) says it is likely to exceed USD 550 billion
3
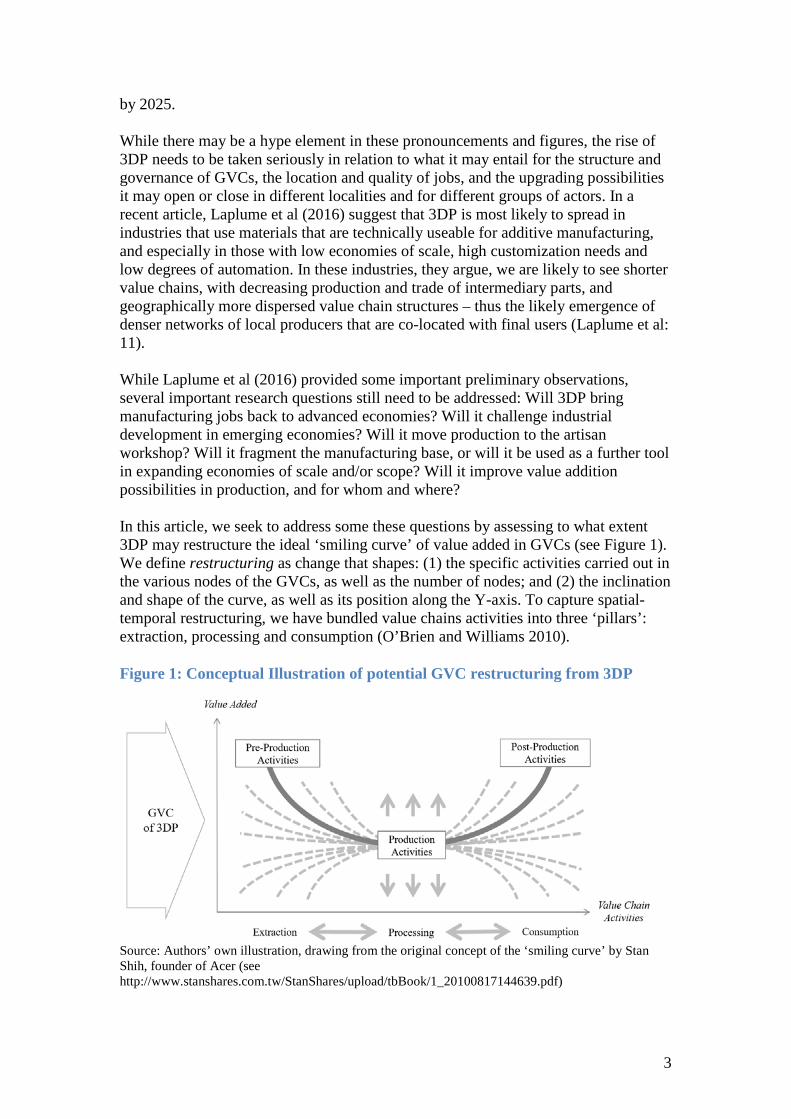
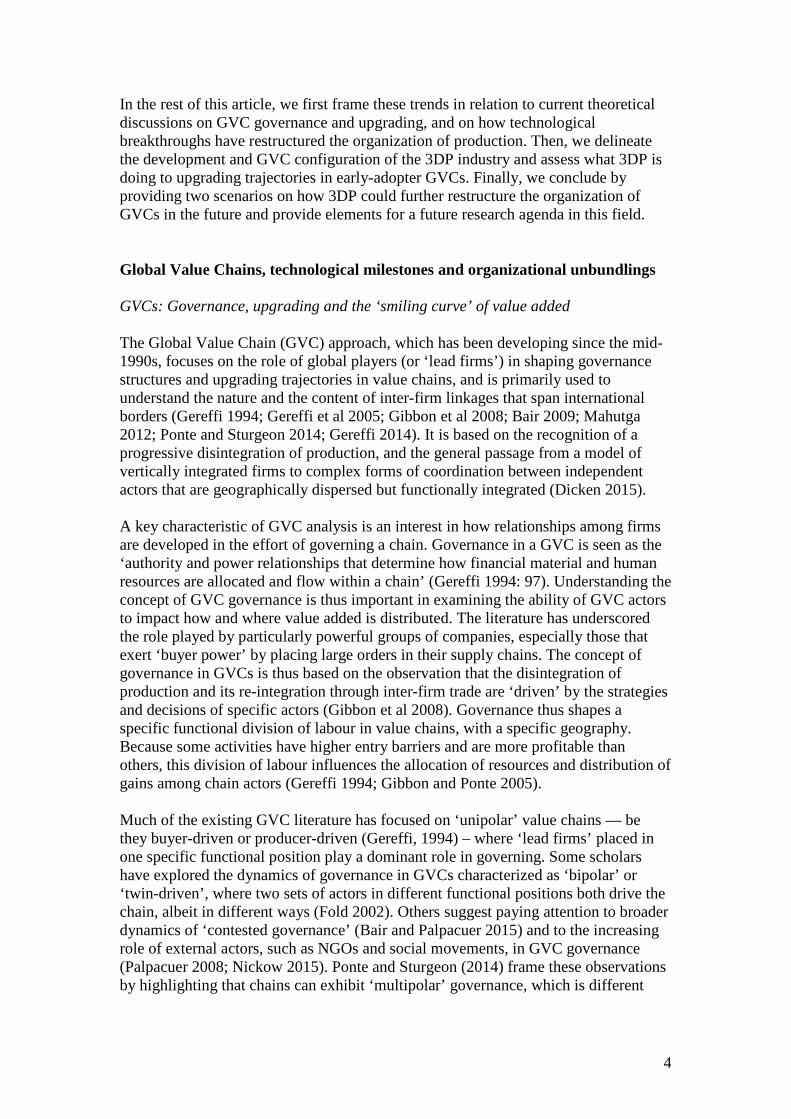
by 2025. While there may be a hype element in these pronouncements and figures, the rise of 3DP needs to be taken seriously in relation to what it may entail for the structure and governance of GVCs, the location and quality of jobs, and the upgrading possibilities it may open or close in different localities and for different groups of actors. In a recent article, Laplume et al (2016) suggest that 3DP is most likely to spread in industries that use materials that are technically useable for additive manufacturing, and especially in those with low economies of scale, high customization needs and low degrees of automation. In these industries, they argue, we are likely to see shorter value chains, with decreasing production and trade of intermediary parts, and geographically more dispersed value chain structures – thus the likely emergence of denser networks of local producers that are co-located with final users (Laplume et al: 11). While Laplume et al (2016) provided some important preliminary observations, several important research questions still need to be addressed: Will 3DP bring manufacturing jobs back to advanced economies? Will it challenge industrial development in emerging economies? Will it move production to the artisan workshop? Will it fragment the manufacturing base, or will it be used as a further tool in expanding economies of scale and/or scope? Will it improve value addition possibilities in production, and for whom and where? In this article, we seek to address some these questions by assessing to what extent 3DP may restructure the ideal ‘smiling curve’ of value added in GVCs (see Figure 1). We define restructuring as change that shapes: (1) the specific activities carried out in the various nodes of the GVCs, as well as the number of nodes; and (2) the inclination and shape of the curve, as well as its position along the Y-axis. To capture spatial-temporal restructuring, we have bundled value chains activities into three ‘pillars’: extraction, processing and consumption (O’Brien and Williams 2010). Figure 1: Conceptual Illustration of potential GVC restructuring from 3DP
Source: Authors’ own illustration, drawing from the original concept of the ‘smiling curve’ by Stan Shih, founder of Acer (see http://www.stanshares.com.tw/StanShares/upload/tbBook/1_20100817144639.pdf)
4
In the rest of this article, we first frame these trends in relation to current theoretical discussions on GVC governance and upgrading, and on how technological breakthroughs have restructured the organization of production. Then, we delineate the development and GVC configuration of the 3DP industry and assess what 3DP is doing to upgrading trajectories in early-adopter GVCs. Finally, we conclude by providing two scenarios on how 3DP could further restructure the organization of GVCs in the future and provide elements for a future research agenda in this field. Global Value Chains, technological milestones and organizational unbundlings GVCs: Governance, upgrading and the ‘smiling curve’ of value added The Global Value Chain (GVC) approach, which has been developing since the mid-1990s, focuses on the role of global players (or ‘lead firms’) in shaping governance structures and upgrading trajectories in value chains, and is primarily used to understand the nature and the content of inter-firm linkages that span international borders (Gereffi 1994; Gereffi et al 2005; Gibbon et al 2008; Bair 2009; Mahutga 2012; Ponte and Sturgeon 2014; Gereffi 2014). It is based on the recognition of a progressive disintegration of production, and the general passage from a model of vertically integrated firms to complex forms of coordination between independent actors that are geographically dispersed but functionally integrated (Dicken 2015). A key characteristic of GVC analysis is an interest in how relationships among firms are developed in the effort of governing a chain. Governance in a GVC is seen as the ‘authority and power relationships that determine how financial material and human resources are allocated and flow within a chain’ (Gereffi 1994: 97). Understanding the concept of GVC governance is thus important in examining the ability of GVC actors to impact how and where value added is distributed. The literature has underscored the role played by particularly powerful groups of companies, especially those that exert ‘buyer power’ by placing large orders in their supply chains. The concept of governance in GVCs is thus based on the observation that the disintegration of production and its re-integration through inter-firm trade are ‘driven’ by the strategies and decisions of specific actors (Gibbon et al 2008). Governance thus shapes a specific functional division of labour in value chains, with a specific geography. Because some activities have higher entry barriers and are more profitable than others, this division of labour influences the allocation of resources and distribution of gains among chain actors (Gereffi 1994; Gibbon and Ponte 2005). Much of the existing GVC literature has focused on ‘unipolar’ value chains — be they buyer-driven or producer-driven (Gereffi, 1994) – where ‘lead firms’ placed in one specific functional position play a dominant role in governing. Some scholars have explored the dynamics of governance in GVCs characterized as ‘bipolar’ or ‘twin-driven’, where two sets of actors in different functional positions both drive the chain, albeit in different ways (Fold 2002). Others suggest paying attention to broader dynamics of ‘contested governance’ (Bair and Palpacuer 2015) and to the increasing role of external actors, such as NGOs and social movements, in GVC governance (Palpacuer 2008; Nickow 2015). Ponte and Sturgeon (2014) frame these observations by highlighting that chains can exhibit ‘multipolar’ governance, which is different
5
from ‘market’ as these chains are strongly shaped by the explicit strategic actions of numerous powerful actors – both inside and outside the chain. In GVC analysis, the term upgrading has been used to highlight paths for value chain actors to ‘move up the value chain’ for economic gain. The upgrading process is examined through the lenses of how knowledge and information flow within value chains from lead firms to their suppliers (or buyers) (Gereffi 1999), with a particular interest on the consequences for entry barriers and distribution of gains (Bair and Gereffi 2003). Upgrading is traditionally analysed through four categories (Humphrey and Schmitz 2002): (1) product upgrading: moving into more sophisticated products with increased unit value; (2) process upgrading: achieving a more efficient transformation of inputs into outputs through the reorganization of productive activities; (3) functional upgrading: acquiring new functions (or abandoning old ones) that increase the skill content of activities; and (4) inter-chain upgrading: applying competences acquired in one function of a chain and using them in a different sector/chain. GVC scholars initially focused on a ‘high road’ to upgrading, eventually leading to performing functions in a value chain that have more skill and knowledge content (functional upgrading) (Gereffi 1999). But the more recent literature has highlighted a more complex set of upgrading (and downgrading) trajectories (Tokatli 2007; Ponte and Ewert 2009; Cattaneo et al 2010; Ponte et al 2014), while other scholars are re-framing the upgrading discussion in relation to the charting of ‘value capture trajectories’ (Coe and Yeung 2015). The notion that certain activities in GVCs add more value to the end product than others has not only affected industrial policy, but also the way powerful lead firms organize value chain activities along the three pillars of extraction, processing and consumption. In 1992 Stan Shih, CEO of the IT company Acer, started steering the company away from manufacturing, to focus on developing new service products and strengthening the Acer brand (Baldwin 2012; Shih et al 2012). He called this construct ‘the smiling curve’ (see Figure 1), where ‘the high added-values are located on both ends, the up- and down-streams of an industrial segmental chain . . . The middle stream industrial segment, in the middle of a smiling curve, for assembly works, had become the lowest added-value portion’ (Shih n.d.). But the ability to unbundle and outsource low value adding activities from the core organization of lead firms presupposes the ability to create technological breakthroughs or to access them. Therefore, in the second part of this section, we examine three technological milestones that have enabled major organizational unbundlings across the extraction, processing and consumption pillars of GVCs. Technological milestones and organizational unbundlings Three technological milestones have shaped existing structures and organization of economic activity (Baldwin 2013). These technologies include: the steam revolution, information and communications technology (ICT), and the Internet. Although the latter can be considered a tool under ICT, separating the two is useful to clarify the decisive spatial-temporal effect on GVC restructuring brought forth by the Internet (Gereffi 2001). Here, we are not focused on debating technological or industrial ‘revolutions’ per se, but rather on analyzing in broad strokes the impact of specific
6
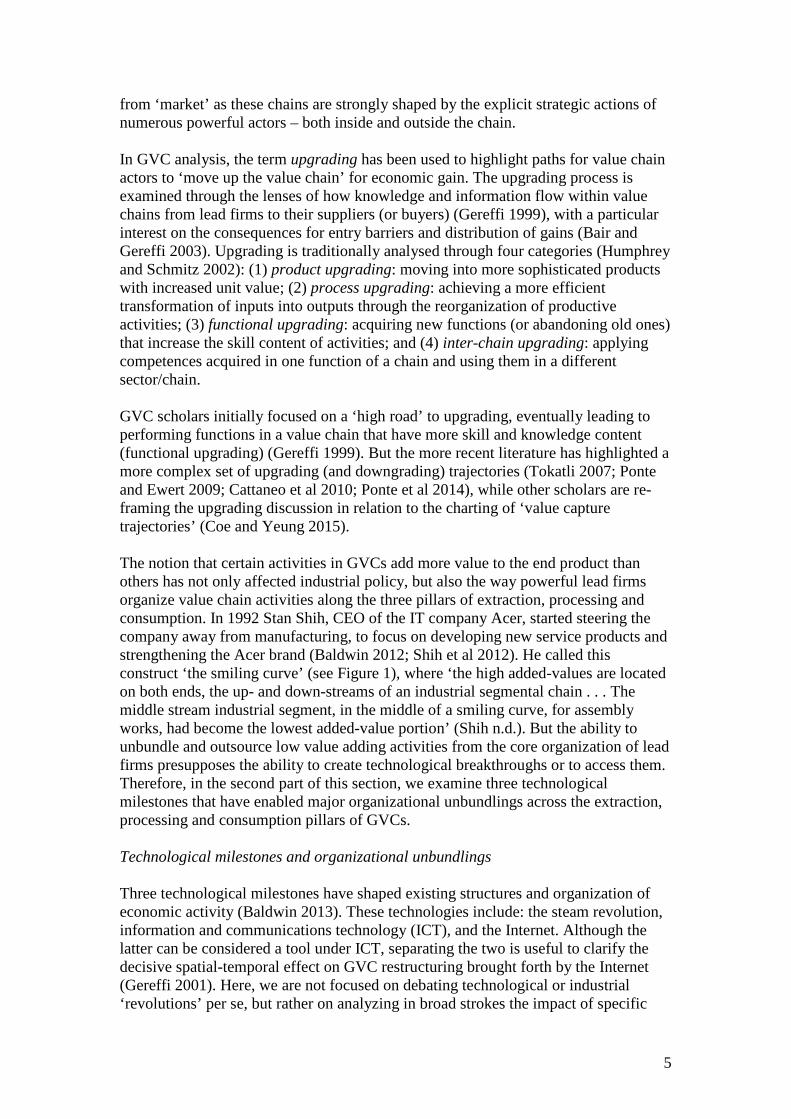
milestones on GVC restructuring processes. This provides an important background to the analysis of 3DP, a key technology underpinning the current digitization and automation of production. According to Baldwin (2013), a first ‘wave of unbundling’ in production started with the steam revolution in the 19th century, which significantly decreased the cost of transportation, thus making it possible to spatially separate the pillars of processing and consumption (see Figure 2, top part). But because the cost of coordination and control across space remained high, production continued to be highly local in the Global North – in what Baldwin calls ‘the globalization paradox’ of the first unbundling (Baldwin 2013: 16). The locus of power in this period resided in vertically-integrated companies in the Global North, which were able to supply faraway markets with their products – a costly endeavor that held barriers of entry to manufacturing high in the Global South (Baldwin 2011). The first unbundling was associated with the increasing dominance of what Gereffi (1994) calls ‘producer-driven’ GVCs. Figure 2: Historical trajectories of GVC restructuring from technological breakthroughs
Source: Authors’ own illustration
7
A second wave of unbundling followed the post WW II period (Baldwin 2011), and particularly from the 1970s onwards, when information and communication technologies (ICT) reduced the cost of control and coordination, and containerization further decreased transport costs (Baldwin 2008). Outsourcing manufacturing became so cheap that activities within the processing pillar were separated into sub-activities and spread out geographically (see Figure 2, central part), accompanied by a dramatic increase of trade in intermediate, rather than finished, goods (Cattaneo et al 2010). For countries in the Global North, the outsourcing of manufacturing enabled by ICT meant that value addition was pursued especially in activities leading up to manufacturing, such as R&D and design, and in activities following after manufacturing, such as marketing and sales. For Global North companies this meant focusing on internal intangible assets in-house and outsourcing tangible activities in the processing pillar to labor-rich economies in the Global South. Participation by the Global South in manufacturing became no longer dependent upon building entire industries, but on joining specific functions in existing GVCs. The second unbundling coincided with the emergence of what Gereffi (1994) calls ‘buyer-driven’ GVCs, where power is exercised through defining standards and choosing from a variety of suppliers in different locations. Since around the turn of this century, the Internet made the distribution of information instant and nearly free, which set the stage for a ‘third unbundling’ of activities (see Figure 2, bottom part) that in previous periods had been viewed as inappropriate for outsourcing and offshoring (Gereffi 2001). While in 1993 only 1% of global information was shared over the Internet, by 2007 this figure had grown to 97% (Hilbert and López 2011). As a result, ‘computerization of work and emergence of low-cost international communications enabled a surprisingly wide range of service tasks to be standardized, fragmented, codified, modularized, and more readily sourced externally and cheaply transported across vast distances’ (Sturgeon 2013: 3). Starting in the early 2000s, service functions such as IT, logistics and facility management became increasingly outsourced to external firms (Low 2013). This in turn gave rise to new players specializing in supplying specific services across a diverse set of GVCs, and to the creation of new nodes in GVCs representing new specialized tasks (Sturgeon 2013). Some scholars thus argue that we have witnessed a movement from trade in goods to trade in intermediary goods, followed by a switch to ‘trade in tasks’ (Low 2013; Kadarusman and Nadvi 2013). In this context, controlling entire GVCs has become less important for lead firms, which instead focus on the management of networked GVC activities. The management of reputation, sustainability and relations with civil society groups has also become increasingly important – entailing that governance tends to become more ‘multipolar’ (Ponte and Sturgeon 2014) and more dispersed, and that power relations have become more complex to observe. The Global Value Chain of 3D Printing The first version of 3DP was developed under a research project at the University of Texas in the late 1980s. 3DP remained a technology mainly used by and for engineers until the mid-2000s (Lipson and Kurman 2013), when Peter Weijmarshausen founded one of the first C2C platforms for 3DP, called Shapeways – with the vision ‘to give
8
anyone access to manufacturing’ (The Creators Project 2013: 00:57). Around this time, the technology had become cheap enough to penetrate the markets of early enthusiasts for home use, and of designers in most R&D departments for prototyping purposes. But 3DP took off decisively when it became ready for metal applications, and today the market for 3DP final end-parts is growing at a 60% compounded average growth rate (McKinsey 2014). In addition to the advancement of 3DP technology itself, the contemporary growth of 3DP can be explained by correlating trends in technology, business and industrial policy. 3DP is part of a group of technological advances that relate to the automation of manufacturing processes, which include robotics, big data analytics and the Internet of Things (Gress and Kalafsky 2015). Amberg, one of the first ‘smart factories’ in Europe, has worked with automation since 1989. Today, machines and computers at Amberg handle 75% of the processing pillar (Zaske 2015), with automation processes supported by the proliferation of information and by big data analytics (Phillips 2014; Stank et al 2013; Woodward 2015). Big data analytics has been a key in the digitization of value chains globally, making them more agile and apt to respond to consumer demands in real-time (Woodward 2015). Related to these trends is also that of sharing information along and between chains, and the emergence of technological platforms that allow such practices (Gereffi 2001). In relation to 3DP, open source platforms have played a key role in both developing the technology and in facilitating its widespread adoption in the ‘maker’ and ‘do-it-yourself’ 3DP communities (Berman 2012; de Jong and de Bruijn 2013; Lipson and Kurman 2013). The technological advances that converge with 3DP have driven three other trends. First is the increased focus on service, referred to in the GVC literature as the increasing commodification of intangible activities (Gereffi 2001; Sturgeon 2013). According to the World Bank (2012), the share of services in world GDP and in terms of value added has risen steadily over the past decades: from 53% in 1970, to more than 70% in 2010. ‘Servitization’ (Vandermerwe and Rada 1988: 314), ‘manuservices’ (Bryson and Daniels 2010: 88) or ‘servicification’ (Low 2013: 2) are some of the concepts used to describe how services have become ‘intimately intertwined with manufacturing in all phases, from design and innovation to recycling and waste management’ (Gress and Kalafsky 2015: 45). The drive towards servitization is also linked to the profitability of demand management (Christopher and Ryals 2014: 29) and of mass customization (Gilmore and Pine 1997: 91). Due to the richness of data and open source platforms in which data can be shared between selected nodes in GVCs, Gress and Kalafsky (2015: 47) argue that the future of supply chain management is actually ‘demand chain management’, or the ability ‘to anticipate, understand, and articulate demand’, thus realizing ‘mass customization’ (Gilmore and Pine 1997). From the perspective of industrial policy, these technological and organizational megatrends have by large been supported by the public sector – discursively and financially (Mazzucato 2013). Germany pledged to invest €200 million in 2015-16 to spur ‘the fourth industrial revolution’ across government, academia and business (Merkel, in Zaske 2015). The EU has set aside €1.15 billion between 2014 and 2020, to support the ‘Factories of the Future’ and develop ‘high-tech manufacturing processes, including 3D printing (European Commission 2013). Similar investments
9
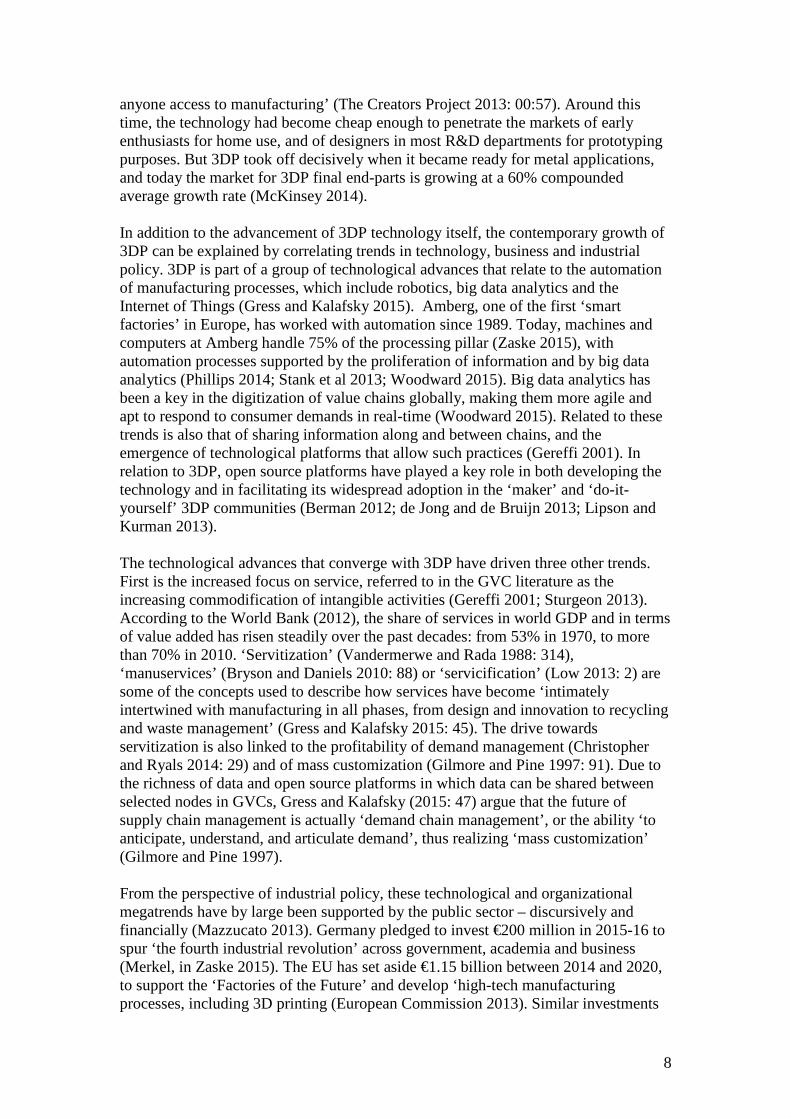
are targeted towards US manufacturing ‘to bring jobs back home’ (Obama 2013), including the earmarking of USD 2.4 billion in 2016 alone to support ‘advanced manufacturing’ technologies such as 3DP (Koizumi 2015). Public sectors in South Korea, China and South Africa are also taking similar steps. Some argue that, in terms of industrial policy, we are actually witnessing a ‘manufacturing renaissance’ (Mosconi 2015) where in-sourcing manufacturing and focusing on ‘core competencies’ are no longer contradictory (Cattaneo et al 2010: 29). Building manufacturing capacities locally also seems to confirm a trend towards regionalization (Baldwin 2013) and the rise of ‘South-South’ trade among lead firms based in emerging economies (Bamper et al 2014: 10). Figure 3: The GVC of 3D Printing
Figure 3a
Figure 3b
Notes (Figures 3a and 3b): revenue figures in USD bn, 2013 Source: Authors’ own, on the basis of categorizations and statistics from Wohlers Report 2014 (pp. 20, 99-129)
10
In Figure 3a, we depict the 3DP value chain in various nodes organized along the same three pillars used in Figure 1: extraction (software required to design a 3D-printable part, raw materials), processing (hardware with which to print), and consumption (the service bureau that actually prints, unless this is done in-house as in the case of GE’s fuel nozzle). In parentheses are estimations of the market size of each node, which determine the approximate vertical position of nodes along the Y-axis. In relation to 3DP hardware, we follow an established distinction between higher-end systems (HES) with a market price above USD 5,000, and lower-end systems (LES) with a market price below that level (Wohlers 2014). Figure 3b indicates the firms that dominate each node or pillar in the 3DP GVC, together with estimates of their revenue. There are at least three analytical points worth noting from our ideal-typical depiction. First is the youth of the industry, reflected in the number of dominant firms that have not yet gone public (Wohlers 2014). As a consequence, it is difficult to get a full picture of value added. Supporting claims of the low maturity level of the industry are the numerous smaller organizations developing LES or offering 3DP services through global platforms (such as 3DHubs), which connect both owners of LES and HES to global demand in 3D-printed goods. Second, the origin of lead suppliers in the industry supports the argument that some degree of regionalization and re-industrialization, driven by advanced economies with a strong history in manufacturing, may be taking place (Gress and Kalafsky 2015). This applies to both production and demand. Most 3DP production is kept in-house in the country of origin of the suppliers. As for consumption, 40% of 3DP systems in 2012 were installed in North America, 30% in Europe, 26% in Asia/ Pacific and only 4% in other locations (Wohlers 2014: 26). Third, and specifically valuable to the discussion of GVC governance, the largest players so far are vertically integrated and provide goods and services across the entire GVC of 3DP. Such integration suggests that suppliers are competing to become the preferred supplier of dominant designs in terms of the underlying technology and raw materials. Taking a closer look at product offerings reveal that most of the HES hardware in fact require customers to use both the design software and the proprietary raw material from the same supplier of hardware (Berman 2012). This vertical integration may also suggest that a high level of control and coordination is required along the GVC of 3DP for suppliers to maintain the quality of products and/or to protect their intellectual property. From the point of view of buyers of 3DP services, it seems to enable a higher level of control and coordination in more affordable ways, either because of cheap automation and digitization, and/or because of profitable mass customization. In the next section, we examine the value chain nodes in which 3DP is being adopted in early-mover GVCs, and how this is defining upgrading possibilities and trajectories. We will then examine how these trends may be (re)shaping the ‘smiling curve’ of value added along GVCs.
11
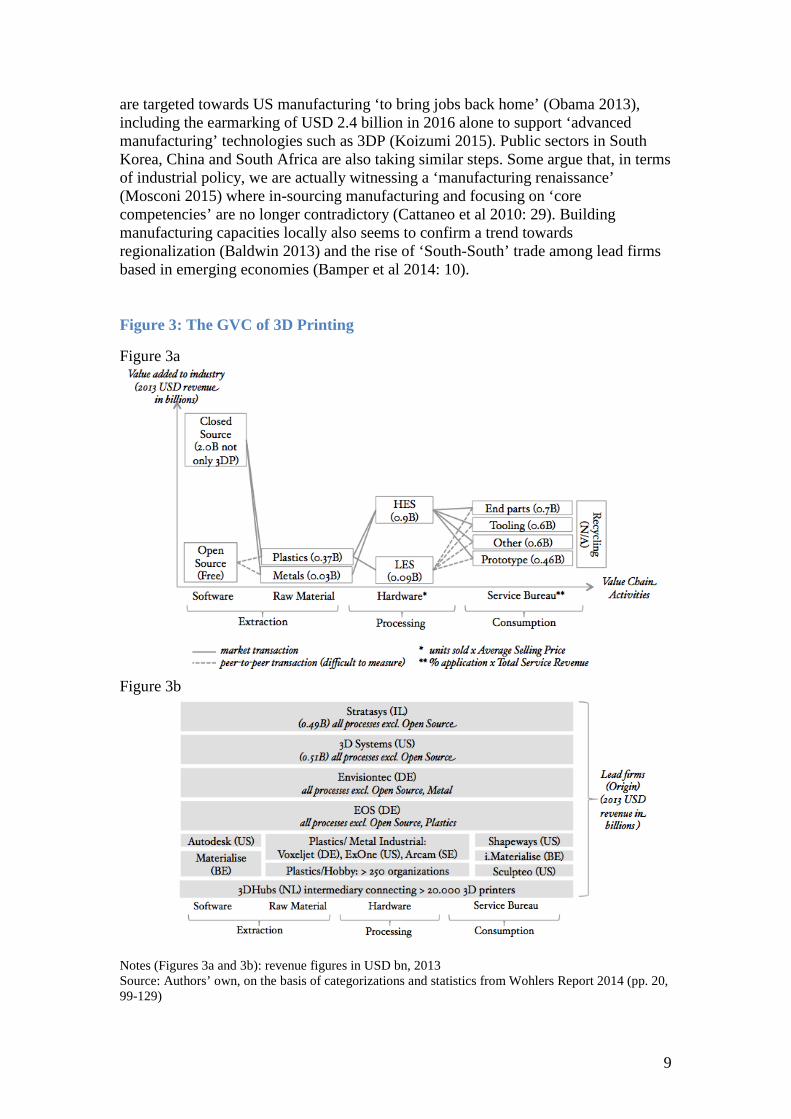
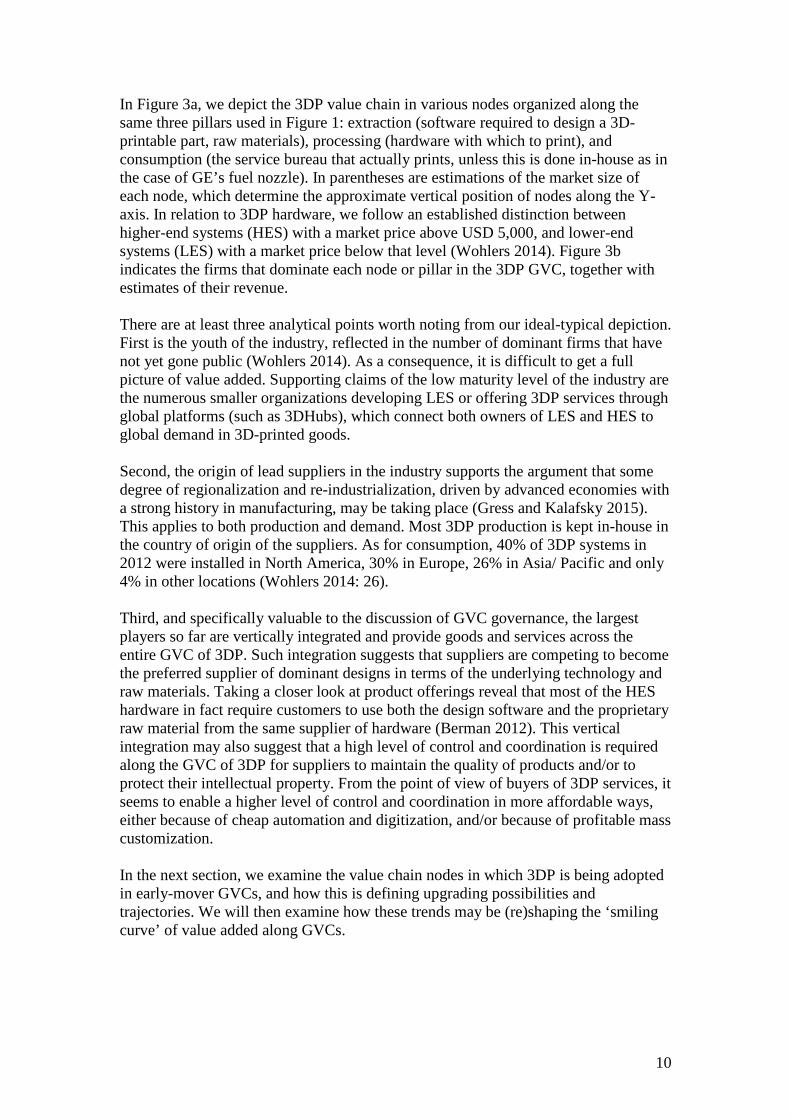
3D Printing and GVC upgrading Rates and modes of adoption of 3DP differ widely across GVCs – with selected industries in the lead – such as aerospace, medical, dental, defense, education, and, increasingly, automotive (Wohlers 2014). According to market analysts, these industries, along with the consumer sector of non-durable goods, will be the key drivers contributing to the double-digit growth of 3DP over the next few years (Forbes 2015; Wohlers 2014; Gartner 2015). Laplume et al (2016: 6) indicate that the most likely industries to adopt 3DP are those producing small products, made of one material, and with no need of many interacting parts. A survey from Gartner provides an overview of the value chain nodes in which companies are currently investing, adopting and fully utilizing 3DP. In Figure 4, we converted these areas into activities that are compatible to the ideal-typical GVC pillars utilized in previous figures, thus enabling a structured presentation of the strategic intent that is driving investments in 3DP. The various upgrading trajectories that are likely to appear in each pillar are summarized in Table 1, where they are aligned with the two restructuring scenarios discussed later in the article. Figure 4: GVC nodes where 3DP is applied in production
Source: Authors’ adaptation from Gartner (2014). The original question asked in Gartner was ‘Where do you apply 3DP?’ Table 1: Likely dominant upgrading trajectories in the two GVC restructuring scenarios
Source: Authors
12
3D printing in the extraction pillar According to Gartner (2015), most 3DP adoption has been focused in the extraction pillar. Here, actors seek to pursue both product innovation under the new paradigm of ‘freedom of design’, but also to process innovation in product development and rapid prototyping. R&D The additive layering process of 3DP enables the standardized production of complex structures and designs, and the creation of new products (Lipson and Kurman 2013). The new paradigm of ‘freedom of design’, coupled with 3DP, is about ‘creating new items that are impossible using traditional methods’ (Gartner 2014). What we see emerging are complex lattice structures and inner hollows, in materials never used before – e.g. carbon infused plastics that are stronger than metal, and nano, bio and active materials that respond to their external environment (Lipson and Kurman 2013; Wohlers 2014). 3DP in R&D clearly relates to product upgrading, i.e. ‘moving into more sophisticated product lines’ (Humphrey and Schmitz 2002: 1020). The challenge for established companies is not to replicate traditional parts, but to re-design parts for 3DP. Thus, succeeding with 3DP in R&D is about developing new standards suitable for the new structures and materials that are 3D-printed (Lipson and Kurman 2013). Such success criteria inevitably require abandoning previous ways of thinking about design. In many cases, collaborating with new and atypical actors has been valuable. GE Aviation, for instance, in addition to maintaining close partnerships with leading suppliers of 3DP, holds yearly ‘hackathons’ – competitions where they invite designers globally to partake in the re-engineering of existing GE products with 3DP (GE Reports 2013). On the consumer side, GE Appliances has set up a micro factory with Stratasys hardware, where new products will be invented using crowdsourcing (Stratasys 2014). This means that in addition to product upgrading, 3DP can also provide opportunities for inter-chain upgrading, where actors gain access to new GVCs that were note previously accessible to them. Rapid Prototyping There are three main reasons behind the high adoption rate of 3DP in ‘rapid prototyping’ (Wohlers 2014). First is cost savings, as a 3D printer can cost as little as a couple of hundred USD, where a traditional ‘rapid prototyping machine can cost as much as 500,000 USD’ (Berman 2012: 156). Second is the ease of use of 3DP, due the integrated design software, which is made accessible through open source platforms or design packages such as Google SketchUp and Tinkercad (Lipson and Kurman 2013). The lower price and increased user friendliness of 3DP for RP has facilitated bringing a previously costly process in-house. This cuts design time and shortens the lead-time to market of new products (Berman 2012). ‘Today, the speed and convenience of rapid prototyping allows firms, small and large, to be more nimble and to produce different versions of a product overnight, test them, and produce improved versions without delay’ (Kietzmann et al 2015: 211). This means that established companies adopting 3DP in rapid prototyping can achieve process upgrading and functional upgrading – bringing a previously outsourced process back
13
in-house. For new actors, the lower costs of prototyping for their designs make inter-chain upgrading easier to achieve (Lipson and Kurman 2013; Herman 2014). Product Development The purpose behind 3DP activity in product development relates to both product and process upgrading. Well exemplified by the GE fuel nozzle, the strength to weight ratio was increased to extend the product life cycle by five times – also making the part 25% lighter (GE Global Research 2015). 3DP can be used both to improve properties in existing product portfolios and the processes to ‘transform inputs into outputs more efficiently’ (Humphrey and Schmitz 2002: 1020). The very nature of 3DP (layering) makes it possible to save up to 90% in material waste, in comparison to traditional, subtractive manufacturing technologies (Khajavi et al 2013). Even though the 3DP raw material is currently more expensive than that used for traditional manufacturing, material savings can make 3DP competitive in some applications – and especially in the production of parts with pricey materials, such as titanium, gold and other expensive metals (Berman 2012; Wolhers 2014; Laplume et al 2016). 3D printing in the processing pillar According to Gartner (2014), a technology can be considered mature once it has penetrated 20% of its target industry. In manufacturing, the penetration of 3DP for volume production of final end parts stood at 11% in 2014 (D’Aveni 2015). Compared to applications in prototyping, 3DP has had more difficulties in spreading to the processing pillar. For a long time, this was explained by the technological limitations of 3DP. Today though, the technology has reached a level where it is widely recognized as ‘ready to emerge from its niche status and become a viable alternative to conventional manufacturing processes’ (McKinsey 2014). Indeed, conversion to 3DP can happen fast – the US hearing aid industry moved to 100% 3DP in less than 500 days, and ‘not one company that stuck to traditional manufacturing methods surviv[ed]’ (D’Aveni 2015: 43). Direct manufacturing The acquisition cost of high-end systems (HES) used for industrial manufacturing is still significant for many applications. At the same time, 3DP does not require economies of scale in order to return positive returns on investment compared to traditional manufacturing. Thus, 3DP implies lower capital investment per manufacturing facility (Khavaji et al 2014; D’Aveni 2015). Economies of scope, rather than economies of scale, are key in creating profit with 3DP technology. As such, the transaction cost for a specific investment in manufacturing is significantly reduced by the ability to print highly complex designs in small and diverse batches, at small or no marginal cost per part. In GE’s case, the full volume production of the fuel nozzle will save them 75% in manufacturing costs (GE Reports 2015). When all benefits of 3DP in the processing stage are properly quantified, the mean cost reduction for final goods is estimated at 4%. So while there are obvious possibilities for process upgrading in the manufacturing stage, its achievement is also tied to functional upgrading – in particular, the ability to evaluate which products and parts are suitable for 3DP (Appleyard 2015).
14
Indirect manufacturing An important opportunity is provided by 3DP in indirect manufacturing activities, where 3DP implies the elimination, or at least a reduction, in the number of stages of processing. One of the more obvious is the elimination or reduction of assembly in the production of finished goods that are directly printed out of raw material – what Laplume et al (2016) refer to as the ‘technological inseparability’ of 3DP. In the event that certain 3D-printed parts indeed need assembly (e.g. for rotating or multi-material parts), 3DP can significantly reduce the process of acquiring components and machines needed for post-processing (Khajavi et al 2014), and therefore also reduce the need for machine tooling (Lipson and Kurman 2013). Other processes eliminated with 3DP include the use of molds to shape parts and various jigs, fixtures and gauges used to position and organize parts and sub-assemblies throughout the manufacturing process. These are all specialized and costly components that decrease in number with 3DP, and so do their packaging (Lipson and Kurman 2013; Wohlers 2014; Khajavi et al 2014). Finally, some 3D printers can also print spare parts for themselves (Laplume et al 2016). Thus, for products with high asset specificities and/or intensive and specialized labor, 3DP entails process upgrading, or even abandoning some processes traditionally needed for production (Appleyard 2015). 3D printing in the consumption pillar As the example of the Amberg factory suggests, the capital intensiveness of 21st century production does not necessarily translate into a symmetrical trade off in labor inputs. On the contrary, and in line with the servitization megatrend, it implies a reallocation of labor. While in the pillar of extraction this includes designing for 3DP, in the pillar of consumption this includes mass customization of products to increase customer satisfaction. Logistics The vision of decentralized production is that ‘[d]esigns, not products, move around the world: digital files to be printed anywhere by any printer that can meet the design parameters’ (Garett 2014: 71). For logistics, this vision implies a decrease in transportation, inventory and warehousing costs, and in essence shorter lead times (Khajavi 2014). For industries such as defense or aerospace, on-demand and decentralized 3DP facilitates process upgrading, alleviating the ‘supply chain pains’ of remote location of operations, highly specialized equipment, or limited ability to keep high stock to mitigate risks of downtime. In the defense industry, the US military is currently 3D printing the body of drones for operations in both Iraq and Afghanistan (D’Aveni 2015). And in aerospace, NASA is printing 21 spare parts while in orbit, a project that is intended to eventually scale up to metal 3DP (NASA, 2015). Among third parties that are providing services around decentralized production using 3DP, a pre-requisite is that information is shared securely to protect the intellectual property of designs – a digital and cultural infrastructure that may explain the lower adoption of 3DP in this area (Wohlers 2014). Among established businesses that invest in 3DP to achieve product upgrading are DHL, Amazon and UPS. UPS for instance, is turning several existing hub warehouses at airports into mini-factories, where 3DP is ‘used to produce and deliver customized parts to customers as needed, instead of shelving to vast inventories’ (D’Aveni 2015: 46).
15
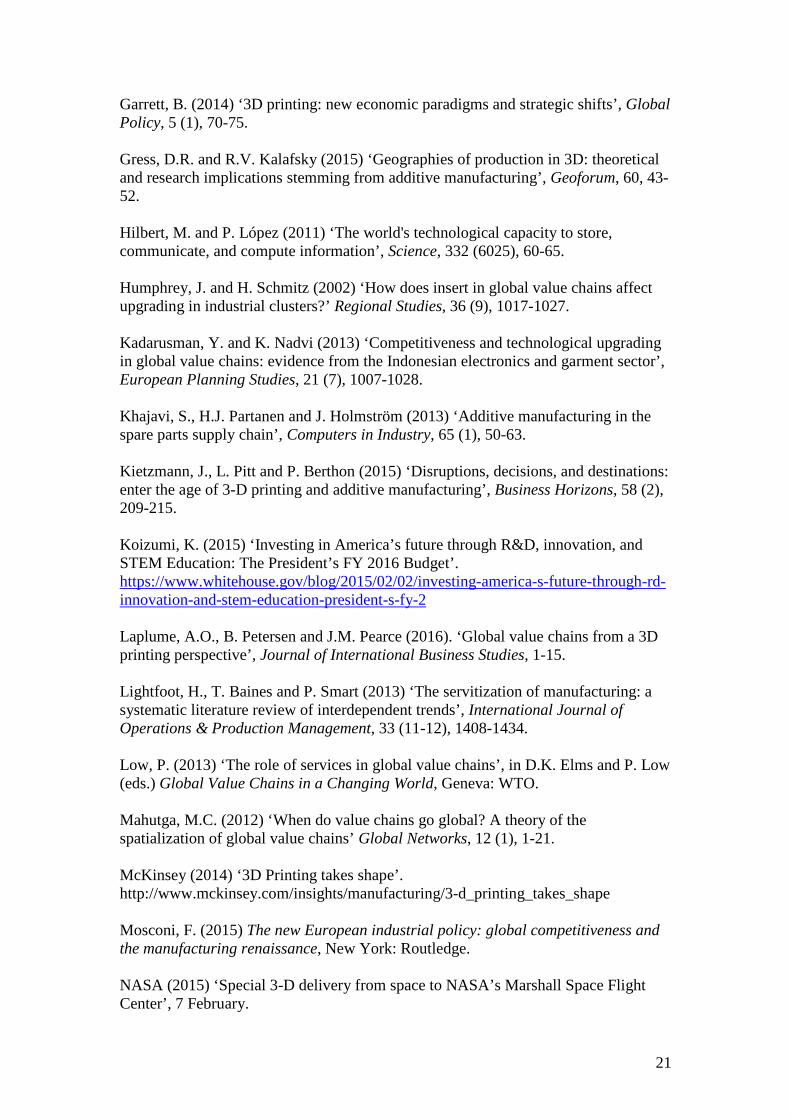
Furthermore, local 3DP can serve as way to bypass import barriers (Laplume et. al. 2016). Sales and Aftersales The sale of 3D printed products depends on how the technology gain is weighed against the specific ‘supply chain pain’ faced by end customers. For instance, cutting the weight of a product through 3DP can translate into fuel savings for the end customer, while stronger parts can reduce the amount of overhauls required during a product’s life cycle. Both are instances of product upgrading that manufacturers can price according to which ‘supply chain pain’ is alleviated (or which process is upgraded) for their end customers. Additional savings include reduction of lead-times of specialized parts, saved downtime, or mitigation of risk that parts with a long lifetime become obsolete. On the B2C side, mass customization provides opportunities for higher value, capitalized by online platforms such as Shapeways where ‘[b]uyers can choose from endless combinations of shapes, sizes, and colors and this customization adds little to a manufacturer’s cost even as orders reach mass-production levels’ (D’Aveni 2015: 44). But there are also C2C platforms, such as 3Dhubs – with over 30,000 private 3D printers connected in a global platform for private consumers who have an idea but no printer (see Appendix 2). On this platform, the average order time is two days, making just-in-time production an affordable reality. Both Shapeways and 3DHubs are platforms for private consumers to pursue inter-chain upgrading by either supplying digital designs or tangible products with their private 3D printer (Shapeways 2015; 3DHubs 2015). Business Development Across all stages of production in which 3DP is applied there are windows of opportunity for inter-chain upgrading – entering ‘into a new value chain by leveraging the skills acquired in the current chain’ (Gereffi 2014: 9). In the case of UPS, they have rethought their product offering and tweaked their existing business model with 3DP. While their core competency is to get products from destination A to destination B, they are now considering whether this needs actual physical transport – or whether they would be better off creating the product directly at destination B. Other upgrading strategies in business development include actors that have developed 3DP skills that can be leveraged in other industries. As example is Airbus, which in 2013 started a consultancy (APWorks) to ‘make proven aerospace technologies accessible in many different industries (Airbus APWorks 2013). APWorks thus serves as delivery channel for Airbus-patented technologies and as means for Airbus to pursue inter-chain upgrading. In this section, we have highlighted the actual and potential upgrading trajectories that 3DP can help achieving in a range of GVCs. In the next and final section, we explore how 3DP adoption may restructure global networks of production and what this would mean for the shape and position of the ‘smiling curve’ of value added.
16
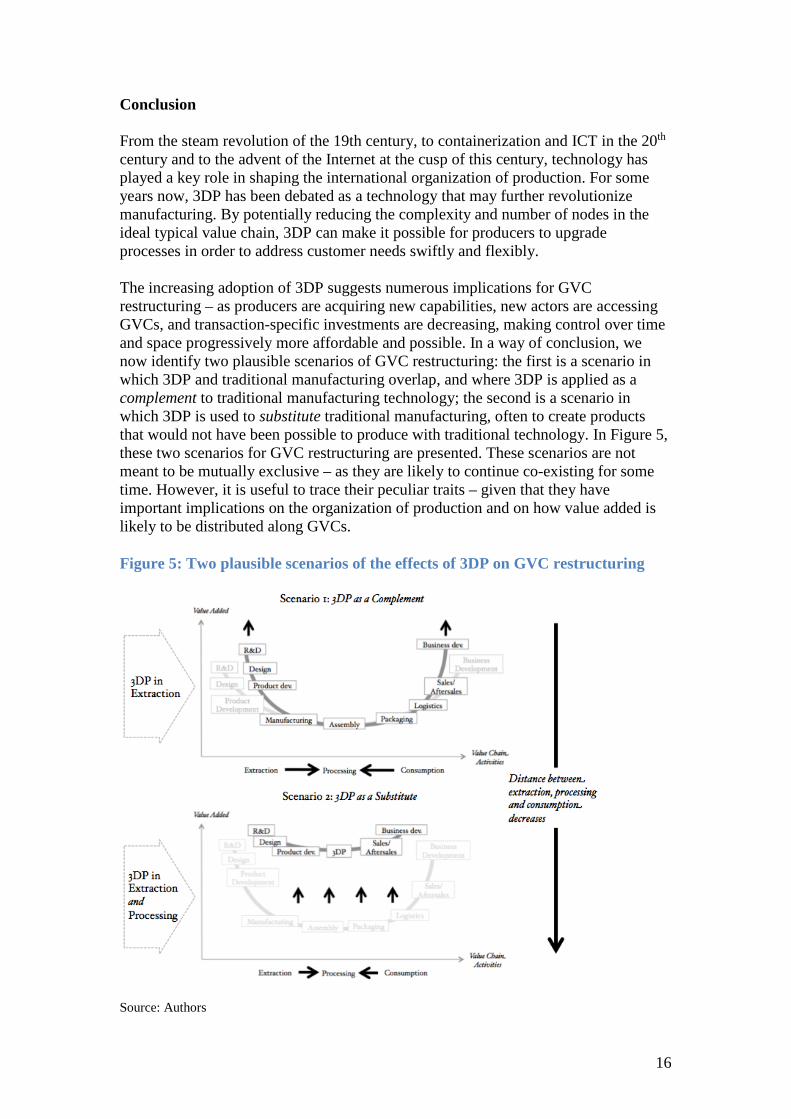
Conclusion From the steam revolution of the 19th century, to containerization and ICT in the 20th century and to the advent of the Internet at the cusp of this century, technology has played a key role in shaping the international organization of production. For some years now, 3DP has been debated as a technology that may further revolutionize manufacturing. By potentially reducing the complexity and number of nodes in the ideal typical value chain, 3DP can make it possible for producers to upgrade processes in order to address customer needs swiftly and flexibly. The increasing adoption of 3DP suggests numerous implications for GVC restructuring – as producers are acquiring new capabilities, new actors are accessing GVCs, and transaction-specific investments are decreasing, making control over time and space progressively more affordable and possible. In a way of conclusion, we now identify two plausible scenarios of GVC restructuring: the first is a scenario in which 3DP and traditional manufacturing overlap, and where 3DP is applied as a complement to traditional manufacturing technology; the second is a scenario in which 3DP is used to substitute traditional manufacturing, often to create products that would not have been possible to produce with traditional technology. In Figure 5, these two scenarios for GVC restructuring are presented. These scenarios are not meant to be mutually exclusive – as they are likely to continue co-existing for some time. However, it is useful to trace their peculiar traits – given that they have important implications on the organization of production and on how value added is likely to be distributed along GVCs. Figure 5: Two plausible scenarios of the effects of 3DP on GVC restructuring
Source: Authors
17
In the first scenario, 3DP is applied for rapid prototyping in the extraction pillar, or for the production of specialized machine tooling in the processing pillar. 3DP is applied to decrease development cycles of products that are subsequently mass-produced using traditional technology and infrastructure. This implies a new level of control and coordination, by means of re-bundling activities. Furthermore, such control is not primarily driven by product quality or quantity, but by control over time and space to respond to consumer demands – by supplying the right customized product at the lowest possible lead-time. In this complementarity scenario, 3DP ‘could transform industries in unexpected ways, moving the source of competitive advantage away from the ability to manufacture in high volumes at low cost and toward other areas of the value chain, such as design or even the ownership of customer networks’ (McKinsey 2014). Power in this scenario would be in the hands of actors who have access to information on the needs of the end customer, and the smiling curve would be likely to deepen (see Figure 5, top part). The second scenario is a GVC of mostly or fully 3D-printed products, where the replacement of 3DP in many manufacturing industries removes low-skill, labor-intensive and low-value added functions in the processing pillar. In this substitution scenario, automation pushes the smiling curve upwards (Figure 5, bottom part), and production becomes decentralized and moves away from where it had been previously outsourced, to be located near the end-consumer. 3DP would reduce the need for assembly, packaging and transport, and thus decrease the number of nodes in the ideal GVC altogether – through a process of ‘rebundling’. Production becomes even more on-demand than in the first scenario, and control over time and space even further enhanced. In both scenarios, 3DP fuels other ongoing trends – namely a ‘radical “pull” business strategy that substitutes information for inventory and ships products only when there is real demand from customers’ (Gereffi 2001: 35). By way of reducing the amount of nodes, and cost of GVC coordination, 3DP works as a multiplier and enhancer of a shift from manufacturer ‘push’ to consumer ‘pull’. These cost reductions allow established GVC players to re-bundle processes, and new players to access new GVCs. Networks in 3DP production processes become bound together by digital transactions, rather than by physical products, and transactions include customer-specific information for mass customization – 3DP-specific information for capability building in the open source maker community, or product-specific information for printing locally and on-demand. Access to these networks would thus determine whether 3DP transforms or reproduces power relations in GVCs. The main difference between the two scenarios lays in how value is likely to be distributed across GVCs. In the complementarity scenario, labor-intensive and lower value added processes are still present, with 3DP in fact reproducing current structures governing global production. In the substitution scenario, the capital-intensive nature of manufacturing eliminates or drastically reduces labor in the processing pillar and moves (at least part of) it forwards and backwards to the pillars of extraction and consumption. This suggests a possible transformation of the smiling curve into a flatter ‘smirk’ (see Figure 5, bottom part), where value is more equally
18
distributed along the ideal-typical GVC. In relation to the value chain position on the Y-axis in Figure 5, increased control over time and space suggests that more value is likely to be generated by 3DP, and thus we may observe an upward vertical move in both scenarios. But increasing output in the world economy has not historically translated into an equal distribution of value among GVC participants. From a geopolitical point of view, the key question is thus to what extent a possible increase in value added benefits different countries and different actors – as both lead firms supplying 3DP technology and lead buyers of it are currently based in advanced economies (see Appendix 1 and 2). While it is clear that first-movers in advanced economies are currently pursuing the technology promise of 3DP, the role of actors in emerging economies and in LDCs, whose access to 3DP technology and know-how is uncertain, is still unclear. In this article, we started providing some preliminary answers to the key questions of how 3DP is likely to shape GVC restructuring and upgrading trajectories. Future research is needed to further examine: whether 3DP is leading to further unbundling or rebundling processes; whether the social organization of production will move away from the factory and back into the workshop; whether manufacturing jobs will move back to advanced economies to the detriment of emerging economies; and whether the GVC restructuring that may ensue has a transformative or a reproductive character. References 3DHubs (2015) www.3Dhubs.com Airbus APWorks (2013) ‘Profile’, http://www.apworks.de/en/who-we-are/profile/ Appleyard, M. (2015) ‘Corporate responses to online music piracy: strategic lessons for the challenge of additive manufacturing’, Business Horizons, 51 (1), 69-76. AT Kearney (2015) ‘3D printing: A manufacturing revolution’ https://www.atkearney.com/documents/10192/5992684/3D+Printing+A+Manufacturing+Revolution.pdf/bf8f5c00-69c4-4909-858a-423e3b94bba3 Bair, J. (ed.) (2009) Frontiers of commodity chain research, Stanford: Stanford University Press. Bair, J. and G. Gereffi (2003) ‘Upgrading, uneven development, and jobs in the North American apparel industry’, Global Networks, 3 (2), 143-169. Bair, J. and Palpacuer, F. (2015) ‘CSR beyond the corporation: contested governance in global value chains’, Global Networks, 15 (s1), S1-S19. Bair, J. and Werner, M. (2011) ‘Commodity chains and the uneven geographies of global capitalism: a disarticulations perspective’, Environment and Planning A, 43 (5), 988-997.
19
Baldwin, R. (2013) ‘Global supply chains: why they emerged, why they matter, and where they are going’, in D.K. Elms and P. Low (eds.) Global value chains in a changing world, Geneva: WTO. Baldwin, R. (2011) ‘Trade and industrialisation after globalisation’s 2nd unbundling: how building and joining a supply chain are different and why it matters’, Working Paper, NBER: Cambridge. Bamper, P., K. Fernandez-Stark, G. Gereffi, and A. Guinn (2014) ‘Connecting local producers in developing countries to regional and global value chains’, OECD Trade Policy Paper No.160s, Paris: OECD. Berman, B. (2012) ‘3-D printing: The new industrial revolution’, Business Horizons, 55 (2), 155-162. Bryson, J. and P. Daniels (2010) ‘Service Worlds: the “services duality” and the rise of manuservice economy’, in P. Maglio, S. Kieliszewski and J. Spohrer (eds.) Handbook of Service Science, New York: Springer, 79-104. Cattaneo, O., G. Gereffi and C. Staritz (eds.) (2010) Global value chains in a postcrisis world: a development perspective, Washington, World Bank. Christopher, M. and L.J. Ryals (2014) ‘The supply chain becomes the demand chain’, Journals of Business Logistics, 35 (1), 29-35.
Coe, N.M., Yeung, H.W. (2015). Global production networks: Theorizing economic development in an interconnected world, Oxford: Oxford University Press.
D’Aveni, Richard (2015) ‘The 3D Printing Revolution’, Harvard Business Review, May 2015 Issue, 40-48. de Jong, P.J. Jeroen and E. de Brujin (2015) ‘Innovation Lessons from 3D printing’, MIT Sloan Management Review, 54 (2), 43-52 Dicken, P. (2015) Global shift: Reshaping the global economic map in the 21st century, 7th ed, London, Sage. European Commission (2013) ‘Factories of the future PPP: towards competitive EU manufacturing’, Brussels, European Commission. http://ec.europa.eu/research/press/2013/pdf/ppp/fof_factsheet.pdf Fold, N. (2002) ‘Lead firms and competition in ‘bi‐ polar’commodity chains: grinders and branders in the global cocoa‐ chocolate industry’, Journal of Agrarian Change, 2 (2), 228-247. Forbes (2015) ‘Roundup of 3D printing forecasts and estimates’, 31 March. http://www.forbes.com/sites/louiscolumbus/2015/03/31/2015-roundup-of-3d-printing-market-forecasts-and-estimates
20
Friedman, T. (2013) ‘When Complexity is Free’, 14 September. http://mobile.nytimes.com/2013/0/15/opinion/sunday/friedman-when-complexity-is-free.html?pagewanted=all&_r=0&referer=http://www.ge.com/stories/advanced-manufacturing/ Gartner (2015) ‘Gartner says worldwide shipments of 3D printers to reach more than 490,000 in 2016’ http://www.gartner.com/newsroom/id/3139118 Gartner (2014) ‘Gartner Newsroom’, 9 December. http://www.gartner.com/newsroom/id/2940117 GE Reports (2013) ‘Jet engine bracket from indonesia wins 3d printing challenge’, 11 December. http://www.gereports.com/post/77131235083/jet-engine-bracket-from-indonesia-wins-3d-printing GE Reports (2015) ‘The first FAA cleared 3D printed part to fly in a commercial jet engine from GE’, 14 April. http://www.gerreports.com/post/116402870270/the-faa-cleared-the-first-3d-printed-part-to-fly GE Global Research (2015) ‘3D printing creates new parts for aircraft engines’. http://www.geglobalresearch.com/innovation/3d-printing-creates-new-parts-aircraft-engines Gereffi, G. (1994) ‘The organization of buyer-driven global commodity chains: how US retailers shape overseas production networks’ in G. Gereffi and M. Korzeniewicz (eds.) Commodity Chains and Global Capitalism, Westport: Greenwood Press, 95–133. Gereffi, G. (1999) ‘International trade and industrial upgrading in the apparel commodity chain’, Journal of International Economics, 48 (1), 37-70. Gereffi, G. (2001) ‘Beyond the producer driven / buyer driven dichotomy: the evolution of global value chains in the internet era’, IDS Bulletin, 32 (3), 30-40. Gereffi, G. (2014) ‘Global value chains in a post-Washingon consensus world.” Review of International Political Economy, 21 (1), 9-37. Gereffi, G., J. Humphrey and T. Sturgeon (2005) ‘The governance of global value chains’, Review of International Political Economy, 12 (1), 78–104.
Gibbon, P. and S. Ponte (2005) Trading down: Africa, value chains and the global economy, Philadelphia: Temple University Press.
Gibbon, P., J. Bair and S. Ponte (2008) ‘Governing global value chains: an introduction’, Economy and Society, 37 (3), 315–38. Gilmore, J. and B Pine (1997) ‘The four faces of mass customization’, Harvard Business Review, January-February Issue, 91-101.
21
Garrett, B. (2014) ‘3D printing: new economic paradigms and strategic shifts’, Global Policy, 5 (1), 70-75. Gress, D.R. and R.V. Kalafsky (2015) ‘Geographies of production in 3D: theoretical and research implications stemming from additive manufacturing’, Geoforum, 60, 43-52. Hilbert, M. and P. López (2011) ‘The world's technological capacity to store, communicate, and compute information’, Science, 332 (6025), 60-65. Humphrey, J. and H. Schmitz (2002) ‘How does insert in global value chains affect upgrading in industrial clusters?’ Regional Studies, 36 (9), 1017-1027. Kadarusman, Y. and K. Nadvi (2013) ‘Competitiveness and technological upgrading in global value chains: evidence from the Indonesian electronics and garment sector’, European Planning Studies, 21 (7), 1007-1028. Khajavi, S., H.J. Partanen and J. Holmström (2013) ‘Additive manufacturing in the spare parts supply chain’, Computers in Industry, 65 (1), 50-63. Kietzmann, J., L. Pitt and P. Berthon (2015) ‘Disruptions, decisions, and destinations: enter the age of 3-D printing and additive manufacturing’, Business Horizons, 58 (2), 209-215. Koizumi, K. (2015) ‘Investing in America’s future through R&D, innovation, and STEM Education: The President’s FY 2016 Budget’. https://www.whitehouse.gov/blog/2015/02/02/investing-america-s-future-through-rd-innovation-and-stem-education-president-s-fy-2 Laplume, A.O., B. Petersen and J.M. Pearce (2016). ‘Global value chains from a 3D printing perspective’, Journal of International Business Studies, 1-15. Lightfoot, H., T. Baines and P. Smart (2013) ‘The servitization of manufacturing: a systematic literature review of interdependent trends’, International Journal of Operations & Production Management, 33 (11-12), 1408-1434. Low, P. (2013) ‘The role of services in global value chains’, in D.K. Elms and P. Low (eds.) Global Value Chains in a Changing World, Geneva: WTO. Mahutga, M.C. (2012) ‘When do value chains go global? A theory of the spatialization of global value chains’ Global Networks, 12 (1), 1-21. McKinsey (2014) ‘3D Printing takes shape’. http://www.mckinsey.com/insights/manufacturing/3-d_printing_takes_shape Mosconi, F. (2015) The new European industrial policy: global competitiveness and the manufacturing renaissance, New York: Routledge. NASA (2015) ‘Special 3-D delivery from space to NASA’s Marshall Space Flight Center’, 7 February.
22
https://www.nasa.gov/centers/marshall/news/news/release/2015/special-3-d-delivery-from-space-to-nasa-s-marshall-space-flight-center.html Nickow, A. (2015) ‘Growing in value: NGOs, social movements and the cultivation of developmental value chains in Uttarakhand, India’, Global Networks, 15(s1), S45-S64. O'Brien, R. and M. Williams (eds.) (2010) Global political economy, 3rd ed, London: Palgrave Macmillan. Obama, B. (2013) ‘State of the Union Address’, 12 February. http://www.whitehouse.gov/the-press-office/2013/02/12/remarkspresident-state-union-address
Palpacuer, F. (2008) ‘Bringing the social context back in: governance and wealth distribution in global commodity chains’, Economy and Society, 37 (3), 393-419.
Ponte, S. and J. Ewert (2009) ‘Which way is ’up’ in upgrading? Trajectories of change in the value chain for South African wine’, World Development, 37, 1637-1650.
Ponte, S., I. Kelling, K. Jespersen and F. Kruiijssen (2014) ‘The blue revolution in Asia: upgrading and governance in aquaculture value chains’, World Development, 64, 52-64.
Ponte, S. and T. Sturgeon (2014) ‘Explaining governance in global value chains: a modular theory building effort’, Review of International Political Economy, 21 (1), 195-223. Shapeways (2015) www.shapeways.com Shih, S. (n.d.) Millennium Transformation: Change Management for New Acer, Aspire Academy Series. http://www.stanshares.com.tw/StanShares/upload/tbBook/1_20100817144639.pdf Shin, N., K.L. Kraemer and J. Diedrick (2012) ‘Value capture in the global electronics industry: empirical evidence for the “smiling curve” concept’, Industry and Innovation, 19 (2), 89-107. Sturgeon, T. (2013) ‘Global value chains and economic globalisation: Towards a new measurement framework’, Cambridge, MA: MIT Industrial Performance Center and Eurostat. The Economist (2012) ‘A third industrial revolution’, 21 April. The Creators Project (2013) ‘The Creators Project’, video. https://www.youtube.com/watch?v=IS4Xw8f9LCc
Tokatli, N. (2007) ‘Asymmetrical power relations and upgrading among suppliers of global clothing brands: Hugo Boss in Turkey’, Journal of Economic Geography, 7 (1), 67-92.

23
Vandermerwe, S. and J. Rada (1988) ‘Servitization of business: adding value by adding services’, European Management Journal, 6 (4), 314-324. Wohler 2015 ‘3D Printing and Additive Manufacturing State of the Industry: Annual Worldwide Progress Report’, Fort Collines, CO: Wohler Associates. Zaske, S. (2015) ‘Germany's vision for Industrie 4.0: the revolution will be digitized’, 23 February. http://www.zdnet.com/article/germanys-vision-for industrie-4-0-the-revolution-will-be-digitised/
Appendix 1: Geographical dispersion of Fablabs
Source: https://www.fablabs.io/map
Appendix 2: Geographical dispersion of 3DHubs users
Source: http://www.forbes.com/sites/jenniferhicks/2014/06/05/3d-hubs-proves-3d-printing-is-bankable/#522126fee224


![The 3D printing ‘revolution’ · 3D printing ‘Bigger than internet’ FT 21.6.12 3D printing: ‘The PC all over again?’ Economist 1.12.12 ‘3D printing [..] has the potential](https://img.pdfslide.us/doc/110x75/5f08eac77e708231d42459a8/the-3d-printing-arevolutiona-3d-printing-abigger-than-interneta-ft-21612.jpg)