Embed Size (px)
Citation preview

SURF1-Shalaby 1
3D PAVEMENT SURFACE MACROTEXTURE: MEASUREMENTS AND FRICTION RELATIONSHIPS
A. Shalaby
Department of Civil Engineering, University of Manitoba, Canada [email protected]
A. El Gendy Department of Civil Engineering, Port Said University, Egypt
[email protected] ABSTRACT Pavement macrotexture is typically reported as mean profile depth over a standard base length. Recently, a new measurement method based on photometric stereo system was introduced. The method requires a minimum of three images of the surface that are illuminated from different directions and isolated from ambient lighting. The variation in intensity of the lighting is used to recover the 3D pavement surface. This paper discusses applications of the photometric stereo system as a new non-contact texture measurement method. The 3D pavement surface is analyzed in space and frequency domains. In frequency domain, the power spectrum energy which reflects the wavelength content of the surface model is introduced as an indicator of surface evenness. The relationship between friction and the 3D texture indicators is examined. The research shows that the texture indicators computed from the recovered surface provide new substantial information on the quality and condition of the riding surface.
1. INTRODUCTION
Pavement surface texture significantly affects riding comfort and skid resistance. In the wavelength ranges of macrotexture between 0.5 mm and 50 mm, the most significant impacts of texture are in the areas of tire wear, rolling resistance, tire/road friction, noise in vehicles, exterior road noise and wear in vehicles [1]. A number of studies linked friction with surface texture. Britton et al. [2] studied the influence of texture on tire/road friction where skid numbers are governed by texture parameters expressed in terms of texture size, spacing or distribution, and shape. Ergun et al. [3] developed a friction-coefficient prediction model that is based on 2D profiles measured by using an image analysis technique. The surface is reconstructed by accumulating surface profiles that are recovered by projecting the light source on a razor blade placed above the surface. The shadow of the blade on the sample reveals the surface profile. The study found that the average wavelength of the profile is the most reliable texture parameter that predicts the friction coefficient at no slipping. Do [4] studied the relationship between microtexture and skid resistance where microtexture is measured by a three-source photometric stereo system to recover 3D surface of pavement, and laser sensor to recover 2D profiles of the pavement surface. The three light sources are exposed to ambient light which could affect the results. Also, the three images are not

SURF1-Shalaby 2
sufficient to detect either shadow or specular contribution if they are present in any of the images. This paper presents, PhotoTexture, a non-contact texture measurement device based on photometric stereo technique. PhotoTexture recovers the 3D heights on a pavement surface by using four images after detecting and eliminating shadow and specularity contributions present in any of the images. In this paper, texture indicators from PhotoTexture are presented and the relationship between these indicators and friction measurements is examined.
2. ROAD SURFACE TEXTURE INDICATORS
Pavement texture is the deviation of a pavement surface from an ideal plane within a specified wavelength range. The most common texture indicator is the mean profile depth (MPD). The standard method for computing the mean profile depth is included in ASTM E1845 [5] and ISO 13473-1 [1]. The root mean square roughness (RMSR) is another texture indicator used to assess the 2D profile of pavement surface texture [6 and 7]. El Gendy and Shalaby [8] introduced the power spectrum energy (PSE) of a 3D recovered surface as a texture indicator. Although mean profile depth, root mean square roughness, and power spectrum energy, are computed from 2D profiles or from 3D surfaces, this paper only includes MPD, RMSR, and PSE that are computed from the 3D surfaces. The following section presents a comparative review of the texture indicators. 2.1. Mean Profile Depth
Mean profile depth (MPD) is the standard method for computing the average pavement macrotexture depth measured over the sampling length of the 2D profile. The sampling of 100 mm length is divided into two equal halves. The peak height in each half is determined, and the average of the two heights is the MPD. The test is repeated at different locations, and the average is reported as MPD of the surface [5 and 1]. 2.2. Root Mean Square Roughness
Root mean square roughness (RMSR) is the standard deviation of a sample of heights of the surface profile [6]. For a pavement surface profile, the RMSR is computed from the 2D profile within a sampling length as:
(1) where
zi = height of surface profile from the mean profile level at position i, n = number of discrete measured points along the profile sampling length.
2.3. Power Spectrum Energy
The power spectrum energy (PSE) could be used as an indicator of surface texture. Although PSE can be computed from 2D profile or 3D surface, this paper only includes PSE computed
n
=i
izn
=RMSR1
21

SURF1-Shalaby 3
from measurement of 3D recovered surfaces. The PSE indicator is computed from the power spectrum function of the 2D Fourier transform of the 3D recovered surface as:
(2) Where:
Z = The Fourier transform of the surface height z. i, k = The frequency indices in longitudinal and transverse directions. n, m = The surface dimensions in discrete units (e.g. pixels).
3. PHOTOMETRIC STEREO TECHNIQUE
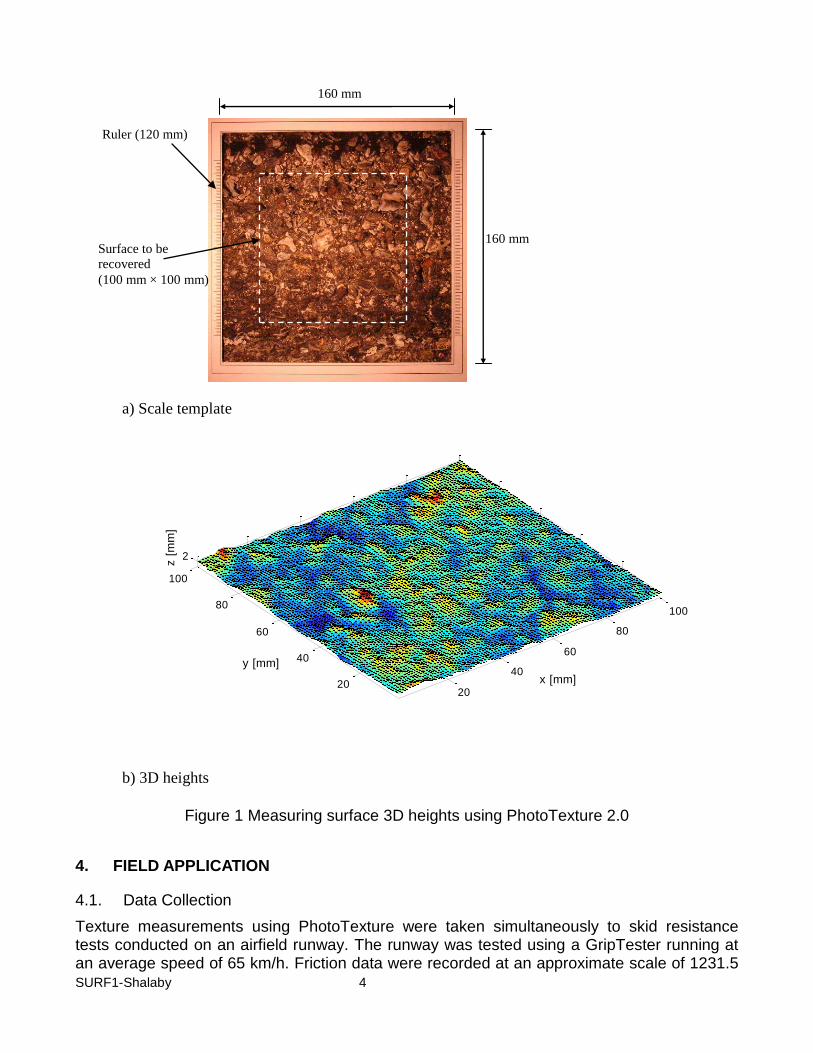
El Gendy and Shalaby [9 and 10] extended and improved the photometric stereo technique proposed by Woodham [11] with the purpose of recovering the 3D heights of the pavement surface. Photometric stereo techniques have been successfully used for recovering surface texture [12 and 13], however applying this technique for recovering pavement texture required additional modules to overcome problems particular to pavement surface. El Gendy and Shalaby [10] used a four-source photometric stereo system where four images are taken of a pavement surface from four different directions. Because pixel intensities in a set of images taken from the same viewing location, but with different light direction, will depend on surface orientation, pavement surface normals can be recovered from the analysis of image intensities. The system is enclosed in a 0.6 m x 0.6 m x 0.6 m box to isolate the surface from ambient light and to reduce image noise. The dark monotone of the pavement surface requires high illumination intensity to produce a reasonable variation in surface reflectance. A fibre optic light source with adjustable illumination intensity is manually repositioned in the required four light directions. The light intensity is adjusted so that the digital still camera has an optimum scene exposure. The light source was tested so that it produces a constant incident illumination with parallel lighting direction over the scene. The images are captured within a template of 160 mm × 160 mm that is used to adjust the image scale. Four images are captured under four illumination angles with 90° increment. Because the pavement surface is isolated from ambient light, the changes in pixel intensities are caused only by surface orientation and reflectance properties. The images are cropped to a sample of 100 mm × 100 mm that is used in the analysis of image intensities. The surface orientation is numerically integrated to compute surface heights and wavelengths in the frequency domain and hence provide PSE. Surface heights are also transformed to space domain in order to compute the conventional MPD and RMSR (3D surface as shown in Figure 1b).
n
=i
m
=k
k)Z(i,=PSE1 1
2
SURF1-Shalaby 4
Figure 1 Measuring surface 3D heights using PhotoTexture 2.0
4. FIELD APPLICATION
4.1. Data Collection
Texture measurements using PhotoTexture were taken simultaneously to skid resistance tests conducted on an airfield runway. The runway was tested using a GripTester running at an average speed of 65 km/h. Friction data were recorded at an approximate scale of 1231.5
Ruler (120 mm)
Surface to be
recovered
(100 mm × 100 mm)
160 mm
160 mm
a) Scale template
20
40
60
80
100
20
40
60
80
100
2
x [mm]
y [mm]
z [
mm
]
b) 3D heights
SURF1-Shalaby 5
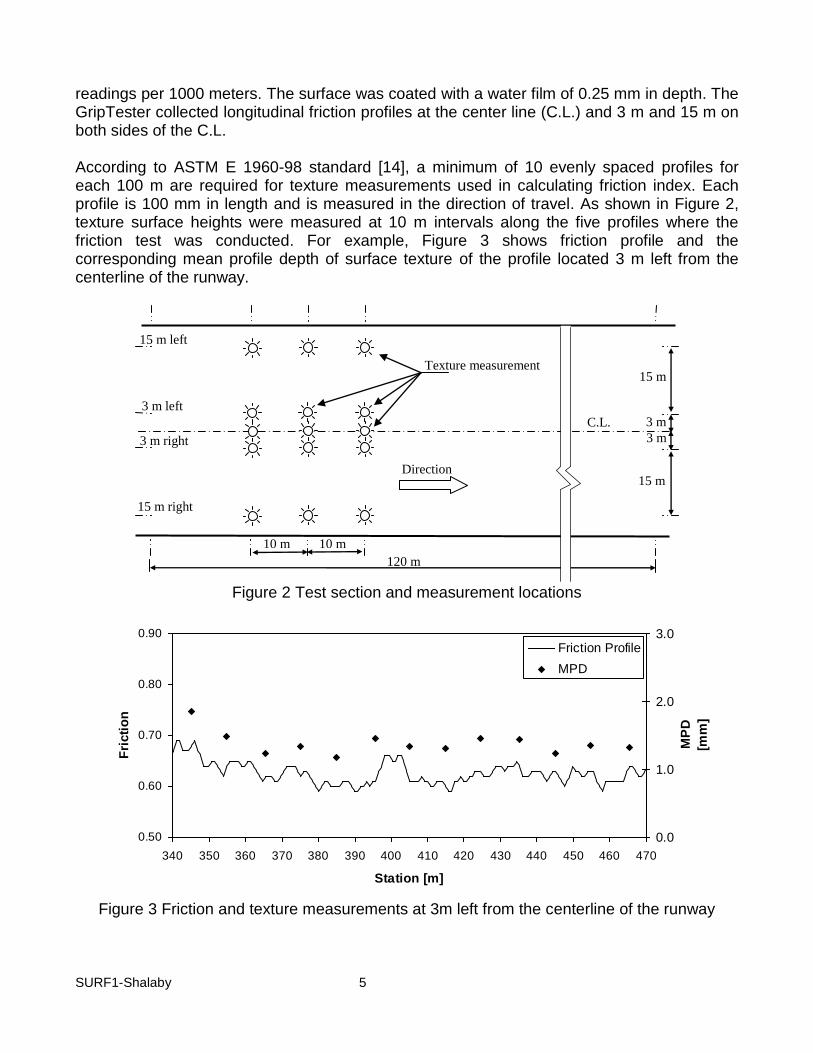
readings per 1000 meters. The surface was coated with a water film of 0.25 mm in depth. The GripTester collected longitudinal friction profiles at the center line (C.L.) and 3 m and 15 m on both sides of the C.L. According to ASTM E 1960-98 standard [14], a minimum of 10 evenly spaced profiles for each 100 m are required for texture measurements used in calculating friction index. Each profile is 100 mm in length and is measured in the direction of travel. As shown in Figure 2, texture surface heights were measured at 10 m intervals along the five profiles where the friction test was conducted. For example, Figure 3 shows friction profile and the corresponding mean profile depth of surface texture of the profile located 3 m left from the centerline of the runway.
Figure 2 Test section and measurement locations
0.50
0.60
0.70
0.80
0.90
340 350 360 370 380 390 400 410 420 430 440 450 460 470
Station [m]
Fri
cti
on
0.0
1.0
2.0
3.0
MP
D
[mm
]
Friction Profile
MPD
Figure 3 Friction and texture measurements at 3m left from the centerline of the runway
10 m 10 m
120 m
C.L.
3 m left
Direction
15 m left
3 m right
15 m right
Texture measurement 15 m
3 m
3 m
15 m
SURF1-Shalaby 6
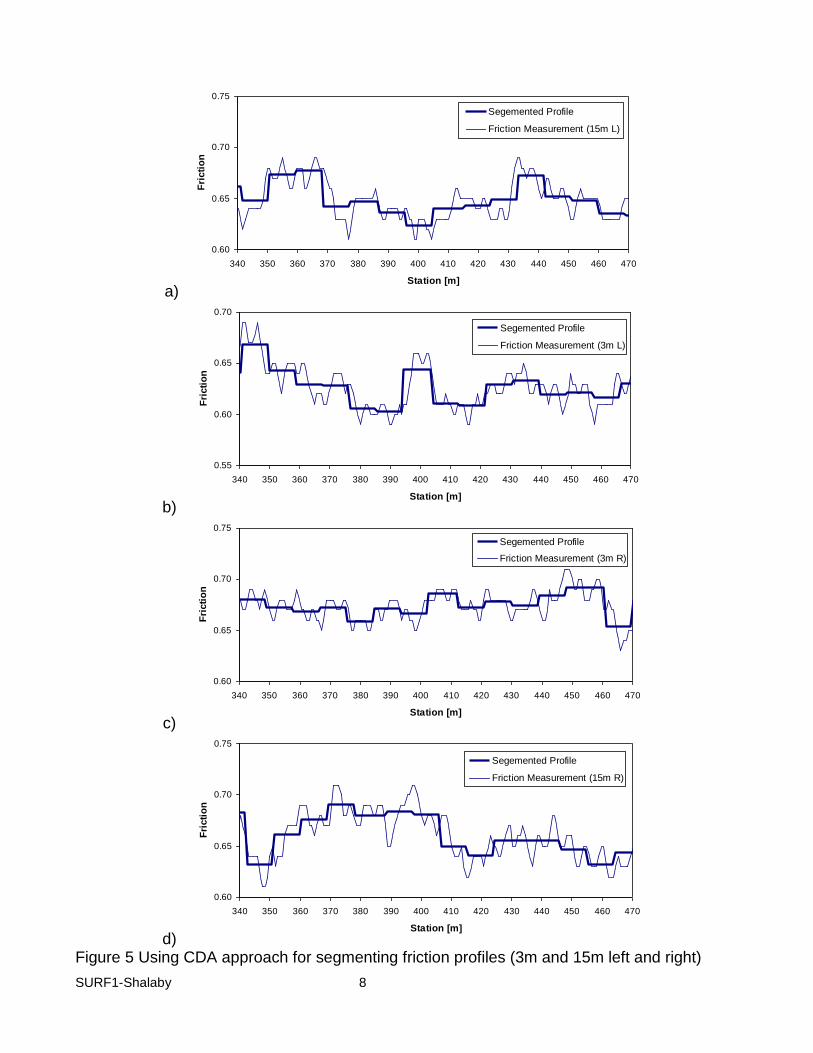
4.1.1. Segmentation of Friction Measurements
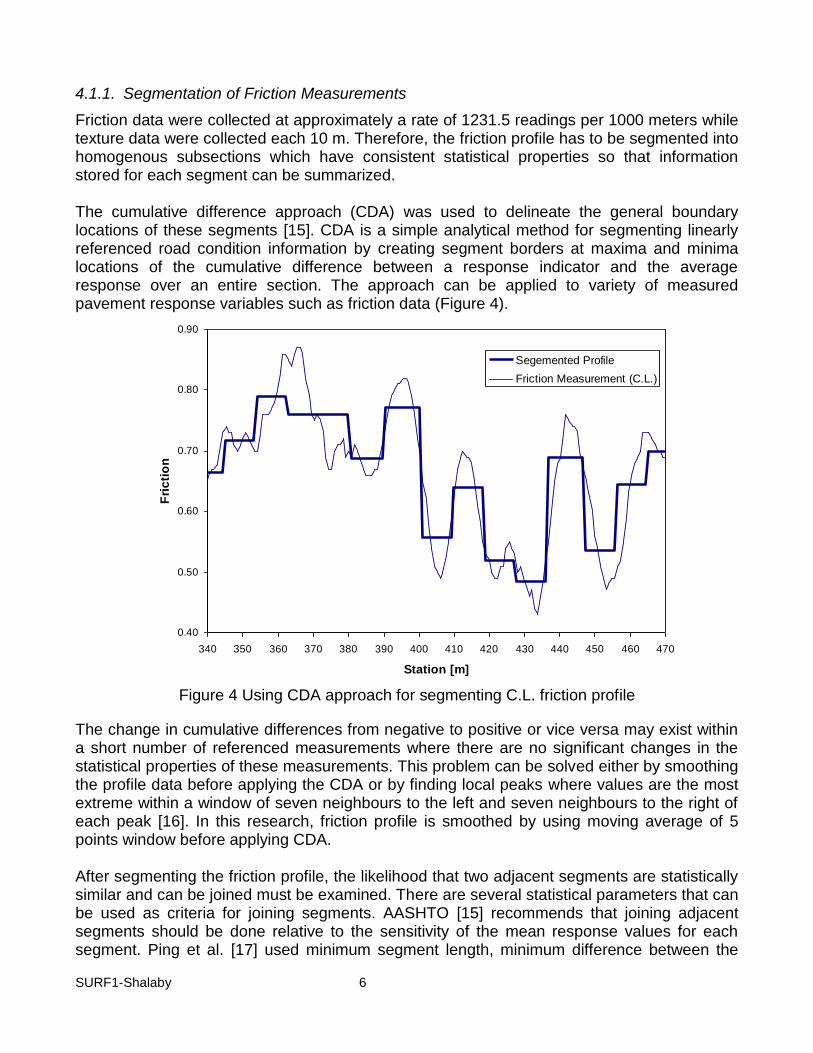
Friction data were collected at approximately a rate of 1231.5 readings per 1000 meters while texture data were collected each 10 m. Therefore, the friction profile has to be segmented into homogenous subsections which have consistent statistical properties so that information stored for each segment can be summarized. The cumulative difference approach (CDA) was used to delineate the general boundary locations of these segments [15]. CDA is a simple analytical method for segmenting linearly referenced road condition information by creating segment borders at maxima and minima locations of the cumulative difference between a response indicator and the average response over an entire section. The approach can be applied to variety of measured pavement response variables such as friction data (Figure 4).
0.40
0.50
0.60
0.70
0.80
0.90
340 350 360 370 380 390 400 410 420 430 440 450 460 470
Station [m]
Fri
cti
on
Segemented Profile
Friction Measurement (C.L.)
Figure 4 Using CDA approach for segmenting C.L. friction profile
The change in cumulative differences from negative to positive or vice versa may exist within a short number of referenced measurements where there are no significant changes in the statistical properties of these measurements. This problem can be solved either by smoothing the profile data before applying the CDA or by finding local peaks where values are the most extreme within a window of seven neighbours to the left and seven neighbours to the right of each peak [16]. In this research, friction profile is smoothed by using moving average of 5 points window before applying CDA. After segmenting the friction profile, the likelihood that two adjacent segments are statistically similar and can be joined must be examined. There are several statistical parameters that can be used as criteria for joining segments. AASHTO [15] recommends that joining adjacent segments should be done relative to the sensitivity of the mean response values for each segment. Ping et al. [17] used minimum segment length, minimum difference between the
SURF1-Shalaby 7
means of adjacent segments, and t-value. El Gendy and Shalaby [18] used a combination of target range and standard deviation while Kennedy et al. [19] used the standard deviation to control joining adjacent segments. In this paper, the minimum segment length of 10 m is used to control joining adjacent segments to match the texture measurement information. 4.2. Relationship between Surface Texture Indicators and Skid Resistance
According to ASTM E1960-98 Standards [14], calculating international friction index from a macrotexture and wet pavement friction requires using a speed constant (Sp) to adjust the friction to a common slip speed of 60 km/h. The speed constant (Sp) is computed from a macrotexture measurement (TX in mm) as follows:
(3) where a, b are constants depending upon the method of computing the macrotexture. The friction measurement (FRS) at given speed S can be adjusted to the slip speed of 60 km/h using the following relationship:
(4) where FR60 is the adjusted value of friction from a slip speed S to 60 km/h. The final step for calculating the friction is to determine the calibration constants of the linear regression with the calibrated friction number F60 according to the following relationship:
(5) where A, B and C are calibration constants. PhotoTexture measurements can be assessed directly by using GripTester where the estimated target Sp and F60 are determined by GripTester and PhotoTexture, respectively. 4.3. Data Analysis and Discussion
El Gendy and Shalaby [8] showed that the mean profile depth can be estimated from PSE provided by PhotoTexture according to:
(6) where a1 and b1 are constants. Therefore, the correlation between GripTester friction and image-based macrotexture is examined according to the relationship recommended by standard as in equations (3) to (5) where TX is replaced by MPD, RMSR, or MPDPSE. After segmentation, friction coefficients range between 0.48 and 0.79 as measured by GripTester for the centreline profile as shown in Figure 4a while friction coefficients have range of 0.61 to 0.69 for the rest of the profiles (Figure 5a-d). Because the centreline profile coincides with a longitudinal joint, the variation of the friction coefficients through the centreline profile is very high. The centreline profile data is shown but not included in the analysis.
TXbaS p
pS
S
FRSeFR
60
60
TXCFRBAF 6060
1.1 b
PSE PSEaMPD
SURF1-Shalaby 8
a)
0.60
0.65
0.70
0.75
340 350 360 370 380 390 400 410 420 430 440 450 460 470
Station [m]
Fri
cti
on
Segemented Profile
Friction Measurement (15m L)
b)
0.55
0.60
0.65
0.70
340 350 360 370 380 390 400 410 420 430 440 450 460 470
Station [m]
Fri
cti
on
Segemented Profile
Friction Measurement (3m L)
c)
0.60
0.65
0.70
0.75
340 350 360 370 380 390 400 410 420 430 440 450 460 470
Station [m]
Fri
cti
on
Segemented Profile
Friction Measurement (3m R)
d)
0.60
0.65
0.70
0.75
340 350 360 370 380 390 400 410 420 430 440 450 460 470
Station [m]
Fri
cti
on
Segemented Profile
Friction Measurement (15m R)
Figure 5 Using CDA approach for segmenting friction profiles (3m and 15m left and right)
SURF1-Shalaby 9
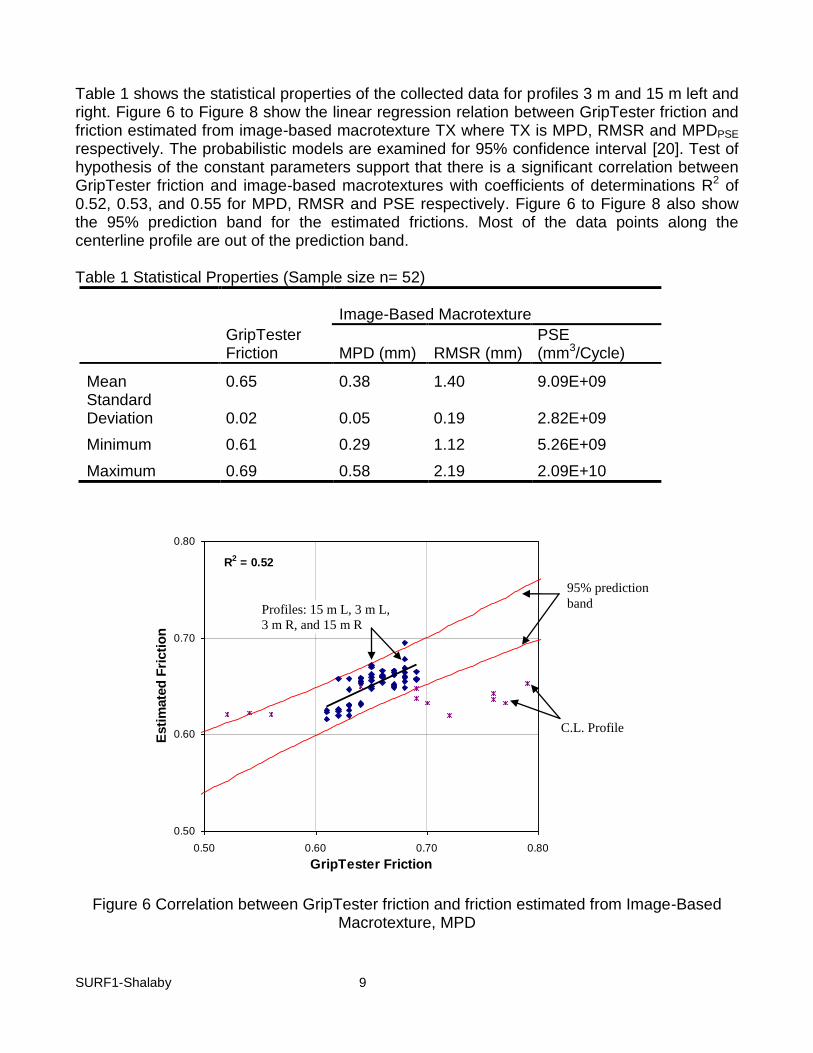
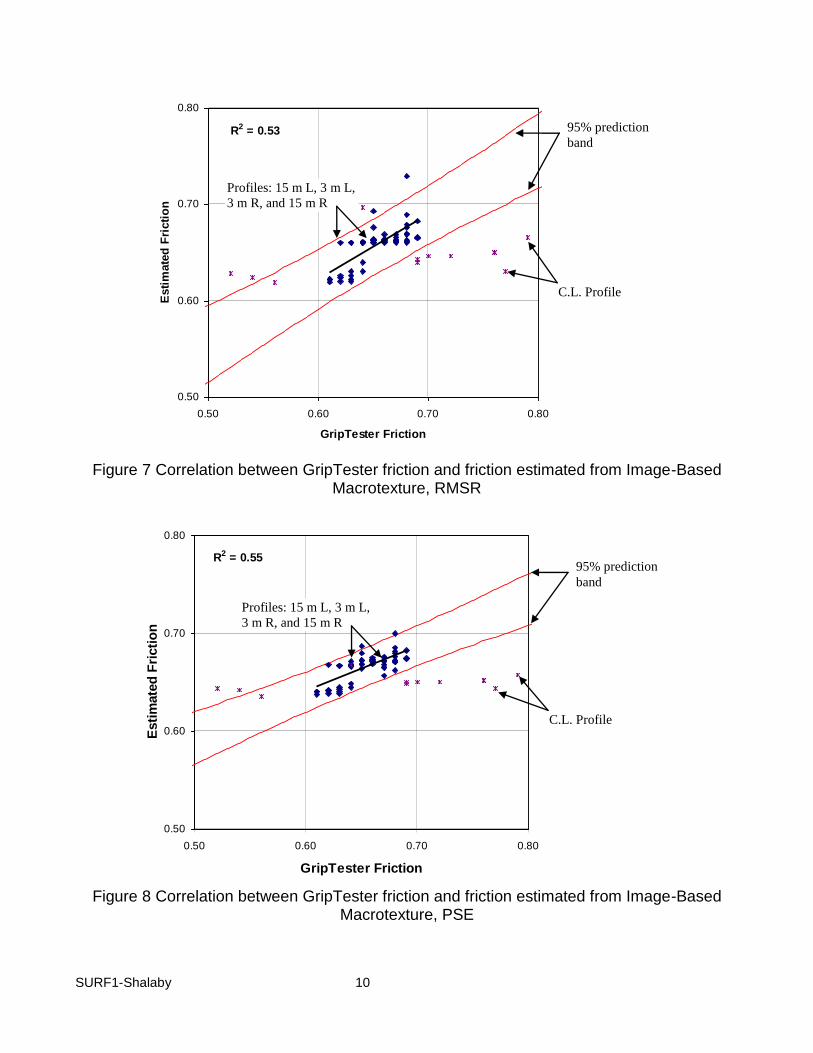
Table 1 shows the statistical properties of the collected data for profiles 3 m and 15 m left and right. Figure 6 to Figure 8 show the linear regression relation between GripTester friction and friction estimated from image-based macrotexture TX where TX is MPD, RMSR and MPDPSE respectively. The probabilistic models are examined for 95% confidence interval [20]. Test of hypothesis of the constant parameters support that there is a significant correlation between GripTester friction and image-based macrotextures with coefficients of determinations R2 of 0.52, 0.53, and 0.55 for MPD, RMSR and PSE respectively. Figure 6 to Figure 8 also show the 95% prediction band for the estimated frictions. Most of the data points along the centerline profile are out of the prediction band. Table 1 Statistical Properties (Sample size n= 52)
GripTester Friction
Image-Based Macrotexture
MPD (mm) RMSR (mm) PSE (mm3/Cycle)
Mean 0.65 0.38 1.40 9.09E+09 Standard Deviation 0.02 0.05 0.19 2.82E+09
Minimum 0.61 0.29 1.12 5.26E+09
Maximum 0.69 0.58 2.19 2.09E+10
Figure 6 Correlation between GripTester friction and friction estimated from Image-Based
Macrotexture, MPD
R2 = 0.52
0.50
0.60
0.70
0.80
0.50 0.60 0.70 0.80
GripTester Friction
Esti
mate
d F
ricti
on
95% prediction
band
C.L. Profile
Profiles: 15 m L, 3 m L,
3 m R, and 15 m R
SURF1-Shalaby 10
Figure 7 Correlation between GripTester friction and friction estimated from Image-Based
Macrotexture, RMSR
Figure 8 Correlation between GripTester friction and friction estimated from Image-Based
Macrotexture, PSE
R2 = 0.55
0.50
0.60
0.70
0.80
0.50 0.60 0.70 0.80
GripTester Friction
Esti
mate
d F
ricti
on
95% prediction
band
C.L. Profile
Profiles: 15 m L, 3 m L,
3 m R, and 15 m R
R2 = 0.53
0.50
0.60
0.70
0.80
0.50 0.60 0.70 0.80
GripTester Friction
Esti
mate
d F
ricti
on
95% prediction
band
C.L. Profile
Profiles: 15 m L, 3 m L,
3 m R, and 15 m R

SURF1-Shalaby 11
The range of the measured friction data is limited between 0.61 and 0.69. However there is a statistically significant correlation between friction and image-based macrotexture, the regression constants can not present the general relationship between friction and image-based macrotexture. Pavements with wide range of friction properties should be tested. Also the test should be conducted for various pavement types.
5. SUMMARY AND CONCLUSIONS
PhotoTexture, a four-source photometric stereo system for recovering the 3D heights of pavement surface, has been used for measuring 3D pavement surface texture indicators. Airfield runway has been tested to examine the relationship between the 3D pavement surface texture indicators and friction. The correlation between the image-based macrotexture provided by PhotoTexture with the friction measurements provided by GripTester has been examined. At 95% level of confidence, a significant correlation between GripTester friction and image-based macrotexture has been found with coefficients of determinations R2 of 0.52, 0.53, and 0.55 for MPD, RMSR and PSE respectively. Due to the narrow range of the friction data (between 0.61 and 0.69), the regression constants can not represent a general relationship between friction and image-based macrotexture. Pavements with a wider range of friction properties and various pavement types should be tested.
REFERENCES
1. International Organization for Standardization (ISO). (1997). Characterization of Pavement Texture by Use of Surface Profiles. Part 1: Determination of Mean Profile Depth, International Standard No. 13473-1.
2. Britton, S. C., Ledbetter, W. B., and Gallaway, B.M. (1974). Estimation of Skid Numbers from Surface Texture Parameters in the Rational Design of Standard Reference Pavements for Test Equipment Calibration. Journal of Testing and Evaluation, JTEVA, Vol. 2, No. 2, pp.73-83.
3. Ergun, M., Lyinam, S., and Lyinam, A. F. (2005). Prediction of Road Surface Friction Coefficient Using Only Macro- and Microtexture Measurements. Journal of Transportation Engineering, Vol. 131, No. 4, pp. 311-319
4. Do, Minh-Tan. (2005). Relationship between microtexture and skid resistance. in the Bulletin des Laboratoires des Ponts et Chaussées (BLPC), Ref. 4566-pp.117-136. http://www.lcpc.fr, 2005
5. American Society for Testing and Materials (ASTM). (2001). Road and Paving Materials; Vehicle-Pavement Systems. the Annual Book of ASTM Standards, Vol. 04.03, E1845-01.
6. Bennett, Jean M., and Mattsson, L. 1999. Introduction to Surface Roughness and Scattering. Optical Society of America, 2
nd Ed.
7. International Organization for Standardization (ISO). (1997). GPS – Surface texture: Profile method. Terms, definitions and surface texture parameters. International Standard No. 4287.
8. El Gendy, A and A. Shalaby. (2007). Pavement Texture Classification Using Two Dimensional Fourier Transform of Image-Based Recovered Surface. In CSCE 2007 Annual General Meeting & Conference, Yellowknife, Canada, June 6-9.
9. El Gendy, A and A. Shalaby. (2007). Improved Specularity Detection relying on a Photometric Stereo Technique. In Graphics, Vision, and Image Processing, GVIP, The International Congress for Global Science and Technology, (ICGST), Volume 6, No. 4.

SURF1-Shalaby 12
10. El Gendy, A and A. Shalaby. (2007). Mean Profile Depth of Pavement Surface Macrotexture Using Photometric Stereo Techniques. in Journal of Transportation Engineering, Volume 133, Issue 7, American Society of Civil Engineers (ASCE), pp. 433-440.
11. Woodham, R. (1980). Photometric Method for Determining Surface Orientation from Multiple Images. Optical Engineering, (19) 139-144.
12. McGunnigle, G. (1998). The Classification of Textured Surfaces under Varying Illuminant Direction. PhD thesis, Heriot-Watt University, Edinburgh, Scotland.
13. Gullón, C. (2003). Height recovery of rough surfaces from intensity images. PhD thesis, Heriot-Watt University, Edinburgh, Scotland.
14. American Society for Testing and Materials (ASTM). (1998). Road and Paving Materials; Vehicle-PavementSystems.”theAnnualBookofASTMStandards,Vol.04.03E1960.
15. AASHTO Guide for Design of Pavement Structures. (1993). AASHTO, Washington, D.C. 20001. 16. Thomas, F. (2004). Generating Homogeneous Road Sections Based on Surface Measurements:
Available Methods. In the 2nd
European Pavement and Asset Management Conference, Berlin, Germany, paper No. 48, 21-23 March 2004.
17. Ping, W.V., Z. Yang, L. Gan, and B. D. (1999). Development of procedure for automated segmentation of pavement rut data. In Transportation Research Record: Journal of the Transportation Research Board, No. 1655, TRB, National Research Council, Washington D. C., pp. 65-73.
18. El Gendy, A and A. Shalaby. (2008). Using Quality Control Charts to Segment Road Surface Condition Data. The International Conference on Managing Pavement Assets (ICMPA 2008), June 24 – 28, The Westin Calgary, Alberta.
19. Kennedy J., A. Shalaby, and R. V. Cauwenberghe. (2000). Dynamic Segmentation of Pavement Surface Condition Data. In 3
rd Transportation Specialty Conference of the Canadian Society for Civil Engineering.
CD-ROM. London, Ontario. 20. Wackerly, Dennis D., W. Memdenhall III, and R. L. Scheaffer (2002). Mathematical Statistics with
Applications. 6th Edition, Duxbury, Thomson Learning, USA, ISBN 0-534-37741-6, 2002.