Embed Size (px)
Citation preview
194Copyright © All rights are reserved by Deynier Montero Góngora.
Advances in Robotics & Mechanical Engineering
Research article
3d Geotechnical Model of the Soil Susceptible to Liquefaction, In the Central Area of Caimanera,
GuantánamoDeynier Montero Góngora1*, Katerin Carcassés Álvarez2, Liuska Fernández Diéguez2, Yorgenis Maceo Rustán3, Jose Luis Urra Abraira3
1CEETAM, University of Moa, Cuba
2Geology, Moa University, Cuba
3Geology, Company Commander Pedro Sotto Alba de Moa, Cuba
*Corresponding author: Deynier Montero Góngora,CEETAM, University of Moa, Cuba
Received: August 08, 2020 Published: August 12, 2020
ISSN: 2643-6736
DOI: 10.32474/ARME.2020.02.000147
Abstract
Models are widely used in all sciences to simplify the most complex problems in reality, allow a representation of the behavior of a system and acquire great relevance in Geological Engineering.The conceptual geological model is very useful for projects developed in the field. Geotechnical models have evolved in parallel to computer-assisted techniques, from 2D to 3D models. The correct modeling of the physical-mechanical properties contributes to obtaining a representation of the characteristics of the geological object.The low availability of soils in the city of Caimanera, province of Guantánamo, appropriate for construction, has forced the use of swamp areas for urban development, through the use of low-thickness fill materials. The execution of constructions on swamp areas and low plasticity soils contributes to the increased risk of liquefaction.The 3D model obtained allowed the approximate spatial distribution of the variables (liquid limit, natural humidity, number of blows of the standard penetration test, percentage of fine soil and plasticity index) that affect the susceptibility of the soils in the area. Caimanera power station.The results of the 3D model indicate that the soils represented by compressible clays, silty clay, calcareous shale and organic silt have a high susceptibility to liquefaction; and that the compressible clays located in the University Venue have the highest susceptibility to liquefaction, taking into account the relatively low fines content (14%).
Keywords: Conceptual geological model; Geological object; Liquefaction; Space distribution; Clay
IntroductionModels are widely used in all sciences to simplify the most
complex problems in reality, allow a representation of the behavior of a system and acquire great relevance in Geological Engineering. Within this discipline, three basic types of models can be distinguished, which are: the geological model, which represents the spatial distribution of materials, tectonic accidents, hydrological, geomorphological characteristics, etc, the geomechanical model, in which the geotechnical and hydrogeological characteristics of the materials are differentiated; and the geotechnical model of behavior, which represents the response of the terrain during
and after the construction of the engineering works that affect the study area [1]. The first step in developing a geological model is to correctly characterize the site and define geological units with similar behavior. Through this information, geological or geotechnical engineers can develop a conceptual geological model that is very useful for projects developed on the same terrain [2]. The simplification of geological-geotechnical models (MGG) may be directed to the omission of details, depending on the interest of the research or caused by ignorance of the object studied. MGGs have evolved in parallel with computer-assisted techniques, from

Citation: Deynier Montero Góngora, Katerin Carcassés Álvarez, Liuska Fernández Diéguez, Yorgenis Maceo Rustán, Jose Luis Urra Abraira. 3d Geotechnical Model of the Soil Susceptible to Liquefaction, In the Central Area of Caimanera, Guantánamo. Adv in Rob & Mech Engin 2(5)- 2020. ARME.MS.ID.000147. DOI: 10.32474/ARME.2020.02.000147.
Volume 2 - Issue 5 Copyrights @ Deynier Montero G, et al.Adv in Rob & Mech Engin
195
two-dimensional (2D) models to current three-dimensional (3D) models, but in all cases, they have had the purpose of spatially representing the basic units of geotechnical information (UBIG) [3]. MGGs have a wide range of applications. The immediate application consists in the identification of the lithological, geomorphological and structural characteristics of the object of study. These allow us to infer the characteristics of the medium through which the groundwater would eventually circulate and the predisposition or susceptibility of the medium to the occurrence of geological processes generating geotechnical hazards can be determined, whose prediction methods always imply the lithology variable [3]. MGGs allow the engineer to understand the conditions existing in a certain place, in addition to identifying the main geotechnical problems and making the estimation of soil properties more objective.
The correct modeling of the physical-mechanical properties contributes to obtaining a representation of the characteristics of the geological object. The geometry of the basic information unit is used as a virtual limit for the estimation of the property of interest [4-6]. With this application it is possible to reduce considerably the incompatibilities between the quantitative interpretation, conceived based on a geotechnical parameter and the reality of the physical environment. In Cuba, studies of this type are aimed at making models that allow the visualization of soil behavior, especially in areas of vulnerability or risk to geological phenomena. This case study is located in the city of Caimanera, Guantánamo province, where the active Bartlett-Caimán earthquake is located. The low availability of appropriate soils for construction has forced the use of swamp areas for urban development, through the use of infill materials with low thicknesses. The surface geology of urban areas greatly influences the level of seismic shocks, there being a strong relationship between the geotechnical properties of soils and their seismic susceptibility. According to Youd & Perkis, unconsolidated materials are usually responsible for important changes in the amplitude of seismic shocks and for induced effects such as liquefaction [7].
The National Company for Applied Research (ENIA) of the Santiago de Cuba province, carried out in Caimanera the geotechnical studies in the sectors planned for construction. Through the creation of coves, seven types of soils were identified (SC: clay sand, CL: clay with low plasticity, SM: silty sand, OL: organic with low plasticity, GC: clay gravel, GP: clean gravel poorly graded, CH: High plasticity clay). The execution of constructions on swamp areas and low plasticity soils contributes to the increased risk of liquefaction. Among the geotechnical parameters linked to liquefaction susceptibility are: number of blows of the standard penetration test (N-SPT), plasticity index (IP), natural water content (W), percentage of fines (CF) and liquid limit (LL). The aforementioned parameters have been used, to a greater or lesser extent, in the liquefaction studies in Cuba developed by
Fernández and Bandera [8,9]. These works have been oriented to the delimitation of areas vulnerable to liquefaction, without considering the 3D spatial behavior of each one. Taking this need as a starting point, this work plans to perform 3D modeling of the geotechnical parameters that allow characterizing the soils susceptible to liquefaction. The insufficient knowledge of the 3D spatial distribution of the geotechnical parameters of the soil susceptible to liquefaction arises as a research problem. Therefore, the objective of the work is to develop a 3D geotechnical model of the soils susceptible to liquefaction in the central area of Caimanera, Guantánamo province.
Materials and Methods
Physico-geographical and geological features of the study region
Caimanera is one of the 10 municipalities that make up the current province of Guantánamo, it is located 17 km of the same, limiting to the north with him and with the Manuel Tamez municipality, to the east with the municipality of San Antonio del sur, to the south with the Caribbean Sea and to the west with the municipality of Niceto Pérez. Being located in the coastal strip of southern Cuba, it is part of the so-called Cuban semi-desert. It presents alluvial soils of clays on limestones and sandstones. The coastline is surrounded by a swampy area and mangroves that have been disappearing over time (Figure 1) [8].
Figure 1: Map of the geographical location of the Caimanera municipality. Own elaboration.
Regional and local geology
The Caimanera municipality is located in the delta of the Guantánamo river, it is represented by the formations that appear in Figure 2.
Shrimp Formation: It is made up of polymictic conglomerates, with sub-rounded and rounded edges, and coarse-grained polymetric sandstones. The matrix of the conglomerate is sandy and polymictic in composition. These coarse lithologies transition to medium grain sandstones, but maintain their composition.

Citation: Deynier Montero Góngora, Katerin Carcassés Álvarez, Liuska Fernández Diéguez, Yorgenis Maceo Rustán, Jose Luis Urra Abraira. 3d Geotechnical Model of the Soil Susceptible to Liquefaction, In the Central Area of Caimanera, Guantánamo. Adv in Rob & Mech Engin 2(5)- 2020. ARME.MS.ID.000147. DOI: 10.32474/ARME.2020.02.000147.
Volume 2 - Issue 5 Copyrights @ Deynier Montero G, et al.Adv in Rob & Mech Engin
196
Figure 2: Geological formations of the Caimanera municipality.
Jaimanitas Formation: Massive biodetritic limestones, generally fossilized, very fossiliferous, containing mainly well-preserved shells, corals of current species and, occasionally, biohermos. The karst pockets are sometimes filled with a fine carbonate-clay-ferruginous mixture, brick red in color. They pass to biocalcarenites, of variable or massive granulometry and stratification. In greater or lesser quantity, they contain fragments of terrigenous sediments, which include pre-existing limestone. It is common to find lithofacial and biofacial variations. In general, the cementation is variable, and, on its surface, it has a recrystallized cap of evaporite and caliche combined, 1 to 2m thick, below which, sometimes, the rock appears disintegrated, turned into an earthy material. The predominant coloration is whitish, pinkish or yellowish.
Maquey Formation: Alternation of gray sandstones, siltstones and calcareous clays and white to cream marls, containing intercalations of variable thickness of biodetritic, sandy and gravelitic limestones of white yellow and cream colors, occasionally grayish yellow. Layering is fine to medium, less frequently thick or massive. Some horizons, particularly of biodetritic limolites and limestones, are fossiliferous, in which large lepidocyclines abound. Other horizons contain gypsum, lignite and lignitized plant remains.
Rio Maya Formation: Very hard, algal, coral and micritic biohermic limestones with a micritic matrix, frequently marbled. It contains corals in a growth and fragmentary position, as well as, subordinately, molds and mollusk shells, all recrystallized, among which there is an abundance of coral Acropora proliferates. Limestones are frequently dolomitized. Clay content is highly variable. There are abundant clasts of terrigenous material, coming from the rocks of the neighboring emerged areas; Its grain size varies between sands and ridges. Sometimes there are intercalations of polymictic conglomerates of variable granulometry and calcareous cement. The color is white, yellowish, pink or grayish.
San Luis Formation: It is composed of a finely stratified flyschoid terrigenous sequence of clastic and terrigenous-carbonate rocks, with a varied granulometry from clays to conglomerates. It also contains gray to medium to fine grain polymictic sandstones, which sometimes appear in thick layers; brownish-brown siltstones; creamy calcareous siltstones; Massive brownish calcareous shales; clayey micritic limestones, beige; biodetritic limestones, with abundant large benthic foraminifera; whitish-cream loams, which can pass laterally to limestone. The limestones have a massive appearance, they are laminated and, on occasions, weak, with a predominance of brown and cream colors; They consist of crypto to microcrystalline calcite, containing clay material and iron oxides and hydroxides. In some cases, they include benthic forms, indicative of shallow waters of the sublitoral zone; at other times they only contain planktonic forms indicating deep environments. The latter is mainly seen towards the easternmost part of the territory. Likewise, in the limestone grains of plagioclase, quartz, metal, chlorite and effusive rocks can be seen.
The terrigenous sequences are made up of fine and coarse-grained sandstones, which transition to calcareous sandstones due to the increase in carbonate material. This is represented by fragments of limestone, organisms and by a contact type cement, calcite, generally recrystallized. The terrigenous material is very varied, characterized by basic, medium and acid effusive rocks, intrusive rocks, clay rocks and grains of plagioclase of different composition, clinopyroxenes, quartz and grains of metal. The organisms present are fragments of algae, planktonic and benthic foraminifera, rarely siliceous, and some of them formed by phosphate minerals are observed in isolation. The cement of these rocks is calcite, undefined cryptocrystalline material and zeolites [10].
Regional geomorphology
The province is made up of two large natural regions: the Guantánamo Valley, with flat relief and an extensive Bay of Stock Exchange, classified as the third largest in the world. It presents important rivers that make up the third hydrographic basin prioritized at the national level, called Guantánamo-Guaso, where 80% of the territory’s population is concentrated. The study area presents a fairly flat relief, with heights or remnants of mountains, reaching heights of 25 meters above sea level (s.n.m.), in some places they reach up to 40m. Its smooth and wavy relief is formed by swampy sea plains and some pre-mountainous areas. The area occupied by the head town and its surroundings is extremely low, with values up to 1 meter above sea level [10].
Hydrogeological characteristics
The structure of the aquifer complex to which the area belongs (Superior and Current Quaternary) has a predominant power that

Citation: Deynier Montero Góngora, Katerin Carcassés Álvarez, Liuska Fernández Diéguez, Yorgenis Maceo Rustán, Jose Luis Urra Abraira. 3d Geotechnical Model of the Soil Susceptible to Liquefaction, In the Central Area of Caimanera, Guantánamo. Adv in Rob & Mech Engin 2(5)- 2020. ARME.MS.ID.000147. DOI: 10.32474/ARME.2020.02.000147.
Volume 2 - Issue 5 Copyrights @ Deynier Montero G, et al.Adv in Rob & Mech Engin
197
varies from 5-15m and heading south, towards the sea it increases to 25m. The water table values (Figure 3) fluctuate from 0.5m depth (towards the bay) to 3m in isolated cases, which indicates that there is little variation as stated [11].
Figure 3: Depth diagram of the water table in the Caimanera municipality, Guantánamo province [8].
Generally, due to the hydraulic characteristics of this aquifer complex, groundwater is predominant. So, you are in the presence of saturated and semi-saturated rocks.
Engineering-geological characteristics of the region
Within the limits of the territory studied, two layers are distinguished: the first layer is represented by current marine sediments (aQIV), they are developed along the coastline, up to the current absolute height of 2m, they are represented by clays and silts, have a large amount of organic remains, their thickness is 1.0-1.5m, they lie mainly on marine alluvial sediments. The second layer corresponds to marine alluvial sediments (am Q III), they are extended in the area up to the current absolute levels of 20 to 25m. They are found in the flat coastal-marine valley, in the lower course of the rivers. They lie on the rugged, perforated surface of the rocks of the San Luis Formation. They are represented by heavy and silty clays, laminar, sometimes with intercalations of silts, in the lower part of the profile they are often sandy, with intercalations of gravel, sand, pebbles in the clay aggregate, in the sediments are remains of shells, the power can reach in some places between 4-6m [12].
Seismicity
The seismic phenomena registered in the territory indicate differences in the values of longitudinal and transverse wave velocities. The denser the soil, the faster the propagation of the seismic waves will be. The multiplication of propagation speed and density results in seismic stiffness, which varies depending on the type of soil. In gravels there are high values of seismic rigidity, however, in clay soils the values are small, which means that the movement of the soil in these cases will be greater.
Seismicity-Liquefaction
Caimanera is located in a seismically active area, several earthquakes have taken place in the territory. The Haiti earthquake of January 12, 2010 generated great negative perceptions in the population. Then on Saturday, March 20, at 2:38a.m., an event occurred in Baconao of Magnitude 5.6 that generated intensities of VI degrees in Santiago de Cuba, Guantánamo and Caimanera. In the study area, since 1987, site effects have been reported that have generated the differential settlements of the Soviets GPS IV Grand Panel buildings, even one of them was demolished and the other was reduced to 2 levels [9].
Methodology Used in the ResearchThe methodology applied in the research for modeling in the
urban sector of the Caimanera municipality, Guantánamo province, can be seen in Figure 4.
Figure 4: Flowchart of the stages that comprise the research methodology.
Bibliography search and analysis
At this stage, a bibliographic search is carried out by reviewing a series of scientific articles, diploma works, master’s thesis, geological engineering reports of engineering works located in the archives of the National Company for Applied Research (ENIA) in Santiago de Cuba. In addition to reviewing internet articles, books and all kinds of documents on the subject to be developed. The research design was elaborated defining the problem and the methodology to be used to solve it. In a second moment, the methodologies used for the modeling derived from the revised information were analyzed, determining the distribution of the soils with physical-mechanical properties that make them liquefiable, responding to the research objective and constituting a rigor tool, fundamentally applicable to the solution of geotechnical phenomena in the municipality.
General concepts on the liquefaction phenomenon
Liquefaction occurs when certain types of soils affected by earthquakes rapidly develop high interstitial pressures (without
Citation: Deynier Montero Góngora, Katerin Carcassés Álvarez, Liuska Fernández Diéguez, Yorgenis Maceo Rustán, Jose Luis Urra Abraira. 3d Geotechnical Model of the Soil Susceptible to Liquefaction, In the Central Area of Caimanera, Guantánamo. Adv in Rob & Mech Engin 2(5)- 2020. ARME.MS.ID.000147. DOI: 10.32474/ARME.2020.02.000147.
Volume 2 - Issue 5 Copyrights @ Deynier Montero G, et al.Adv in Rob & Mech Engin
198
drainage), leading to a loss of cut resistance and breakage of the soil, which behaves as if it were a liquid. This phenomenon causes the failure of foundations, breakage of slopes and landslides. The soils susceptible to losing much of their resistance to dynamic stresses are fine and loose sands, as well as poorly graded sands and silts.
According to the observation of areas affected by liquefaction, it takes place in the following circumstances:
a. Earthquake of magnitude equal to or greater than 5.5, with accelerations greater than or equal to 0.2g.
b. Below 15m depth no liquefactions have been observed.
c. In most cases where liquefactions have been observed, the water table was at a shallow depth (0-3m) below 9m, liquefaction susceptibility is very low
There is a threshold of minimum earthquake intensity for liquefaction phenomena to occur. In highly susceptible soils, this intensity threshold is VI on the Modified Mercali scale, or magnitudes greater than 5.5 [8].
Geological criteria: The soils of fluvial and wind deposits, when saturated, have a high probability of being susceptible to liquefaction.
Criteria based on soil state: Loose soils are more susceptible to liquefaction than dense soils and, for a given density, soils under high effective confining stresses are more susceptible than soils under low effective confining stresses [8].
Geotechnical parameter limits used in liquefaction analysis for fine-grained soils to liquefy, certain granulometric conditions proposed by Wang in 1979 must be met. These are:
a. Percentage of fines of 0.005mm <15%.
b. Liquid limit, LL <35%.
c. Natural water content> 0.9 LL.
d. Liquidity index <0.75.
e. Shape of rounded particles.
Seed and Idriss consider that a soil can liquefy if the weight percentage of particles <0.005mm is less than 15%, LL <35, W / Ll> 0.9 [13]. This criterion was known as the Chinese criterion [8].
Geotechnical variables to model: The aspects of the geotechnical variables to take into account for the model were taken from [1].
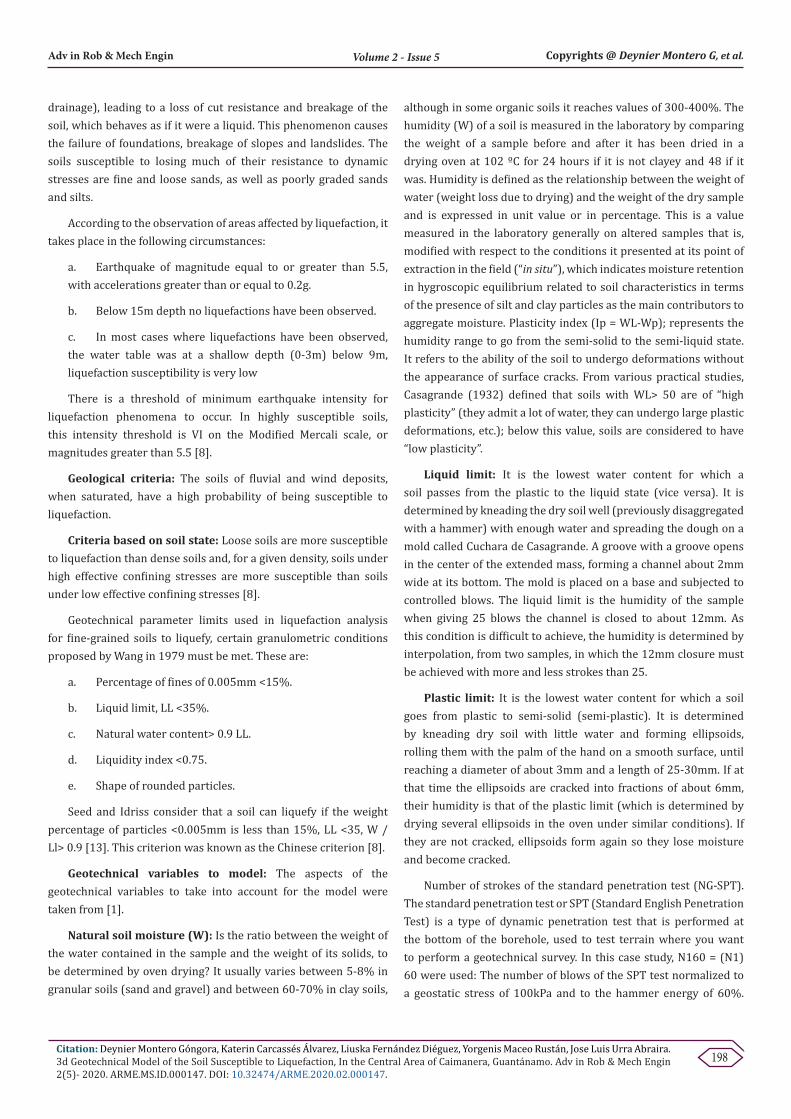
Natural soil moisture (W): Is the ratio between the weight of the water contained in the sample and the weight of its solids, to be determined by oven drying? It usually varies between 5-8% in granular soils (sand and gravel) and between 60-70% in clay soils,
although in some organic soils it reaches values of 300-400%. The humidity (W) of a soil is measured in the laboratory by comparing the weight of a sample before and after it has been dried in a drying oven at 102 ºC for 24 hours if it is not clayey and 48 if it was. Humidity is defined as the relationship between the weight of water (weight loss due to drying) and the weight of the dry sample and is expressed in unit value or in percentage. This is a value measured in the laboratory generally on altered samples that is, modified with respect to the conditions it presented at its point of extraction in the field (“in situ”), which indicates moisture retention in hygroscopic equilibrium related to soil characteristics in terms of the presence of silt and clay particles as the main contributors to aggregate moisture. Plasticity index (Ip = WL-Wp); represents the humidity range to go from the semi-solid to the semi-liquid state. It refers to the ability of the soil to undergo deformations without the appearance of surface cracks. From various practical studies, Casagrande (1932) defined that soils with WL> 50 are of “high plasticity” (they admit a lot of water, they can undergo large plastic deformations, etc.); below this value, soils are considered to have “low plasticity”.
Liquid limit: It is the lowest water content for which a soil passes from the plastic to the liquid state (vice versa). It is determined by kneading the dry soil well (previously disaggregated with a hammer) with enough water and spreading the dough on a mold called Cuchara de Casagrande. A groove with a groove opens in the center of the extended mass, forming a channel about 2mm wide at its bottom. The mold is placed on a base and subjected to controlled blows. The liquid limit is the humidity of the sample when giving 25 blows the channel is closed to about 12mm. As this condition is difficult to achieve, the humidity is determined by interpolation, from two samples, in which the 12mm closure must be achieved with more and less strokes than 25.
Plastic limit: It is the lowest water content for which a soil goes from plastic to semi-solid (semi-plastic). It is determined by kneading dry soil with little water and forming ellipsoids, rolling them with the palm of the hand on a smooth surface, until reaching a diameter of about 3mm and a length of 25-30mm. If at that time the ellipsoids are cracked into fractions of about 6mm, their humidity is that of the plastic limit (which is determined by drying several ellipsoids in the oven under similar conditions). If they are not cracked, ellipsoids form again so they lose moisture and become cracked.
Number of strokes of the standard penetration test (NG-SPT). The standard penetration test or SPT (Standard English Penetration Test) is a type of dynamic penetration test that is performed at the bottom of the borehole, used to test terrain where you want to perform a geotechnical survey. In this case study, N160 = (N1) 60 were used: The number of blows of the SPT test normalized to a geostatic stress of 100kPa and to the hammer energy of 60%.

Citation: Deynier Montero Góngora, Katerin Carcassés Álvarez, Liuska Fernández Diéguez, Yorgenis Maceo Rustán, Jose Luis Urra Abraira. 3d Geotechnical Model of the Soil Susceptible to Liquefaction, In the Central Area of Caimanera, Guantánamo. Adv in Rob & Mech Engin 2(5)- 2020. ARME.MS.ID.000147. DOI: 10.32474/ARME.2020.02.000147.
Volume 2 - Issue 5 Copyrights @ Deynier Montero G, et al.Adv in Rob & Mech Engin
199
Liquefaction of soils: it is the process of loss of resistance of certain types of soils, which are saturated in water and when subjected to the shock of an earthquake flow as a liquid due to an increase in pressure.
Inverse method of a distance power
The Power Inverse method consists of a weighted average of the known values where the weighting factors are the inverses of powers of the distances between each known point and the point where it is estimated.
The method is based on a linear combination given by:
*( ) ( )i iz X Z Xλ=∑In which iλ are the weights proportional to the Euclidean
distance between the sampled locations and the
one to be estimated, these weights are calculated by:
(1/ ) / 1/i oi oid dλ = ∑
where: oid is the distance between the location to be estimated and the location of the sample i.
Generalizing we obtain:
1, 1,*( ) 1/ ( ) / 1/i n oi i i n oiZ X d Z X d+ = = ∑ ∑Different estimators can be obtained if the previous equation
is written as:
( ) ( )1, 1,*( ) 1/ ( ) / 1/i n oi i i n oiZ X d Z X dω ω+ =
= ∑ ∑
Where: ω is the power and can incorporate different values.
This mathematical technique directly uses the sampled values for the estimation and refers weights according to the Euclidean distance between the data, without taking into account an analysis of variability of the available information. The influence of the value of a sample on a point or block to be estimated decreases when it
moves away from said point, which induces a greater weight ( iλ ) to be assigned to the values of the closest samples and less weight
( iλ ) to those furthest from the estimation point. It is clear from
the equation that as the power value (ω ) increases, the influence of the values of the most distant samples decreases, to the same extent that of the closest samples increases. With increasing power
(ω ), the interpolation of the laws between two points passes from the principle of gradual changes to the principle of the closest
neighbors; on the other hand, when the exponent (ω ) is zero, the method of the inverse of the distance is reduced to an arithmetic mean within the search neighborhood, that is, all the samples
are assigned the same weight regardless of the distance that the separates from the point to estimate.
General Characterization of the Soils of the Central Zone
Central zone
In this zone, soils filled with SC clay sands were identified, not very compact, very humid, with low resistance due to the proximity of the groundwater level. There are also unconsolidated sediments represented by compressible clays, saturated with abundant organic matter, organic silts of a very soft consistency, saturated with marine origin, and unconsolidated sediments, saturated compressible sandy clays (CL) with low plasticity. Among the works that could be most affected are: Baseball field, Housing in the Sports Zone, Servicentro and University Venue. The location area (Figure 5) is flat with subsoil formed with a thick layer of marine silt with intercalations of fine sand strata and other materials, having terrible qualities to cement on it [8].
Figure 5: Scheme of location of the soils of the central zone.
Obtaining the 3D model of the Geotechnical Parameters
The professional Gemcom Gems V6.4 software was the basic tool that allowed this type of modeling, it is based on the Microsoft Access database manager:
1. Database processing.
a. Creation and import of databases in Gemcom.
2. Development of the digital terrain model.
3. Estimation of the geotechnical parameters used.
Database Processing at GemcomThe information provided by the databases comes from
samples of drilling wells for geotechnical studies. The database was built using a series of tables or relational files, linked through some

Citation: Deynier Montero Góngora, Katerin Carcassés Álvarez, Liuska Fernández Diéguez, Yorgenis Maceo Rustán, Jose Luis Urra Abraira. 3d Geotechnical Model of the Soil Susceptible to Liquefaction, In the Central Area of Caimanera, Guantánamo. Adv in Rob & Mech Engin 2(5)- 2020. ARME.MS.ID.000147. DOI: 10.32474/ARME.2020.02.000147.
Volume 2 - Issue 5 Copyrights @ Deynier Montero G, et al.Adv in Rob & Mech Engin
200
key fields. From the data in ASCII format, a drillhole type workspace was created, where the field (HOLEID) was specified, which served as a link between the different tables. Additionally, the HEADER, SURVEY, ASSAY and LITHOLOGY tables were created, in which the fields to be used in the database were defined. For each field, a type (real, integer, text) was assigned, the default value and the number of decimals were modified (Figure 6). To import the database, an
import profile was first designed for each table. In each table, the fields were listed in the order established within the ASCII file.
In the GEMCOM project, a directory was created with the name Imports, which contains the data from the different tables. Geotechnical data were imported into these tables, thus forming the database within the Gemcom Software (Figure 7).
Figure 6: Fields used in the ASSAY table in the database.
Figure 7: Structure of the database used in the GEMCOM software.
The disposition of the files that make up the database has the lithological information from nine wells, which contain the geotechnical variables and the spatial location.
Header: Well identification (HOLE-ID), wellhead coordinates (X, Y, Z), drilling depth (LENGTH)
Assay: Well Identification (HOLE-ID), from (FROM), to (TO), sampling length (LENGTH), Liquid limit (LL), Plastic limit (LP), Number of strokes of the standard penetration test ( NG-SPT), Natural soil moisture (W), Plasticity index (IP) and Percent of fine (% F).
Citation: Deynier Montero Góngora, Katerin Carcassés Álvarez, Liuska Fernández Diéguez, Yorgenis Maceo Rustán, Jose Luis Urra Abraira. 3d Geotechnical Model of the Soil Susceptible to Liquefaction, In the Central Area of Caimanera, Guantánamo. Adv in Rob & Mech Engin 2(5)- 2020. ARME.MS.ID.000147. DOI: 10.32474/ARME.2020.02.000147.
Volume 2 - Issue 5 Copyrights @ Deynier Montero G, et al.Adv in Rob & Mech Engin
201
Survey: Well identification (HOLE-ID), from (FROM), to (TO), Azimuth of the well and Dip.
Lito: Hole-ID, from (FROM), to (TO), sampling length (LENGTH), lithological code (LITOCOD).
NECKLACE, spatial location x, y, z of the well.
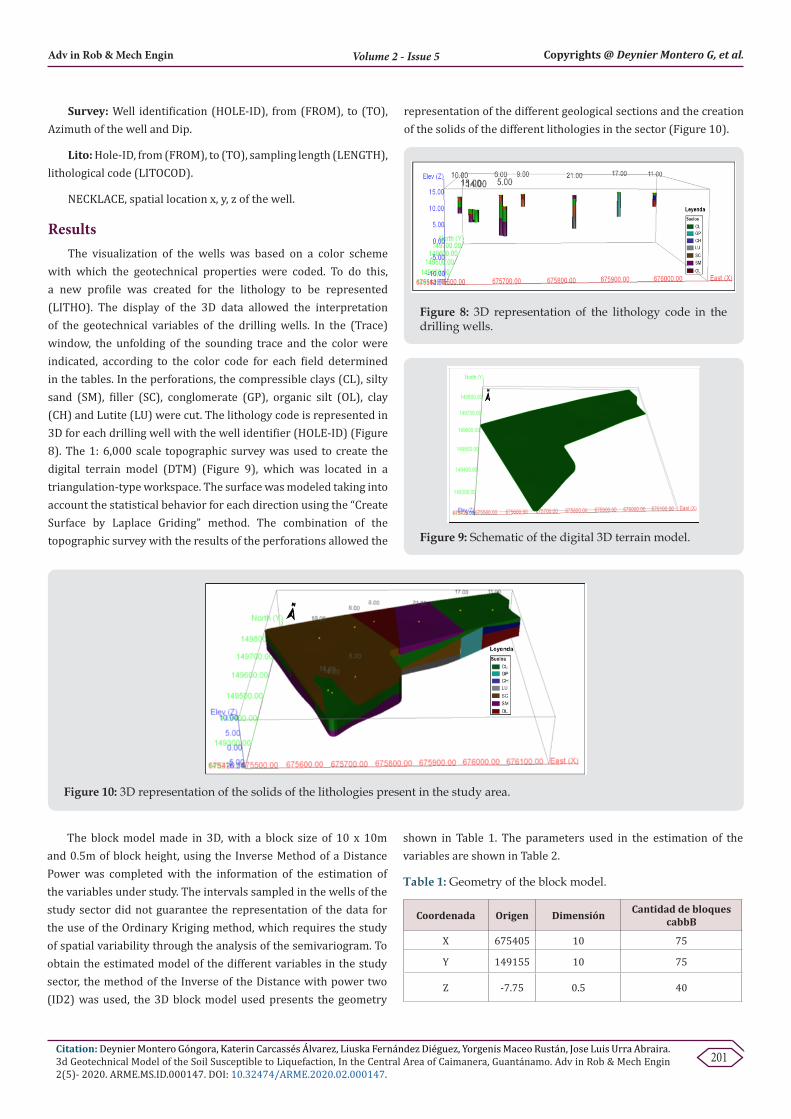
ResultsThe visualization of the wells was based on a color scheme
with which the geotechnical properties were coded. To do this, a new profile was created for the lithology to be represented (LITHO). The display of the 3D data allowed the interpretation of the geotechnical variables of the drilling wells. In the (Trace) window, the unfolding of the sounding trace and the color were indicated, according to the color code for each field determined in the tables. In the perforations, the compressible clays (CL), silty sand (SM), filler (SC), conglomerate (GP), organic silt (OL), clay (CH) and Lutite (LU) were cut. The lithology code is represented in 3D for each drilling well with the well identifier (HOLE-ID) (Figure 8). The 1: 6,000 scale topographic survey was used to create the digital terrain model (DTM) (Figure 9), which was located in a triangulation-type workspace. The surface was modeled taking into account the statistical behavior for each direction using the “Create Surface by Laplace Griding” method. The combination of the topographic survey with the results of the perforations allowed the
representation of the different geological sections and the creation of the solids of the different lithologies in the sector (Figure 10).
Figure 8: 3D representation of the lithology code in the drilling wells.
Figure 9: Schematic of the digital 3D terrain model.
Figure 10: 3D representation of the solids of the lithologies present in the study area.
The block model made in 3D, with a block size of 10 x 10m and 0.5m of block height, using the Inverse Method of a Distance Power was completed with the information of the estimation of the variables under study. The intervals sampled in the wells of the study sector did not guarantee the representation of the data for the use of the Ordinary Kriging method, which requires the study of spatial variability through the analysis of the semivariogram. To obtain the estimated model of the different variables in the study sector, the method of the Inverse of the Distance with power two (ID2) was used, the 3D block model used presents the geometry
shown in Table 1. The parameters used in the estimation of the variables are shown in Table 2.
Table 1: Geometry of the block model.
Coordenada Origen Dimensión Cantidad de bloques cabbB
X 675405 10 75
Y 149155 10 75
Z -7.75 0.5 40
Citation: Deynier Montero Góngora, Katerin Carcassés Álvarez, Liuska Fernández Diéguez, Yorgenis Maceo Rustán, Jose Luis Urra Abraira. 3d Geotechnical Model of the Soil Susceptible to Liquefaction, In the Central Area of Caimanera, Guantánamo. Adv in Rob & Mech Engin 2(5)- 2020. ARME.MS.ID.000147. DOI: 10.32474/ARME.2020.02.000147.
Volume 2 - Issue 5 Copyrights @ Deynier Montero G, et al.Adv in Rob & Mech Engin
202
Table 2: Estimation parameters of the variables.
Variables*Rotación Rango (m)
Tipo de Búsqueda Método de estimación
Cantidad Muestras
ADR X Y Z Mín Máx
LL 50,0,0 500 250 12 Octante ID2 1 16
LP 50,0,0 500 250 12 Octante ID2 1 16
% F 50,0,0 500 250 12 Octante ID2 1 16
N_SPT 50,0,0 500 250 12 Octante ID2 1 16
W 50,0,0 500 250 12 Octante ID2 1 16
*Rotation: A - Azimuth, D - Dip, R - Rake. According to SGemS 3.0 software
For the validation of the results achieved in the model, the mean of the samples was compared to that obtained by the estimates (Table 3), providing a level of precision of the data above 95%,
where the largest error is found in the percentage of fine (% F) with a 2.91 difference.
Table 3: Validation of the estimated variables.
Parámetro Ll % F N_SPT W
Media de las muestras 37.16 53.70 10.14 26.71
Media del Modelo 36.49 50.79 11.32 26.39
Error 0.67 2.91 -1.18 0.32
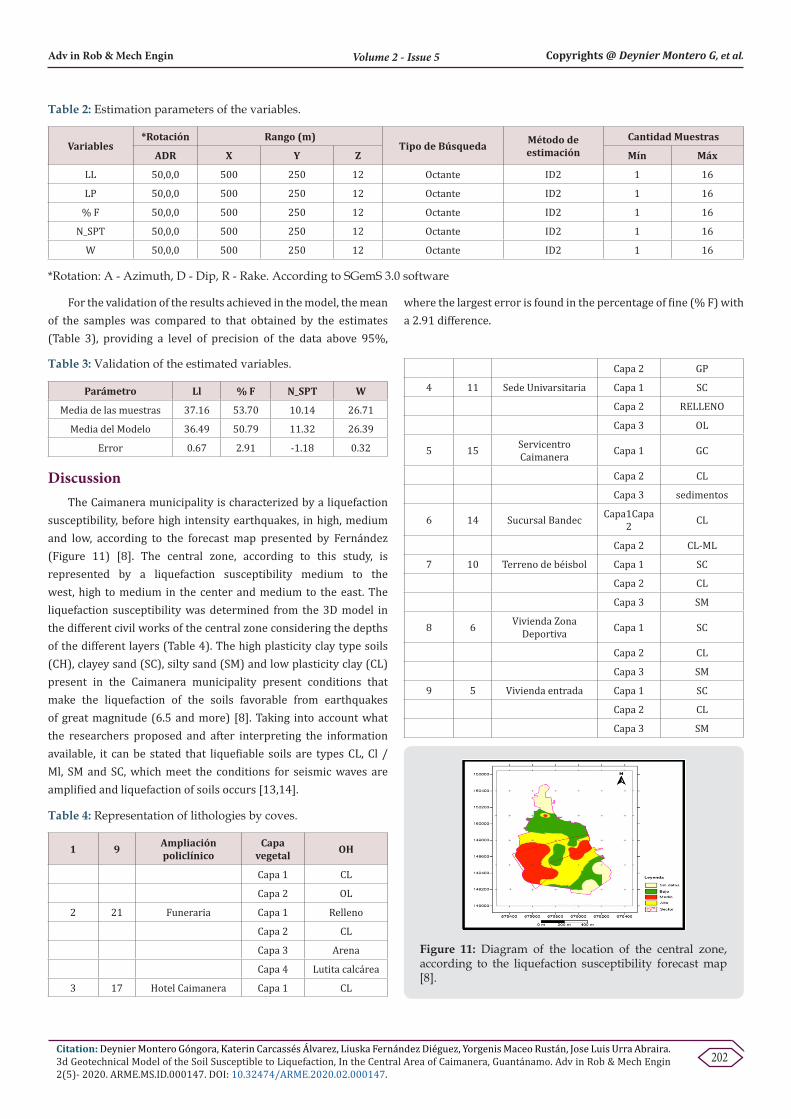
DiscussionThe Caimanera municipality is characterized by a liquefaction
susceptibility, before high intensity earthquakes, in high, medium and low, according to the forecast map presented by Fernández (Figure 11) [8]. The central zone, according to this study, is represented by a liquefaction susceptibility medium to the west, high to medium in the center and medium to the east. The liquefaction susceptibility was determined from the 3D model in the different civil works of the central zone considering the depths of the different layers (Table 4). The high plasticity clay type soils (CH), clayey sand (SC), silty sand (SM) and low plasticity clay (CL) present in the Caimanera municipality present conditions that make the liquefaction of the soils favorable from earthquakes of great magnitude (6.5 and more) [8]. Taking into account what the researchers proposed and after interpreting the information available, it can be stated that liquefiable soils are types CL, Cl / Ml, SM and SC, which meet the conditions for seismic waves are amplified and liquefaction of soils occurs [13,14].
Table 4: Representation of lithologies by coves.
1 9 Ampliación policlínico
Capa vegetal OH
Capa 1 CL
Capa 2 OL
2 21 Funeraria Capa 1 Relleno
Capa 2 CL
Capa 3 Arena
Capa 4 Lutita calcárea
3 17 Hotel Caimanera Capa 1 CL
Capa 2 GP
4 11 Sede Univarsitaria Capa 1 SC
Capa 2 RELLENO
Capa 3 OL
5 15 Servicentro Caimanera Capa 1 GC
Capa 2 CL
Capa 3 sedimentos
6 14 Sucursal Bandec Capa1Capa 2 CL
Capa 2 CL-ML
7 10 Terreno de béisbol Capa 1 SC
Capa 2 CL
Capa 3 SM
8 6 Vivienda Zona Deportiva Capa 1 SC
Capa 2 CL
Capa 3 SM
9 5 Vivienda entrada Capa 1 SC
Capa 2 CL
Capa 3 SM
Figure 11: Diagram of the location of the central zone, according to the liquefaction susceptibility forecast map [8].

Citation: Deynier Montero Góngora, Katerin Carcassés Álvarez, Liuska Fernández Diéguez, Yorgenis Maceo Rustán, Jose Luis Urra Abraira. 3d Geotechnical Model of the Soil Susceptible to Liquefaction, In the Central Area of Caimanera, Guantánamo. Adv in Rob & Mech Engin 2(5)- 2020. ARME.MS.ID.000147. DOI: 10.32474/ARME.2020.02.000147.
Volume 2 - Issue 5 Copyrights @ Deynier Montero G, et al.Adv in Rob & Mech Engin
203
The fine content is one of the parameters that define the soil classification; it allows to discriminate between a coarse-grained or fine-grained soil. From the 3D model of the behavior of this parameter, it was possible to define that the University Venue is the area of greatest susceptibility to liquefying taking into account the relatively low fines contents (14%) (Figure 12). The soils with a low liquid limit (<35%) are poorly distributed (Figure 13), mainly in the entry dwellings, Bandec Branch and Servicentro at levels 5, 14, 15 in the southern part of the study sector; suggesting a high susceptibility to liquefaction. According to the criteria of Wang and Brandes, soils with Ll below 32% and low fines content may be susceptible to liquefaction in the event of earthquakes [14,15]. Humidity (W) is a parameter of moderate variation in the city of Caimanera, where values between 16% and 47% predominate (Figure 14). The soils of fluvial and wind deposits, when saturated, have a high probability of being susceptible to liquefaction. The plasticity index (PI) varies remarkably, with a predominance of PI between 3% and 18% (Figure 15). Both variables (W, IP) are used to establish approximations of liquefaction possibilities [13]. The Plasticity Index (<12%) notably influences the liquefaction of soils as observed in the central part of the sector studied (Figure 16).
Figure 12: Distribution of the percentage of fines in the Block Model
Figure 13: Distribution of the liquid limit in the block model.
Figure 14: Distribution of the variable W / Ll in the block model.
Figure 15: Distribution of the IP variable in the Block Model.
Figure 16: Distribution of the plasticity index variable in it Block model
(IP) Plasticity index = liquid limit (Ll) - plastic limit (Lp) <12%
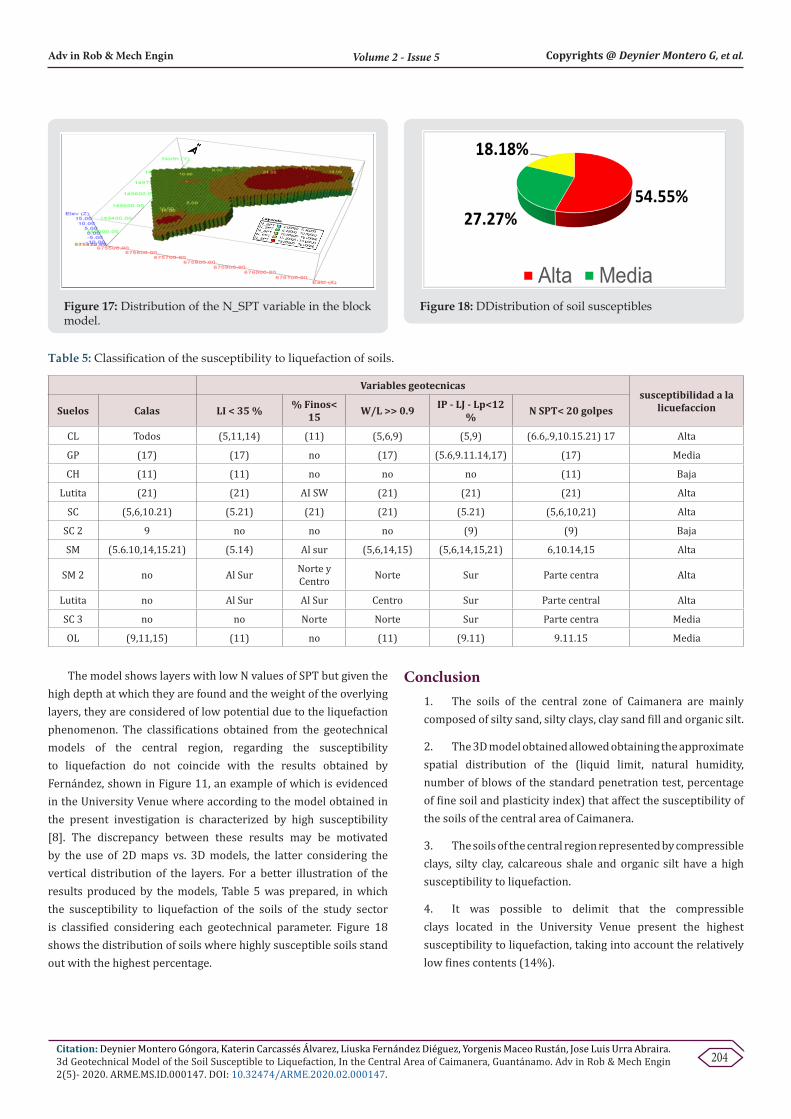
Another of the necessary conditions for liquefaction to take place is that the water table is high, close to the surface, and that the degree of compaction is low, SPT N values below 20 blows. The variable N of SPT in the SW of the study sector presented estimated values greater than 20 blows, which indicates a low probability of the occurrence of the liquefaction phenomenon. Sector W, according to the model, shows the greatest potential zone of occurrence of this phenomenon, where the polyclinic is located (Figure 17).
Citation: Deynier Montero Góngora, Katerin Carcassés Álvarez, Liuska Fernández Diéguez, Yorgenis Maceo Rustán, Jose Luis Urra Abraira. 3d Geotechnical Model of the Soil Susceptible to Liquefaction, In the Central Area of Caimanera, Guantánamo. Adv in Rob & Mech Engin 2(5)- 2020. ARME.MS.ID.000147. DOI: 10.32474/ARME.2020.02.000147.
Volume 2 - Issue 5 Copyrights @ Deynier Montero G, et al.Adv in Rob & Mech Engin
204
Figure 17: Distribution of the N_SPT variable in the block model.
Figure 18: DDistribution of soil susceptibles
Table 5: Classification of the susceptibility to liquefaction of soils.
Variables geotecnicassusceptibilidad a la
licuefaccionSuelos Calas LI < 35 % % Finos< 15 W/L >> 0.9 IP - LJ - Lp<12
% N SPT< 20 golpes
CL Todos (5,11,14) (11) (5,6,9) (5,9) (6.6,.9,10.15.21) 17 Alta
GP (17) (17) no (17) (5.6,9.11.14,17) (17) Media
CH (11) (11) no no no (11) Baja
Lutita (21) (21) AI SW (21) (21) (21) Alta
SC (5,6,10.21) (5.21) (21) (21) (5.21) (5,6,10,21) Alta
SC 2 9 no no no (9) (9) Baja
SM (5.6.10,14,15.21) (5.14) Al sur (5,6,14,15) (5,6,14,15,21) 6,10.14,15 Alta
SM 2 no Al Sur Norte y Centro Norte Sur Parte centra Alta
Lutita no Al Sur Al Sur Centro Sur Parte central Alta
SC 3 no no Norte Norte Sur Parte centra Media
OL (9,11,15) (11) no (11) (9.11) 9.11.15 Media
The model shows layers with low N values of SPT but given the high depth at which they are found and the weight of the overlying layers, they are considered of low potential due to the liquefaction phenomenon. The classifications obtained from the geotechnical models of the central region, regarding the susceptibility to liquefaction do not coincide with the results obtained by Fernández, shown in Figure 11, an example of which is evidenced in the University Venue where according to the model obtained in the present investigation is characterized by high susceptibility [8]. The discrepancy between these results may be motivated by the use of 2D maps vs. 3D models, the latter considering the vertical distribution of the layers. For a better illustration of the results produced by the models, Table 5 was prepared, in which the susceptibility to liquefaction of the soils of the study sector is classified considering each geotechnical parameter. Figure 18 shows the distribution of soils where highly susceptible soils stand out with the highest percentage.
Conclusion1. The soils of the central zone of Caimanera are mainly composed of silty sand, silty clays, clay sand fill and organic silt.
2. The 3D model obtained allowed obtaining the approximate spatial distribution of the (liquid limit, natural humidity, number of blows of the standard penetration test, percentage of fine soil and plasticity index) that affect the susceptibility of the soils of the central area of Caimanera.
3. The soils of the central region represented by compressible clays, silty clay, calcareous shale and organic silt have a high susceptibility to liquefaction.
4. It was possible to delimit that the compressible clays located in the University Venue present the highest susceptibility to liquefaction, taking into account the relatively low fines contents (14%).

Citation: Deynier Montero Góngora, Katerin Carcassés Álvarez, Liuska Fernández Diéguez, Yorgenis Maceo Rustán, Jose Luis Urra Abraira. 3d Geotechnical Model of the Soil Susceptible to Liquefaction, In the Central Area of Caimanera, Guantánamo. Adv in Rob & Mech Engin 2(5)- 2020. ARME.MS.ID.000147. DOI: 10.32474/ARME.2020.02.000147.
Volume 2 - Issue 5 Copyrights @ Deynier Montero G, et al.Adv in Rob & Mech Engin
205
Advances in Robotics & Mechanical Engineering
Assets of Publishing with us
• Global archiving of articles
• Immediate, unrestricted online access
• Rigorous Peer Review Process
• Authors Retain Copyrights
• Unique DOI for all articles
This work is licensed under CreativeCommons Attribution 4.0 License
To Submit Your Article Click Here: Submit Article
DOI: 10.32474/ARME.2020.02.000147
References1. González de Vallejo L, Ferrer M, Ortuño L, Oteo C (2002) Geological
Engineering. Madrid: Pearson Eduaction.
2. Fookes P (1997) The First Glossop Lecture: geology for engineers: the geological model, prediction and performance. Quarterly Journal of Engineering Geology and Hydrogeology 30: 293-424.
3. Ordaz A (2017) Contribution to urban risk management in the city of Pinar del Río through a 3D geological-geotechnical model. Mining and Geology 33: 423-440.
4. Rienzo F, Oreste P, Pelizza S (2008) Subsurface geological-geotechnical modeling to sustain underground civil planning. Engineering Geology 96(3): 187-204.
5. Ordaz A (2013) Evaluation of engineering-geological conditions for forecasting the dynamic response of soils. Case study: City of San Cristóbal, western Cuba. Doctoral thesis, University of Pinar del Río.
6. Chinthaka GA (2015) Evaluation of the expansion potential of the soils in the Hermanos Cruz division. A contribution to urban planning. Thesis University of Pinar del Río.
7. Youd TL, Perkins DM (1978) Mapping of liquefaction induced ground failure potential. J Geotech Engrg Div ASCE 104(4): 433-446.
8. Fernández L (2015) Liquefaction of the soils generated by earthquakes of great magnitude. Caimanera and Santiago de Cuba case study. Moa University Digital.
9. Bandera I (2015) Engineering-geological evaluation of the city of Caimanera. Moa University Digital.
10. Rodríguez M, Machín T (2013) Stratigraphic lexicon of Cuba. Institute of Geology and Paleontology. Havana: National Center for Geological Information.
11. Vidal E (2010) Calculation of the hydraulic conductivity of aquifers from their electrical resistivity. Practical validation Moa.
12. Plá M, Arencivia E (2005) Caimanera pluvial drainage. Research Geological Engineer, Santiago de Cuba.
13. Seed RB, Cetin KO, Moss RE, Kammerer AM, Wu J, et al. (2003) Recent advances in soil liquefaction engineering: a unified and consistent framework p. 1-71.
14. Wang W (1979) Some Findings in Soil Liquefaction. Chinese J Geot Eng 2(3): 55-63.
15. Brandes HG (2003) Geotechnical and Foundation Aspects. Handbook Honolulu, Haway.