Embed Size (px)
Citation preview
398 JOURNAL OF DISPLAY TECHNOLOGY, VOL. 4, NO. 4, DECEMBER 2008
Comparing Signal Detection Between NovelHigh-Luminance HDR and Standard
Medical LCD DisplaysM. Dylan Tisdall, Gerwin Damberg, Paul Wighton, Nhi Nguyen, Yan Tan, M. Stella Atkins, Hiroe Li, and
Helge Seetzen
Abstract—DICOM specifies that digital data values should belinearly mapped to just-noticable differences (JNDs) in luminance.Increasing the number of JNDs available requires increasing thedisplay’s dynamic range. However, operating over too wide a rangemay cause human observers to miss contrast in dark regions due toadaptation to bright areas or, alternatively, miss edges in bright re-gions due to scattering in the eye. Dolby Inc.’s high dynamic range(HDR) LCD display has a maximum luminance over 2000 cd/m�;bright enough to produce significant in-eye scatter. The displaycombines a spatially variable backlight producing a low-resolution8-bit “backlight image” with a high-resolution 8-bit LCD panel,approximating a 16-bit greyscale display. Alternatively, by holdingthe backlight constant at 800 cd/m�, a standard medical LCD dis-play can be simulated.
We used two-alternative forced choice (2AFC) signal-detectionexperiments to quantify display quality. We explored whether thefull-power HDR display’s optical characteristics (scattering andlow resolution backlight) have a negative effect on signal detectionin medical images compared with a standard LCD. We used 8-bittest images derived from high-field MRI data combined with syn-thetic targets and synthetic Rician noise.
We suggest signal detection performance with the HDR displayis comparable to a standard medical LCD.
Index Terms—High dynamic range, high luminicense, medicalstudies, user studies.
I. INTRODUCTION
G REYSCALE medical image displays rely on the ob-server’s sensitivity to spatially varying luminance in
order to communicate a 2D array of digital values. Givenan liquid crystal display (LCD) display that can produce afinite set of greyscale luminance values, the DICOM standardformalizes a function for selecting the appropriate luminancefor each pixel to best represent some digital value in a medicalimage [1]. The core principle behind the choices suggested bythe DICOM standard is that equal differences in digital valuesshould be represented by equal perceptual differences. Thus,it proposes units of just-noticeable differences (JNDs) as theperceptual equivalent of the digital data’s units. A mappingbetween luminance and JNDs is established in the DICOM
Manuscript received February 01, 2008; revised March 28, 2008. First pub-lished August 15, 2008; current version published November 19, 2008.
M. D. Tisdall, P. Wighton, N. Nguyen, Y. Tan, and M. S. Atkins are withthe School of Computing Science, Simon Fraser University, Burnaby, BC V5A1S6, Canada (e-mail: [email protected]).
G. Damberg, H. Li, and H. Seetzen are with Dolby Inc., Vancouver, BC V5M4X7, Canada.
Digital Object Identifier 10.1109/JDT.2008.2001198
standard based on previous human experiments. Using thisrelationship, one can convert digital values into luminancesby ensuring that equal steps in the digital domain are mappedto equal steps in the JND space and determining the relevantluminances from the desired JND values.
In practice, LCD-based displays can achieve a finite rangeof luminances. The ratio of the maximum to minimum lumi-nances is generally referred to as the display’s contrast ratio.Further they have limited discrete luminance values inside thisrange that are available for display. The base-2 logarithm of thenumber of discrete luminance settings is called the display’sgreyscale bit depth. The difference between minimum and max-imum luminance provides an upper limit on the number of JNDsthat a human could perceive on a perfectly controllable display.The bit depth determines how well we can approximate thisideal display. Previous work has suggested that, for regular med-ical displays with maximum and minimum luminances of ap-proximately 900 cd/m and 1.5 cd/m respectively, there is littlevalue in producing monitors with more then 12-bit greyscale bitdepth [2].
Dolby has demonstrated a new high-dynamic range (HDR)LCD-based technology that allows the minimum luminance ofthe display to be zero, producing an effectively infinite contrastratio. Medical LCD displays normally use a uniform backlightthat provides approximately equal illumination to the back ofthe LCD panel at every pixel. The LCD panel is then used tofilter this light. However, current LCD technology cannot blockall the light, even when the LCD is set to full black. Thus,on a normal LCD the minimum luminance level is some valuegreater than zero. The new Dolby display technology uses a spa-tially variable backlight to illuminate a standard LCD panel. Thespatial variability of the backlight allows it be turned off com-pletely in regions where the image should be black, making forregions with effectively zero luminance. Furthermore, the Dolbytechnology relies on high-power light-emitting diodes (LEDs)for the backlight, making the maximum luminance of displaysin the thousands of cd/m .
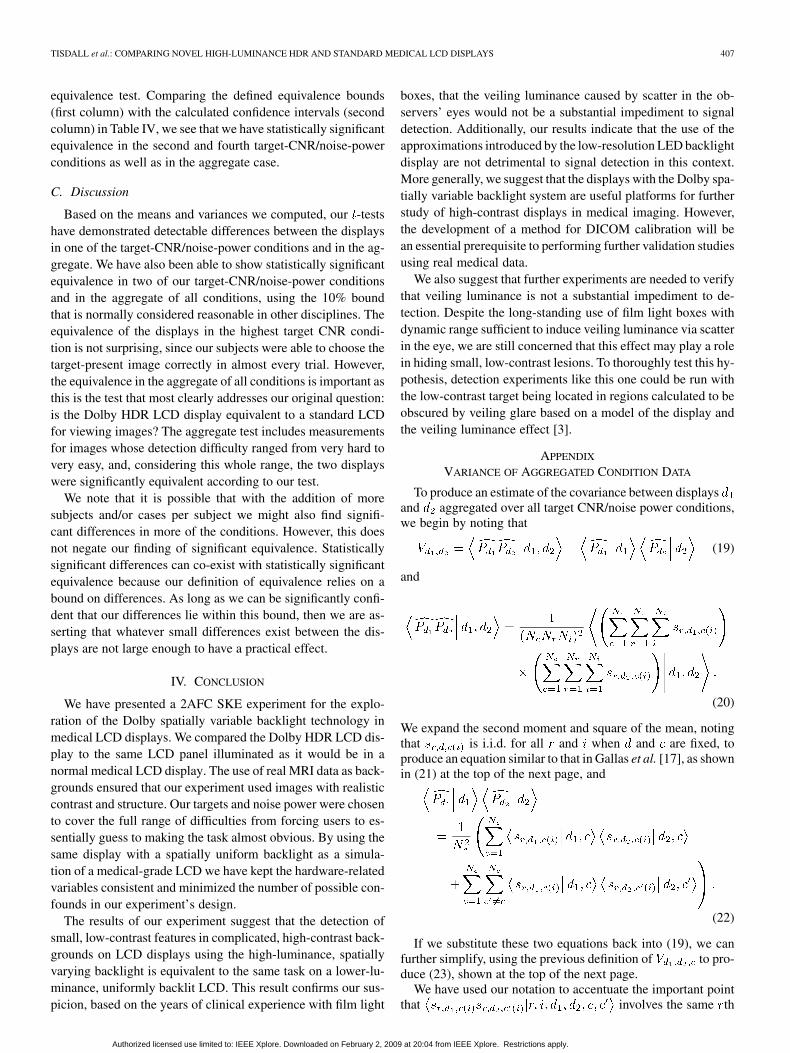
However, the Dolby HDR LCD also introduces some com-promises compared to a standard LCD. The spatially variablebacklight system cannot be controlled individually at eachpixel in the image. Instead, a low-resolution array of whitebacklight LEDs is used and the illumination behind the LCD atany location is the sum of the contributions from all the LEDswhose point spread functions (PSFs) extend to that location(see Fig. 1). Thus, while the backlight LEDs each individually
1551-319X/$25.00 © 2008 IEEE
Authorized licensed use limited to: IEEE Xplore. Downloaded on February 2, 2009 at 20:04 from IEEE Xplore. Restrictions apply.
TISDALL et al.: COMPARING NOVEL HIGH-LUMINANCE HDR AND STANDARD MEDICAL LCD DISPLAYS 399
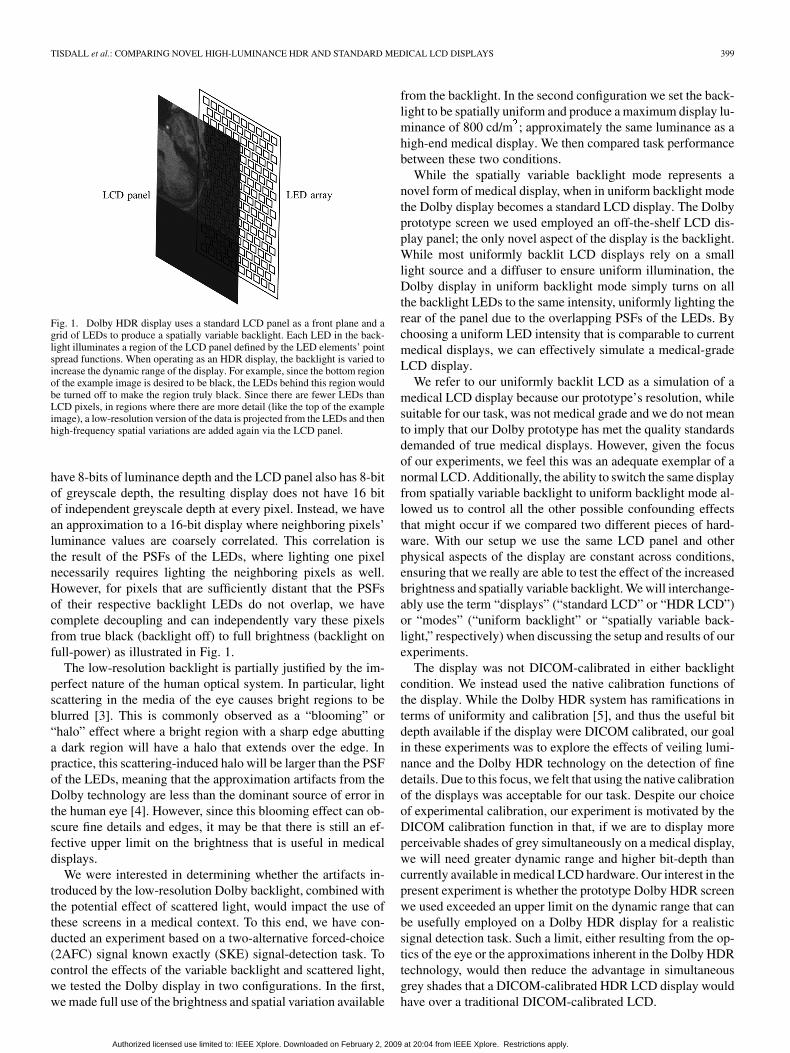
Fig. 1. Dolby HDR display uses a standard LCD panel as a front plane and agrid of LEDs to produce a spatially variable backlight. Each LED in the back-light illuminates a region of the LCD panel defined by the LED elements’ pointspread functions. When operating as an HDR display, the backlight is varied toincrease the dynamic range of the display. For example, since the bottom regionof the example image is desired to be black, the LEDs behind this region wouldbe turned off to make the region truly black. Since there are fewer LEDs thanLCD pixels, in regions where there are more detail (like the top of the exampleimage), a low-resolution version of the data is projected from the LEDs and thenhigh-frequency spatial variations are added again via the LCD panel.
have 8-bits of luminance depth and the LCD panel also has 8-bitof greyscale depth, the resulting display does not have 16 bitof independent greyscale depth at every pixel. Instead, we havean approximation to a 16-bit display where neighboring pixels’luminance values are coarsely correlated. This correlation isthe result of the PSFs of the LEDs, where lighting one pixelnecessarily requires lighting the neighboring pixels as well.However, for pixels that are sufficiently distant that the PSFsof their respective backlight LEDs do not overlap, we havecomplete decoupling and can independently vary these pixelsfrom true black (backlight off) to full brightness (backlight onfull-power) as illustrated in Fig. 1.
The low-resolution backlight is partially justified by the im-perfect nature of the human optical system. In particular, lightscattering in the media of the eye causes bright regions to beblurred [3]. This is commonly observed as a “blooming” or“halo” effect where a bright region with a sharp edge abuttinga dark region will have a halo that extends over the edge. Inpractice, this scattering-induced halo will be larger than the PSFof the LEDs, meaning that the approximation artifacts from theDolby technology are less than the dominant source of error inthe human eye [4]. However, since this blooming effect can ob-scure fine details and edges, it may be that there is still an ef-fective upper limit on the brightness that is useful in medicaldisplays.
We were interested in determining whether the artifacts in-troduced by the low-resolution Dolby backlight, combined withthe potential effect of scattered light, would impact the use ofthese screens in a medical context. To this end, we have con-ducted an experiment based on a two-alternative forced-choice(2AFC) signal known exactly (SKE) signal-detection task. Tocontrol the effects of the variable backlight and scattered light,we tested the Dolby display in two configurations. In the first,we made full use of the brightness and spatial variation available
from the backlight. In the second configuration we set the back-light to be spatially uniform and produce a maximum display lu-minance of 800 cd/m ; approximately the same luminance as ahigh-end medical display. We then compared task performancebetween these two conditions.
While the spatially variable backlight mode represents anovel form of medical display, when in uniform backlight modethe Dolby display becomes a standard LCD display. The Dolbyprototype screen we used employed an off-the-shelf LCD dis-play panel; the only novel aspect of the display is the backlight.While most uniformly backlit LCD displays rely on a smalllight source and a diffuser to ensure uniform illumination, theDolby display in uniform backlight mode simply turns on allthe backlight LEDs to the same intensity, uniformly lighting therear of the panel due to the overlapping PSFs of the LEDs. Bychoosing a uniform LED intensity that is comparable to currentmedical displays, we can effectively simulate a medical-gradeLCD display.
We refer to our uniformly backlit LCD as a simulation of amedical LCD display because our prototype’s resolution, whilesuitable for our task, was not medical grade and we do not meanto imply that our Dolby prototype has met the quality standardsdemanded of true medical displays. However, given the focusof our experiments, we feel this was an adequate exemplar of anormal LCD. Additionally, the ability to switch the same displayfrom spatially variable backlight to uniform backlight mode al-lowed us to control all the other possible confounding effectsthat might occur if we compared two different pieces of hard-ware. With our setup we use the same LCD panel and otherphysical aspects of the display are constant across conditions,ensuring that we really are able to test the effect of the increasedbrightness and spatially variable backlight. We will interchange-ably use the term “displays” (“standard LCD” or “HDR LCD”)or “modes” (“uniform backlight” or “spatially variable back-light,” respectively) when discussing the setup and results of ourexperiments.
The display was not DICOM-calibrated in either backlightcondition. We instead used the native calibration functions ofthe display. While the Dolby HDR system has ramifications interms of uniformity and calibration [5], and thus the useful bitdepth available if the display were DICOM calibrated, our goalin these experiments was to explore the effects of veiling lumi-nance and the Dolby HDR technology on the detection of finedetails. Due to this focus, we felt that using the native calibrationof the displays was acceptable for our task. Despite our choiceof experimental calibration, our experiment is motivated by theDICOM calibration function in that, if we are to display moreperceivable shades of grey simultaneously on a medical display,we will need greater dynamic range and higher bit-depth thancurrently available in medical LCD hardware. Our interest in thepresent experiment is whether the prototype Dolby HDR screenwe used exceeded an upper limit on the dynamic range that canbe usefully employed on a Dolby HDR display for a realisticsignal detection task. Such a limit, either resulting from the op-tics of the eye or the approximations inherent in the Dolby HDRtechnology, would then reduce the advantage in simultaneousgrey shades that a DICOM-calibrated HDR LCD display wouldhave over a traditional DICOM-calibrated LCD.
Authorized licensed use limited to: IEEE Xplore. Downloaded on February 2, 2009 at 20:04 from IEEE Xplore. Restrictions apply.
400 JOURNAL OF DISPLAY TECHNOLOGY, VOL. 4, NO. 4, DECEMBER 2008
In Section II we will describe the process used to produce ourstimulus images, provide a description of the 2AFC task that oursubjects performed, and provide more details about the displayand how we used it. In Section III we present and analyze theresults of our experiments, and discuss their implications foruse of the Dolby display. Finally, in Section IV we present ourconclusions.
II. METHODS AND MATERIALS
A. Stimulus Images
Our stimulus images were generated using a similar method-ology to previous work on the evaluation of MRI reconstruction[6]. Our goal in using anatomical MRI backgrounds was notto simulate a realistic pathology, but instead to provide a real-istic background that stimulates the contrast sensitivity of theobserver in the same way a real medical image would. This pro-vides a visual distraction effect similar to that of real medicalimages.
We began with several 16-bit magnitude-reconstructed 3Dinversion recovery head MRI volumes of healthy volunteersacquired on a Philips Gyroscan Intera scanner. The volumeswere sliced along the three major axes to produce a corpusof full-head images. From the full-size images, 128 128pixel images were constructed along the three major axes byselecting 128 128 pixel regions randomly from the full-sizeimages. Pixel values were then normalized to the range (0,1)to ensure consistency between images. To verify that our smallimages contained anatomy in the central part of the image,we computed the average intensity in the central 64 64 pixelsub image and ensured it was above 50% of the maximumintensity—well above the value that would be expected forpure noise. Images that were over the threshold were kept asbackgrounds.
Our backgrounds were randomly divided into target-presentand target-absent sets. Images in the target-present set weresummed with an anti-aliased circular target signal defined bythe function
ififotherwise
(1)where is a 2D coordinate in image space, is the amplitudeof the target signal, is the index of the image center, isthe Euclidean norm, and is the radius of the feature. Locationcoordinates and and radii are specified in pixels. We set
which was approximately equivalent to a 6 mmfeature in the anatomy.
To simulate Rician-distributed thermal MRI noise [7] inour target-present and target-absent images, we produced tworandom samples from a Gaussian distribution for eachpixel in each of our synthetic images. Let be the intensityof a given anatomical background image at location ,be the intensity of the target signal at location , andand be the two samples from the Gaussian distribution
at location . We can then write the final target-present imagewith simulated thermal noise as
(2)
and target-absent images are simulated with
(3)
When adding signals and noise, we subdivided our im-ages into four conditions representing four different targetcontrast-to-noise ratios (CNRs). These four CNRs definefour different levels of contrast between the target and what-ever anatomical background it was summed with, relativeto the noise power. Using the variables specified above,these four conditions were ,
, , andwhich give target CNRs of approx-
imately , , ,. Naturally, we expect that targets with lower
target CNRs will be harder to detect as they will blend in morewith the background.
It is important to distinguish these CNRs from the pixel SNRsof the targets in the final images. The target pixel SNRs wereusually far higher than indicated by these target CNR values be-cause the target’s intensity was summed with the intensity ofthe underlying anatomical background. Of course, while sum-ming the target with a bright background will increase pixelSNR at these locations, we do not expect that this will improvedetectability. As noted before, the background is expected tobe a distracter. However, we highlight that the final pixel SNRis substantially higher than the target CNR in order to assurethose familiar with peak SNRs in MRI data that we were notproducing synthetic data with unrealistically low SNRs.
Finally, we note that there is some real thermal noise alreadypresent in our background images . However, because ofthe quality of the scans used, this real thermal noise’s varianceis far less than that of our simulated thermal noise, and thus wedo not expect it had any impact on the final results.
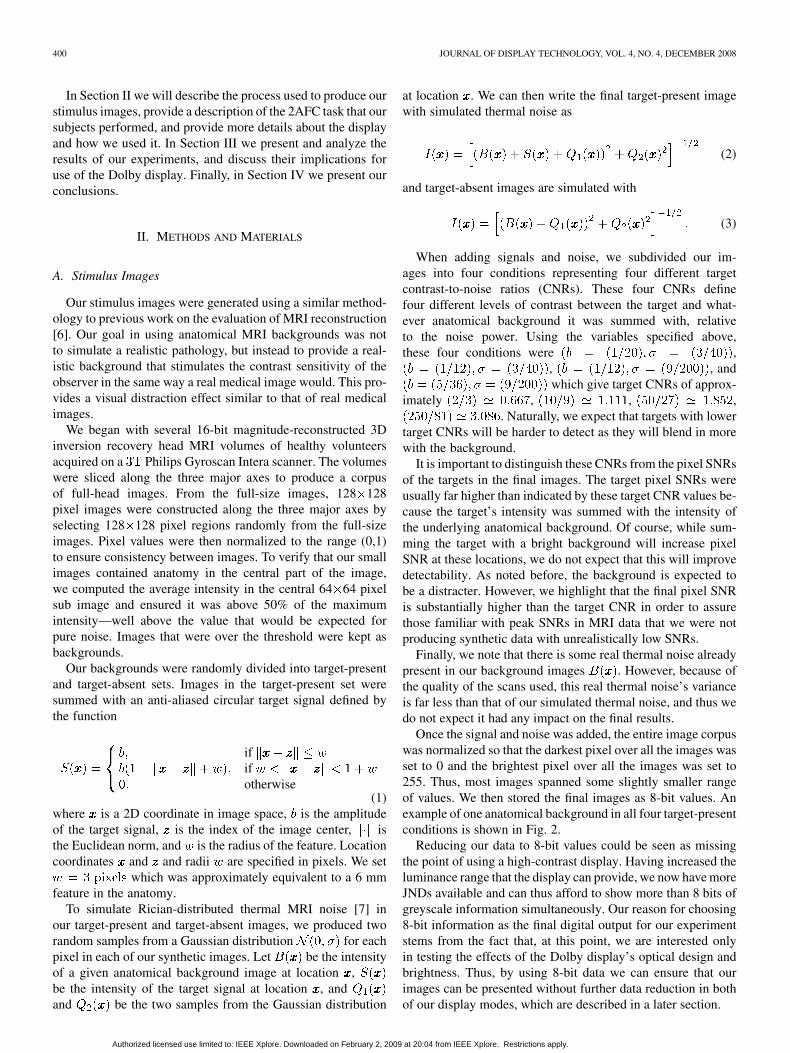
Once the signal and noise was added, the entire image corpuswas normalized so that the darkest pixel over all the images wasset to 0 and the brightest pixel over all the images was set to255. Thus, most images spanned some slightly smaller rangeof values. We then stored the final images as 8-bit values. Anexample of one anatomical background in all four target-presentconditions is shown in Fig. 2.
Reducing our data to 8-bit values could be seen as missingthe point of using a high-contrast display. Having increased theluminance range that the display can provide, we now have moreJNDs available and can thus afford to show more than 8 bits ofgreyscale information simultaneously. Our reason for choosing8-bit information as the final digital output for our experimentstems from the fact that, at this point, we are interested onlyin testing the effects of the Dolby display’s optical design andbrightness. Thus, by using 8-bit data we can ensure that ourimages can be presented without further data reduction in bothof our display modes, which are described in a later section.
Authorized licensed use limited to: IEEE Xplore. Downloaded on February 2, 2009 at 20:04 from IEEE Xplore. Restrictions apply.
TISDALL et al.: COMPARING NOVEL HIGH-LUMINANCE HDR AND STANDARD MEDICAL LCD DISPLAYS 401
Fig. 2. Example of one anatomical background in all four target-present con-ditions. The target signal is the small circle visible just under the cortical folds,in the center of the images. Note that, unlike what is depicted in this figure, inour experiment any given background was used in only one target-CNR/noise-power condition.
B. 2AFC Task
Signal-detection tasks have a long history in measuring thequality of imaging systems, including the evaluation of med-ical imaging modalities and image reconstruction algorithms[6], [8]–[10]. Our particular experiment structure — the 2AFCexperiment — has also been used previously in the evaluationof medical LCD displays [11].
Our seventeen volunteers were all non-radiologists with noprevious medical image reading experience. All subjects hadfully corrected vision and were graduate students or universitygraduates. The age range (early-20s to mid-40s) was well belowthe age significance threshold in the CIE General DisabilityGlare Equation [3] indicating that the age variation should not bea significant factor in the quantity of scatter in their eye, and thustheir perception of the “blooming” effect. Similarly, eye color ofthe subjects was not an important factor as the experiment wassetup to have viewing angles smaller than the CIE threshold of30 deg at which eye color becomes significant [3]. The entire ex-periment was conducted in a fully darkened room, with the dis-play being the only source of illumination. Subjects were seatedon-axis both vertically and horizontally with the display and ap-proximately 1.4 m from the screen—approximately three timesthe height of the display away from the screen as this is consid-ered the optimal distance for HDTV viewing and our prototypescreen was based on a restricted region of an HDTV screen.
The display was shrouded in heavy black cloth to cover re-flected light from the frame and ensure that participants sawonly the portion of the screen containing the interface. Insideof this region, two images were displayed in a vertical orienta-tion, with a gap between them in which we displayed the targetfeature for the trial. Images and target features were scaled by afactor of three to produce a 384 384-pixel image and a targetwith a radius of 10 pixels on the actual display. Each image
measured approximately 16.4 cm across and subtended approx-imately 6.8 in the observers’ visual field. The target featurein the center region was displayed on a black background withamplitude defined by , and thus varied from trial to trial de-pending on the condition being presented. The target feature’sdisplayed diameter was approximately 9 mm and subtended0.37 in the observers’ visual field. This display method allowedusers to see the same contrast between the target and black back-ground as they would see between the target and anatomy inthe candidate images. Note, however, that this means the am-plitude of the target was substantially lower in the center regionthan in the candidate images, since the target’s amplitude in thetarget-present image would depend on the intensity of the un-derlying anatomy. We felt that presenting the target’s contrastwas more important than its absolute intensity, since the inten-sity would depend substantially on which image it was summedwith, while the target CNR, and thus contrast, was the exper-imental variable being held constant across all trials in eachcondition.
In each trial the two images were chosen from the sametarget amplitude and noise power condition so that one wastarget-present and the other target-absent. Due to the largenumber of images produced from our subsampling describedin Section II-A, and the fact that our images were being chosenwithout replacement, we treated this process as independentsampling from paired target-present and target-absent distri-butions, as is common in 2AFC experiments [6], [11]–[13].In our experiment, the distributions in the pair were definedby the target amplitude, the noise power, and the backlightmode being chosen, giving a total of 8 distribution-pairs (4target-CNR/noise-power combinations and two display modes).Note that this means different images were used in each ofthe target-CNR/noise-power conditions and so every trial on agiven display was independently generated and observers saw4 (conditions) 32 (trials) 2 (target-present/-absent)different backgrounds on each display.
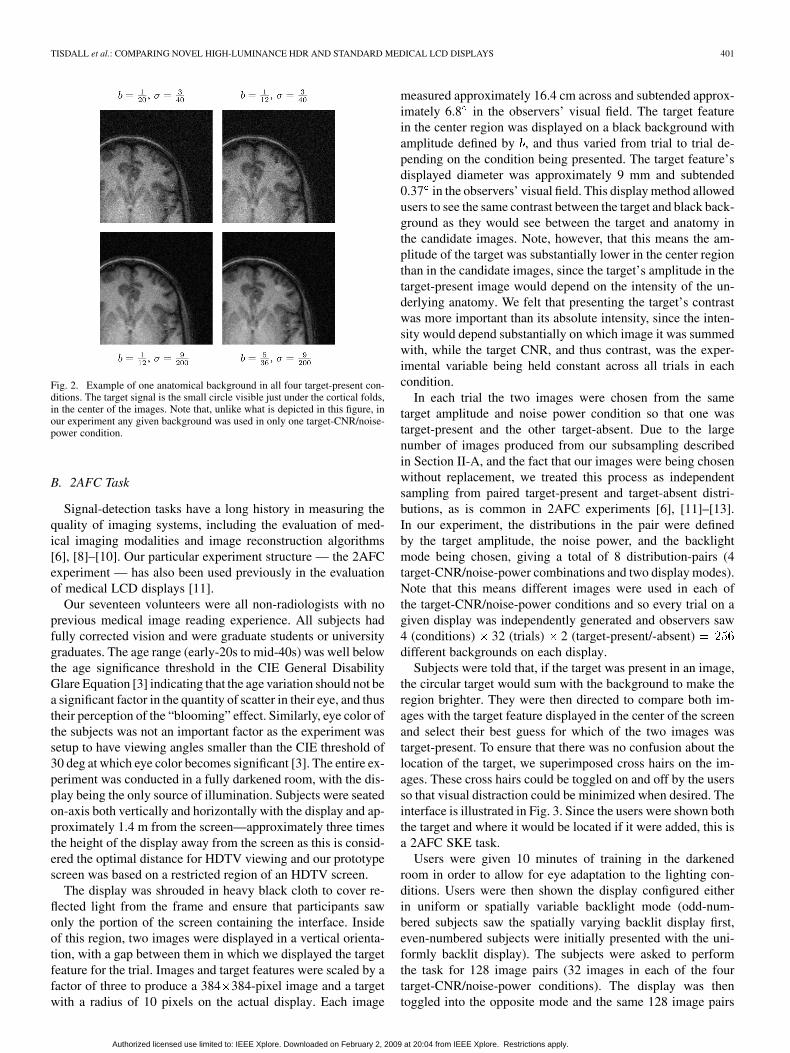
Subjects were told that, if the target was present in an image,the circular target would sum with the background to make theregion brighter. They were then directed to compare both im-ages with the target feature displayed in the center of the screenand select their best guess for which of the two images wastarget-present. To ensure that there was no confusion about thelocation of the target, we superimposed cross hairs on the im-ages. These cross hairs could be toggled on and off by the usersso that visual distraction could be minimized when desired. Theinterface is illustrated in Fig. 3. Since the users were shown boththe target and where it would be located if it were added, this isa 2AFC SKE task.
Users were given 10 minutes of training in the darkenedroom in order to allow for eye adaptation to the lighting con-ditions. Users were then shown the display configured eitherin uniform or spatially variable backlight mode (odd-num-bered subjects saw the spatially varying backlit display first,even-numbered subjects were initially presented with the uni-formly backlit display). The subjects were asked to performthe task for 128 image pairs (32 images in each of the fourtarget-CNR/noise-power conditions). The display was thentoggled into the opposite mode and the same 128 image pairs
Authorized licensed use limited to: IEEE Xplore. Downloaded on February 2, 2009 at 20:04 from IEEE Xplore. Restrictions apply.
402 JOURNAL OF DISPLAY TECHNOLOGY, VOL. 4, NO. 4, DECEMBER 2008
Fig. 3. Example of the 540�1080 pixel user interface. In this image cross hairshave been turned on to reduce localization errors. The target feature is locatedin the top image in the center of the cross hairs.
were repeated. In each of the two display conditions the orderof the image pairs was randomized for every subject.
C. Dolby Display
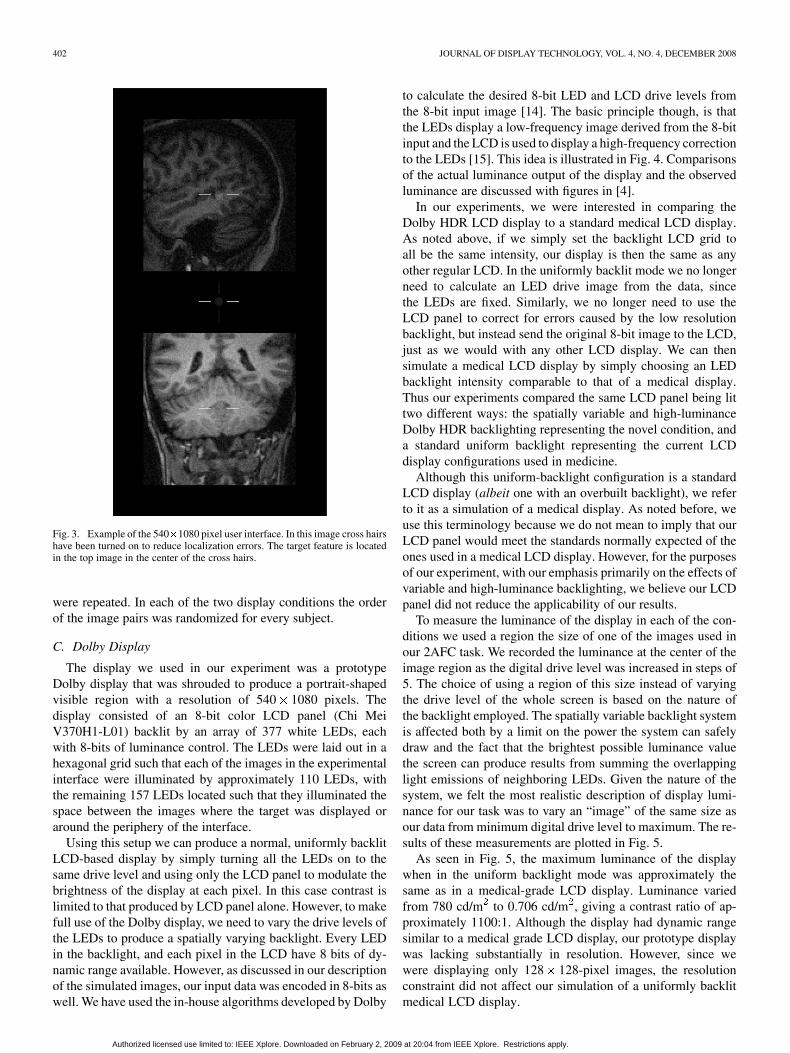
The display we used in our experiment was a prototypeDolby display that was shrouded to produce a portrait-shapedvisible region with a resolution of 540 1080 pixels. Thedisplay consisted of an 8-bit color LCD panel (Chi MeiV370H1-L01) backlit by an array of 377 white LEDs, eachwith 8-bits of luminance control. The LEDs were laid out in ahexagonal grid such that each of the images in the experimentalinterface were illuminated by approximately 110 LEDs, withthe remaining 157 LEDs located such that they illuminated thespace between the images where the target was displayed oraround the periphery of the interface.
Using this setup we can produce a normal, uniformly backlitLCD-based display by simply turning all the LEDs on to thesame drive level and using only the LCD panel to modulate thebrightness of the display at each pixel. In this case contrast islimited to that produced by LCD panel alone. However, to makefull use of the Dolby display, we need to vary the drive levels ofthe LEDs to produce a spatially varying backlight. Every LEDin the backlight, and each pixel in the LCD have 8 bits of dy-namic range available. However, as discussed in our descriptionof the simulated images, our input data was encoded in 8-bits aswell. We have used the in-house algorithms developed by Dolby
to calculate the desired 8-bit LED and LCD drive levels fromthe 8-bit input image [14]. The basic principle though, is thatthe LEDs display a low-frequency image derived from the 8-bitinput and the LCD is used to display a high-frequency correctionto the LEDs [15]. This idea is illustrated in Fig. 4. Comparisonsof the actual luminance output of the display and the observedluminance are discussed with figures in [4].
In our experiments, we were interested in comparing theDolby HDR LCD display to a standard medical LCD display.As noted above, if we simply set the backlight LCD grid toall be the same intensity, our display is then the same as anyother regular LCD. In the uniformly backlit mode we no longerneed to calculate an LED drive image from the data, sincethe LEDs are fixed. Similarly, we no longer need to use theLCD panel to correct for errors caused by the low resolutionbacklight, but instead send the original 8-bit image to the LCD,just as we would with any other LCD display. We can thensimulate a medical LCD display by simply choosing an LEDbacklight intensity comparable to that of a medical display.Thus our experiments compared the same LCD panel being littwo different ways: the spatially variable and high-luminanceDolby HDR backlighting representing the novel condition, anda standard uniform backlight representing the current LCDdisplay configurations used in medicine.
Although this uniform-backlight configuration is a standardLCD display (albeit one with an overbuilt backlight), we referto it as a simulation of a medical display. As noted before, weuse this terminology because we do not mean to imply that ourLCD panel would meet the standards normally expected of theones used in a medical LCD display. However, for the purposesof our experiment, with our emphasis primarily on the effects ofvariable and high-luminance backlighting, we believe our LCDpanel did not reduce the applicability of our results.
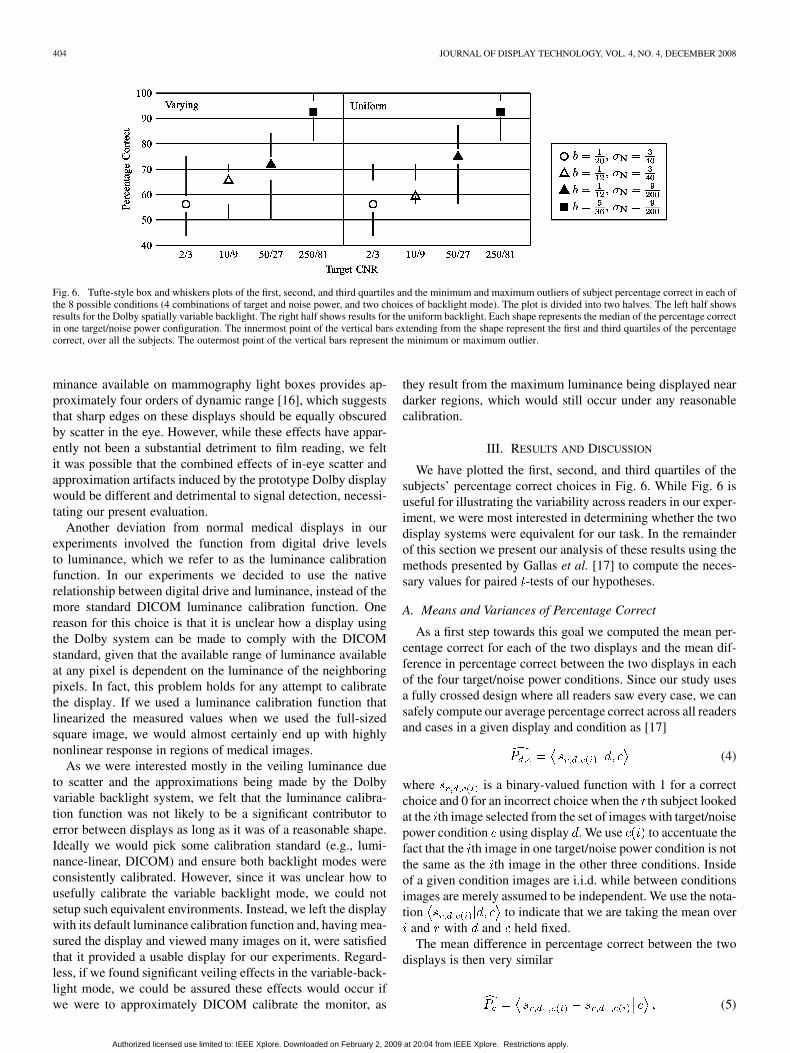
To measure the luminance of the display in each of the con-ditions we used a region the size of one of the images used inour 2AFC task. We recorded the luminance at the center of theimage region as the digital drive level was increased in steps of5. The choice of using a region of this size instead of varyingthe drive level of the whole screen is based on the nature ofthe backlight employed. The spatially variable backlight systemis affected both by a limit on the power the system can safelydraw and the fact that the brightest possible luminance valuethe screen can produce results from summing the overlappinglight emissions of neighboring LEDs. Given the nature of thesystem, we felt the most realistic description of display lumi-nance for our task was to vary an “image” of the same size asour data from minimum digital drive level to maximum. The re-sults of these measurements are plotted in Fig. 5.
As seen in Fig. 5, the maximum luminance of the displaywhen in the uniform backlight mode was approximately thesame as in a medical-grade LCD display. Luminance variedfrom 780 cd/m to 0.706 cd/m , giving a contrast ratio of ap-proximately 1100:1. Although the display had dynamic rangesimilar to a medical grade LCD display, our prototype displaywas lacking substantially in resolution. However, since wewere displaying only 128 128-pixel images, the resolutionconstraint did not affect our simulation of a uniformly backlitmedical LCD display.
Authorized licensed use limited to: IEEE Xplore. Downloaded on February 2, 2009 at 20:04 from IEEE Xplore. Restrictions apply.
TISDALL et al.: COMPARING NOVEL HIGH-LUMINANCE HDR AND STANDARD MEDICAL LCD DISPLAYS 403
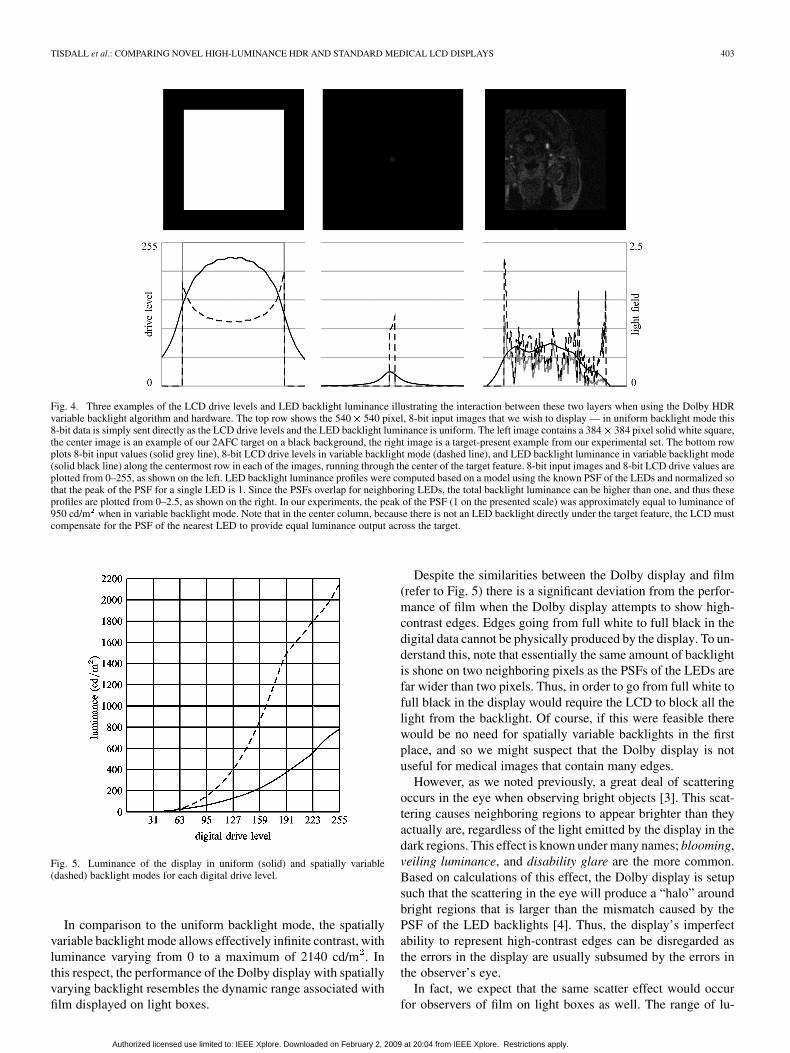
Fig. 4. Three examples of the LCD drive levels and LED backlight luminance illustrating the interaction between these two layers when using the Dolby HDRvariable backlight algorithm and hardware. The top row shows the 540� 540 pixel, 8-bit input images that we wish to display — in uniform backlight mode this8-bit data is simply sent directly as the LCD drive levels and the LED backlight luminance is uniform. The left image contains a 384� 384 pixel solid white square,the center image is an example of our 2AFC target on a black background, the right image is a target-present example from our experimental set. The bottom rowplots 8-bit input values (solid grey line), 8-bit LCD drive levels in variable backlight mode (dashed line), and LED backlight luminance in variable backlight mode(solid black line) along the centermost row in each of the images, running through the center of the target feature. 8-bit input images and 8-bit LCD drive values areplotted from 0–255, as shown on the left. LED backlight luminance profiles were computed based on a model using the known PSF of the LEDs and normalized sothat the peak of the PSF for a single LED is 1. Since the PSFs overlap for neighboring LEDs, the total backlight luminance can be higher than one, and thus theseprofiles are plotted from 0–2.5, as shown on the right. In our experiments, the peak of the PSF (1 on the presented scale) was approximately equal to luminance of950 cd/m when in variable backlight mode. Note that in the center column, because there is not an LED backlight directly under the target feature, the LCD mustcompensate for the PSF of the nearest LED to provide equal luminance output across the target.
Fig. 5. Luminance of the display in uniform (solid) and spatially variable(dashed) backlight modes for each digital drive level.
In comparison to the uniform backlight mode, the spatiallyvariable backlight mode allows effectively infinite contrast, withluminance varying from 0 to a maximum of 2140 cd/m . Inthis respect, the performance of the Dolby display with spatiallyvarying backlight resembles the dynamic range associated withfilm displayed on light boxes.
Despite the similarities between the Dolby display and film(refer to Fig. 5) there is a significant deviation from the perfor-mance of film when the Dolby display attempts to show high-contrast edges. Edges going from full white to full black in thedigital data cannot be physically produced by the display. To un-derstand this, note that essentially the same amount of backlightis shone on two neighboring pixels as the PSFs of the LEDs arefar wider than two pixels. Thus, in order to go from full white tofull black in the display would require the LCD to block all thelight from the backlight. Of course, if this were feasible therewould be no need for spatially variable backlights in the firstplace, and so we might suspect that the Dolby display is notuseful for medical images that contain many edges.
However, as we noted previously, a great deal of scatteringoccurs in the eye when observing bright objects [3]. This scat-tering causes neighboring regions to appear brighter than theyactually are, regardless of the light emitted by the display in thedark regions. This effect is known under many names; blooming,veiling luminance, and disability glare are the more common.Based on calculations of this effect, the Dolby display is setupsuch that the scattering in the eye will produce a “halo” aroundbright regions that is larger than the mismatch caused by thePSF of the LED backlights [4]. Thus, the display’s imperfectability to represent high-contrast edges can be disregarded asthe errors in the display are usually subsumed by the errors inthe observer’s eye.
In fact, we expect that the same scatter effect would occurfor observers of film on light boxes as well. The range of lu-
Authorized licensed use limited to: IEEE Xplore. Downloaded on February 2, 2009 at 20:04 from IEEE Xplore. Restrictions apply.
404 JOURNAL OF DISPLAY TECHNOLOGY, VOL. 4, NO. 4, DECEMBER 2008
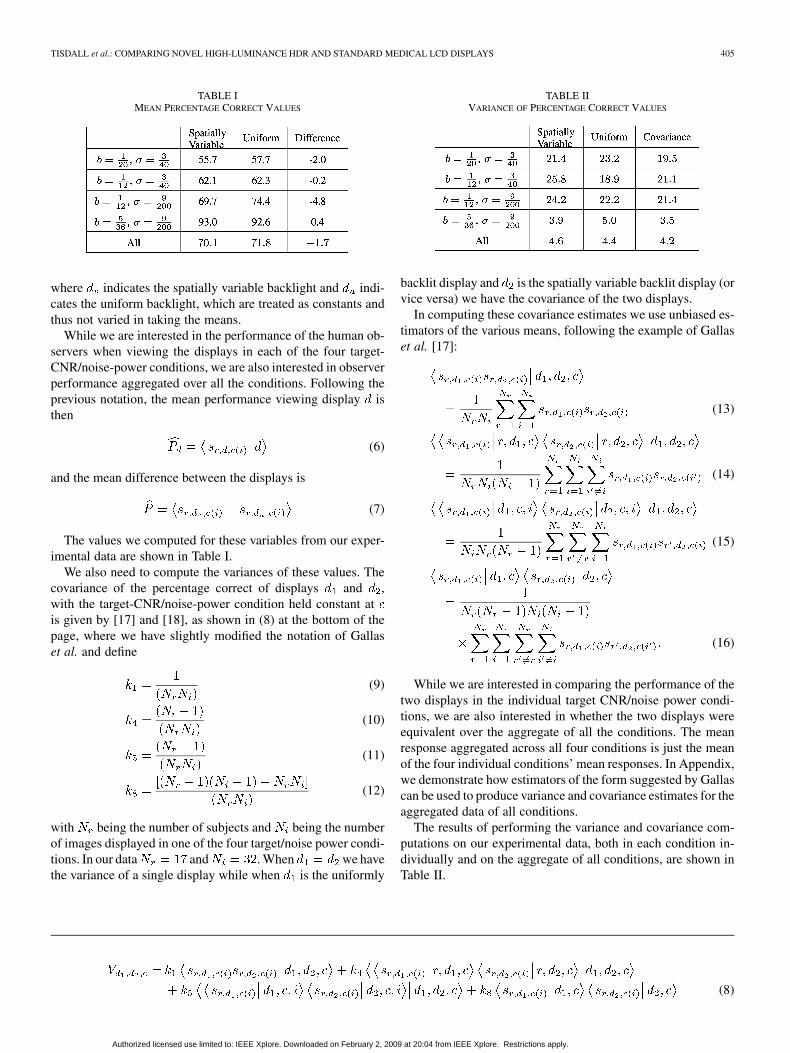
Fig. 6. Tufte-style box and whiskers plots of the first, second, and third quartiles and the minimum and maximum outliers of subject percentage correct in each ofthe 8 possible conditions (4 combinations of target and noise power, and two choices of backlight mode). The plot is divided into two halves. The left half showsresults for the Dolby spatially variable backlight. The right half shows results for the uniform backlight. Each shape represents the median of the percentage correctin one target/noise power configuration. The innermost point of the vertical bars extending from the shape represent the first and third quartiles of the percentagecorrect, over all the subjects. The outermost point of the vertical bars represent the minimum or maximum outlier.
minance available on mammography light boxes provides ap-proximately four orders of dynamic range [16], which suggeststhat sharp edges on these displays should be equally obscuredby scatter in the eye. However, while these effects have appar-ently not been a substantial detriment to film reading, we feltit was possible that the combined effects of in-eye scatter andapproximation artifacts induced by the prototype Dolby displaywould be different and detrimental to signal detection, necessi-tating our present evaluation.
Another deviation from normal medical displays in ourexperiments involved the function from digital drive levelsto luminance, which we refer to as the luminance calibrationfunction. In our experiments we decided to use the nativerelationship between digital drive and luminance, instead of themore standard DICOM luminance calibration function. Onereason for this choice is that it is unclear how a display usingthe Dolby system can be made to comply with the DICOMstandard, given that the available range of luminance availableat any pixel is dependent on the luminance of the neighboringpixels. In fact, this problem holds for any attempt to calibratethe display. If we used a luminance calibration function thatlinearized the measured values when we used the full-sizedsquare image, we would almost certainly end up with highlynonlinear response in regions of medical images.
As we were interested mostly in the veiling luminance dueto scatter and the approximations being made by the Dolbyvariable backlight system, we felt that the luminance calibra-tion function was not likely to be a significant contributor toerror between displays as long as it was of a reasonable shape.Ideally we would pick some calibration standard (e.g., lumi-nance-linear, DICOM) and ensure both backlight modes wereconsistently calibrated. However, since it was unclear how tousefully calibrate the variable backlight mode, we could notsetup such equivalent environments. Instead, we left the displaywith its default luminance calibration function and, having mea-sured the display and viewed many images on it, were satisfiedthat it provided a usable display for our experiments. Regard-less, if we found significant veiling effects in the variable-back-light mode, we could be assured these effects would occur ifwe were to approximately DICOM calibrate the monitor, as
they result from the maximum luminance being displayed neardarker regions, which would still occur under any reasonablecalibration.
III. RESULTS AND DISCUSSION
We have plotted the first, second, and third quartiles of thesubjects’ percentage correct choices in Fig. 6. While Fig. 6 isuseful for illustrating the variability across readers in our exper-iment, we were most interested in determining whether the twodisplay systems were equivalent for our task. In the remainderof this section we present our analysis of these results using themethods presented by Gallas et al. [17] to compute the neces-sary values for paired -tests of our hypotheses.
A. Means and Variances of Percentage Correct
As a first step towards this goal we computed the mean per-centage correct for each of the two displays and the mean dif-ference in percentage correct between the two displays in eachof the four target/noise power conditions. Since our study usesa fully crossed design where all readers saw every case, we cansafely compute our average percentage correct across all readersand cases in a given display and condition as [17]
(4)
where is a binary-valued function with 1 for a correctchoice and 0 for an incorrect choice when the th subject lookedat the th image selected from the set of images with target/noisepower condition using display . We use to accentuate thefact that the th image in one target/noise power condition is notthe same as the th image in the other three conditions. Insideof a given condition images are i.i.d. while between conditionsimages are merely assumed to be independent. We use the nota-tion to indicate that we are taking the mean over
and with and held fixed.The mean difference in percentage correct between the two
displays is then very similar
(5)
Authorized licensed use limited to: IEEE Xplore. Downloaded on February 2, 2009 at 20:04 from IEEE Xplore. Restrictions apply.
TISDALL et al.: COMPARING NOVEL HIGH-LUMINANCE HDR AND STANDARD MEDICAL LCD DISPLAYS 405
TABLE IMEAN PERCENTAGE CORRECT VALUES
where indicates the spatially variable backlight and indi-cates the uniform backlight, which are treated as constants andthus not varied in taking the means.
While we are interested in the performance of the human ob-servers when viewing the displays in each of the four target-CNR/noise-power conditions, we are also interested in observerperformance aggregated over all the conditions. Following theprevious notation, the mean performance viewing display isthen
(6)
and the mean difference between the displays is
(7)
The values we computed for these variables from our exper-imental data are shown in Table I.
We also need to compute the variances of these values. Thecovariance of the percentage correct of displays and ,with the target-CNR/noise-power condition held constant atis given by [17] and [18], as shown in (8) at the bottom of thepage, where we have slightly modified the notation of Gallaset al. and define
(9)
(10)
(11)
(12)
with being the number of subjects and being the numberof images displayed in one of the four target/noise power condi-tions. In our data and . When we havethe variance of a single display while when is the uniformly
TABLE IIVARIANCE OF PERCENTAGE CORRECT VALUES
backlit display and is the spatially variable backlit display (orvice versa) we have the covariance of the two displays.
In computing these covariance estimates we use unbiased es-timators of the various means, following the example of Gallaset al. [17]:
(13)
(14)
(15)
(16)
While we are interested in comparing the performance of thetwo displays in the individual target CNR/noise power condi-tions, we are also interested in whether the two displays wereequivalent over the aggregate of all the conditions. The meanresponse aggregated across all four conditions is just the meanof the four individual conditions’ mean responses. In Appendix,we demonstrate how estimators of the form suggested by Gallascan be used to produce variance and covariance estimates for theaggregated data of all conditions.
The results of performing the variance and covariance com-putations on our experimental data, both in each condition in-dividually and on the aggregate of all conditions, are shown inTable II.
(8)
Authorized licensed use limited to: IEEE Xplore. Downloaded on February 2, 2009 at 20:04 from IEEE Xplore. Restrictions apply.
406 JOURNAL OF DISPLAY TECHNOLOGY, VOL. 4, NO. 4, DECEMBER 2008
TABLE III�-VALUES, 95% CONFIDENCE INTERVALS OF MEAN DIFFERENCE
PERCENTAGE CORRECT, AND PROBABILITY OF OBSERVED
RESULTS UNDER NULL HYPOTHESIS
B. Hypothesis Tests
In each of the four target/noise conditions we are interestedin testing two hypotheses. First, we would like to test whetherthe simulated medical LCD display (uniform backlight mode)and the Dolby HDR LCD display (spatially variable backlightmode) are significantly different. Secondly, we would like totest if they are significantly equivalent. The structure of ourexperiments naturally admits the use of -tests under the as-sumption that the mean differences between displays are nor-mally distributed in each target/noise condition. The differencetest will use the standard paired -test for difference of meanswhile the equivalence of means test will be made using thetwo-one-sided-test (TOST) on the means.
1) Test of Difference: We first test for difference in the meansof the percentage correct between the two display modes. Sincewe do not know a priori that one backlight mode will be superiorto the other, we use mean-centered confidence intervals for eachtarget-CNR/noise-power condition computed via
(17)
where is the quantile of Student’sdistribution with degrees of freedom and is the de-sired confidence level of the interval. To compute the confidenceinterval for the display difference aggregated over all the condi-tions, we replace withand the condition-specific mean and variance estimates with thecondition-aggregated estimates described above.
If we cannot reject the null hypothesisthat the two means are identical at . If the interval does notoverlap zero, then we can reject the null hypothesis at .Alternatively we can compute the two-sided -values from the-value of the measured data and the distribution and compare
them with . The calculated value of the statistic, the 95%confidence interval, and the equivalent -values calculated fromthe measurements in each condition and in the aggregate of allconditions are shown in Table III.
In cases where the mean-centered confidence intervals en-close zero (the first, second, and fourth target-CNR/noise-powerconditions), we cannot reject the null hypothesis, and thus wedo not have statistically significant difference at . We
TABLE IV10% EQUIVALENCE BOUNDS, ZERO-CENTERED 95% CONFIDENCE INTERVALS
OF MEAN DIFFERENCE PERCENTAGE CORRECT VALUES, AND PROBABILITY OF
OBSERVED RESULTS UNDER NULL HYPOTHESES
do have a statistically significant difference between the dis-plays in the third condition and in the aggregate of all condi-tions. However, these differences, while statistically significant,may not be practically significant, which leads us to our tests ofequivalence.
2) Test of Equivalence: Although we have shown that thereare some statistically significant differences, we must now testif our displays are statistically equivalent. As in all equivalancetests, the TOST suggests that we define some bound on the dif-ference between displays inside of which we will declare themequal for practical purposes. Standard approaches to choosingthis include appeals to domain-specific knowledge in the fieldbeing tested or accepting an error of less than 10% (some au-thors suggest 20%) of the mean of the reference condition (inour case the uniform backlight) [19], [20]. Since we have nodomain-specific knowledge for this test that allows us to definemeaningful bounds, we will compute the 10% bounds for thefour conditions from the uniform backlight mean in Table I, asshown in Table IV.
Using the TOST procedure, we conclude that the means arestatistically significantly equivalent if the entire confidence in-terval falls within the stated equivalence bounds [21]. To per-form this test, we use zero-centered confidence intervals in orderto minimize the probability of erroneously accepting the null hy-pothesis when it is actually false (i.e., accepting that the displaysare not equivalent when in fact they are) [21]. For the distribu-tion, zero-centered confidence intervals are constructed via
(18)
where and are chosen so that the integral of Stu-dents’ distribution from to equals where isthe desired confidence level and is thequantile of Student’s distribution with degreesof freedom. However, unlike in the mean-centered intervalsabove, we chose different and values such that theresulting confidence interval bounds are symmetric around 0(i.e., ). As with the mean-centered inter-vals, zero-centered confidence intervals for the aggregate of allconditions are produced by replacing the degrees of freedom inthe distribution with and the condition-specificmean and variance estimates with their aggregate equivalents.
The zero-centered 95% confidence intervals’ extremaare given in Table IV along with the -value of the TOST
Authorized licensed use limited to: IEEE Xplore. Downloaded on February 2, 2009 at 20:04 from IEEE Xplore. Restrictions apply.
TISDALL et al.: COMPARING NOVEL HIGH-LUMINANCE HDR AND STANDARD MEDICAL LCD DISPLAYS 407
equivalence test. Comparing the defined equivalence bounds(first column) with the calculated confidence intervals (secondcolumn) in Table IV, we see that we have statistically significantequivalence in the second and fourth target-CNR/noise-powerconditions as well as in the aggregate case.
C. Discussion
Based on the means and variances we computed, our -testshave demonstrated detectable differences between the displaysin one of the target-CNR/noise-power conditions and in the ag-gregate. We have also been able to show statistically significantequivalence in two of our target-CNR/noise-power conditionsand in the aggregate of all conditions, using the 10% boundthat is normally considered reasonable in other disciplines. Theequivalence of the displays in the highest target CNR condi-tion is not surprising, since our subjects were able to choose thetarget-present image correctly in almost every trial. However,the equivalence in the aggregate of all conditions is important asthis is the test that most clearly addresses our original question:is the Dolby HDR LCD display equivalent to a standard LCDfor viewing images? The aggregate test includes measurementsfor images whose detection difficulty ranged from very hard tovery easy, and, considering this whole range, the two displayswere significantly equivalent according to our test.
We note that it is possible that with the addition of moresubjects and/or cases per subject we might also find signifi-cant differences in more of the conditions. However, this doesnot negate our finding of significant equivalence. Statisticallysignificant differences can co-exist with statistically significantequivalence because our definition of equivalence relies on abound on differences. As long as we can be significantly confi-dent that our differences lie within this bound, then we are as-serting that whatever small differences exist between the dis-plays are not large enough to have a practical effect.
IV. CONCLUSION
We have presented a 2AFC SKE experiment for the explo-ration of the Dolby spatially variable backlight technology inmedical LCD displays. We compared the Dolby HDR LCD dis-play to the same LCD panel illuminated as it would be in anormal medical LCD display. The use of real MRI data as back-grounds ensured that our experiment used images with realisticcontrast and structure. Our targets and noise power were chosento cover the full range of difficulties from forcing users to es-sentially guess to making the task almost obvious. By using thesame display with a spatially uniform backlight as a simula-tion of a medical-grade LCD we have kept the hardware-relatedvariables consistent and minimized the number of possible con-founds in our experiment’s design.
The results of our experiment suggest that the detection ofsmall, low-contrast features in complicated, high-contrast back-grounds on LCD displays using the high-luminance, spatiallyvarying backlight is equivalent to the same task on a lower-lu-minance, uniformly backlit LCD. This result confirms our sus-picion, based on the years of clinical experience with film light
boxes, that the veiling luminance caused by scatter in the ob-servers’ eyes would not be a substantial impediment to signaldetection. Additionally, our results indicate that the use of theapproximations introduced by the low-resolution LED backlightdisplay are not detrimental to signal detection in this context.More generally, we suggest that the displays with the Dolby spa-tially variable backlight system are useful platforms for furtherstudy of high-contrast displays in medical imaging. However,the development of a method for DICOM calibration will bean essential prerequisite to performing further validation studiesusing real medical data.
We also suggest that further experiments are needed to verifythat veiling luminance is not a substantial impediment to de-tection. Despite the long-standing use of film light boxes withdynamic range sufficient to induce veiling luminance via scatterin the eye, we are still concerned that this effect may play a rolein hiding small, low-contrast lesions. To thoroughly test this hy-pothesis, detection experiments like this one could be run withthe low-contrast target being located in regions calculated to beobscured by veiling glare based on a model of the display andthe veiling luminance effect [3].
APPENDIX
VARIANCE OF AGGREGATED CONDITION DATA
To produce an estimate of the covariance between displaysand aggregated over all target CNR/noise power conditions,we begin by noting that
(19)
and
(20)
We expand the second moment and square of the mean, notingthat is i.i.d. for all and when and are fixed, toproduce an equation similar to that in Gallas et al. [17], as shownin (21) at the top of the next page, and
(22)
If we substitute these two equations back into (19), we canfurther simplify, using the previous definition of to pro-duce (23), shown at the top of the next page.
We have used our notation to accentuate the important pointthat involves the same th
Authorized licensed use limited to: IEEE Xplore. Downloaded on February 2, 2009 at 20:04 from IEEE Xplore. Restrictions apply.
408 JOURNAL OF DISPLAY TECHNOLOGY, VOL. 4, NO. 4, DECEMBER 2008
(21)
(23)
subject in both measurements but different images because eachcondition and had its own images that were indexed with .Thus, the distribution of does not depend onwhether or not. Further the images in each condition arei.i.d. as long as , , , and are fixed. Combining this withthe fact that the distributions do not depend on the particular ,we can simplify this to
(24)
To produce an unbiased estimate of , we then use
(25)
(26)
As in the fixed-condition case, the variance of a single displayis estimated by setting .
Authorized licensed use limited to: IEEE Xplore. Downloaded on February 2, 2009 at 20:04 from IEEE Xplore. Restrictions apply.
TISDALL et al.: COMPARING NOVEL HIGH-LUMINANCE HDR AND STANDARD MEDICAL LCD DISPLAYS 409
ACKNOWLEDGMENT
The authors would like to acknowledge the assistance ofDr. B. Maedler at Philips Medical Systems for providing thehigh-field MRI images.
REFERENCES
[1] K. A. Fetterly, H. R. Blume, M. J. Flynn, and E. Samei, “Introductionto grayscale calibration and related aspects of medical imaging gradeliquid crystal displays,” J. Digital Imag., Mar. 2007.
[2] T. Kimpe and T. Tuytschaever, “Increasing the number of gray shadesin medical display systems—How much is enough,” J. Digital Imag.,vol. 20, no. 4, pp. 422–432, Dec. 2007.
[3] J. J. Vos, B. L. Cole, H.-W. Bodmann, E. Colombo, T. Takeuchi, andT. J. T. P. van den Berg, CIE Equations for Diability Glare CIE, 2002,Tech. Rep. 146.
[4] H. Seetzen and L. A. Whitehead, “A high dynamic range displayusing low and high resolution modulators,” in SID 03 Dig., 2003, pp.1450–1453.
[5] H. Seetzen, S. Makki, H. Ip, T. Wan, V. Kwong, G. Ward, Wolfga, andL. Whitehead, “Self-calibrating wide color gamut high dynamic rangedisplay,” in Human Vision and Electronic Imaging XII, ser. Proceedingsof the SPIE. : SPIE—The Int. Soc. Opt. Eng., 2007, vol. 6492.
[6] M. D. Tisdall and M. S. Atkins, “Using human and model performanceto compare MRI reconstructions,” IEEE Trans. Med. Imag., vol. 25, no.11, pp. 1510–1517, Nov. 2006.
[7] H. Gudbjartsson and S. Patz, “The Rician distribution of noisy MRIdata,” Magn. Reson. Med., vol. 34, pp. 910–914, 1995.
[8] J. P. Rolland and H. H. Barrett, “Effect of random background inho-mogeneity on observer detection performance,” J. Opt. Soc. Amer. A,vol. 9, no. 5, pp. 649–658, May 1992.
[9] M. P. Eckstein, C. K. Abbey, and J. S. Whiting, “Human vs modelobservers in anatomic backgrounds,” in Proc. SPIE—Medical Imaging1998. : , 1998, vol. 3340, pp. 16–26.
[10] M. P. Eckstein, C. K. Abbey, F. O. Bochud, J. L. Bartoff, and J. S.Whiting, “The effect of image compression in model and human per-formance,” in Proc. SPIE, 1999, vol. 3663, pp. 243–252.
[11] A. Badano and B. D. Gallas, “Detectability decreases with off-normalviewing in medical liquid crystal displays,” Acad. Radiol., vol. 13, pp.210–218, 2006.
[12] A. E. Burgess, X. Li, and C. K. Abbey, “Visual signal detectabilitywith two noise components: Anomalous masking effects,” J. Opt. Soc.Amer. A, vol. 14, no. 9, pp. 2420–2442, Sep. 1997.
[13] S. Park, “Efficiency of the human observer detecting random signals inrandom backgrounds,” J. Opt. Soc. Amer. A, vol. 22, no. 1, pp. 3–16,Jan. 2005.
[14] A. G. Rempel, M. Trentacoste, H. Seetzen, H. D. Young, W. Heidrich,L. Whitehead, and G. Ward, “Ldr2hdr: On-the-fly reverse tone mappingof legacy video and photographs,” in SIGGRAPH ’07, pp. 39–44.
[15] M. Trentacoste, “Photometric Image Processing for High DynamicRange Displays,” Master’s, Univ. of British Columbia, Vancouver,Canada, 2006.
[16] E. Siegel, E. Krupinski, E. Samei, M. Flynn, K. Andriole, B. Erickson,J. Thomas, A. Badano, J. A. Seibert, and E. D. Pisano, “Digital mamog-raphy image quality: Image display,” J. Amer. College of Radiol., vol.3, pp. 615–627, 2006.
[17] B. D. Gallas, G. A. Pennello, and K. J. Myers, “Multireader multicasevariance analysis for binary data,” J. Opt. Soc. Amer. A, vol. 24, no. 12,pp. B70–B80, Dec. 2007.
[18] B. D. Gallas and D. G. Brown, “Reader studies for validation of cadsystems,” Neural Netw., vol. 21, pp. 387–397, 2008.
[19] D. J. Schuirmann, “A comparison of the two one-sided tests proce-dure and the power approach for assessing the equivalence of averagebioavailability,” J. Pharmacokinet. Biopharmaceut., vol. 15, no. 6, pp.657–680, 1987.
[20] S. Wellek, Testing Statisical Hypotheses of Equivalence. London,U.K.: Chapman and Hall, 2003.
[21] W. J. Westlake, “Symmetrical confidence intervals for bioequivalencetrials,” Biometrics, vol. 32, no. 4, pp. 741–744, 1976.
M. Dylan Tisdall received the B.Math. (Hons) degree from the University ofWaterloo, Waterloo, Canada, in 2002, and the Ph.D. degree from Simon FraserUniversity, Vancouver, Canada, in 2007, both in computer science.
He is currently a Research Fellow at the Athinoula A. Martinos Center forBiomedical Imaging, Boston, MA. His research focuses on the reconstructionof medical images using statistical estimation methods and the evaluation ofreconstructions and displays using perceptual studies.
Gerwin Damberg is a Senior Research Engineer at Dolby Canada. In the ImageTechnologies Research Department one of his responsibilities is the Human Fac-tors Study program.
Paul Wighton received the B.Sc. degree in engineering from the Universityof Guelph, Guelph, Canada, in 2003. He is currently working toward the M.Sc.degree in computing science from Simon Fraser University, Vancouver, Canada.
His research focuses on methods to improve the automated diagnosis ofmelanoma.
Nhi Nguyen received the B.Eng degree in software engineering from The Uni-versity of Sydney, Sydney, Australia, in 2005, and is currently working towardthe M.Sc. degree from Simon Fraser University, Vancouver, Canada.
She is a member of the Medical Computing lab at this university. Her re-search interests include medical image display and analysis, statistical signalprocessing and computer graphics.
Yan Tan received the B.Sc. degree in software engineering from Zhejiang Uni-versity in 2007, and is currently working toward the M.Sc. degree from SimonFraser University, Vancouver, Canada, in computer science.
His research interests include medical data-mining and the use of eyetrackers.
M. Stella Atkins received the B.Sc. degree in Chemistry from Nottingham Uni-versity in 1966 and the PhD degree in computer science from the University ofBritish Columbia in 1985. She is a Professor in the School of Computing Sci-ence at Simon Fraser University (SFU), Vancouver, Canada, and Director ofthe Medical Computing Lab at SFU. Her research interests include telehealthapplications, medical image display and analysis, in addition to medical imagesegmentation, image denoising and perception, and radiology workstation de-sign. She is also interested in the use of eyetrackers for seeing inside the brain.
Hiroe Li is a Research Engineer for Image Technology Research at DolbyCanada. She is responsible for designing and conducting the Human Factorsstudies of the high dynamic range display.
Helge Seetzen is the Senior Manager for Image Technology Research at DolbyCanada. He is responsible for the development of high dynamic range display,video and capture technology.
Authorized licensed use limited to: IEEE Xplore. Downloaded on February 2, 2009 at 20:04 from IEEE Xplore. Restrictions apply.