Embed Size (px)
Citation preview
379 ff%U
/4Q*3oi
THE EFFECT OF SEQUENCING MICROECONOMICS
AND MACROECONOMICS
ON LEARNING
DISSERTATION
Presented to the Graduate Council of the
University of North Texas in Partial
Fulfillment of the Requirements
For the Degree of
DOCTOR OF PHILOSOPHY
By
Jill A. Trask, B.S., M.S,
Denton, Texas
August, 1989
Trask, Jill Ann, The Effect of Sequencing
Microeconomics and Macroeconomics on Learning. Doctor of
Philosophy (Higher Education), August, 1989, 76 pp., 13
tables, list of references, 21 titles.
The purpose of this study was to determine the effect
on student learning from the sequence in which
microeconomics and macroeconomics courses are taken.
The sample for this study consisted of all students
enrolled in 23 sections of Economics 1100 (Principles of
Microeconomics) and 10 sections of Economics 1110
(Principles of Macroeconomics) during the fall semester,
1987, at the University of North Texas. The sample also
consisted of all students enrolled in 14 sections of
Economics 1100 and 12 sections of Economics 1110 during the
spring semester, 1988, at the University of North Texas.
The instruments chosen for use in measuring cognitive
gains were two versions, each with 14 items, selected from
the Joint council on Economic Educations's Revised Test of
Understanding College Economics. Data were analyzed using
hierarchical regression on five models. Each model used a
different dependent variable to measure cognitive gain. The
dependent variables were additive grade points, additive
absolute improvement posttest scores, gap-closing posttest
scores, microeconomic gap-closing scores and macroeconomic
gap-closing posttest scores.
The general hypothesis that students who complete
microeconomics instruction followed by macroeconomics
instruction have significantly higher cognitive gains than
students who complete macroeconomics instruction followed by
microeconomics instruction was not verified by the main
effects. While the main effect of sequence was not
significant, the interaction of sequence with previous high
school economics was significant in the models using
dependent variables of additive absolute improvement
posttest score, gap-closing posttest score and microeconomic
gap-closing posttest score. In addition, the interaction of
sequence with previous college economics was significant on
the dependent variable gap-closing posttest score.
These findings seem to indicate that students who
complete a sequence of macroeconomics followed by
microeconomics with no previous exposure to economics have
higher cognitive gains. In addition, students who complete
a sequence of microeconomics followed by macroeconomics and
had a previous college economics course have higher
cognitive gain than students who complete the opposite
sequence.
Copyright by
Jill A. Trask
1989
111
TABLE OF CONTENTS
Page
LIST OF TABLES vi
Chapter
1. INTRODUCTION 1
Statement of the Problem Purpose of the Study Hypotheses Significance of the Study Definition of Terms Delimitations Limitations Basic Assumptions
2. SYNTHESIS OF RELATED LITERATURE 8
3. METHODOLOGY 19
The Population The Sample Instruments Variables Research Design Collection of Data Procedure for Analysis of Data Testing the Hypotheses
4. ANALYSIS OF THE DATA 31
Introduction AGRADE Model ABPOST Model GAP Model Microeconomic GAP Model Macroeconomic GAP Model Summary
5. SUMMARY, DISCUSSION, CONCLUSIONS, RECOMMENDATIONS AND IMPLICATIONS 53
Summary Discussion
IV
Page
Conclusions Recommendations Implications
APPENDIX 59
REFERENCE LIST 75
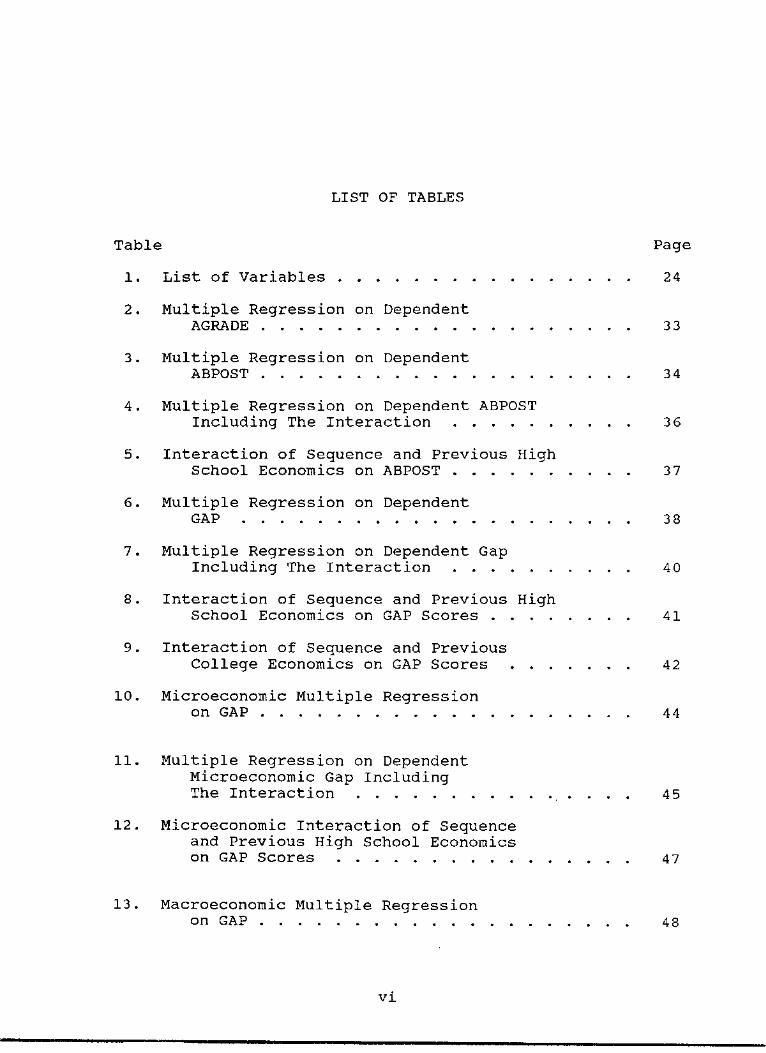
LIST OF TABLES
Table Page
1. List of Variables 24
2. Multiple Regression on Dependent AGRADE 3 3
3. Multiple Regression on Dependent ABPOST 34
4. Multiple Regression on Dependent ABPOST Including The Interaction 36
5. Interaction of Sequence and Previous High School Economics on ABPOST 37
6. Multiple Regression on Dependent GAP 38
7. Multiple Regression on Dependent Gap Including The Interaction 40
8. Interaction of Sequence and Previous High School Economics on GAP Scores 41
9. Interaction of Sequence and Previous College Economics on GAP Scores 42
10. Microeconomic Multiple Regression on GAP 44
11. Multiple Regression on Dependent Microeconomic Gap Including The Interaction 45
12. Microeconomic Interaction of Sequence and Previous High School Economics on GAP Scores 47
13. Macroeconomic Multiple Regression on GAP 48
VI
CHAPTER 1
INTRODUCTION
Most colleges and universities separate microeconomics
and macroeconomics into two courses (Fizel & Johnson, 1986).
As a result instructors and faculties must examine the
impact of sequencing on students' learning. There is an
"absence of previously published research that develops
criteria for proper sequencing" (p. 87). Past choices,
therefore, have been based on faculty preferences and
beliefs rather than on research which provides a criterion
for sequencing that enables greater cognitive comprehension.
"The current organization of economics principles
courses usually follows the macroeconomics/microeconomics"
(p. 94) sequence. This is true of most institutions of
higher education as well as the structure of most principles
textbooks. A study, conducted by John Fizel and Jerry
Johnson at the University of Wisconsin at Eau Claire in
1983-84, examines the sequencing of macroeconomics and
microeconomics courses. The results of their research
suggest that the current trend of sequencing, macroeconomics
followed by microeconomics, needs to be re-thought. The
empirical evidence of their study indicates that a
sequencing of microeconomics followed by macroeconomics at
the introductory level produces a better understanding of
economics than the current sequencing.
Statement of the Problem
The problem of this study was the effect on cognition
from the sequencing of microeconomics and macroeconomics
courses at the introductory level.
Purpose of the Study
The purpose of this study was to determine the effect
on student learning from the sequence in which
microeconomics and macroeconomics courses are taken.
Hypotheses
This study examines the general hypothesis that
students who complete microeconomics instruction followed by
macroeconomics instruction sequence have significantly
higher cognitive gains than students who complete
macroeconomics instruction followed by microeconomics
instruction sequence. In testing this general assertion,
four sub-hypotheses were developed:
Sub-hypothesis 1. Students who complete the
microeconomics instruction followed by macroeconomics
instruction sequence will have significantly higher additive
grade points than students who complete the macroeconomics
instruction followed by microeconomics instruction sequence.
Sub-hypothesis 2. Students who complete the
microeconomics instruction followed by macroeconomics
instruction sequence will have significantly higher additive
absolute improvement posttest scores on a nationally normed
test than students who complete the macroeconomics
instruction followed by microeconomics instruction sequence.
Sub-hvpothesis 3. Students who complete the
microeconomics instruction followed by macroeconomics
instruction sequence will have significantly higher additive
gap-closing scores on a nationally normed test than students
who complete the macroeconomics instruction followed by
microeconomics instruction sequence.
Sub-hypothesis 4. Students who complete the
microeconomics followed by macroeconomics sequence when they
are sophomores, juniors, or seniors, will have significantly
different additive grade points than freshmen.
Significance of the Study
Many colleges and universities teach both
macroeconomics and microeconomics courses every semester.
The prescribed sequence for taking these courses, by most
colleges and universities, is to take a macroeconomics
course prior to taking a microeconomics course (Fizel &
Johnson, 1986) . It was believed that this study would show
a need to examine the opposite sequencing order because it
increases student cognition.
The study conducted by Fizel and Johnson (1986)
suggests that the cognitive instrument used may be one
possible reason for the differences in learning attributed
to the course sequence variable. They utilized the hybrid
Revised TUCE (RTUCE), which is a combination of
microeconomics and macroeconomics concepts in one test. The
hybrid Revised TUCE is designed for use in a one-semester
course (Saunders, 1981). Fizel and Johnson state: "that
the hybrid RTUCE is biased towards a micro/macro course
sequence, deserves consideration because the hybrid exam
does contain sixteen macro questions and only fourteen micro
questions [sic]11 (p. 91). In this study the microeconomics
test was given to microeconomics students and the
macroeconomics test was given to macroeconomics students.
This difference in pretests and posttests controls for the
bias in the hybrid test.
The significance of this study was to (a) provide
rationale for changing the prescribed sequencing of
economics courses to the microeconomics course being taken
prior to the macroeconomics course; (b) provide rationale
for using either grade points, absolute improvement posttest
scores, or gap-closing scores as dependent variables to
measure cognitive gain; (c) provide rationale for having
students take principles of economics, both microeconomics
and macroeconomics, after their freshman year in college;
and (d) develop the scope of economics education research to
encompass the sequencing effect on cognition in
microeconomics and macroeconomics.
Definition of Terms
For the purpose of this study, the following
definitions are provided.
Economics is the social science concerned with
description and analyses of the production, distribution and
consumption of goods and services.
Microeconomics is the portion of economics concerned
with the activity of individuals and firms mainly with
regard to the allocation of resources.
Macroeconomics is the portion of economics concerned
with large-scale movements of the economy, such as growth or
decline, inflation or deflation.
Additive grade points are the final course grades
received by each student in microeconomics and
macroeconomics, converted to numbers, then added.
Additive absolute improvement posttest scores are the
posttest scores minus the pretest scores for the
microeconomics and macroeconomics courses. These two scores
are then added.
Additive crap-closing scores are the percentage gain
scores between the microeconomics pretest and posttest and
the macroeconomics pretest and posttest added together. The
additive gap-closing scores compare "actual to potential
improvement" (Gery, 1976, p. 42) and are calculated as
follows:
POST - PRE 14 - PRE
Delimitations
The data utilized for this study were collected in the
fall, 1987 and the spring, 1988. For the purpose of this
study extant data were accepted. The use of students from
the University of North Texas posed a threat to external
validity. Since this was a one-time experiment, using one
institution, the findings can only be generalized to the
institution being studied. Often, however, informed
judgments are made from one study to a population. As
stated by Campbell and Stanley, "we do attempt
generalization by guessing at laws and checking out some of
these generalizations in other equally specific but
different conditions" (1972, p. 17).
Limitations
One limitation of this study centered on the fact that
no control group was utilized. Statistical control through
the use of covariates was therefore employed. In the
regression equation, gender, age, academic classification,
race, high school economics courses taken, previous college
economics courses taken and major were entered as
covariates. Entering these covariates first into the
regression equation removed certain threats to internal
validity.
Another limitation of the study centered on the use of
intact classes. All of the students taking Principles of
Microeconomics and Macroeconomics courses were utilized in
this study. It is not, therefore, a random sample but a
convenience sample from one institution. This study
statistically controlled for this convenience sample by
adding the fall, 1987 cognitive pretest and the spring, 1988
pretest score and used that figure as a covariate. The
findings of this study can be generalized to all principles
of economics instruction courses at institutions of similar
size with student populations similar to the University of
North Texas.
Basic Assumptions
It was assumed that each course represents a random
sample of students from a broader population of students.
Inferential statistics permitted the data to be treated as a
sample (Cohen & Cohen, 1983). Course descriptions of
introductory microeconomics and introductory macroeconomics
are included in the Appendix.
CHAPTER 2
SYNTHESIS OF RELATED LITERATURE
Economics education involves the dissemination of
knowledge about the discipline of economics. Economics at
the introductory or principles level is divided into two
parts; microeconomics and macroeconomics. Microeconomics is
"that portion of economics concerned with the activity of
individuals and firms, mainly with regard to the allocation
of resources" (Heilbroner & Galbraith, 1987, p. 717).
Macroeconomics is "that portion of economics concerned with
large-scale movements of the economy, such as growth or
decline, inflation or deflation" (p. 716). Through
macroeconomics instruction, students begin to put all of the
sectors of the economy into a working model. These sectors
include households, businesses, government, and
international trade.
"The undergraduate introductory economics course is the
foundation of most college and university economics
programs" (Sweeney, Siegfried, Raymond & Wilkinson, 1983, p.
68). Some universities offer both a one-semester and a two-
semester introductory course. The predominant organization
of most introductory economics courses, however, is a two-
semester sequence. Over 85 percent of colleges and
universities offer a two-semester sequence (Sweeney et al.,
1983). J. B. Sweeney, J. J. Siegfried, J. E. Raymond and J.
T. Wilkinson found that students who complete a two-semester
economics sequence have a greater understanding of economics
concepts than those students who complete a one-semester
course. It was further found that students completing a
microeconomics followed by a macroeconomics sequence rated
their courses stronger than those completing a
macroeconomics followed by a microeconomics sequence.
"Students at many institutions are told that it doesn't
matter which of the two is taken first" (Tinari, 1983, p.
3). The message being given to students is that
macroeconomics and microeconomics are two completely
different subject areas. In actuality, however, they are
simply subcategories from the entire subject of economics.
In recent years the pure distinction between microeconomic
and macroeconomic concepts in textbooks has not been found.
From an examination of thirty-nine principles and
introductory textbooks Tinari found "the most predominant
format is the sequencing of macro, micro, distribution, and
growth/international" (p. 5). This format has caused
instructors of economic principles courses to attempt to
place other subcategories into the microeconomic or
macroeconomic courses. This causes some problems, because
not all instructors agree that the placement of other
subcategories fit neatly into one course or the other.
10
"What we observe on the one hand is the institutionalization
of the macro-micro distinction and, on the other, a variety
of actual topical presentations formats in our textbooks
and, presumably, our courses" (p. 7). Traditional
scheduling of most courses is still presented in the two
semester microeconomics and macroeconomics courses.
Tinari requests a change in the formatting of
principles courses. He prefers a two-semester sequence
through a holistic approach. "My preference would be to
cover economic growth and allocative efficiency in the first
semester." "The second semester would be devoted to
aggregate efficiency and distributional equity topics" (p.
20). There are problems with instituting this alternative
approach such as rewriting textbooks and course
descriptions, but Tinari recognizes these. On the positive
side, this alternative approach would provide students with
a holistic understanding of economic concepts rather than a
segmented microeconomic and macroeconomic separation.
Much of the research conducted in economics education
has been dependent upon the Test of Understanding College
Economics (TUCE), which was published by the Joint Council
on Economic Education in 1968 (Siegfried & Fels, 1979, p.
927). The TUCE contains matched pairs of questions in
various areas. In essence, the TUCE is three separate
tests; one test that addresses only microeconomic concepts
and issues, one that addresses only macroeconomics concepts

11
and issues, and a third test that addresses both
microeconomic and macroeconomics concepts and issues. This
third test is extremely useful for a one-semester course
which encompasses both microeconomics and macroeconomics.
This has made the TUCE a useful measurement tool in value-
added controlled experiments. The TUCE has also been
normed, which allows for comparisons to be made with
sampling groups. Although the TUCE possesses these
attributes, it also has shortcomings. First, some of the
questions on the TUCE are unsatisfactory because they are
outdated. A revised TUCE was published in 1981, and some of
the outdated questions have been eliminated. Second, "No
general purpose test is likely to conform exactly to the
purposes and content of any particular course" (p. 928).
Finally, there is no multiple choice test which can measure
all of the objectives of principles instruction in
principles of economics.
Utilizing the Test of Understanding in College
Economics (TUCE) has been discussed in several articles on
economic education. One problem that has evolved from the
use of the TUCE is the ceiling effect on posttest scores.
In an article written by Frank W. Gery, the ceiling effect
on posttest TUCE scores was addressed. "The ceiling effect
may be defined as the bias imposed on test results because
of the finite number of question (33) in TUCE" (Gery, 1976,
p. 35). This means that a high pretest scores leaves little
12
room for improvement when the posttest is taken. This
causes a downward bias toward posttest results. The purpose
of Gery's study was to define a set of models using TUCE
scores, and test the ceiling effect in each model. Through
Gery's investigation of the ceiling effect on the TUCE he
also addressed the importance of including pretest scores in
the analysis of posttest scores. The data used in Gery's
article were derived from students in a one-semester
principles course in economics at St. Olaf College. The
test administered was the hybrid TUCE containing both
microeconomics and macroeconomic questions.
Gery assumes that after students have received some
type of educational treatment they are evaluated by the
TUCE. The question then involves what experimental model
should be employed to yield the most accurate predictors of
the dependent posttest variable. Before establishing these
models, however, it is important to realize the effect that
a pretest has on a posttest. Gery argues that "the starting
position matters, the postscore is at least partly
determined by the precourse knowledge of economics" (p. 38).
He then explains how to control for the pretest effect by
"testing experimental results against an improvement factor,
not the absolute level of Post-TUCE; or explicity [sic],
take the prescore into account" (p. 38). The pretest score
can act as a normalizing variable so that a student's
13
starting position may be known to the researcher before
analyzing the posttest scores.
Gery developed four possible regression models for
utilization when attempting to explain posttest TUCE scores.
In each of the four models "the postscore is specified in
different form, but always as a function of the prescore"
(P- 39).
The first model discussed by Gery is the most commonly
used and is referred to as the basic or absolute level
model. The basic model assumes that the postscore is a
function of the prescore. In this model the dependent
variable is the posttest score and the prescore is an
independent variable placed in the regression equation. It
is hypothesized by Gery that this basic model creates an
artificially high correlation of postscores on prescores as
well as a ceiling effect. His other three models improve
upon this artificially high correlation and ceiling effect.
The second model, the absolute improvement model,
converts the dependent variable by specifying it as the
postscore minus the prescore. The prescore remains an
independent variable in the regression equation. This model
can also create artificially high correlations between
postscores and prescores, ceiling effects and floor effects.
While these effects are present in the absolute improvement
model they are not as pronounced as in the basic model.
14
The third model identified by Gery as the percentage
improvement model specifies the dependent variable as the
postscore minus the prescore divided by the prescore.
According to Gery this model is seldom utilized; however,
when utilized it has the same shortcomings as the absolute
improvement model.
The fourth model, the gap-closing model is "our attempt
to correct for the possible floor and ceiling effects in the
other models" (p. 41). In the gap-closing model the
dependent variable is specified as the postscore minus the
prescore divided by 3 3 minus the prescore. The denominator
in this model (33-prescore) represents the gap or potential
improvement while the numerator represents actual
improvement. "Hence, the gap-closing model compares actual
to potential improvement" (p. 41). Gery suggests in his
study that the gap-closing model corrects for the
artificially high correlation of postscores on prescores as
well as the floor and ceiling effects present in the first
three models.
In conclusion, Gery recommends use of the gap—closing
model because it is "less defective and less distorting in
character than the other three models" (p. 49). He suggests
that verification by replication in other institutions needs
to take place.
S. G. Buckles and M. E. McMahon (1971) conducted a
study comparing the use of a lecture approach and a
15
programmed textbook approach toward the learning of economic
principles. They pretested and posttested students using
the TUCE. They found little difference in the two
approaches. They concluded that lectures did not add any
new information but only explained what was written in the
textbook. Through their analysis they found that the TUCE
pretest was of importance in explaining posttest scores.
"This somewhat disheartening result tends to confirm the
suspicion that how much economics the students knew at the
end of the test period was a function primarily of their
intellectual ability and the knowledge with which they
started the course" (p. 140). The importance of pretesting
students appears to be extremely important in explaining
posttest scores.
In a study conducted by Howard P. Tuckman on Teacher
Effectiveness and Student Performance (1975), the TUCE was
negatively correlated with student course grades. Tuckman
found a negative simple correlation between a ten-question
version of the macro TUCE and course grades for students who
completed a macroeconomics course. An R-square of .22
between the TUCE and course grades was found by P. F.
Labinski (1978). Labinski conducted his experiment with a
community college and argued that the objectives of
economics instruction at two-year colleges differed from
four-year universities. The TUCE was designed to test a set
of objectives that a four-year college or university should
16
teach. It is therefore not surprising that a two-year
college may not have those same objectives.
Some researchers have found that in order to better
evaluate economics education, more than just the TUCE or
testing cognition is necessary. As a result, studies began
to take place which involved student attitudes. Three types
of student attitudes have been of interest in previous
studies: (1) attitudes toward policy issues, (2) attitudes
toward economics, and (3) attitudes regarding quality of
instruction.
Attitudes toward policy issues have been of concern to
researchers because one of the goals of economics education
is greater sophistication about policy issues. "Attitude
sophistication means that opinions are consistent with the
current state of knowledge" (Mann & Fusfeld, 1970, p. 112).
Mann and Fusfeld measured the increase in attitude
sophistication achieved by students in a principles of
economics course. The study also attempted to determine
characteristics of teachers which were associated with the
gains in attitude sophistication. The results of the study
showed that "attitude sophistication appears to deal with an
enduring meaningful outcome of a college course not measured
by the usual test of cognitive growth or attitude change"
(p. 12 6). It was further shown that attitude sophistication
is associated with a hierarchy of values held by those
students who are more knowledgeable about the subject matter
17
of economics. A study done by Luker and Proctor in 1972
(1981) examined the effect of an introductory course in
microeconomics on student attitudes toward liberalism and
conservatism. This study showed that the basic
microeconomics course tended to make students more
conservative.
Researchers have also looked at attitudes toward
economics and opinions regarding the quality of instruction.
Using data from three small mid-western universities;
Ramsett, Johnson and Adams (1973) examined attitudes toward
economics. They found that students who were more favorably
disposed toward the subject of economics did better on the
post-course TUCE, holding the pre-course TUCE and socio-
demographic factors constant. These findings were confirmed
by Karstensson and Vedder (1974) in a similar study at Ohio
University. They found that as students interest in
economics increases also their cognitive score during the
semester increases.
Research directed toward attitudes or opinions on the
quality of instruction are divided. Some researchers, such
as Dennis Capozza (1973), believe that evaluations of
instructors are undesirable because they do not adequately
represent student cognitive achievement. Capozza regressed
student ratings of instructors on increases in Test of
Economic Understanriing (TEU) scores and the average grade of
eight different economic classes. He found that higher
18
course evaluations were associated with higher grades and
less gain on TEU scores. Other researchers feel that
student evaluations as measures of cognition are valid. A
study conducted by Morgan and Vasche' (1978) concluded that
students recognize good teaching. They found that students'
evaluations were positively correlated with the course
grade.
The most recent study conducted using the TUCE was
published in the spring, 1986. This study involved the
effect of macroeconomics and microeconomics course
sequencing on learning and attitudes in principles of
economics (Fizel & Johnson, 1986). In this study it was
indicated that the sequencing choice of micro-macro courses
had a significant impact on student cognitive gain in
economics principles courses. "A micro/macro sequence
produces a higher level of economic understanding, but
generally does not influence student attitudes" (p. 87).
This study was conducted primarily to develop criteria for
current curriculum or a change in current curriculum for the
sequencing of principles of economics courses. As most
colleges and universities teach principles of economics in a
macro-micro sequence and most principles of economics
textbooks are written in that sequence, this study has
significance toward current curriculum change.
CHAPTER 3
METHODOLOGY
The Population
The population in this study was considered a universe
of university undergraduate students enrolled in principles
of microeconomics and principles of macroeconomics courses.
According to Hagood (1970),
for most research projects which cut a cross-section in time, the generalizing is to the hypothetical universe of such universes as could have been produced within the stated or prolonged present, where the dynamic forces continue to operate as of the specified time, producing phenomena which show only "chance" variation. (P- 66)
The Sample
The sample for this study consisted of all students
enrolled in 23 sections of Economics 1100 (Principles of
Microeconomics) and 10 sections of Economics 1110
(Principles of Macroeconomics) during the fall semester,
1987, at the University of North Texas. The sample also
consisted of all students enrolled in 14 sections of
Economics 1100 and 12 sections of Economics 1110 during the
spring semester, 1988, at the University of North Texas.
19
20
Instruments
The instruments chosen for use in measuring economic
cognition were two versions, each with 14 items, selected
from the Joint Council on Economic Education's Revised Test
of Understanding College Economics (RTUCE) (Saunders, 1981).
The RTUCE was designed for use with subjects in a principles
of economics course; either microeconomics, macroeconomics,
or a combination. The RTUCE consists of three separate
tests? one on microeconomics, one on macroeconomics, and the
third is a hybrid micro-macro examination particularly
useful for one-semester introductory courses. For this
study, 14 items were chosen from the microeconomics test for
measuring cognition in students taking microeconomics, and
14 items were chosen from the macroeconomics test for
measuring cognition in students taking macroeconomics (see
Appendix). The 14 questions on each test were selected by a
committee at the University of North Texas and correspond to
concepts taught in principles of economics courses at the
University of North Texas.
The Revised Test of Understanding College Economics has
been normed. Norming data were collected for two versions
of the microeconomics test and two versions of the
macroeconomics test. A sample of 1,163 was used in norming
Version A of the Macroeconomics Test which reported a Kuder-
Richardson 20 reliability coefficient of .81. A sample of
1,108 was used in norming Version B of the Macroeconomics
21
Test which reported a Kuder-Richardson 20 reliability
coefficient of .76. A sample of 1,447 was used in norming
Version A of the Microeconomics Test which reported a Kuder-
Richardson 20 reliability coefficient of .74. Finally, a
sample of 1,364 was used in norming Version B of the
Microeconomics Test which reported a Kuder-Richardson 2 0
reliability coefficient of .73,, In summary, the range of
the samples used in norming these tests was 1,108 to 1,447
and the range of the Kuder-Richardson 20 reliability
coefficients reported was .73 to .81 (p. 21).
In this study, a reliability coefficient of .29 was
obtained for the 14-item microeconomic pretest and postest.
A reliability coefficient of .39 was obtained for the 14-
item macroeconomic pretest and posttest.
Content validity of the Resvised Test of Understanding
College Economics (RTUCE) was established by a test revision
committee (p. 1). This test revision committee, consisting
of Rendigs Fels, Vanderbilt University; Phillip Saunders,
Indiana University; and Arthur Welsh, Joint Council on
Economic Education, was advised and counseled by a special
advisory committee.
The first step in the TUCE revision "was to mail a
letter of inquiry to some fifty economists who were actively
involved in the teaching of introductory economics and who
were familiar with the original TUCE" (p. 1). They received
3 0 detailed responses, suggesting changes in the content of
22
the RTUCE. From these suggestions the test revision
committee began developing the RTUCE by citing fixed-weight
content categories. The weights represented the number of
questions in each category. The weights "are designed to
reflect the subject matter emphasis of the 'typical' two-
semester introductory economics sequence at most U. S.
colleges and universities" (p. 2). Through the development
of the RTUCE detailed norming data were collected on each
question. As a result researchers or instructors can
construct special purpose, variable-weight tests that are
better than other tests they may construct.
The establishment of content validity for the
macroeconomics test versions consisted of five content
categories: (a) measuring aggregate economic performance;
(b) aggregate supply, productive capacity, and economic
growth; (c) income and expenditure approach to aggregate
demand and fiscal policy; (d) monetary approach to aggregate
demand and monetary policy; and (e) policy combinations and
practical problems of stabilization policy. The
establishment of content validity for the microeconomics
test versions consisted of five content categories: (a) the
basic economic problem; (b) markets and the price mechanism;
(c) costs, revenue, profit maximization, and market
structure; (d) market failures, externalities, government
intervention and regulation; and (e) income distribution and
governmental redistribution (Saunders, 1981).
23
Content validity for the two, 14-item instruments used
in this study was established by a committee of economists
at the University of North Texas. The University of North
Texas economists chose the 14 items on each test based on
the content areas taught in the microeconomic and
macroeconomic courses.
The demographic questionnaire was administered at the
same time as the cognitive test. Additional information
used to identify the course and section number were coded
immediately after the instrument was administered.
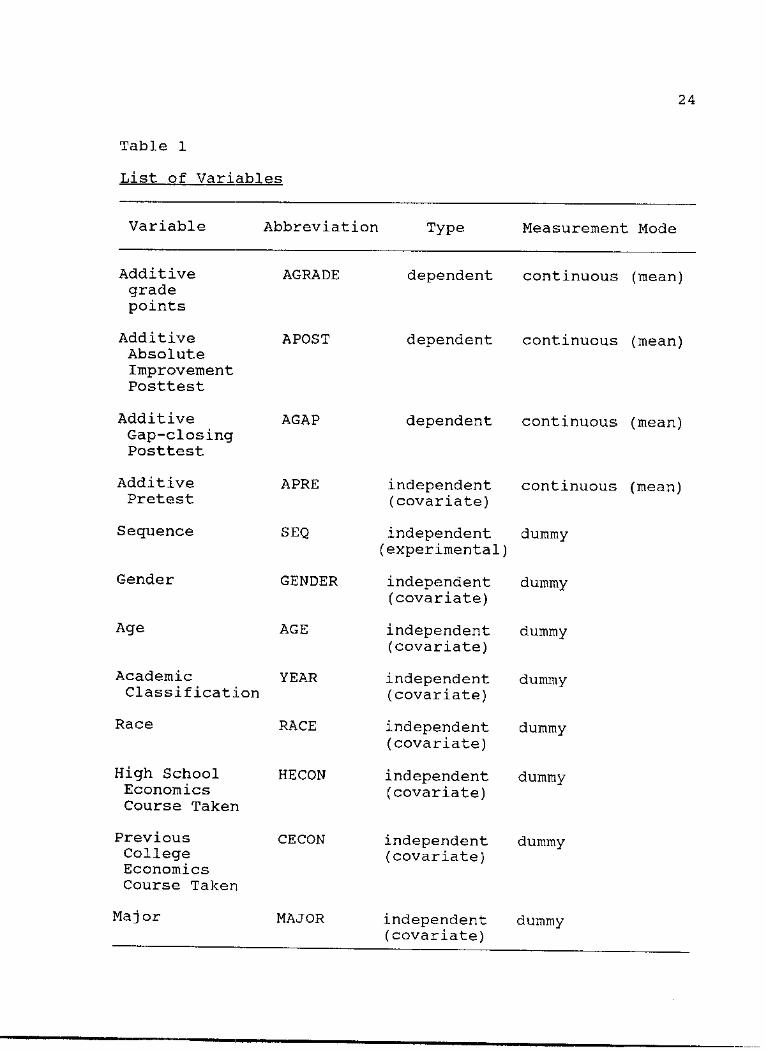
Variables
The variables used in the research are identified in
Table l.
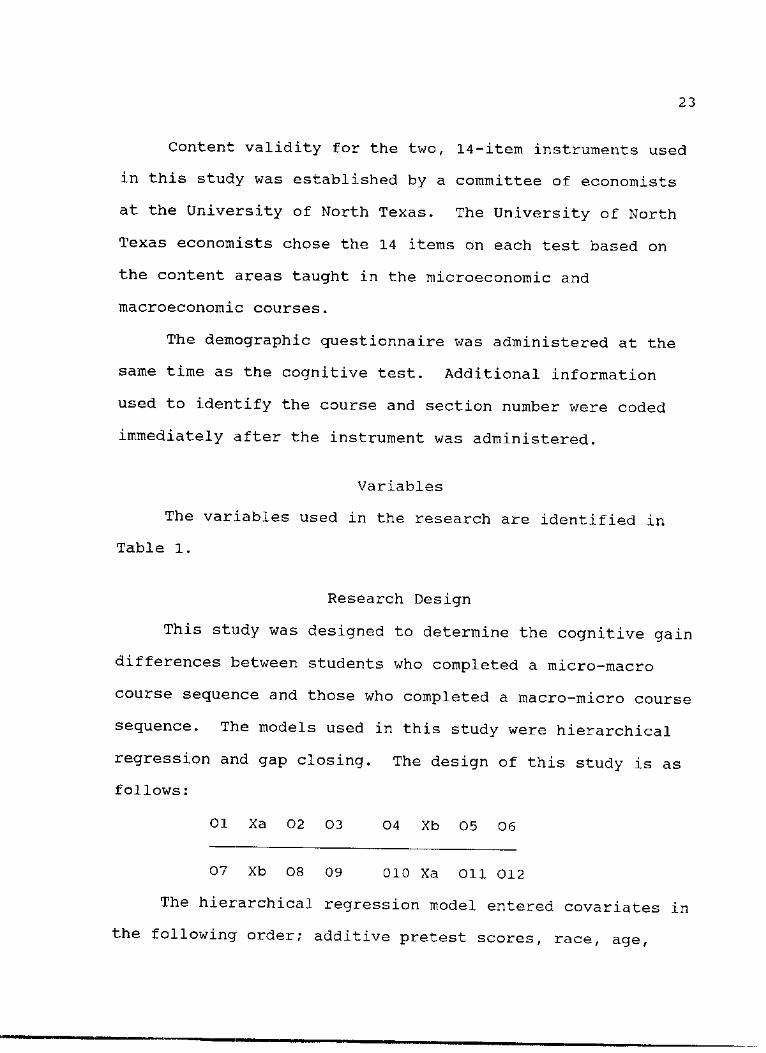
Research Design
This study was designed to determine the cognitive gain
differences between students who completed a micro-macro
course sequence and those who completed a macro-micro course
sequence. The models used in this study were hierarchical
regression and gap closing. The design of this study is as
follows:
01 Xa 02 03 04 Xb 05 06
07 Xb 08 09 010 Xa Oil 012
The hierarchical regression model entered covariates in
the following order; additive pretest scores, race, age,
24
Table 1
List of Variables
Variable Abbreviation Type Measurement Mode
Additive grade points
AGRADE dependent continuous (mean)
Additive Absolute Improvement Posttest
APOST dependent continuous (mean)
Additive Gap-closing Posttest
AGAP dependent continuous (mean)
Additive Pretest
APRE independent (covariate)
continuous (mean)
Sequence SEQ independent (experimental)
dummy
Gender GENDER independent (covariate)
dummy
Age AGE independent (covariate)
dummy
Academic Classification
YEAR independent (covariate)
dummy
Race RACE independent (covariate)
dummy
High School Economics Course Taken
HECON independent (covariate)
dummy
Previous College Economics Course Taken
CECON independent (covariate)
dummy
Major MAJOR independent (covariate)
dummy
25
gender, high school economics course taken, previous college
economics course taken, major and academic classification.
After entering the covariates, the effect of sequencing was
entered. Entering the covariates first yields the unique
variance of sequencing related to cognitive gain.
The hierarchical regression model was utilized in five
parts. First, to test the hypothesis of the dependent
variable, cognitive gain from additive grade points, the
additive pretest scores were included as a covariate in the
regression model. The effects of the additive pretests,
socio-demographics and sequencing yielded the unique
variance on each as they were entered as covariates into the
regression model and related them to the dependent variable
of cognitive gain due to additive grade points.
Second, the additive posttest scores minus the additive
pretest scores became the dependent variable, known as the
additive absolute improvement posttest score. For this
second model, additive pretest scores and socio-demographics
were added to the regression equation as covariates prior to
the effect of sequencing. The yield was the unique variance
of sequencing as related to cognitive gain from additive
absolute improvement posttest scores.
Third, the gap-closing model was used with the posttest
scores. This model allowed the; researcher to look at the
percentage gains on the additive posttest. These percentage
gains then became the dependent variable and the regression
26
model was again employed using the same covariates described
above.
Fourth, the microeconomic gap-closing model was used
with the microeconomic posttest scores. This model allowed
the researcher to look at the percentage gains on the
microeconomic posttest. These percentage gains became the
dependent variable, and the regression model was again
employed using the same covariates.
Fifth, the macroeconomic gap-closing model was used
with the macroeconomic posttest scores. This model allowed
the researcher to look at the percentage gains on the
macroeconomic posttest. These percentage gains became the
dependent variable, and the regression model was again
employed using the same covaricites.
Each of the three models were analyzed by the covariate
of academic classification as a dummy coded variable. This
allowed the effect of freshmen versus others (sophomores,
juniors, and seniors) to be analyzed with each of the
models. This was accomplished by dummy coding freshmen as
zero and others as one and interacting this variable with
sequence.
The reason for having three dependent variables was to
fully test all possibilities. Because it was not known
which dependent variable actually gave the best measure of
cognitive gain, it was important to explore all
possibilities.
27
This model was weak in controlling for interaction of
testing and X, interacting and selection of X, and reactive
arrangements sources of external validity (Campbell &
Stanley, 1972). The X variable in the previous sentence
represents the intrusion of either the microeconomics course
or the macroeconomics course.
To control for the interaction of testing and X, each
student was given a pretest. Pretesting can cause students
to be sensitized to the questions. Each student was given a
pretest in this study, therefore, each student became
equally exposed to the same questions, removing the threat
of some students being exposed while others were not. In
generalizing to the population it becomes necessary to
restrict the prediction to students who were pretested.
To control for the interacting and selection of X, no
statistical control needed to be done. Students in the
study received the same basic economic instruction whether
they were taking microeconomics or macroeconomics. Both the
microeconomics and macroeconomics courses assume a zero
knowledge base at the beginning of each semester.
Differences in instructors, however, cannot be fully
controlled, even though the course syllabus and examinations
were departmentalized. In generalizing to the population,
the idea of a zero knowledge base at the start of each
course, a departmental syllabus, and departmental
examinations need to be cited.
28
Collection of Data
Following a meeting with the Economics Department
Chairman, all instructors of Economics 1100 (Principles of
Microeconomics) and Economics 1110 (Principles of
Macroeconomics) agreed to participate in the process for
data collection. Each class was scheduled for data
collection during the first week of class (pretest), and the
week preceding final examinations (posttest). Each
instructor was given a packet to use in administering the
pretests and posttests. These packets contained a
description of the study for the students, provision for the
student to request a copy of the findings, a copy of the
cognitive instrument for each student, a computerized answer
sheet, and pencils for recording answers (Appendix). These
packets were distributed to instructors 15 minutes before
class and collected immediately after administration.
The data collected for this project contained
cognition, attitudinal, and demographic responses. For the
purpose of this study only data collected on cognition and
demographics were utilized. The attitudinal instrument
utilized in data gathering had no established reliability or
validity and, therefore, was not used in this study.
Procedure for Analysis of Data
When all instruments had been scored, data for each
subject were combined in order of fall, 1987 and spring,
29
1988. The social security number of each student was coded
by a university faculty member who was not associated with
the department in order to guarantee student anonymity.
Hierarchical regression was used with each dependent
variable. The hierarchical regression analysis was examined
by dummy coding the covariates. An F-test was done on each
R-Square to determine the level of significance for the
difference between means of students completing the micro-
macro sequence and those completing the macro-micro
sequence. If a significant F was found then individual t-
tests were done on the hypotheses. The interpretation of
the significance obtained was verified by Cohen and Cohen
(1983, p. 51).
Testing of Hypotheses
The general hypothesis, that students who complete
microeconomics instruction followed by macroeconomics
instruction sequence will have significantly higher
cognitive gains than students who complete a macroeconomics
instruction followed by a microeconomics instruction
sequence, was tested using a t-test as explained by Cohen
and Cohen (p. 52). This was accomplished by setting up the
regression model using dummy coding. Students who completed
the micro-macro sequence received a code of one and students
who completed the macro-micro sequence received a code of
zero. When the difference between sequence means was
30
obtained the t-value was examined. It was predetermined
that the t-value should be positive and significant at the
.05 level for the hypothesis to be true. This was a one-
tailed t-test. The one-tailed t-test was calculated for
sub-hypotheses 1, 2 and 3.
Sub-hypothesis 4 was tested using dummy coding and
comparing the means of freshman to others (seniors, juniors
and sophomores). This was accomplished by coding seniors,
juniors and sophomores as a one and placing them into a
single category of other. The freshmen were coded with a
zero. The regressions were analyzed with the dummy coding
of academic classification. When the difference between
sequence means was obtained the t-value was examined. It
was predetermined that the t-value should be significant at
the .05 level for the hypothesis to be true. This was a
two-tailed t-test because there was no evidence in the
research to verify a direction.
After testing the stated hypotheses, interaction
effects were explored. This exploration provided further
explanation of the differences between means.
CHAPTER 4
ANALYSIS OF THE DATA
Introduction
The hypotheses were tested using five models. The
first model was the AGRADE model, where the additive grade
point was the dependent variable. The second model was the
ABPOST model, where the additive absolute improvement
posttest score was the dependent variable. The third model
was the GAP model, where the gap score was the dependent
variable. The fourth model was a microeconomic GAP model,
where the microeconomics gap score was the dependent
variable. The fifth model was a macroeconomic GAP model,
where the macroeconomic gap score was the dependent
variable.
Each of the models entered nine covariates into the
hierarchical regression prior to entering the experimental
variable of sequence. The multiple regression including
sequence is reported for each model. Each regression model
tested the interactions of sequence with each of the
covariates. Significant interactions for each model are
reported.
31
32
AGRADE Model
The summary of the multiple regression analysis of the
dependent variable AGRADE is reported in Table 2. The
independent variables are listed in order of entry.
The variables APRE and ABPOST were statistically
significant. This finding reflects that students' additive
pretest scores are strong indicators of the grades they will
receive in each course. In addition, the additive absolute
improvement posttest scores are highly correlated with
course grades. This finding is consistent with the
literature.
Sequence, the experimental variable, was not
significant. Interactions for all of the independent
variables with sequence were calculated. None of the
interactions were significant.
ABPOST Model
The summary of the multiple regression analysis of the
dependent variable ABPOST is reported in Table 3. The
independent variables are listed in order of entry.
The variables APRE and AGRADE were statistically
significant. This finding reflects that the lower students'
additive pretest scores the higher their additive absolute
improvement posttest scores in microeconomics and
macroeconomics. This finding is not consistent with the
literature. The additive absolute improvement posttest
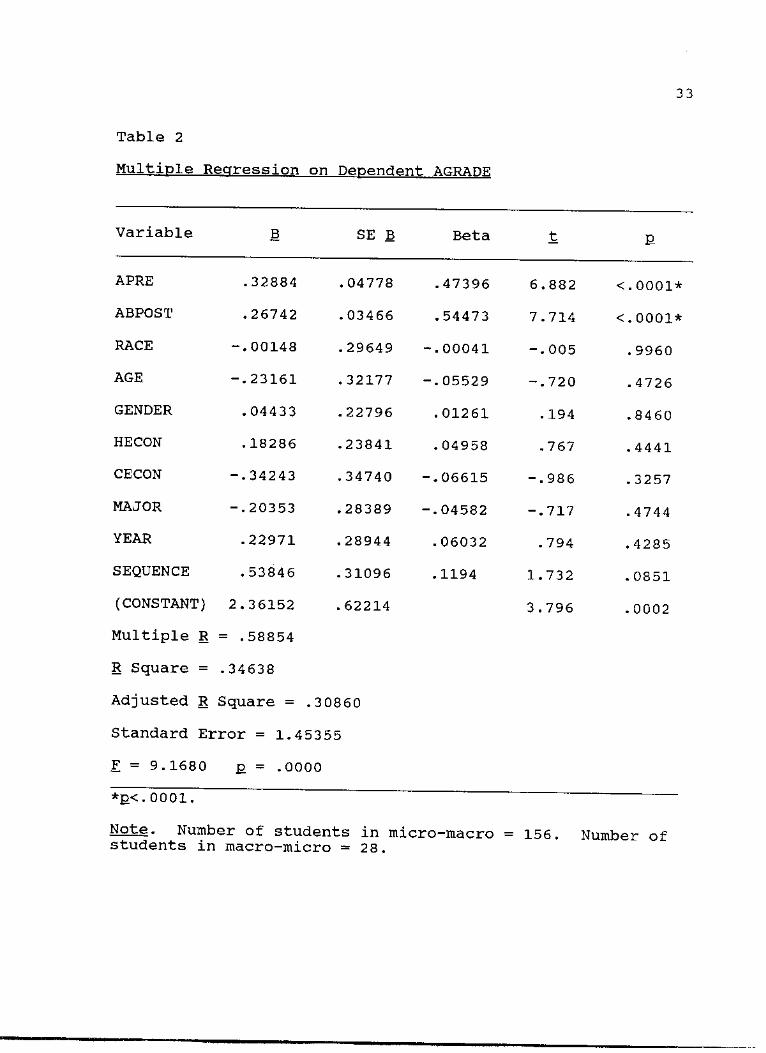
Table 2
Multiple Regression on Dependent AGRADE
33
Variable B SE B Beta
APRE .32884 .04778 .47396 6.882 <.0001*
ABPOST .26742 . 03466 .54473 7.714 <.0001*
RACE -.00148 .29649 -.00041 -.005 .9960
AGE -.23161 .32177 -.05529 -.720 .4726
GENDER .04433 .22796 .01261 . 194 .8460
HECON .18286 .23841 .04958 .767 .4441
CECON -.34243 .34740 -.06615 -.986 .3257
MAJOR -.20353 .28389 -.04582 -.717 .4744
YEAR .22971 .28944 .06032 .794 .4285
SEQUENCE .53846 .31096 .1194 1.732 .0851
(CONSTANT) 2.36152 .62214 3.796 . 0002
Multiple R = .58854
R Square = .34638
Adjusted R Square = .30860
Standard Error = 1.45355
F = 9.1680 E = .0000
*£<.0001.
Note. Number of students in micro-macro students in macro-micro = 28.
= 156. Number of
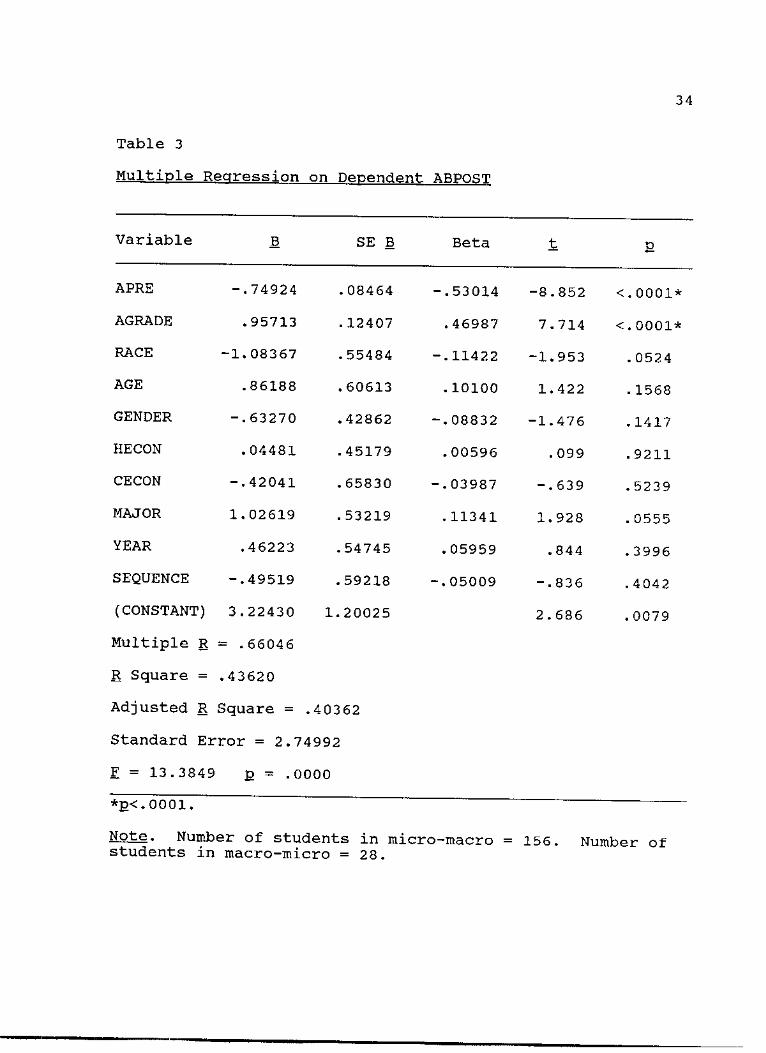
Table 3
Multiple Regression on Dependent ABPOST
34
Variable B SE B Beta
APRE -.74924 .08464 -.53014 -8.852 <•0001*
AGRADE .95713 .12407 .46987 7.714 <.0001*
RACE -1.08367 .55484 -.11422 -1.953 . 0524
AGE .86188 .60613 .10100 1.422 .1568
GENDER -.63270 .42862 -.08832 -1.476 . 1417
HECON .04481 .45179 .00596 .099 .9211
CECON -.42041 .65830 -.03987 -.639 .5239
MAJOR 1.02619 .53219 .11341 1.928 . 0555
YEAR .46223 .54745 .05959 .844 . 3996
SEQUENCE -.49519 .59218 -.05009 -.836 .4042
(CONSTANT) 3.22430 1.20025 2.686 . 0079
Multiple R = .66046
R Square = .43620
Adjusted R Square = .40362
Standard Error = 2.74992
F = 13.3849 . 0 0 0 0
*£<.0001.
Note. Number of students in micro-students in macro-micro = 28.
•macro = 156. Number of
35
scores were significantly influenced by additive grade
points.
The main effect of sequence, the experimental variable,
was not significant. Interactions for all independent
variables with sequence were calculated. One interaction,
sequence and previous high school economics,
was significant at pc.06. The multiple regression of the
interaction appears in Table 4.
The interaction of sequence and previous high school
economics was statistically significant. The main effect
variables were not recognized in Table 4 because of the
effect of the interaction variable.
The analysis of the interaction of sequence and
previous high school economics is reported in Table 5. The
values reflected in the cells of Table 5 are the corrected
means.
The cell reflecting the code zero and zero in Table 5
determines the reason for the interaction significance. The
zero and zero cell contains students who did not have high
school economics and were in the sequence of macroeconomics
followed by microeconomics. Students who did not have high
school economics and were in the sequence of macroeconomics
followed by microeconomics had higher additive absolute
improvement posttest scores than other students.
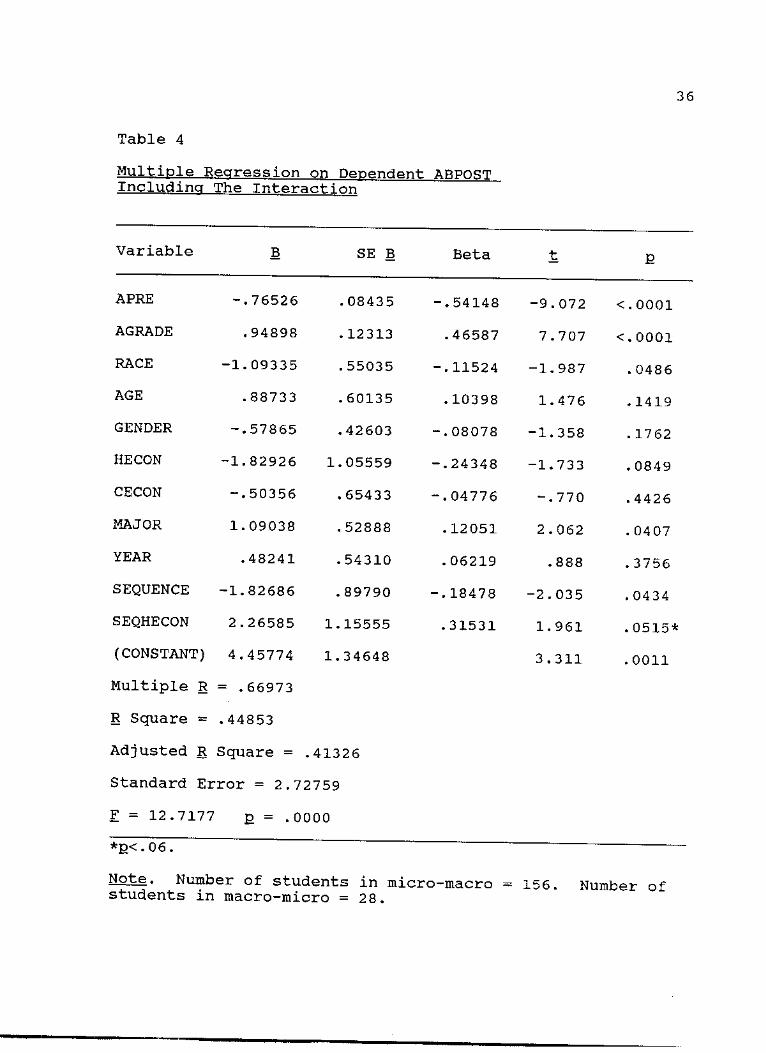
36
Table 4
Multiple Regression on Dependent ABPOST Including The Interaction
Variable B SE B Beta
APRE -.76526 .08435 -.54148 -9. ,072 <•0001
AGRADE .94898 .12313 .46587 7. .707 <.0001
RACE -1.09335 .55035 -.11524 -1. 987 . 0486
AGE .88733 .60135 .10398 1. 476 . 1419
GENDER -.57865 .42603 -.08078 -1. 358 .1762
HE CON -1.82926 1.05559 -.24348 -1. 733 . 0849
CECON -.50356 .65433 -.04776 • 770 .4426
MAJOR 1.09038 .52888 .12051 2 . 062 .0407
YEAR .48241 .54310 .06219 . 888 .3756
SEQUENCE -1.82686 .89790 -.18478 -2. 035 .0434
SEQHECON 2.26585 1.15555 .31531 1. 961 .0515*
(CONSTANT) 4.45774 1.34648 3. 311 . 0011
Multiple R = .66973
R Square = .44853
Adjusted R Square = .41326
Standard Error = 2.72759
F = 12.7177 E = .0000
* E < . 0 6 .
Note. Number of students in micro students in macro-micro = 28.
-macro = 156. Number of
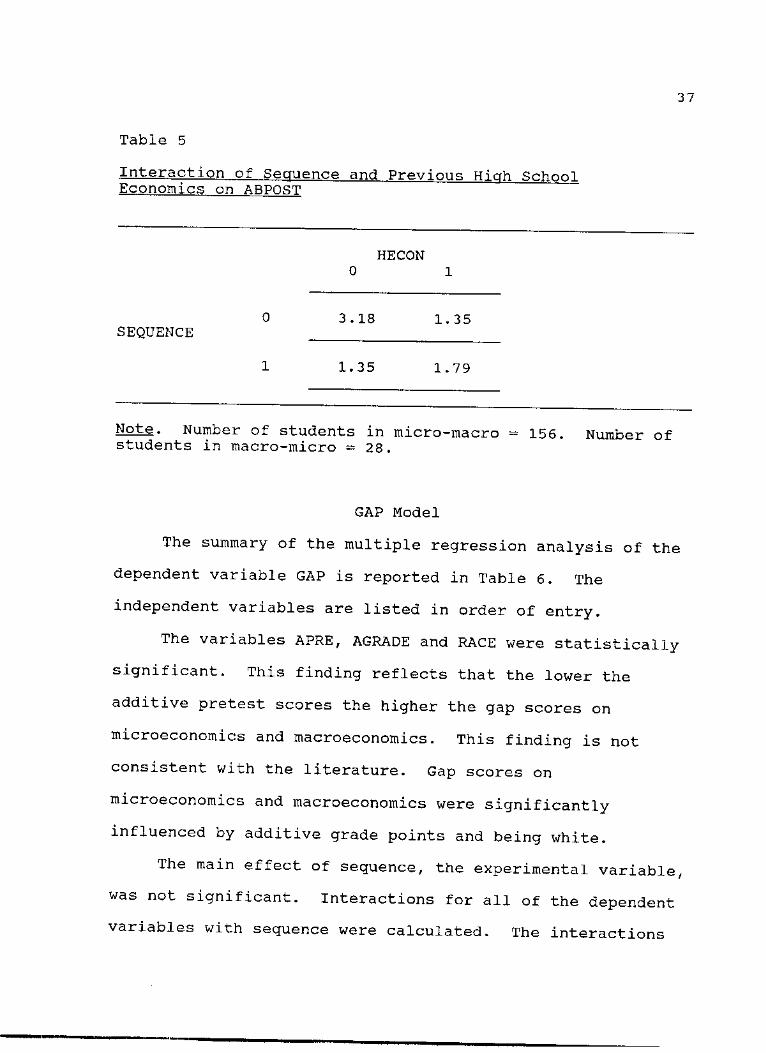
37
Table 5
Interaction of Sequence and Previous High School Economics on ABPOST
HECON 0 1
SEQUENCE 3.18 1.35
1.35 1.79
Note. Number of students in micro-macro = 156. Number of students in macro-micro = 28.
GAP Model
The summary of the multiple regression analysis of the
dependent variable GAP is reported in Table 6. The
independent variables are listed in order of entry.
The variables APRE, AGRADE and RACE were statistically
significant. This finding reflects that the lower the
additive pretest scores the higher the gap scores on
microeconomics and macroeconomics. This finding is not
consistent with the literature. Gap scores on
microeconomics and macroeconomics were significantly
influenced by additive grade points and being white.
The main effect of sequence, the experimental variable,
was not significant. Interactions for all of the dependent
variables with sequence were calculated. The interactions
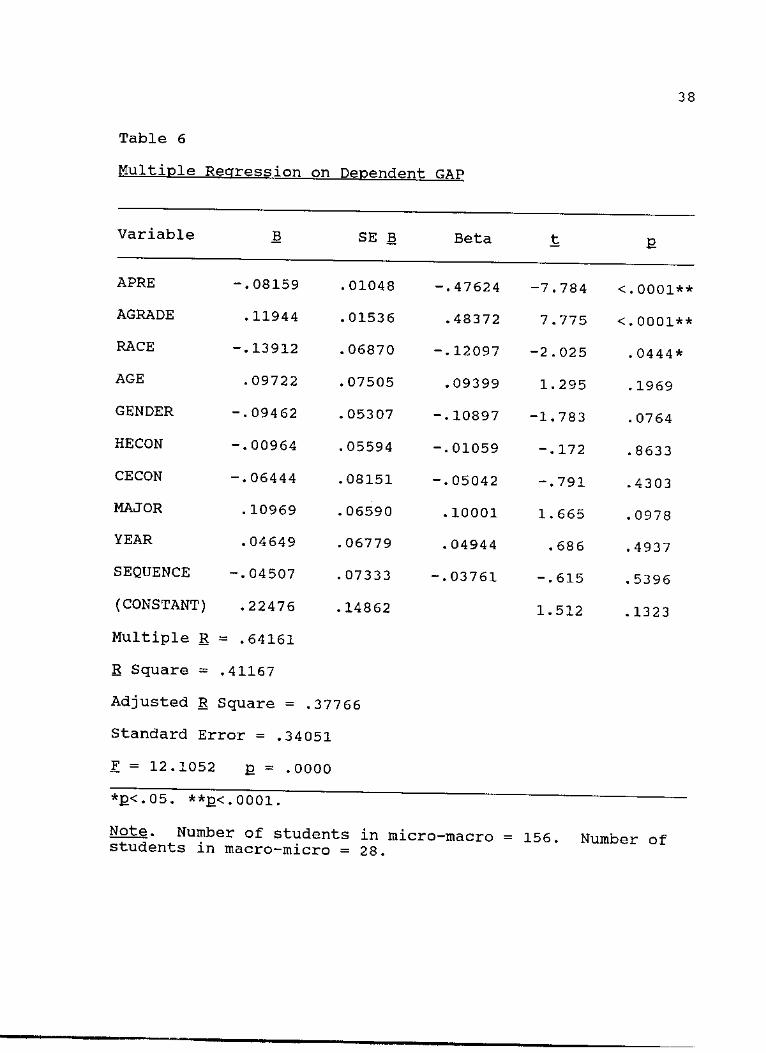
Table 6
Multiple Regression on Dependent GAP
38
Variable B SE B Beta t E
APRE -.08159 .01048 -.47624 -7.784 <.0001**
AGRADE .11944 .01536 .48372 7.775 <.0001**
RACE -.13912 .06870 -.12097 -2.025 .0444*
AGE .09722 .07505 .09399 1.295 .1969
GENDER -.09462 .05307 -.10897 -1.783 .0764
HE CON -.00964 .05594 -.01059 -.172 .8633
CECON -.06444 .08151 -.05042 -.791 .4303
MAJOR .10969 .06590 .10001 1.665 . 0978
YEAR .04649 .06779 .04944 . 686 .4937
SEQUENCE -.04507 .07333 -.03761 -.615 . 5396
(CONSTANT) .22476 .14862 1.512 . 1323
Multiple R = .64161
R Square = .41167
Adjusted R Square = .37766
Standard Error = .34051
F = 12.1052 g = .0000
*E<. 05. **]D< .0001.
Note. Number of students in micro students in macro-micro = 28.
-macro = 156. Number of
39
of sequence and previous high school economics; and sequence
and previous college economics were both significant at
E<•05.
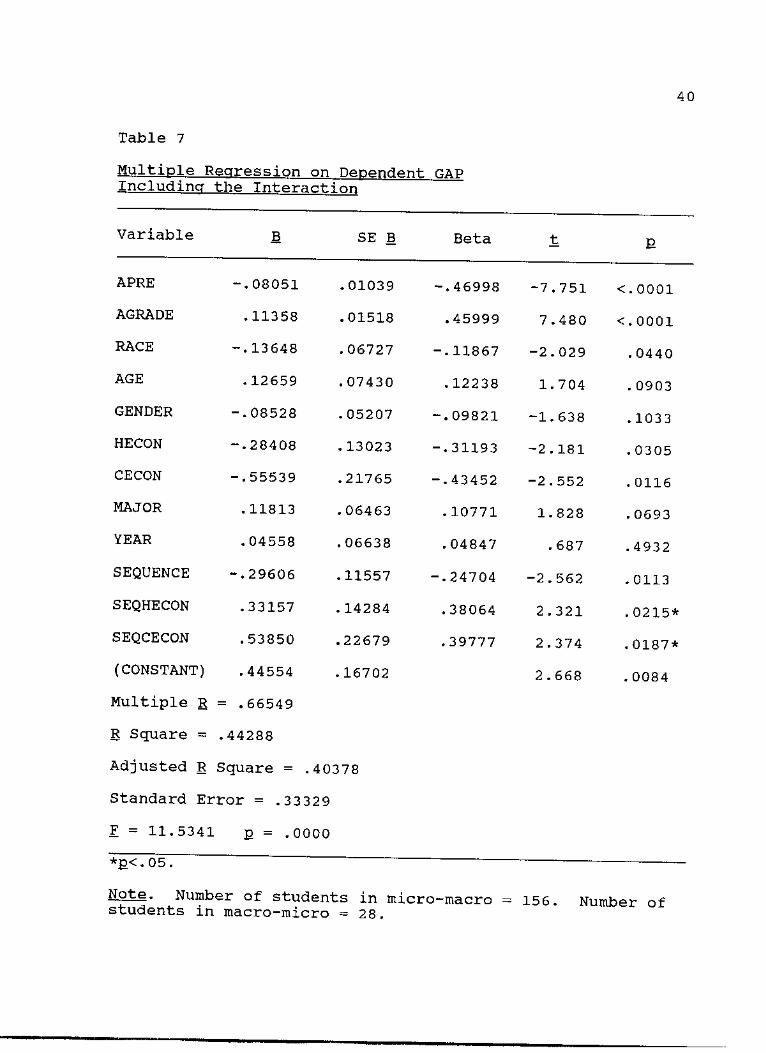
The multiple regression of the interaction of sequence
with previous high school economics and the interaction of
sequence with previous college economics are reported in
Table 7. These interactions were significant at £<.05.
The interaction of sequence and previous high School
economics was statistically significant. In addition, the
interaction of sequence and previous college economics was
statistically significant. The main effect variables were
not recognized in Table 7 because of the effect of the
interaction variables.
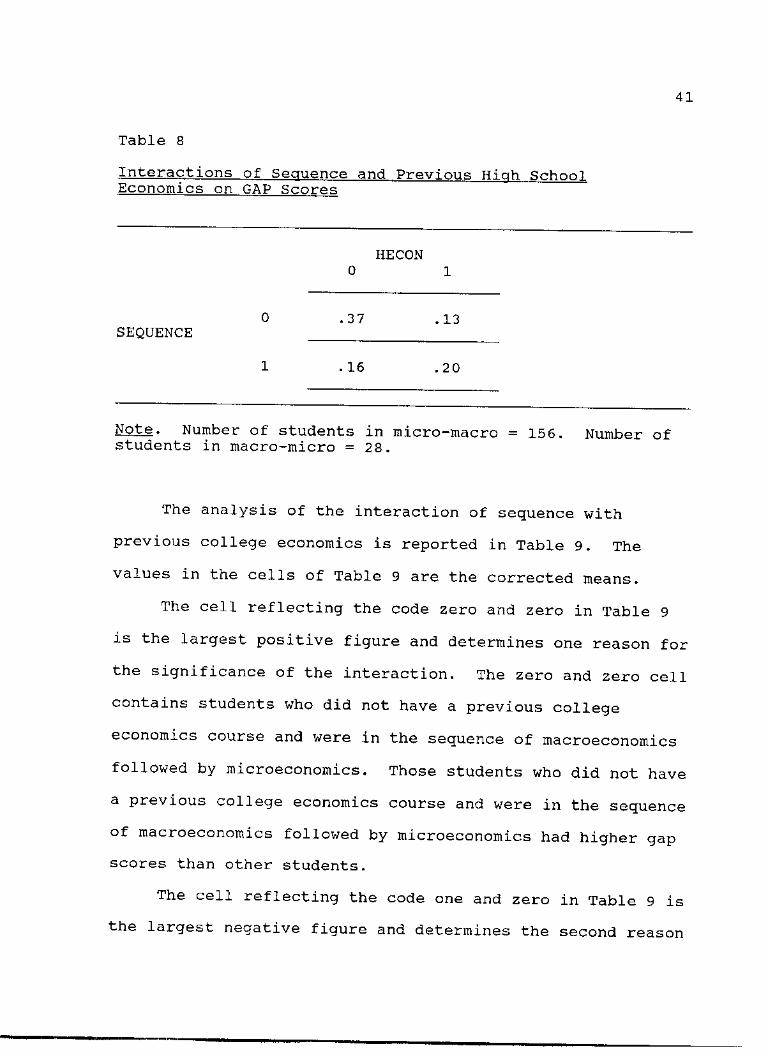
The analysis of the interaction of sequence and
previous high school economics is reported in Table 8. The
values in the cells of Table 8 are the corrected means.
The cell reflecting the code zero and zero in Table 8
determines the significance of the interaction. The zero
and zero cell contains students who did not have high school
economics and were in the sequence of macroeconomics
followed by microeconomics. Students who did not have high
school economics and were in the sequence of macroeconomics
followed by microeconomics had higher gap scores than other
students.
40
Table 7
Multiple Regression on Dependent GAP Including the Interaction
Variable B SE B Beta
Multiple R = .66549
R Square = .44288
Adjusted R Square = .40378
Standard Error = .33329
F = 11.5341 £ = .0000
*£<.05.
APRE -.08051 .01039 -.46998 -7, .751 <.0001
AGRADE .11358 .01518 .45999 7. .480 <.0001
RACE -.13648 .06727 -.11867 -2. , 029 .0440
AGE .12659 .07430 .12238 1. .704 . 0903
GENDER -.08528 .05207 -.09821 -1. 638 . 1033
HECON -.28408 .13023 -.31193 -2. 181 . 0305
CECON -.55539 .21765 -.43452 -2. 552 .0116
MAJOR .11813 .06463 .10771 1. 828 .0693
YEAR .04558 .06638 .04847 . 687 .4932
SEQUENCE -.29606 .11557 -.24704 -2. 562 . 0113
SEQHECON .33157 .14284 .38064 2 . 321 .0215*
SEQCECON .53850 .22679 .39777 2. 374 .0187*
(CONSTANT) .44554 .16702 2. 668 . 0084
Note. Number of students in micro-students in macro-micro = 28.
•macro = 156. Number of
41
Table 8
Interactions of Sequence and Previous High School Economics on GAP Scores
SEQUENCE
HECON 0 1
0 .37 . 13
1 .16 .20
Note. Number of students in micro-macro = 156. Number of students in macro-micro = 28.
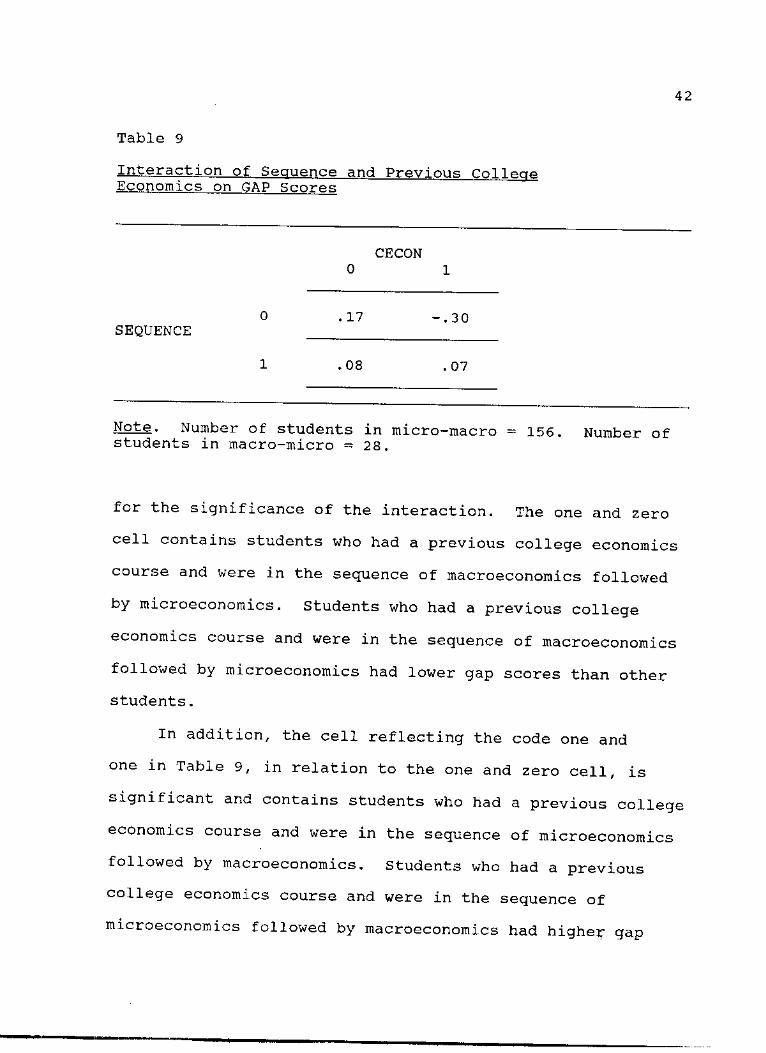
The analysis of the interaction of sequence with
previous college economics is reported in Table 9. The
values in the cells of Table 9 are the corrected means.
The cell reflecting the code zero and zero in Table 9
is the largest positive figure and determines one reason for
the significance of the interaction. The zero and zero cell
contains students who did not have a previous college
economics course and were in the sequence of macroeconomics
followed by microeconomics. Those students who did not have
a previous college economics course and were in the sequence
of macroeconomics followed by microeconomics had higher gap
scores than other students.
The cell reflecting the code one and zero in Table 9 is
the largest negative figure and determines the second reason
42
Table 9
Interaction of Sequence and Previous College Economics on GAP Scores
SEQUENCE
CECON 0 1
0 . 17 -.30
1 .08 . 07
Note. Number of students in micro-macro = 156. Number of students in macro-micro = 28.
for the significance of the interaction. The one and zero
cell contains students who had a previous college economics
course and were in the sequence of macroeconomics followed
by microeconomics. Students who had a previous college
economics course and were in the sequence of macroeconomics
followed by microeconomics had lower gap scores than other
students.
In addition, the cell reflecting the code one and
one in Table 9, in relation to the one and zero cell, is
significant and contains students who had a previous college
economics course and were in the sequence of microeconomics
followed by macroeconomics. Students who had a previous
college economics course and were in the sequence of
microeconomics followed by macroeconomics had higher gap
43
scores than students who had a previous college economics
course and were in the sequence of macroeconomics followed
by microeconomics.
Microeconomic GAP Model
The macroeconomic data were removed from the GAP model
to examine the effect of microeconomics taken first or
second. The summary of the microeconomic multiple
regression analysis of the dependent variable GAP is
reported in Table 10. The independent variables are listed
in order of entry.
The variables PRE and GRADE were statistically
significant. This finding reflects that the lower the
pretest score the higher the microeconomic gap score. This
finding is not consistent with the literature. In addition,
the higher the microeconomic grade the higher the
microeconomic gap score.
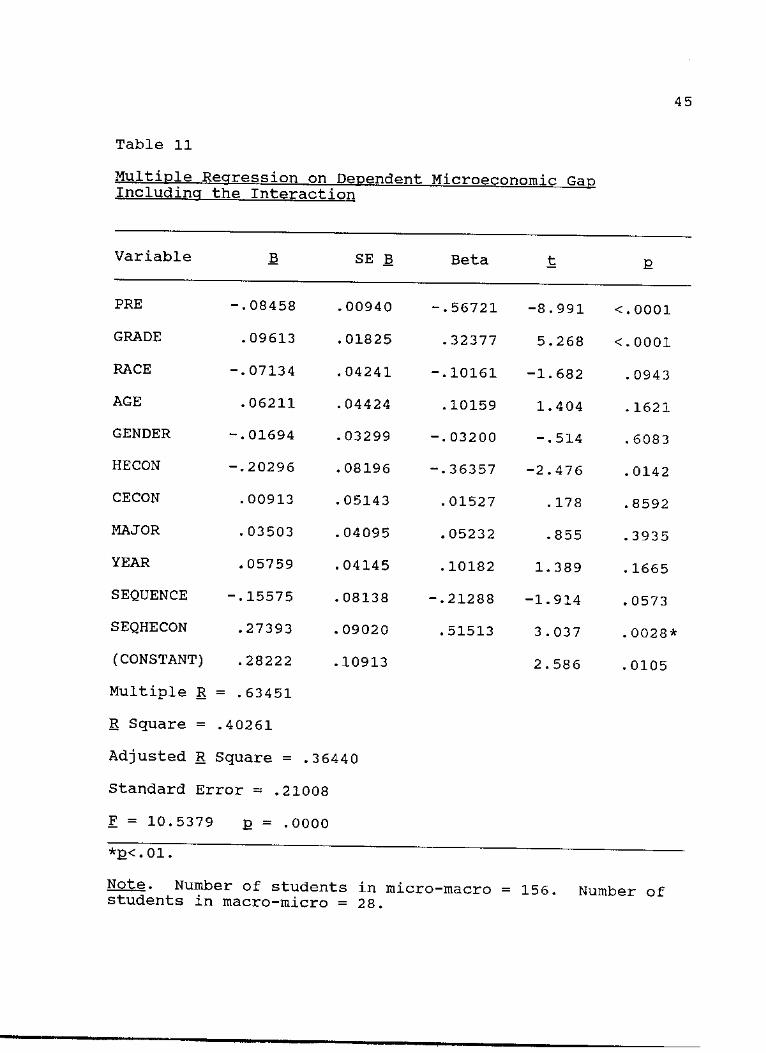
Sequence, the experimental variable, was not
significant. Interactions for all of the independent
variables with sequence were calculated. One interaction,
sequence and previous high school economics, was significant
p<»01. The multiple regression of the interaction
appears in Table 11.
The interaction of sequence and previous high school
economics was statistically significant. The main effect
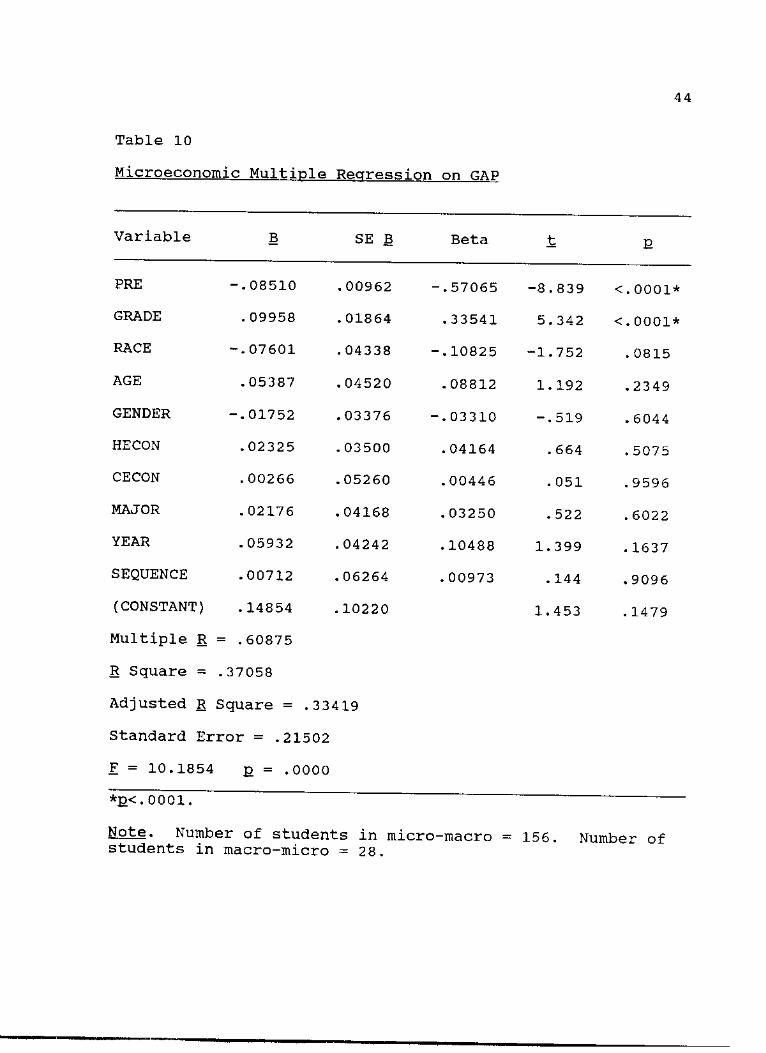
Table 10
Microeconomic Multiple Regression on GAP
44
Variable B SE B Beta
PRE -.08510 .00962 -.57065 -8.839 <.0001*
GRADE .09958 .01864 .33541 5. 342 <.0001*
RACE -.07601 .04338 -.10825 -1.752 . 0815
AGE .05387 .04520 .08812 1.192 .2349
GENDER -.01752 .03376 -.03310 -.519 .6044
HECON .02325 .03500 .04164 . 664 . 5075
CECON .00266 .05260 .00446 . 051 .9596
MAJOR .02176 .04168 .03250 .522 . 6022
YEAR .05932 .04242 .10488 1.399 . 1637
SEQUENCE .00712 .06264 .00973 . 144 .9096
(CONSTANT) .14854 .10220 1.453 . 1479
Multiple R = .60875
R Square = .37058
Adjusted R Square = .33419
Standard Error = .21502
F = 10.1854 £ = .0000
*£<.0001.
Note. Number of students in micro students in macro-micro = 28.
-macro = 156. Number of
45
Table 11
Multiple Regression on Dependent Microeconomic Gap Including the Interaction
Variable B SE B Beta E
PRE -.08458 .00940 -.56721 -8. ,991 <.0001
GRADE .09613 .01825 .32377 5. 268 <.0001
RACE -.07134 .04241 -.10161 -1. 682 . 0943
AGE .06211 .04424 .10159 1. 404 . 1621
GENDER -.01694 .03299 -.03200 514 .6083
HECON -.20296 .08196 -.36357 -2 . 476 . 0142
CECON .00913 .05143 .01527 . 178 .8592
MAJOR .03503 .04095 .05232 • 855 .3935
YEAR .05759 .04145 .10182 1. 389 . 1665
SEQUENCE -.15575 .08138 -.21288 -1. 914 . 0573
SEQHECON .27393 .09020 .51513 3 . 037 .0028*
(CONSTANT) .28222 .10913 2 . 586 .0105
Multiple R = .63451
R Square = .40261
Adjusted R Square = .36440
Standard Error = .21008
F = 10.5379 £ - .0000
*E<.01.
Note. Number of students in micro students in macro-micro = 28.
-macro = 156. Number of

46
variables were not recognized in Table 11 because of the
effect of the interaction variable.
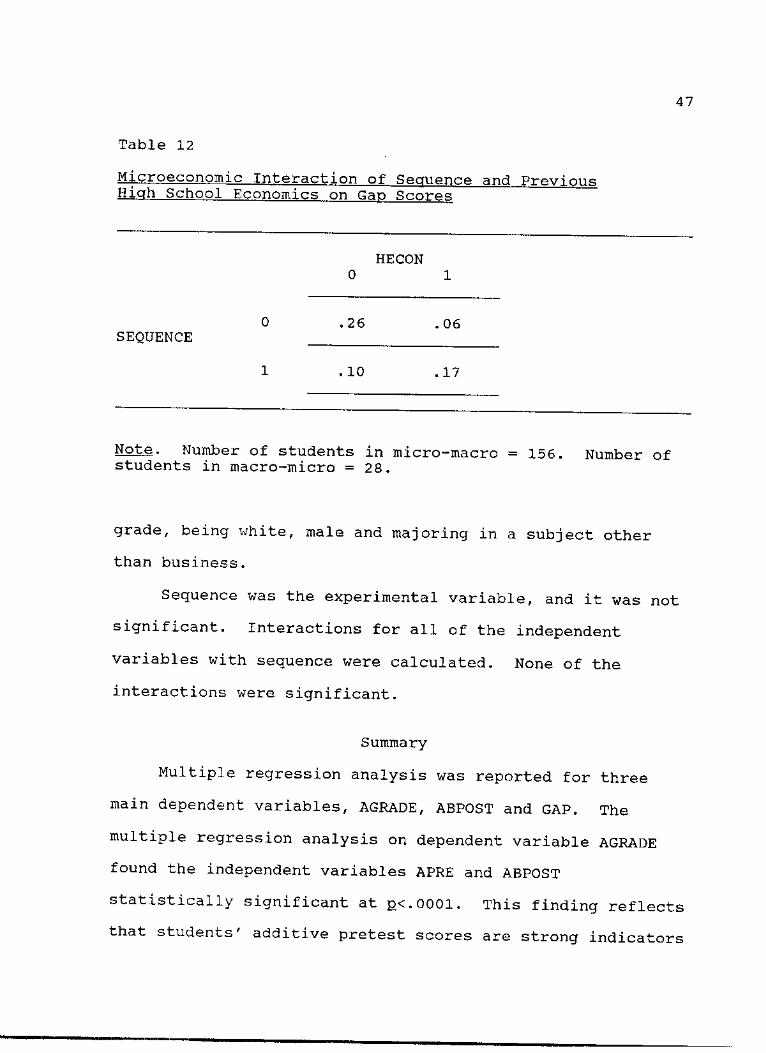
The analysis of the interaction of sequence and
previous high school economics is reported in Table 12. The
values in the cells in Table 12 are the corrected means.
The cell reflecting the code zero and zero in Table 12
determines the significance of the interaction. The zero
and zero cell contains students who did not have high school
economics and were in the sequence of macroeconomics
followed by microeconomics. Students who did not have high
school economics and were in the sequence of macroeconomics
followed by microeconomics had higher microeconomic gap
scores than other students.
Macroeconomics GAP Model
The microeconomic data were removed from the GAP model
to examine the effect of macroeconomics taken first or
second. The summary of the macroeconomics multiple
regression analysis of the dependent variable GAP is
reported in Table 13. The independent variables are listed
in order of entry.
The variables PRE, GRADE, RACE, GENDER and MAJOR were
statistically significant. This finding reflects that the
lower the macroeconomics pretest score the higher the
macroeconomic gap score. In addition, the macroeconomic gap
score was significantly influenced by the macroeconomic
47
Table 12
Microeconomic Interaction of Sequence and Previous High School Economics on Gap Scores
SEQUENCE
HECON 0 1
.26 . 06
. 10 . 17
Note. Number of students in micro-macro = 156. Number of students in macro-micro = 28.
grade, being white, male and majoring in a subject other
than business.
Sequence was the experimental variable, and it was not
significant. Interactions for all of the independent
variables with sequence were calculated. None of the
interactions were significant.
Summary
Multiple regression analysis was reported for three
main dependent variables, AGRADE, ABPOST and GAP. The
multiple regression analysis on dependent variable AGRADE
found the independent variables APRE and ABPOST
statistically significant at pc.OOOl. This finding reflects
that students' additive pretest scores are strong indicators
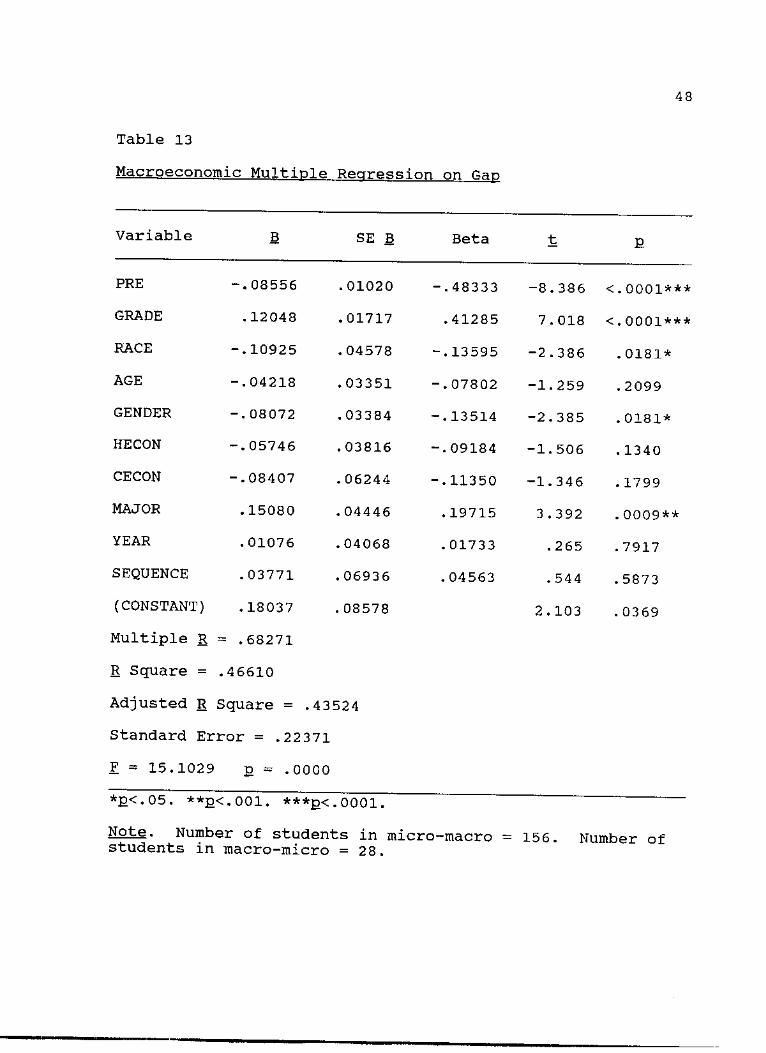
Table 13
Macroeconomic Multiple Regression on Gap
48
Variable B SE B Beta t E
PRE -.08556 .01020 -.48333 -8.386 <.0001***
GRADE .12048 .01717 .41285 7.018 <.0001***
RACE -.10925 .04578 -.13595 -2.386 .0181*
AGE -.04218 .03351 -.07802 -1.259 . 2099
GENDER -.08072 .03384 -.13514 -2.385 .0181*
HE CON -.05746 .03816 -.09184 -1.506 . 1340
CECON -.08407 .06244 -.11350 -1.346 . 1799
MAJOR .15080 .04446 .19715 3.392 . 0009**
YEAR .01076 .04068 .01733 .265 .7917
SEQUENCE .03771 .06936 .04563 .544 .5873
(CONSTANT) .18037 .08578 2 . 103 . 0369
Multiple R = .68271
R Square = .46610
Adjusted R Square = .43524
Standard Error = .22371
F = 15.1029 . 0 0 0 0
*E<. 05. **JD<.001. ***£<.0001.
Note. Number of students in micro-students in macro-micro = 28.
•macro = 156. Number of
49
of the grades they will receive in microeconomics and
macroeconomics. In addition, the additive absolute
improvement posttest scores are highly correlated with
microeconomic and macroeconomic course grades.
Sequence, the experimental variable, was not
significant. Interactions for all of the independent
variables with sequence were calculated. None of the
interactions were significant.
The multiple regression analysis on the dependent
variable ABPOST found the independent variables APRE and
AGRADE statistically significant at p<.0001. These findings
reflect that the lower the students' additive pretest scores
the higher their additive absolute improvement posttest
scores in microeconomics and macroeconomics. In addition,
the absolute improvement posttest score was significantly
influenced by additive grade points.
Sequence, the experimental variable, was not
significant. Interactions for all of the independent
variables with sequence were calculated. One interaction,
sequence and previous high school economics, was significant
at E<.06. This interaction finding reflects that students
who did not have high school economics and were in the
sequence of macroeconomics followed by microeconomics had
higher additive absolute improvement posttest scores on
microeconomics and macroeconomics.
50
The multiple regression analysis on the dependent
variable GAP found the independent variables APRE and AGRADE
statistically significant at pc.OOOl. In addition, the
independent variable RACE was statistically significant at
E<•05. These findings reflect that the lower the additive
pretest scores the higher the gap scores on microeconomics
and macroeconomics. In addition, the GAP scores on
microeconomics and macroeconomics were significantly
influenced by additive grade points and being white.
Sequence, the experimental variable, was not
significant. Interactions for all of the independent
variables with sequence were calculated. The interactions
of sequence and previous high school economics; and sequence
and previous college economics were significant at p<.05.
First, these findings reflect that students who did not have
high school economics and were in the sequence of
macroeconomics followed by microeconomics had higher gap
scores on microeconomics and macroeconomics. Second,
students who had not had a previous college economics course
and were in the sequence of macroeconomics followed by
microeconomics had higher gap scores on microeconomics and
macroeconomics. Third, students who had a previous college
economics course and were in the sequence of macroeconomics
followed by microeconomics had lower gap scores on
microeconomics and macroeconomics. Finally, students who
had a previous college economics course and were in the
51
sequence of microeconomics followed by macroeconomics had
higher gap scores than students who had a previous college
economics course and were in the sequence of macroeconomics
followed by microeconomics.
The multiple regression analysis was repeated twice by
separating the data into microeconomic data and
macroeconomic data. The dependent variable GAP was analyzed
with each set of data.
The microeconomic multiple regression analysis on the
dependent variable GAP found the independent variables PRE
and GRADE statistically significant at pc.OOOl. This
finding reflects that the lower the pretest score the higher
the microeconomic gap score. In addition, the higher the
microeconomic grade the higher the microeconomic gap score.
Sequence was the experimental variable, and was not
significant. Interactions for all of the independent
variables with sequence were calculated. One interaction,
sequence and previous high school economics, was significant
at E<•01. The interaction finding reflects that students
who did not have high school economics and were in the
sequence of macroeconomics followed by microeconomics had a
higher microeconomic gap score.
The macroeconomic multiple regression analysis on the
dependent variable GAP found the independent variables PRE
and GRADE statistically significant at pc.OOOl. MAJOR was
statistically significant at pc.OOl. In addition, the
52
independent variables RACE and GENDER were statistically
significant at g<.05. This finding reflects that the lower
the macroeconomics pretest score the higher the
macroeconomic gap score. In addition, the higher the
macroeconomic grade, along with being white, male and
majoring in a subject other than business, the higher the
macroeconomic gap score.
Sequence was the experimental variable, and was not
significant. Interactions for all of the independent
variables were calculated. None of the interactions were
significant.
CHAPTER 5
SUMMARY, DISCUSSION, CONCLUSIONS,
RECOMMENDATIONS AND
IMPLICATIONS
Summary
Three main dependent variables; AGRADE, ABPOST and GAP,
were tested using hierarchical regression. The multiple
regression of each dependent variable was reported when the
experimental variable and all independent variables were
entered. Each dependent variable represented a different
model for testing the general hypothesis.
After testing the three dependent variables using the
AGRADE model, the ABPOST model and the GAP model, two sub-
models of the GAP model were tested. The first sub-model of
GAP was the microeconomic GAP model and the dependent
variable was the microeconomic gap score. The second sub-
model of GAP was the macroeconomic GAP model and the
dependent variable was the macroeconomic gap score.
Discussion
The general hypothesis that students who complete the
sequence of microeconomics followed by macroeconomics
instruction have significantly higher cognitive gains than
students who complete the sequence of macroeconomics
53
54
followed by microeconomics was not verified by the main
effects. The main effects reported that neither sequence
was significant in determining cognitive gain. The sub-
hypotheses were tested using five models.
The first sub-hypothesis stated that students who
complete the microeconomics instruction followed by
macroeconomics instruction sequence will have significantly
higher additive grade points than those students who
complete the macroeconomics instruction followed by
microeconomics instruction sequence. This sub-hypothesis
was not verified.
The second sub-hypothesis stated that students who
complete the microeconomics instruction followed by
macroeconomic instruction sequence will have significantly
higher additive absolute improvement posttest scores on a
nationally normed test than students who complete the
macroeconomics instruction followed by microeconomics
instruction sequence. This sub-hypothesis was not verified.
In testing the second sub-hypothesis one interaction effect
was significant at p<.06. The interaction found that
students who did not have high school economics and were in
the sequence of macroeconomics followed by microeconomics
had significantly higher additive absolute improvement
posttest scores than other students. This finding disagrees
with Fizel and Johnson (1986) who found that the
55
microeconomic followed by macroeconomic sequence increased
cognitive gain.
The third sub-hypothesis stated that students who
complete the microeconomics instruction followed by
macroeconomics instruction sequence will have significantly
higher additive gap-closing scores on a nationally normed
test than those students who complete the macroeconomics
instruction followed by microeconomics instruction sequence.
This sub-hypothesis was only partially verified. In testing
the third sub-hypothesis two interaction effects were
significant at pc.05. The first interaction found that
students who did not have high school economics and were in
the sequence of macroeconomics followed by microeconomics
had significantly higher gap scores than other students.
The second interaction found that students who did not have
a previous college economics course and were in the sequence
of macroeconomics followed by microeconomics had
significantly higher gap scores than other students. In
addition, students who had a previous college economics
course and were in the sequence of macroeconomics followed
by microeconomics had significantly lower gap scores than
other students. Students who had a previous college
economics course and were in the sequence of microeconomics
followed by macroeconomics, however, had higher gap scores
than students in the opposite sequence.
56
The third sub-hypothesis was tested again using only
microeconomic data and only macroeconomic data. Using only
microeconomic data the third sub-hypothesis was not
verified. In testing the third sub-hypothesis, using the
microeconomic data, one interaction effect was significant
at 2< *01. The interaction found that students who did not
have high school economics and were in the sequence of
macroeconomics followed by microeconomics had significantly
higher microeconomic gap scores than other students. Using
only macroeconomic data, the third sub-hypothesis was not
verified.
The fourth sub-hypothesis stated that students who
complete the microeconomics followed by macroeconomics
sequence when they are either sophomores, juniors, or
seniors, will have significantly different additive grade
points than freshman. This hypothesis was tested by
interacting sequence and academic classification. This sub-
hypothesis was not verified.
Conclusions
Based upon the findings of this study the following
tentative conclusions can be drawn. The sequence in which
students at the University of North Texas complete
microeconomics and macroeconomics makes a difference if they
have no previous exposure to economics. Students with no
previous exposure to economics have higher cognitive gain if
57
they complete the sequence of macroeconomics followed by
microeconomics. Students who had a previous college
economics course and complete a sequence of microeconomics
followed by macroeconomics have higher cognitive gain than
students who had a previous college economics course and
were in the opposite sequence.
Recommendations
Further research on sequencing is desirable. Many
changes, however, need to be made. First, using the entire
Revised Test of Understanding College Economics (Saunders,
1981) would raise the reliability of the test. Second, a
correlation between student grades and the TUCE would
provide further evidence as to whether the TUCE measures the
concepts taught in principles of economics classes. Third,
control over the administration of the cognitive instrument
and the concepts taught by each classroom instructor would
improve the internal validity of the study. Fourth,
students need to be randomly assigned to the sequence they
complete.
Implications
The conclusions of this study are limited because it
does not contain external validity. The sample is limited
to the University of North Texas and is too small to
substantiate generalization to other populations. If the
findings of this study are valid, then consideration should
58
be given to screening students in order to place them into
the proper sequence.

APPENDIX
59
60
To the student:
A team of university professors is conducting research to determine the relationship between instruction in economics and attitudes toward the role of government in society. The relationship will be controlled for such factors as academic classification, college major, race, class attendance, etc. The findings are important in developing instructional approaches to the teaching of microeconomics.
Your participation in this project is important. We are asking that you voluntarily complete the questionnaire which is attached. If you choose not to participate, simply hand in your incomplete questionnaire when they are collected by one of you fellow students.
Your answers will be anonymous and will not be considered in your grade for the course. To ensure the anonymity of your responses, one of your fellow students will collect the answer sheets, place them in an envelope, seal it and deliver it to the Economics Department office. Dr. Walton Sharp, Institute of Applied Economics, will code responses so that they are not identifiable to the research team nor to any instructor in the Department of Economics.
The data will be analyzed and a summary report of the findings will be available to all students enrolled in introductory economics. Copies will be distributed to all introductory economics classes in the Spring Semester 1988. Or, you may request a copy individually by completing the attached form and returning it to the instructor.
We hope you will take this opportunity to participate in this important research project,,
William D. Witter, Ph.D. Steve Cobb, Ph.D.
61
I wish to receive a copy of the summary of your research findings.
NAME:
ADDRESS:
Note: Copies of the summary will be distributed to all introductory economic classes during the Spring Semester, 1988. If you plan to enroll in one of these classes, you will automatically receive a copy.

62
MICROECONOMICS
Fall 1987 and Spring 1988
Pretest and Posttest
Which of the following questions provides the best analogy to the basic economizing problem confronting any nation?
a. Shall cars or tractors be produced in a given plant?
b. How can the number of cars produced in a given plant be increased?
c. What are the steel requirements for producing a specific type of tractor?
d. How many workers are required, on a particular assembly line, to produce 100 cars a week?
A student, in estimating the costs of her senior year at the university, proves her expertise as an economist by correctly including all the opportunity costs of her education. The items on her list include all but one of the following. Which one is NOT included:
a. meals b. tuition and fees c. books and supplies d. income from job given up
The Soviet constitution proclaims that no charge shall be made for use of water resources.
a. This is efficient since water is a free good provided at no cost by nature.
b. This is inefficient whenever using water for one purpose prevents its use for another purpose.
c. This is an interesting difference from capitalism, but has no economic significance under socialism.
d. This will increase the satisfaction the Russian people can get from their limited resources since it will make goods like electricity and cotton, that are produced with water, cheaper.
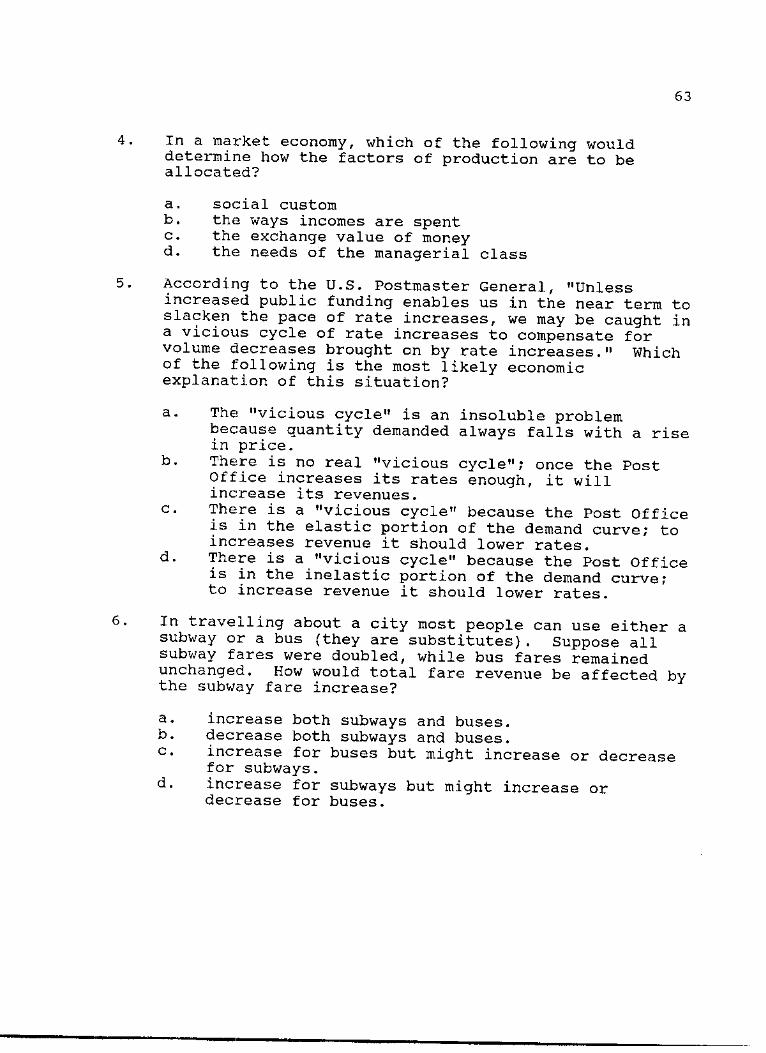
63
4. In a market economy, which of the following would determine how the factors of production are to be allocated?
a. social custom b. the ways incomes are spent c. the exchange value of money d. the needs of the managerial class
5. According to the U.S. Postmaster General, "Unless increased public funding enables us in the near term to slacken the pace of rate increases, we may be caught in a vicious cycle of rate increases to compensate for volume decreases brought on by rate increases." Which of the following is the most likely economic explanation of this situation?
a. The "vicious cycle" is an insoluble problem because quantity demanded always falls with a rise in price.
b. There is no real "vicious cycle"; once the Post Office increases its rates enough, it will increase its revenues.
c. There is a "vicious cycle" because the Post Office is in the elastic portion of the demand curve; to increases revenue it should lower rates.
d. There is a "vicious cycle" because the Post Office is in the inelastic portion of the demand curve; to increase revenue it should lower rates.
6. in travelling about a city most people can use either a subway or a bus (they are substitutes). Suppose all subway fares were doubled, while bus fares remained unchanged. How would total fare revenue be affected by the subway fare increase?
a. increase both subways and buses. b. decrease both subways and buses. c. increase for buses but might increase or decrease
for subways. d. increase for subways but might increase or
decrease for buses.
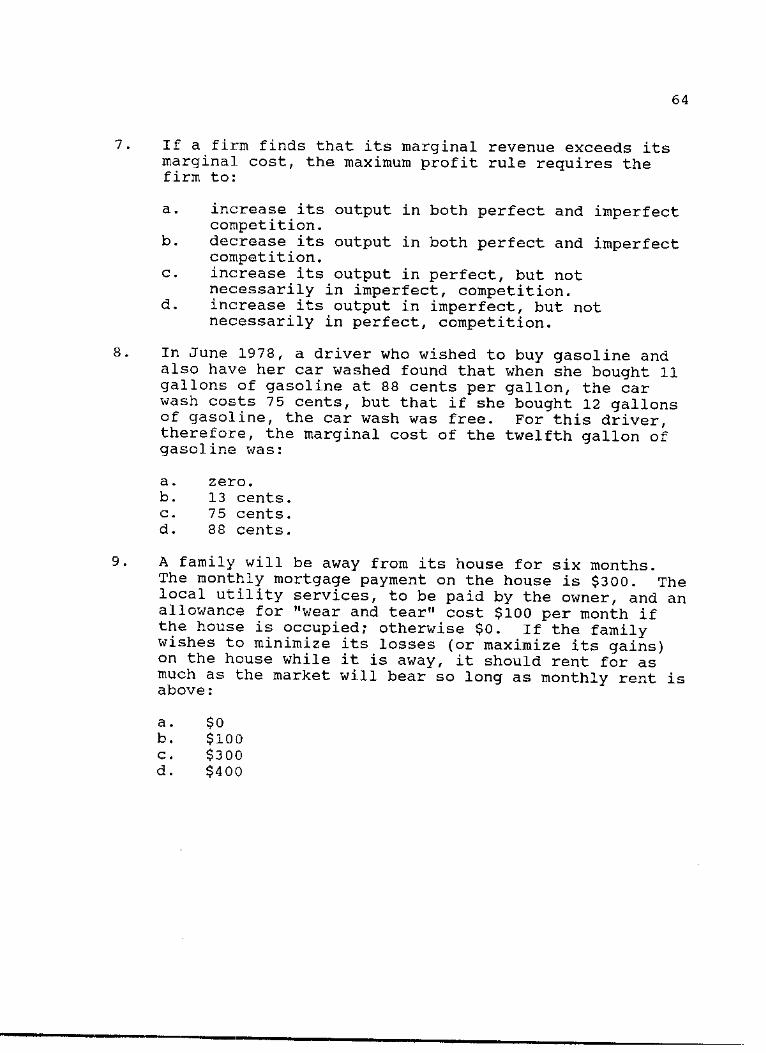
64
7. If a firm finds that its marginal revenue exceeds its marginal, cost, the maximum profit rule requires the firm to:
a. increase its output in both perfect and imperfect competition.
b. decrease its output in both perfect and imperfect competition.
c. increase its output in perfect, but not necessarily in imperfect, competition.
d. increase its output in imperfect, but not necessarily in perfect, competition.
8. In June 1978, a driver who wished to buy gasoline and also have her car washed found that when she bought 11 gallons of gasoline at 88 cents per gallon, the car wash costs 75 cents, but that if she bought 12 gallons of gasoline, the car wash was free. For this driver, therefore, the marginal cost of the twelfth gallon of gasoline was:
a. zero. b. 13 cents. c. 75 cents. d. 88 cents.
9. A family will be away from its house for six months. The monthly mortgage payment on the house is $3 00. The local utility services, to be paid by the owner, and an allowance for "wear and tear" cost $100 per month if the house is occupied; otherwise $0. If the family wishes to minimize its losses (or maximize its gains) on the house while it is away, it should rent for as much as the market will bear so long as monthly rent is above:
a. $0 b. $100 c. $300 d. $400

65
10. An example of "internalizing" an "externality" occurs when:
I. a city government taxes a private firm for dumping waste into a public lake.
II. a city government subsidizes neighborhood improvements made by individual citizens.
a. I only. b. II only. c. both I and II. d. neither I nor II.
11. "Deregulating the trucking industry is not the same as deregulating the airlines. Airlines have an expandable market—you lower rates and more people will travel. Trucking is different—if somebody has a thousand pieces to ship, he's not going to ship any more just because the rates are lowered."
Which of the following economic principles casts doubt on the part of the quotation dealing with the trucking industry?
a. comparative advantage. b. downward sloping demand. c. increasing marginal cost. d. price elasticity of supply.
12. In the early 1970s, the federal government proposed that new and stricter standards be established for sulphur dioxide emissions. Since burning coal produces large amounts of sulphur dioxide, these new standards would have especially affected coal burning firms. The president of the United Mine Workers protested the proposed standards on the grounds that they would "drive public utilities and other firms that burn large amounts of coal to nuclear reactors." This suggests that:
a. coal was a cheap fuel partly because users could avoid some of the cost of burning it.
b. government intervention would have concealed the true economic advantages of cheap coal.
c. the sulphur dioxide standards, while well intended, were too strict to be economically practical.
d. miners would have preferred a tax on the use of coal rather than the sulphur dioxide standards.
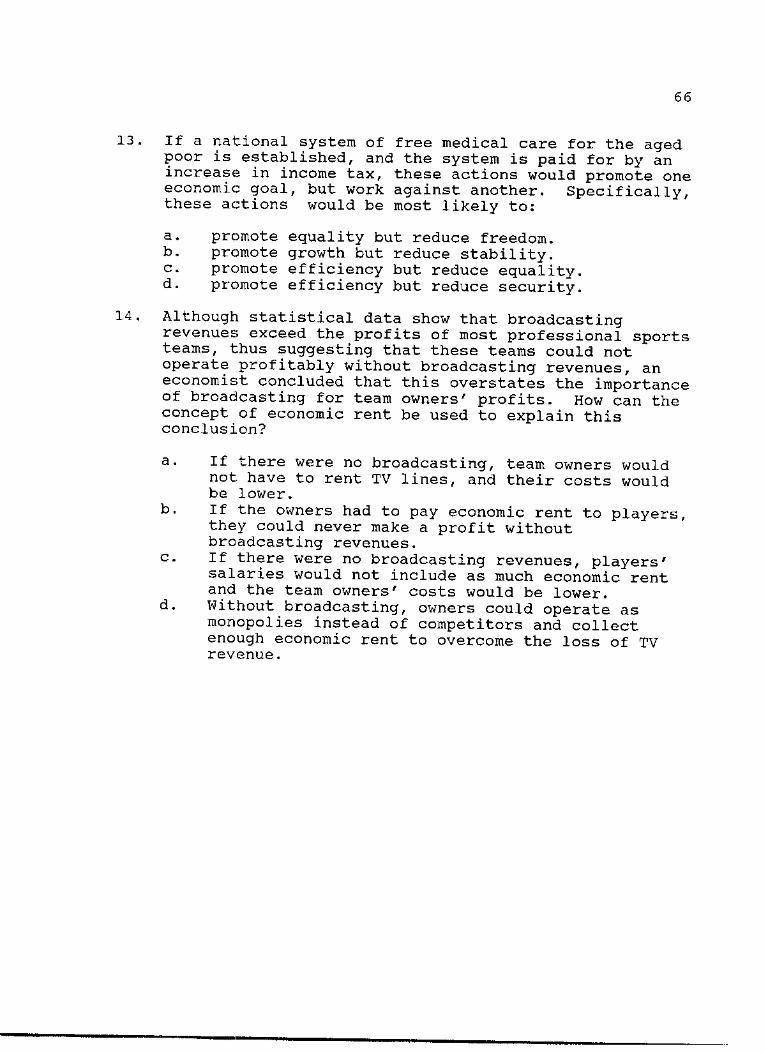
66
13. If a national system of free medical care for the aged poor is established, and the system is paid for by an increase in income tax, these actions would promote one economic goal, but work against another. Specifically, these actions would be most likely to:
a. promote equality but reduce freedom. b. promote growth but reduce stability. c. promote efficiency but reduce equality. d. promote efficiency but reduce security.
14. Although statistical data show that broadcasting revenues exceed the profits of most professional sports teams, thus suggesting that these teams could not operate profitably without broadcasting revenues, an economist concluded that this overstates the importance of broadcasting for team owners' profits. How can the concept of economic rent be used to explain this conclusion?
a. If there were no broadcasting, team owners would not have to rent TV lines, and their costs would be lower.
b. If the owners had to pay economic rent to players, they could never make a profit without broadcasting revenues.
c. If there were no broadcasting revenues, players' salaries would not include as much economic rent and the team owners' costs would be lower.
d. Without broadcasting, owners could operate as monopolies instead of competitors and collect enough economic rent to overcome the loss of TV revenue.
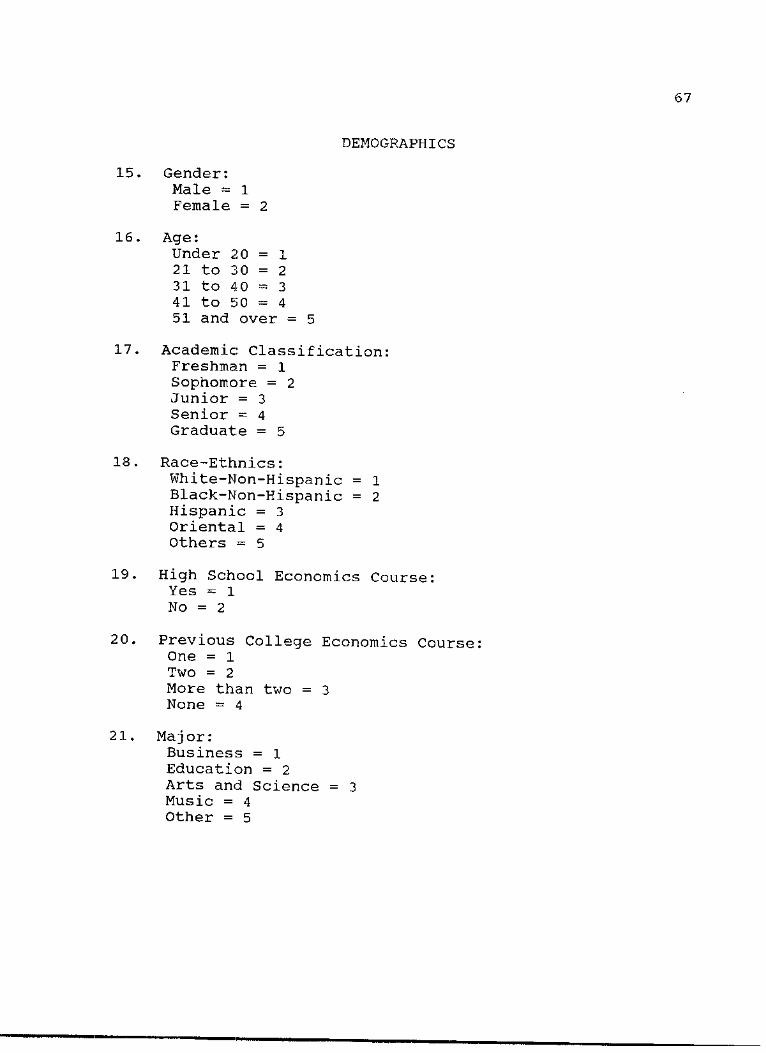
67
DEMOGRAPHICS
15. Gender: Male = 1 Female = 2
16. Age: Under 20 = l 21 to 30 = 2 31 to 40 = 3 41 to 50 = 4 51 and over = 5
17. Academic Classification: Freshman = 1 Sophomore = 2 Junior = 3 Senior = 4 Graduate = 5
18. Race-Ethnics: White-Non-Hispanic = 1 Black-Non-Hispanic = 2 Hispanic = 3 Oriental = 4 Others = 5
19. High School Economics Course: Yes = 1 No = 2
20. Previous College Economics Course: One = 1 Two = 2 More than two = 3 None = 4
21. Major: Business = 1 Education = 2 Arts and Science = 3 Music = 4 Other = 5
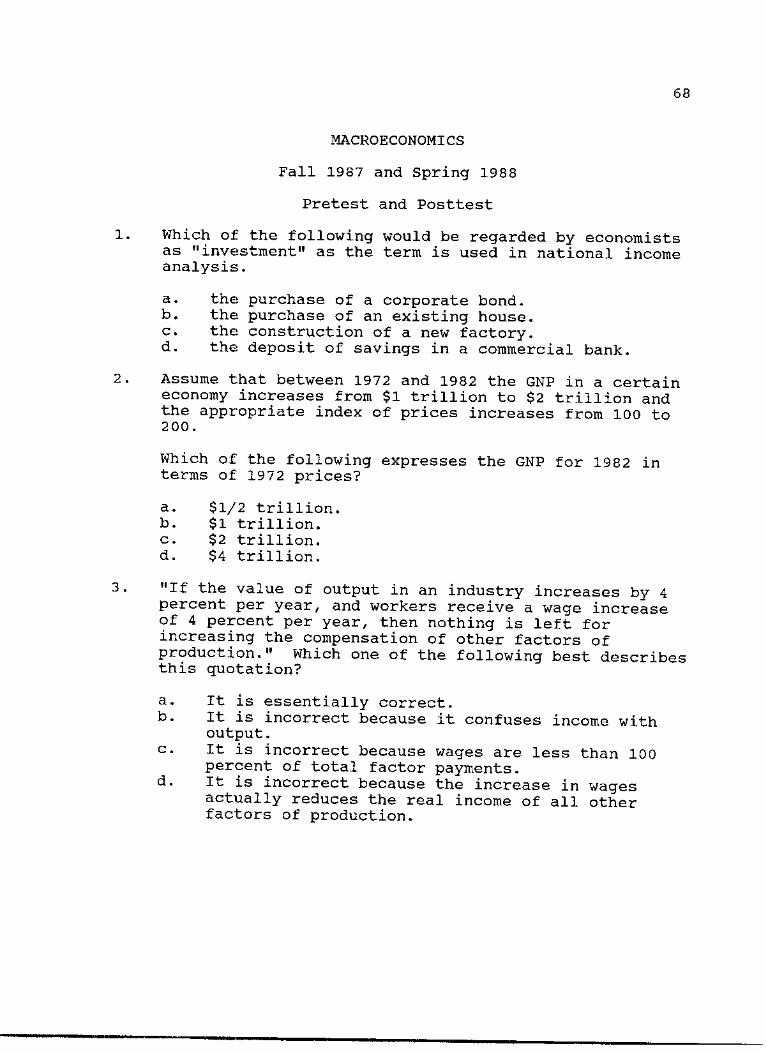
68
MACROECONOMICS
Fall 1987 and Spring 1988
Pretest and Posttest
1. Which of the following would be regarded by economists as "investment" as the term is used in national income analysis.
a. the purchase of a corporate bond. b. the purchase of an existing house. c. the construction of a new factory. d. the deposit of savings in a commercial bank.
2. Assume that between 1972 and 1982 the GNP in a certain economy increases from $1 trillion to $2 trillion and the appropriate index of prices increases from 100 to 200.
Which of the following expresses the GNP for 1982 in terms of 1972 prices?
a. $1/2 trillion. b. $1 trillion. c. $2 trillion. d. $4 trillion.
3. "if the value of output in an industry increases by 4 percent per year, and workers receive a wage increase of 4 percent per year, then nothing is left for increasing the compensation of other factors of production." Which one of the following best describes this quotation?
a. It is essentially correct. b. It is incorrect because it confuses income with
output. c. It is incorrect because wages are less than 100
percent of total factor payments. d. It is incorrect because the increase in wages
actually reduces the real income of all other factors of production.,
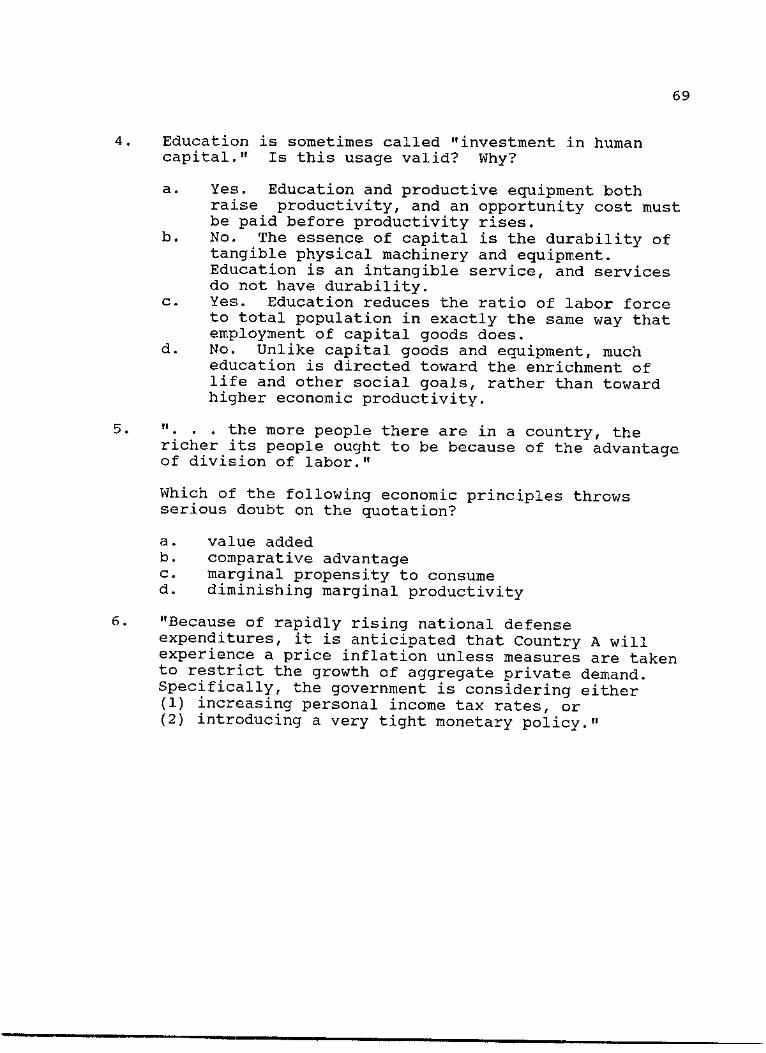
69
4. Education is sometimes called "investment in human capital." Is this usage valid? Why?
a. Yes. Education and productive equipment both raise productivity, and an opportunity cost must be paid before productivity rises.
b. No. The essence of capital is the durability of tangible physical machinery and equipment. Education is an intangible service, and services do not have durability.
c. Yes. Education reduces the ratio of labor force to total population in exactly the same way that employment of capital goods does.
d. No. Unlike capital goods and equipment, much education is directed toward the enrichment of life and other social goals, rather than toward higher economic productivity.
5. " . . . the more people there are in a country, the richer its people ought to be because of the advantage of division of labor."
Which of the following economic principles throws serious doubt on the quotation?
a. value added b. comparative advantage c. marginal propensity to consume d. diminishing marginal productivity
6. "Because of rapidly rising national defense expenditures, it is anticipated that Country A will experience a price inflation unless measures are taken to restrict the growth of aggregate private demand. Specifically, the government is considering either (1) increasing personal income tax rates, or (2) introducing a very tight monetary policy."
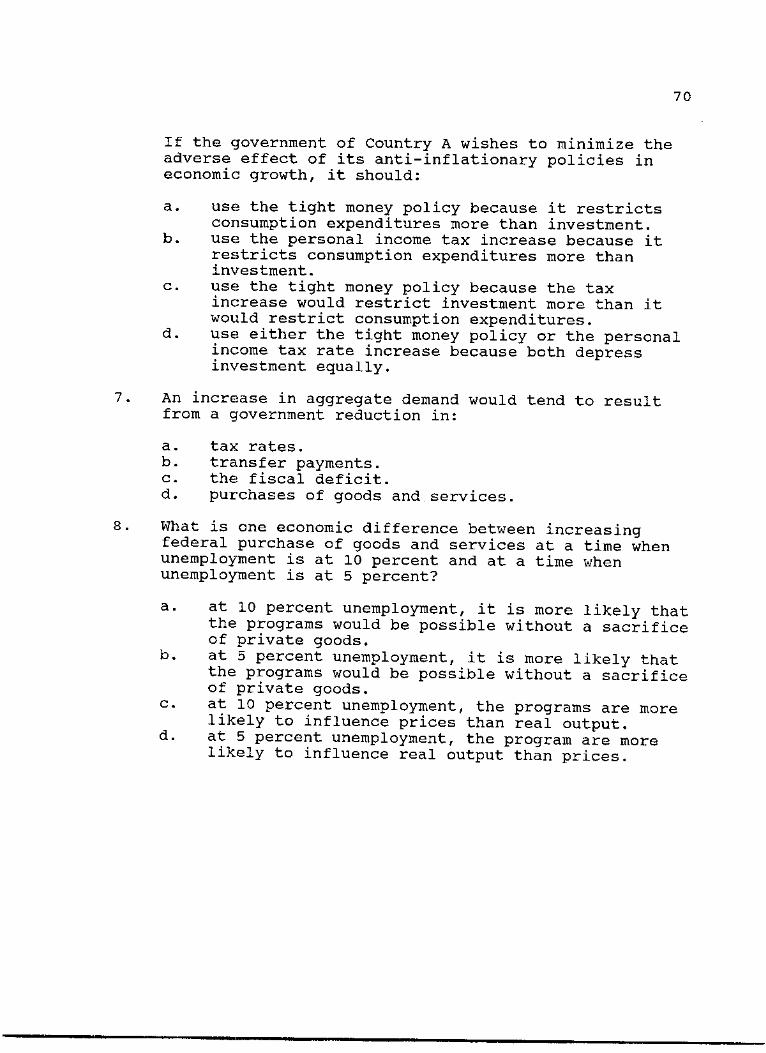
70
If the government of Country A wishes to minimize the adverse effect of its anti-inflationary policies in economic growth, it should:
a. use the tight money policy because it restricts consumption expenditures more than investment.
b. use the personal income tax increase because it restricts consumption expenditures more than investment.
c. use the tight money policy because the tax increase would restrict investment more than it would restrict consumption expenditures.
d. use either the tight money policy or the personal income tax rate increase because both depress investment equally.
7. An increase in aggregate demand would tend to result from a government reduction in:
a. tax rates. b. transfer payments. c. the fiscal deficit. d. purchases of goods and services.
8. What is one economic difference between increasing federal purchase of goods and services at a time when unemployment is at 10 percent and at a time when unemployment is at 5 percent?
a. at 10 percent unemployment, it is more likely that the programs would be possible without a sacrifice of private goods.
b. at 5 percent unemployment, it is more likely that the programs would be possible without a sacrifice of private goods.
c. at 10 percent unemployment, the programs are more likely to influence prices than real output.
d. at 5 percent unemployment, the program are more likely to influence real output than prices.
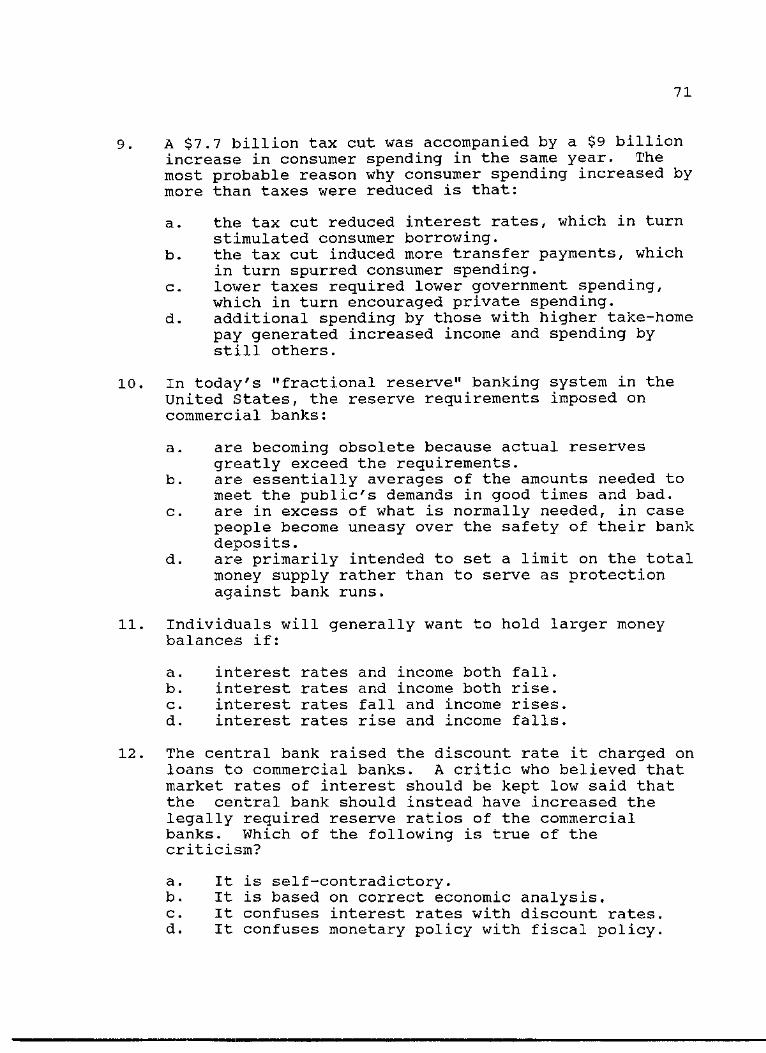
71
9. A $7.7 billion tax cut was accompanied by a $9 billion increase in consumer spending in the same year. The most probable reason why consumer spending increased by more than taxes were reduced is that:
a. the tax cut reduced interest rates, which in turn stimulated consumer borrowing.
b. the tax cut induced more transfer payments, which in turn spurred consumer spending.
c. lower taxes required lower government spending, which in turn encouraged private spending.
d. additional spending by those with higher take-home pay generated increased income and spending by still others.
10. In today's "fractional reserve" banking system in the United States, the reserve requirements imposed on commercial banks:
a. are becoming obsolete because actual reserves greatly exceed the requirements.
b. are essentially averciges of the amounts needed to meet the public's demands in good times and bad.
c. are in excess of what is normally needed, in case people become uneasy over the safety of their bank deposits.
d. are primarily intended to set a limit on the total money supply rather than to serve as protection against bank runs.
11. Individuals will generally want to hold larger money balances if:
a. interest rates and income both fall. b. interest rates and income both rise. c. interest rates fall and income rises. d. interest rates rise and income falls.
12. The central bank raised the discount rate it charged on loans to commercial banks,, A critic who believed that market rates of interest should be kept low said that the central bank should instead have increased the legally required reserve ratios of the commercial banks. Which of the following is true of the criticism?
a. It b. It c. It d. It
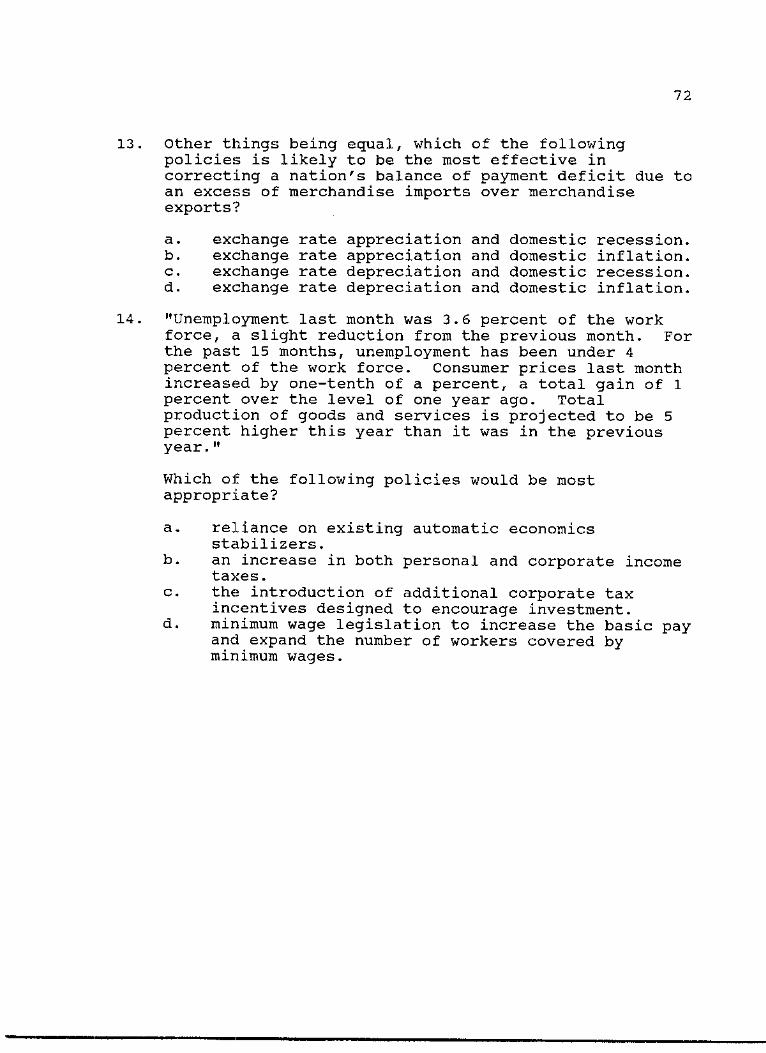
72
13. Other things being equal, which of the following policies is likely to be the most effective in correcting a nation's balance of payment deficit due to an excess of merchandise imports over merchandise exports?
a. exchange rate appreciation and domestic recession. b. exchange rate appreciation and domestic inflation. c. exchange rate depreciation and domestic recession. d. exchange rate depreciation and domestic inflation.
14. "Unemployment last month was 3.6 percent of the work force, a slight reduction from the previous month. For the past 15 months, unemployment has been under 4 percent of the work force. Consumer prices last month increased by one-tenth of a percent, a total gain of 1 percent over the level of one year ago. Total production of goods and services is projected to be 5 percent higher this year than it was in the previous year."
Which of the following policies would be most appropriate?
a. reliance on existing automatic economics stabilizers.
b. an increase in both personal and corporate income taxes.
c. the introduction of additional corporate tax incentives designed to encourage investment.
d. minimum wage legislation to increase the basic pay and expand the number of workers covered by minimum wages.
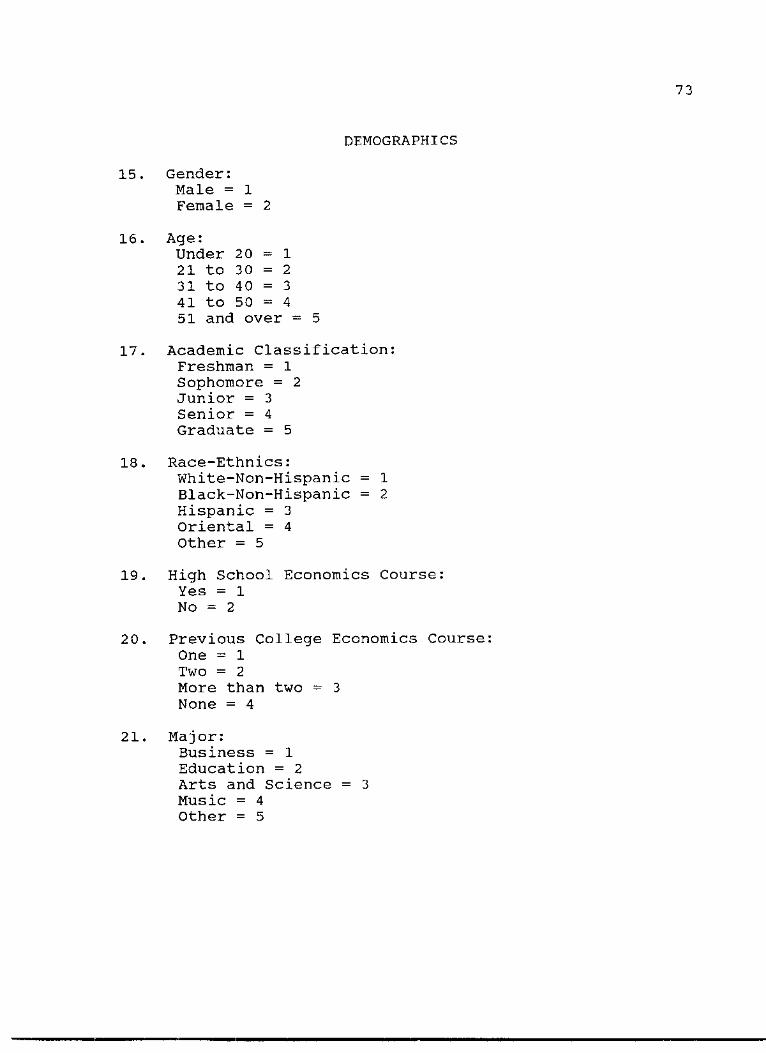
73
DEMOGRAPHICS
15. Gender: Male = 1 Female = 2
16. Age: Under 20 = 1 21 to 30 = 2 31 to 40 = 3 41 to 50 = 4 51 and over = 5
17. Academic Classification: Freshman = 1 Sophomore = 2 Junior = 3 Senior = 4 Graduate = 5
18. Race-Ethnics: White-Non-Hispanic = 1 Black-Non-Hispanic = 2 Hispanic = 3 Oriental = 4 Other = 5
19. High School Economics Course: Yes = 1 No = 2
20. Previous College Economics Course: One = 1 Two = 2 More than two = 3 None = 4
21. Major: Business = 1 Education = 2 Arts and Science = 3 Music = 4 Other = 5
74
COURSE DESCRIPTIONS
Economics (ECON)
ECON 1100-1110. Principles of Economics. 3 hours each.
ECON 1100,
ECON 1110,
Principles of Microeconomics. Business organization and market economy; theory of the firm; techniques of economic analysis in current economic problems; comparative economic systems. Fee required.
Principles of Macroeconomics. Principles of economic organization and growth in modern, industrial society; money and banking, monetary and fiscal policy; determinants of national income and business fluctuations. Fee required.
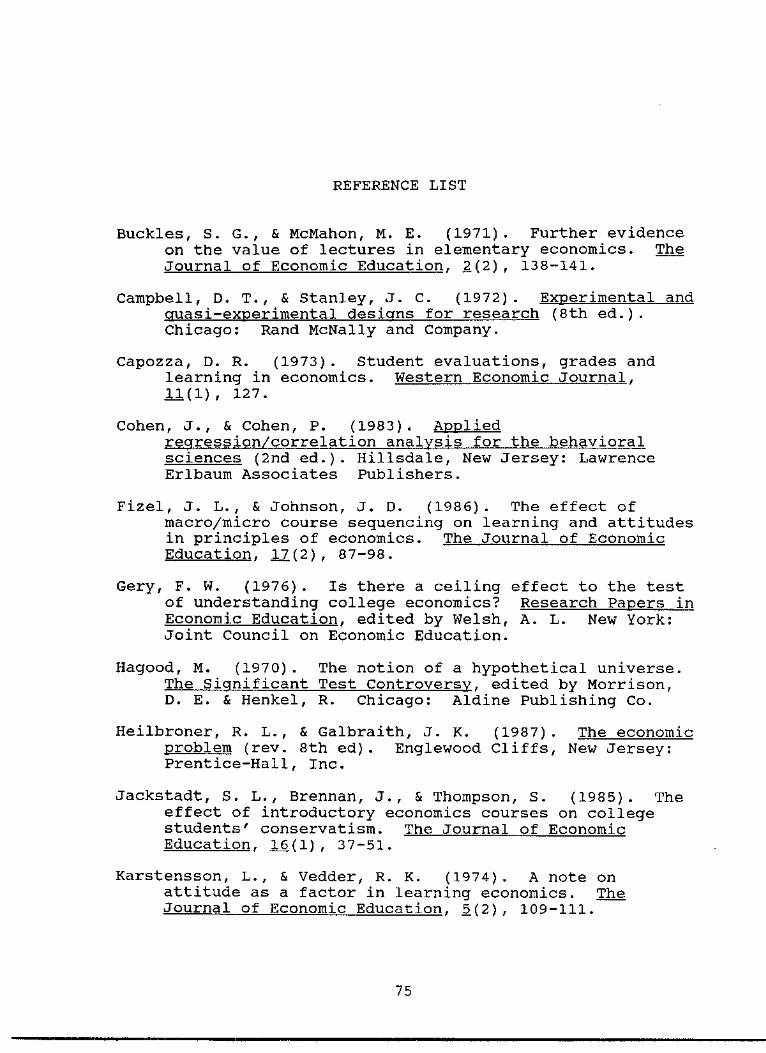
REFERENCE LIST
Buckles, S. G., & McMahon, M. E. (1971). Further evidence on the value of lectures in elementary economics. The Journal of Economic Education. 2(2), 138-141.
Campbell, D. T., & Stanley, J. C. (1972). Experimental and quasi-experimental designs for research (8th ed.). Chicago: Rand McNally and Company.
Capozza, D. R. (1973). Student evaluations, grades and learning in economics. Western Economic Journal. 11(1), i27.
Cohen, J., & Cohen, P. (1983). Applied regression/correlation anctlvsis for the behavioral sciences (2nd ed.). Hillsdale, New Jersey: Lawrence Erlbaum Associates Publishers.
Fizel, J. L., & Johnson, J. D. (1986). The effect of macro/micro course seguencing on learning and attitudes in principles of economics. The Journal of Economic Education. 17(2), 87-98.
Gery, F. W. (1976). Is there a ceiling effect to the test of understanding college economics? Research Papers in Economic Education, edited by Welsh, A. L. New York: Joint Council on Economic Education.
Hagood, M. (1970). The notion of a hypothetical universe. The Significant Test Controversy, edited by Morrison, D. E. & Henkel, R. Chicago: Aldine Publishing Co.
Heilbroner, R. L., & Galbraith, J. K. (1987). The economic problem (rev. 8th ed). Englewood Cliffs, New Jersey: Prentice-Hall, Inc.
Jackstadt, S. L., Brennan, J., & Thompson, S. (1985). The effect of introductory economics courses on college students' conservatism. The Journal of Economic Education. .16(1), 37-51.
Karstensson, L., & Vedder, R. K. (1974). A note on attitude as a factor in learning economics. The Journal of Economic Education. 5(2), 109-111.
75
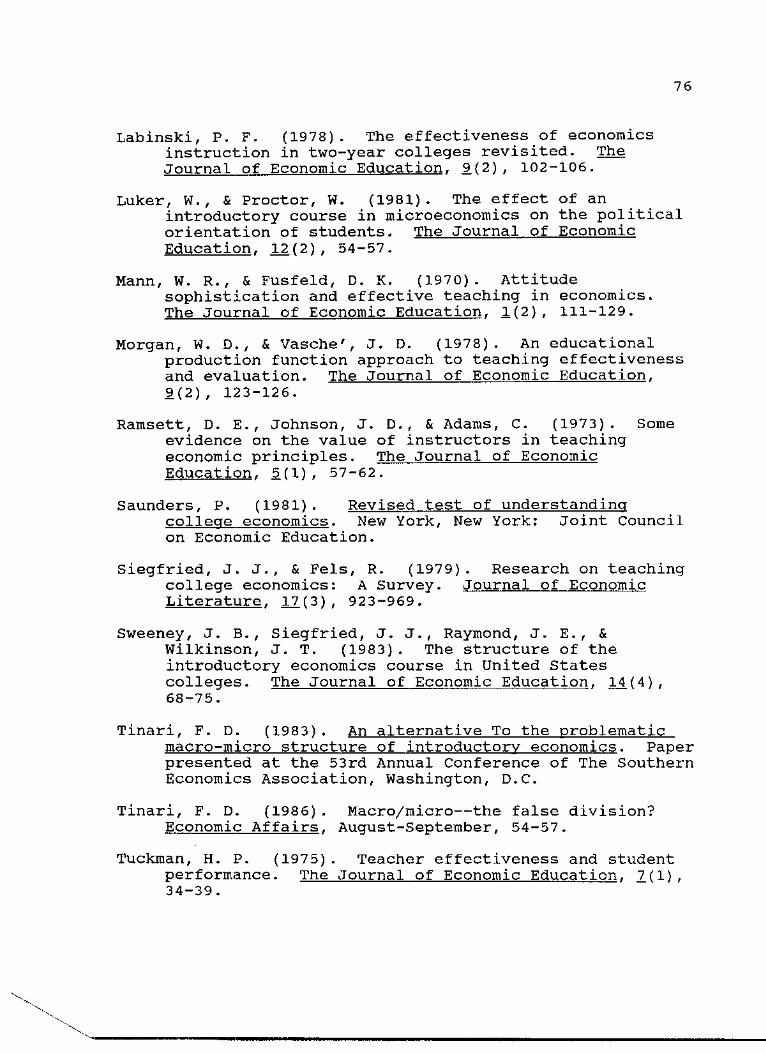
76
Labinski, P. F. (1978). The effectiveness of economics instruction in two-year colleges revisited. The Journal of Economic Education. 9(2), 102-106.
Luker, W., & Proctor, W. (1981). The effect of an introductory course in microeconomics on the political orientation of students. The Journal of Economic Education. 12.(2), 54-57.
Mann, W. R., & Fusfeld, D. K. (1970). Attitude sophistication and effective teaching in economics. The Journal of Economic Education. 1(2), 111-129.
Morgan, W. D., & Vasche', J. D. (1978). An educational production function approeich to teaching effectiveness and evaluation. The Journal of Economic Education. 9(2), 123-126.
Ramsett, D. E., Johnson, J. D., & Adams, C. (1973). Some evidence on the value of instructors in teaching economic principles. The Journal of Economic Education. 5(1), 57-62.
Saunders, P. (1981). Revised test of understanding college economics. New York, New York: Joint Council on Economic Education.
Siegfried, J. J., & Fels, R. (1979). Research on teaching college economics: A Survey. Journal of Economic Literature. 17(3), 923-969.
Sweeney, J. B., Siegfried, J. J., Raymond, J. E., & Wilkinson, J. T. (1983). The structure of the introductory economics course in United States colleges. The Journal of Economic Education. 14(4). 68-75.
Tinari, F. D. (1983). An alternative To the problematic macro-micro structure of introductory economics. Paper presented at the 53rd Annual Conference of The Southern Economics Association, Washington, D.C.
Tinari, F. D. (1986). Macro/micro—the false division? Economic Affairs. August-September, 54-57.
Tuckman, H. P. (1975). Teacher effectiveness and student performance. The Journal of Economic Education. 2(1)/ 34-39.