Embed Size (px)
Citation preview

8/13/2019 4Q Vacancy Survey
http://slidepdf.com/reader/full/4q-vacancy-survey 1/27
Denver Metro Area
Apartment Vacancy
and Rent Survey
Fourth Quarter 2013
Sponsored by
Apartment Association of Metro Denver
Apartment Realty AdvisorsColorado Housing and Finance Authority
Colorado Division of Housing
Multifamily Capital Advisors
Pierce-Eislen
Contributing Sponsor
Denver Housing Authority
Researched and authored by
Ron L. Throupe, Ph.D. University of DenverDaniels College of Business
Burns School of Real Estate & Construction Management944 Aztec Dr.Castle Rock, CO 80108
(425) 681-6602 [email protected]
Jennifer L. Von Stroh Colorado Economic and Management Associates
2581 East Wynterbrook DriveLittleton, Colorado [email protected]
Copyright 2014

8/13/2019 4Q Vacancy Survey
http://slidepdf.com/reader/full/4q-vacancy-survey 2/27
Survey Sponsors
Apartment Association of Metro Denver7100 E. Belleview Avenue, Suite 305
Greenwood Village, CO 80111Rocky Sundling, president
Mark Williams, executive vice presidentPhone: (303) 329-3300; fax (303) 329-0403
Apartment Realty Advisors1800 Larimer Street, Suite 1700
Denver, Colorado 80202Jeff Hawks, principal
Phone (303) 260-4400; fax (303) 260-4234
Colorado Housing and Finance Authority1981 Blake StreetDenver, CO 80202
Cris A. White, executive directorPhone: (303) 297-2432; fax (303) 297-2615
Colorado Division of Housing1313 Sherman Street
Denver, CO 80203Pat Coyle, executive director
Phone: (303)-866-2033
Pierce-Eislen9200 East Pima Parkway, Suite 150
Scottsdale, AZ 85258Ronald G. Brock, president/ceo
Phone: (480) 663-1149; fax (480) 663-6269Email: [email protected]
Multifamily Capital Advisors6950 E. Belleview Avenue, Suite 320
Greenwood Village, CO 80111Jerry Kendall, managing director
Phone: (720) 280-7431Email:[email protected]
Survey uthors and Researchers
Ron L. Throupe, Ph.D. University of Denver Daniels College of Business
Burns School of Real Estate & Construction Management944 Aztec Dr.Castle Rock, CO 80108
(425) 681-6602 [email protected]
Jennifer L. Von Stroh Colorado Economic and Management Associates2581 East Wynterbrook Drive
Littleton, Colorado [email protected]
The sponsors of the Denver Area Apartment Vacancy and Rent Survey contract with an independent researcher to produce this report. No individual information is
released by the researcher to a sponsor or to the public.
Copyright 2013

8/13/2019 4Q Vacancy Survey
http://slidepdf.com/reader/full/4q-vacancy-survey 3/27
LONGMONT3.3%
$1,045.44
BOULDER (CITY)3.9%
$1,277.28
UNIVERSITY 0.0%
$957.00
BROOMFIELD3.6%
$1,212.46
ARVADA3.9%
$909.15
WESTMINSTER4.5%
$887.56
GOLDEN3.6%
$1,049.64
WHEAT RIDGE3.5%
$822.79
LAKEWOOD N3.4%
$958.26
LAKEWOOD S5.6%
$1,053.30
NORTHGLENN / THORNTON6.3%
$1,019.27
COMMERCE CITY2.8%
$819.03
DENVER NW3.9%
$1,162.03
DENVER NC3.2%
$1,514.04
DENVER NE6.3%
$844.18
AURORA NO1.1%
$750.61
DENVER WC4.6%
$700.90
DENVER C5.6%
$1,040.68
DENVER EC6.2%
$1,103.69
DENVER SW4.0%
$943.36
GLENDALE7.1%
$953.35
DOWNTOWN10.9%
$1,509.52
DENVER SC6.5%
$1,173.33DENVER SE
4.5%$857.46
DENVERFAR SE
5.3%$945.61ENGLEWOODSHERIDAN
4.6%$989.69
LITTLETON3.8%
$1,055.97
ARAPAHOECOUNTY S
3.4%$1,180.81
ARAPAHOECOUTY SE
5.9%$1,302.02
AURORA SOUTH7.3%
$994.05
AURORA C3.0%
$886.62
AURORA CNW5.6%
$1,013.30
AURORA CSW4.1%
$878.28 AURORA C3.3%
$869.31
DOUGLASCOUNTY N
5.6%$1,256.49
CASTLE ROCK
1.9%$1,122.65
BOULDER
JEFFERSON
ADAMS
DENVER
ARAPAHOE
DOUGLAS
BROOMFIELD
METRO DENVERSUBMARKETS(Individual Submarkets Defined on the “ Market AreaDescriptionsand Census Tracts” Page at the end of each section.)
Red: Vacancy Rate
Blue: Average RentBOULDER (OTHER)
3.8%$1,331.03

8/13/2019 4Q Vacancy Survey
http://slidepdf.com/reader/full/4q-vacancy-survey 4/27
I-5
ounty/Market
1st 2nd 3 rd 4 th 1st 2nd 3 rd 4 t h 1s t 2nd 3 rd 4 th 1st 2nd 3 rd 4 th 1st 2nd 3 rd 4 th 1st 2nd 3 rd 4 th 1st 2nd 3 rd 4 th 1st 2nd 3 rd 4 th 1st 2nd 3 rd 4 th 1st 2nd 3 rd 4 th 1st 2nd
dams Cou nty 1 3.7 1 6.2 1 2. 6 12 .1 9.6 9.9 7.6 11 .7 10.6 8.7 7.7 8.1 7 .0 6.1 6.4 7 .4 7. 8 6 .3 5 .9 7. 4 6 .4 6 .8 7. 5 8 .8 8. 4 8 .5 6 .7 6. 3 6 .8 5 .2 4.4 5. 7 5 .6 5 .2 5.3 5. 3 4 .5 4 .9 4.2 4. 5 5 .2 3 .8
urora-North 19.7 9.4 15.2 14.6 9.1 22.4 8.7 8.2 7.6 5.4 9.4 8.0 6.3 6.2 6.4 8.5 8.4 10.9 4.3 4.1 6.2 6.4 13.7 11.8 22.2 17.3 11.8 9.0 10.7 10.3 6.1 9.0 7.3 5.6 6.4 4.0 6.0 5.4 2.7 3.2 42.6* 4.0
ommerce C it y/ Br ight on 13. 0 12 .5 27. 3 27 .7 23. 2 12 .5 6 .3 13. 1 10. 3 7 . 8 4 .1 7 .3 4 .2 4 .3 5 .6 9 .4 3 .2 3 .2 3 .7 4 .8 5 .2 4 .0 5 .2 8 .3 8 .3 7 .9 2 .3 7 .2 2 .1 4 .0 3 .4 5 .9 5 .0 1 .9 6 .6 4 .7 4 .4 5 .9 4 .9 3 .8 5 .8 3 .8
or th gl en n/Tho rnto n 11 .6 1 6.5 1 3.0 1 1. 0 7 .8 8.7 7 .9 8.7 1 0.7 7 .7 7 .5 7 .7 6.6 5.6 6 .1 6.9 7.1 6 .6 7. 2 8 .7 6 .6 7. 9 8 .8 8 .9 8.2 8 .7 6. 0 6 .3 5.6 4 .6 4 .2 4.5 4.4 4 .9 5 .5 6.1 4.8 5. 3 4 .4 4.8 3.5 3. 6
es tm ins ter 14 .4 16 .8 1 1.1 1 1.3 9 .5 8 .9 7. 3 1 3.6 10 .8 9 .8 8 .1 8. 6 7 .5 6 .8 6. 7 7 .5 8 .3 6 .1 5.1 6.7 6 .4 5.9 5.6 8 .5 7 .3 7 .5 7.4 6.2 8.6 5. 5 4 .6 6.8 6.6 5. 7 5 .0 4 .5 4.2 4. 5 4 .1 4 .3 4.1 4 .0
rapahoe Cou nty 13 .3 1 2.1 1 0.6 1 0.8 1 0.8 9.8 9 .2 10. 1 8 .9 7 .4 6.8 7 .4 7. 0 6 .8 6 .7 7. 4 7 .8 6 .1 5. 0 6 .0 6 .5 5 .9 6.9 8.3 9.7 10 .7 8 .5 8.6 7. 2 6 .4 6.7 6.6 6. 4 5 .5 5.6 6.8 6. 3 5 .5 4 .8 5.0 4. 1 4 .5 rapahoe Co-South 7.4 9.2 8.5 9.8 6.6 10.5 12.0 11.0 8.1 7.3 6.6 7.5 7.0 5.9 6.6 6.4 5.6 3.8 3.9 4.8 4.8 3.0 4.4 5.5 6.4 4.3 5.3 3.9 3.1 3.0 2.4 3.4 2.8 2.8 3.0 4.0 3.9 3.1 3.2 3.3 3.4 2.6
rapahoe Co-Southeast 21.7 23.5 12.2 9.6 7.3 6.4 5.2 6.1 8.0 4.8 4.2 5.6 5.6 5.4 3.9 7.6 4.4 5.1 4.4 5.3 11.2 5.7 6.3 9.0 15.7 10.5 6.9 7.8 6.0 4.9 3.9 4.8 5.8 4.2 4.6 5.6 6.0 4.1 3.6 4.9 4.2 3.9
urora-Central NE 17.2 14.4 15.5 16.7 13.0 9.6 7.4 9.5 7.9 10.0 8.9 9.2 11.2 11.8 12.5 9.6 8.4 10.7 8.9 7.1 7.0 5.3 13.0 11.9 11.9 13.5 12.4 15.1 7.2 8.9 5.7 6.2 7.5 8.6 7.9 7.9 13.2 5.9 3.8 3.8 2.3 4.1
urora-Central NW 11.8 8.8 9.6 8.9 11.0 9.2 10.2 9.6 9.2 7.4 6.0 8.6 8.0 6.8 14.6 7.1 7.2 6.1 4.8 7.0 7.3 6.2 8.1 10.3 13.9 12.8 9.5 9.8 7.5 5.8 4.7 5.1 6.2 6.0 6.2 6.6 6.2 5.5 5.2 6.1 5.3 4.7
urora-Central SE 9.6 10.9 9.8 11.8 13.7 10.4 9.4 8.3 8.2 7.6 5.8 7.3 6.7 7.4 6.4 6.8 6.9 4.9 4.2 4.2 5.2 7.8 10.0 10.0 14.3 14.1 7.0 7.3 5.6 5.5 4.9 5.3 4.5 4.5 4.7 5.7 4.6 4.6 4.6 4.9 3.8 3.0
urora-Central SW 9.0 10.4 7.7 11.5 9.8 9.2 11.3 12.0 11.4 8.3 8.3 8.6 8.8 7.5 8.1 10.4 13.5 7.0 5.3 5.8 5.9 5.6 7.4 8.4 6.6 8.6 9.3 7.8 9.1 8.7 12.2 10.2 8.2 7.2 7.0 9.9 9.1 7.9 6.1 7.6 3.8 3.4
urora-South 19.0 15.3 12.1 11.3 12.8 11.2 10.1 10.6 8.6 6.8 6.9 7.1 6.8 5.7 4.2 5.6 7.7 7.1 5.1 6.8 5.2 6.5 5.7 7.0 7.9 12.4 7.8 8.9 8.6 8.1 8.4 8.2 8.4 6.0 6.7 7.8 6.7 6.0 4.7 4.5 4.3 6.2
ng lew oo d/She ri da n 8 .6 6 .7 9.9 1 0. 0 9 .4 8 .8 6 .7 9.6 1 0.2 7 .2 6 .0 7 .5 6.7 6.5 5 .1 6.6 7.0 6 .6 5. 5 5 .4 5 .1 4. 4 5 .1 7 .4 7.4 8 .4 13. 7 9 .3 7.6 5 .6 5 .6 5.2 4.3 5 .0 4 .1 5.3 2.7 4. 8 3.8 4.3 4. 4 5 .6
endale 12.0 1 0.3 1 1.4 8.7 12.0 1 2.4 8.2 11.8 8.0 9.1 9.5 7.1 6.4 9.0 7.5 8.3 8.2 6.6 6.3 7.6 9.0 7.3 7.5 8.5 8.9 10.0 9.7 9.6 8.0 6.6 6.1 6.2 6.9 5.0 5.5 5.4 5.1 6.4 6.9 3.6 5.0 7.6
ttleton 8.6 7.4 11.1 9.8 8.2 7.0 8.0 10.1 8.7 6.1 6.7 7.1 5.5 5.5 4.9 5.8 5.6 4.7 4.4 5.5 5.7 5.0 4.4 7.3 5.2 6.6 5.0 10.9 5.7 3.2 3.5 3.8 2.9 4.5 2.9 5.2 4.1 3.9 4.7 5.5 3.5 2.4
oulder/Broomfield 12 .2 1 1.9 7.1 9. 6 11 .0 9 .5 6 .0 9.0 1 1.1 8 .7 7 .8 7 .3 6.9 7.0 4 .8 5.5 4.7 4 .0 3. 6 5 .4 5 .7 6. 4 4 .7 6 .1 6.0 7 .2 5. 5 5 .8 5.0 4 .9 3 .5 3.6 4.9 4 .6 4 .7 4.4 3.9 3 .6 2.9 3.7 3. 2 3 .8
oul der Co un ty- Othe r 13 .0 1 2.4 4. 9 7 .9 1 3.9 7.6 6 .6 8. 6 8 .3 10 .1 4.9 5 .2 7. 6 7 .2 4 .5 5. 5 3 .9 3 .7 5 .2 3.3 3.3 4 .3 3.6 6.6 6.0 5 .1 4 .9 4.9 5. 3 3 .8 5.0 3.8 1 0. 0 6 .4 4.3 4.0 3. 3 4 .6 3.3 3.5 4. 7 3 .7
r oo mf ie ld 11 .3 13.3 8.3 11 .1 8 .8 9.8 9 .4 10. 6 1 8.2 9 .9 11.6 12 .0 8. 9 7 .5 4 .3 5. 6 4 .8 4 .5 4. 1 6 .0 4 .9 4 .9 5.5 7.2 6.7 7 .0 4. 0 5 .1 5. 1 4 .3 4.1 5.2 5. 7 5 .7 5.7 5.8 4. 8 4 .1 3 .9 6.2 4. 5 4 .5
it y o f Bl dr -Ex cep t U nv . 12 .2 1 1.0 6.5 6. 9 7 .5 1 0.9 3 .9 9.1 8.1 8 .0 7 .4 4 .7 6.0 8.8 6 .0 5. 6 4.3 3 .2 2. 6 2.0 3 .2 3. 3 2.4 3 .0 3.6 6 .6 7. 2 5.8 4. 9 6 .9 2 .6 3.5 3.1 4 .7 4 .6 3.5 4. 6 4 .4 1.8 1.9 1. 4 3 .4
ity o f Bld r- Un v. Ar ea 7 .9 1 1.0 9. 6 12 .5 1 0.0 5.5 2 .8 6. 5 8.1 3 .1 4.0 5 .0 2. 8 3.0 4 .1 1. 6 0.8 5 .9 1 .9 3.7 3.8 4 .4 1.1 0.6 2.4 11 .4 3 .5 2.0 1. 5 4 .2 1.1 0.6 0. 0 0 .4 0.0 0.3 0. 1 0 .0 0.3 0.2 0. 3 0 .5
o ng mon t 15 .8 8.8 8.5 1 4. 6 13 .3 1 1.7 5 .1 8. 5 1 1.4 10 .0 7.9 6 .4 6. 3 4 .7 4 .5 7. 6 8 .4 3 .9 3. 2 1 1.5 15 .1 19. 6 1 0.5 8 .7 8.9 9 .1 7. 8 1 2.8 6. 4 5 .0 3.0 2.6 2. 8 2 .6 5.0 4.9 3. 6 2 .2 2 .9 2.7 2. 3 3 .6
enver City/County 11 .8 1 2.3 1 0.0 9. 8 10 .2 1 0.1 8 .3 9.8 9.2 8 .7 9 .6 8 .7 7.8 7.6 7 .3 6. 9 7 .2 6 .1 5. 7 5 .5 5 .1 5. 7 6 .0 8 .0 8.6 9 .8 8. 5 8 .8 6. 9 7 .4 5 .3 5.2 4.8 4 .1 4 .3 4.8 4. 2 4 .8 4.3 6.1 5. 4 4 .6
env er-Central 9.8 1 0.2 1 0.1 9.1 9.2 8.9 7.3 8.1 8.2 9.3 9.7 9.3 7.1 6.0 7.0 6.7 7.0 5.1 5.9 5.0 4.7 5.4 6.6 7.6 9.5 9.6 7.3 7.7 7.3 6.9 6.2 5.2 3.7 3.6 3.2 3.8 2.6 3.7 2.5 2.9 2.9 4.1
env er -D ow nto wn 27 .5 2 3.4 1 6.2 1 3. 9 11 .3 9.2 6 .0 10.6 8.3 7 .3 8.3 5 .0 3.3 4.9 8 .0 6. 7 7.8 7 .1 4. 3 4.9 3 .6 4. 6 5.4 7 .6 8.4 7 .8 7. 2 6.8 5. 9 9 .3 5 .2 5.6 5. 1 3 .3 3 .6 4.4 4.0 4 .9 5 .7 11. 1* 9 .6* 6 .9
enver-East Cen tral 15. 1 14 .8 14. 6 14 .4 18. 5 16 .4 1 .9 11. 7 15. 3 9 . 7 20 .1 17. 3 13. 6 6 . 1 6 .5 7 .9 8 .0 7 .8 5 .5 5 .0 5 .5 5 .8 4 .4 7 .5 8 .0 8 .5 5 .5 6 .4 7 .2 6 .8 5 .5 7 .7 6 .9 5 .2 5 .3 5 .6 6 .3 4 .7 6 .6 6 .9 6 .8 4 .2
enver-Far S E 15. 3 13 .2 11. 7 11 .9 10. 3 12 .8 9 .5 11. 0 11. 4 10. 6 8 .6 10. 5 8 . 7 10. 0 9 . 7 6 .2 6 .9 5 .2 5 .3 5 .3 5 .0 6 .7 7 .0 8 .7 10. 9 16. 4 14. 7 15. 5 9 .6 9 .4 5 .1 5 .1 4 .3 4 .5 5 .1 5 .8 5 .6 5 .3 4 .4 4 .6 4 .5 4 .3
env er -N or th C entr al 5 .6 1 1.5 7.7 9. 9 10 .0 6.3 7 .3 8. 0 1 1.7 7 .7 3.1 3 .2 3. 8 5 .1 3 .1 6. 7 1 .8 1 .6 3. 0 3 .4 2 .4 3. 8 4 .0 5 .2 4.4 10 .2 5. 0 8 .9 5. 7 8 .8 2 .3 1.2 2. 3 4 .2 0 .9 2.3 4. 9 2 .3 1 .5 5.1 3. 3 2 .1
env er -N or thea st 9 .8 1 2.7 1 1.2 9. 1 6 .8 8 .2 13 .7 1 1.4 8.3 12 .5 2 4.9 12 .8 1 0.9 1 3.7 4 .1 7.3 7.2 6 .9 5. 5 6 .0 8 .1 7. 3 7 .6 8 .1 4.6 6 .6 7. 9 6 .1 5.2 6 .8 4 .5 4.8 5.7 5 .1 4.4 5.8 4. 9 4 .8 3.9 6.5 4. 2 4 .8
env er -N or thw es t 14 .5 1 0.4 7.0 9. 8 15 .8 6.3 7 .2 12. 9 8 .8 6 .3 5.7 11 .7 4. 3 5 .4 6 .2 3. 1 4 .3 6 .7 3. 7 3 .7 5 .1 5 .0 5.1 7 .9 5.6 4 .5 3. 5 5 .3 4. 5 5 .1 5.5 4.1 8. 6 3 .0 2.7 5.5 3. 2 5 .2 3 .3 3.6 0. 0 1 .2
enver-Sout h Central 8 .5 14. 1 9 .9 9 .6 15. 1 12. 9 17. 0 12. 9 12. 4 8 .3 22. 5 14. 7 12. 3 12. 7 13. 1 14. 0 12. 1 9 .6 7 .2 6 .6 8 .8 9 .9 7 .5 9 .1 8 .0 9 .4 10 .0 11 .0 11. 8 9 .8 8 .6 4 .4 4 .6 4 .9 5 .8 3 .4 3 .5 4 .2 4 .1 4 .0 4 .9 6 .1 1
env er -Sou the as t 9 .4 10.2 6.6 7. 3 9 .6 8.3 6 .9 7.5 7.6 7 .0 7 .9 7 .0 8.4 6.2 4 .4 6. 7 7 .1 6 .3 6. 9 6 .9 4 .5 4. 3 5 .1 8 .5 7.9 7 .4 7. 2 6 .8 5. 0 5 .3 4 .8 4.8 4. 9 4 .2 4.2 4.1 3. 4 6 .2 4.8 7.6 6. 1 3 .1
env er-Southw est 6.9 8.1 6.0 5.8 5.4 8.4 5.4 7.5 6.9 6.7 6.1 5.7 5.2 5.6 7.7 6.3 6.3 5.4 6.8 4.1 6.1 6.0 5.4 6.9 5.9 5.3 5.9 5.8 5.4 5.3 4.2 5.4 4.6 3.7 4.2 5.4 3.4 3.9 2.9 2.6 4.1 4.9 env er -W es t C ent ral 4 .6 1 0.9 3.6 8. 8 6 .1 7.3 9 .9 13.9 11.9 7 .4 1 2.1 9 .2 7.8 13.0 6 .7 6.3 5.4 5 .8 8. 4 1 5.0 5 .6 4. 5 4.5 6 .9 2.3 8 .6 10. 1 7.8 11.9 10 .2 6 .8 2.8 4. 1 1 .4 0 .7 2.7 0.0 2 .7 8 .2 5.9 6.2 3 .3
ouglas County 26 .4 2 3.7 1 9.4 1 9.0 1 4.5 9 .8 9. 2 1 0.1 8 .4 6 .4 7 .5 8. 1 8 .2 5 .7 6 .4 7.0 6 .4 5 .8 5.5 7.0 6 .1 8. 3 5 .9 7 .4 7.1 5 .8 4.3 5.5 4.4 3. 9 4 .4 5.2 5. 3 3 .8 3.8 4.7 4. 9 3 .9 4.1 4.2 6. 5 2 .9
as tl e R oc k 23 .9 1 8.6 2 3.8 1 8. 7 16 .6 1 1.8 10 .0 13. 3 1 1.4 10 .4 1 2.5 10 .4 10.8 7.2 6 .4 6. 6 8.0 5 .9 5. 4 7.3 6 .7 7. 3 6.9 7 .7 7.9 9 .4 8. 5 1 1.0 6. 3 4 .6 5 .2 5.7 5. 2 4 .2 4 .4 5.5 3. 6 2 .9 2 .4 4.6 4. 1 1 .4
oug la s C oun ty- Nor th 28 .0 2 5.5 1 8.5 1 9. 1 13 .6 8 .9 8 .9 9.3 7.4 5 .3 6 .6 7 .5 7.3 5 .5 6 .4 7.2 6.0 5 .8 5. 6 6 .9 6 .0 8. 6 5 .7 7 .3 6.9 4 .9 3. 9 4 .9 4.2 3. 8 4 .3 5.1 5.4 3. 7 3 .7 4.6 5.0 4. 1 4 .5 4.2 6.8 3. 1
efferson County 9.1 8.8 1 0.4 9.7 9.1 9.1 8.5 9.3 8.5 8.0 6.8 7.6 7.5 7.3 7.2 6.6 6.3 7.4 5.3 6.0 5.6 6.0 6.5 7.3 7.6 7.2 6.3 7.3 5.8 5.4 3.9 4.5 4.7 4.5 4.4 4.4 3.8 4.0 3.7 4.2 3.7 3.7
rvada 7.2 9.4 12.1 9.5 10.7 11.0 8.3 12.4 9.6 9.8 7.6 11.1 7.9 9.2 7.9 6.2 8.1 8.0 4.7 5.4 6.4 6.0 5.1 5.6 8.1 6.7 5.7 7.3 5.6 4.9 3.4 4.5 4.4 3.8 4.9 4.6 3.8 1.9 3.5 4.1 4.5 3.8
ol den 7 .7 10.5 16.3 21. 5 14 .3 15 .1 17 .7 1 2.6 1 0.2 10 .0 4 .8 7 .3 8.1 6.7 6 .0 7. 2 5 .3 10 .4 5. 5 5 .5 5 .8 5. 7 5 .1 8 .4 7.5 9 .4 8. 1 7 .5 7. 5 6 .0 3 .8 6.2 6.1 6 .0 4 .8 3.9 4.2 4 .6 2 .6 2.1 3.7 4. 9
akewood-North 13.2 7.2 9.5 6.2 7.0 7.3 6.2 7.7 6.4 7.3 6.7 8.0 8.0 8.2 8.1 6.4 6.5 8.0 5.9 7.1 6.2 8.1 6.9 6.9 7.8 6.3 5.2 8.8 5.9 4.5 4.9 4.8 5.1 4.2 4.9 4.5 3.2 3.7 5.4 4.3 4.9 4.3
akew ood-South 7.8 8.4 8.2 9.4 7.9 8.1 7.5 8.3 8.4 7.3 6.5 6.5 6.1 6.4 6.6 6.6 6.0 6.7 5.3 5.6 5.3 5.2 6.7 7.6 7.0 6.5 6.2 6.4 5.0 5.4 3.8 4.2 4.6 4.8 4.1 4.4 4.0 4.6 3.6 4.6 3.2 3.3
heat R idge 11. 3 12 .2 17. 8 11 .9 12. 4 12 .3 10. 2 11. 7 11. 5 13. 1 10 .6 10. 8 16. 2 9 . 2 9 .7 7 .2 6 .7 6 .9 4 .7 8 .6 6 .1 7 .9 9 .1 9 .2 12. 2 12. 5 9 . 2 11. 7 13 .9 10. 9 4 .8 3 .8 2 .7 3 .4 3 .7 3 .9 3 .4 3 .6 2 .3 3 .6 3 .2 3 .2
etro Average 13. 1 13 .1 1 1.1 1 0.9 1 0. 5 9 .7 8. 5 1 0.0 9 .3 8. 0 7 .7 7. 9 7 .4 6 .9 6. 7 7 .0 7 .1 6. 2 5 .3 6 .1 5 .9 6.2 6.5 7 .9 8 .4 9 .0 7.4 7 .7 6. 5 6 .1 5.3 5.5 5. 5 4 .8 4.9 5.4 4. 9 4 .8 4.3 4.9 4. 6 4 .2
vacancy rate affected by new units leasing up
2013
Vacancy Rates by County and Market Area(In Percent)
2007200620052003 2004 2008 2009 20112010 2012

8/13/2019 4Q Vacancy Survey
http://slidepdf.com/reader/full/4q-vacancy-survey 5/27
I-6
Number Vacant Units Reporting Vacancy Rate
Totals for Denver Area 5,932 114,926 5.2
By County
Adams 823 15,535 5.3
Arapahoe 2,022 39,195 5.2
Boulder 360 10,627 3.4
Denver 1,629 26,620 6.1Douglas 426 8,467 5.0
Jefferson 672 14,482 4.6
By Market Area
Adams County
Aurora-North 3 269 1.1
Commerce City/Brighton 10 357 2.8
Northglenn/Thornton 484 7,675 6.3
Westminster 326 7,234 4.5
Arapahoe County
Arapahoe County - South 88 2,572 3.4
Arapahoe County - Southeast 176 2,964 5.9
Aurora - Central Northeast 73 2,417 3.0
Aurora - Central Northwest 236 4,208 5.6
Aurora - Central Southeast 132 3,995 3.3
Aurora - Central Southwest 244 5,957 4.1
Aurora - South 643 8,826 7.3
Englewood, Sheridan 141 3,071 4.6
Glendale 199 2,789 7.1
Littleton 90 2,396 3.8
Boulder/Broomfield Counties
Boulder County - Other 78 2,079 3.8
Broomfield 133 3,736 3.6
City of Boulder - Except University 78 2,003 3.9
City of Boulder - University Area 0 672 0.0
Longmont 71 2,137 3.3
Denver City/County
Denver - Central 211 3,772 5.6
Denver - Downtown* 454 4,162 10.9
Denver - East Central 125 2,017 6.2
Denver - Far Southeast 301 5,647 5.3
Denver - North Central 18 571 3.2
Denver - Northeast 106 1,679 6.3
Denver - Northwest 12 304 3.9
Denver - South Central 113 1,750 6.5
Denver - Southeast 183 4,109 4.5
Denver - Southwest 87 2,196 4.0
Denver - West Central 19 413 4.6
Douglas County
Castle Rock 24 1,244 1.9
Douglas County - North 402 7,223 5.6
Jefferson County
Arvada 75 1,915 3.9
Golden 37 1,029 3.6
Lakewood - North 79 2,325 3.4
Lakewood - South 422 7,518 5.6
Wheat Ridge 59 1,695 3.5
* vacancy rate affected by new units leasing up
Current Survey Responses

8/13/2019 4Q Vacancy Survey
http://slidepdf.com/reader/full/4q-vacancy-survey 6/27
REPORT DESCRIPTION AND METHODOLOGY
The purpose of the Quarterly Denver Area Apartment Vacancy Survey is to show vacancy rates by type ofapartment (efficiency; one bedroom; two bedroom, one bath; two bedroom, two bath; three bedroom; andother) and rent levels by location, age and size of building. In addition, information on estimates of newapartment inventory and absorption is also provided.
The survey covers six counties (market areas in parentheses): Adams (4), Arapahoe (10),Boulder/Broomfield (5), Denver (11), Douglas (2), and Jefferson (5). A composite report of the total sixcounty areas are also provided. A geographical definition of each market area is given at the end of eachcounty section of this report.
The market areas are:
Adams County
Aurora NorthCommerce CityNorthglenn/ThorntonWestminster
Arapahoe County
Arapahoe County – South Arapahoe County – Southeast Aurora – Central Northeast Aurora – Central Northwest Aurora – Central Southeast Aurora – Central SouthwestEnglewood/SheridanGlendaleLittleton
Boulder/Broomfield Counties
Boulder County – Other BroomfieldCity of Boulder – Except UniversityCity of Boulder – University AreaLongmont
Denver City/County
Denver – Central
Denver – DowntownDenver – East CentralDenver – Far SoutheastDenver – North CentralDenver – NortheastDenver – NorthwestDenver – South CentralDenver – SoutheastDenver – Southwest
Denver – West Central
Douglas County
Castle Rock Douglas County – North
Jefferson County
Arvada GoldenLakewood – NorthLakewood – SouthWheat Ridge

8/13/2019 4Q Vacancy Survey
http://slidepdf.com/reader/full/4q-vacancy-survey 7/27
The source for the Census Tract information was the Denver Regional Council of Governments, 1990Census Tracts, Denver Region, Regional Data Series; U. S. Census, 1990 Census of Population andHousing, Population and Housing Characteristics for Census Tracts and Block Numbering Areas, Denver-Boulder CO CMSA (Part) Denver, CO PMSA – Maps. A “pt” next to a tract indicates that it is only partiallylocated in the geographic entity.
Where market areas/jurisdictions overlap more than one county, they are placed in the county in where ithas the largest population concentration. Examples are Broomfield and Westminster.
The vacancy rate was calculated based on the number of units reporting in each category, and thecorresponding number of vacant units.
All vacancy and rental rates are for the 10th of the month of the survey (March, June, September,December). In addition, the samples were taken with the assumption that the rates were for unfurnishedrental units with residents paying electricity and gas. Turnover rates are based on the months ofFebruary, May, August and November.
The sample of apartment complexes/buildings surveyed was developed from official lists. Surveys werecompleted online and via paper forms, which were checked for completeness and accuracy. Tabulationswere performed by the use of digital database and spreadsheet programs. The cumulative total has aconfidence interval of +/-1 percent at the 95 percent confidence level.
The excellent industry cooperation by the Apartment Association of Metro Denver, Institute of Real Estateofficials, and apartment owners and managers is greatly appreciated. Survey management and analysiswas managed by Ron L. Throupe, Ph.D., University of Denver; Jennifer L. Von Stroh, of ColoradoEconomic and Management Associates. Assisting were S.P. Von Stroh, Ph.D.; C.M. Von Stroh, MBA,MA; J.C. Von Stroh, Ph.D., MBA; and J.E. Von Stroh, J.D, MS.
The information for this survey was obtained from participating apartment managers, owners, andproperty managers. All information collected on each building/complex is TOTALLY CONFIDENTIAL,only survey totals are published. Information furnished by participants is considered reliable. Thesponsors and author make no warranty, expressed or implied, and assume no legal liability orresponsibility for the inclusion of data from the participants in the survey or for the use of the data from theSurvey. Any quotations of the survey must indicate the sponsors and the author.
This report is copyrighted by Jennifer L. Von Stroh. It is both unethical and illegal to make
photocopies of, or d istribute electronically, th is report w ithout express written permission of theauthor.

8/13/2019 4Q Vacancy Survey
http://slidepdf.com/reader/full/4q-vacancy-survey 8/27
II-11
County 1st 2nd 3rd 4th 1st 2nd 3rd 4th 1st 2nd 3rd 4th 1st 2nd 3rd 4th 1st 2nd 3rd 4th 1st 2nd 3rd 4th 1st 2nd 3rd 4th 1st 2nd 3rd 4th 1st 2nd 3rd 4th 1st 2nd 3rd
Adams 9.6 9.9 7.6 11.7 10.6 8.7 7.7 8.1 7.0 6.1 6.4 7.4 7.8 6.3 5.9 7.4 6.4 6.8 7.5 8.8 8.4 8.5 6.7 6.3 6.8 5.2 4.4 5.7 5.6 5.2 5.3 5.3 4.5 4.9 4.2 4.5 5.2 3.8 5.7
- 4. 1 - 6.3 - 5. 0 - 0. 4 1 .0 - 1 .2 0 .1 - 3 .6 - 3 .6 - 2 .6 - 1 .4 - 0 .7 0 .8 0 .2 - 0 .5 0 .0 - 1 .3 0 .4 1 .5 1 .4 1 .9 1 .8 - 0 .8 - 2 .5 - 1. 6 -3 .3 - 2. 2 - 0. 6 - 1. 2 0 .0 0 .9 - 0. 5 - 1. 1 - 0.3 - 1. 1 - 0. 7 0 .6 - 1. 1 1 .4
12 .6 11 .1 9 .8 9.7 9.9 9 .6 9 .7 8 .8 7.9 7.2 6 .9 6.7 6.9 7.0 6.9 6.8 6.5 6.6 7.0 7.4 7.8 8.3 8.1 7.5 7.1 6.2 5.7 5.5 5.2 5.3 5.5 5.3 5.1 5.0 4.7 4.6 4.7 4.4 4.8
Arapahoe 10.8 9.8 9.2 10.1 8.9 7.4 6.8 7.4 7.0 6.8 6.7 7.4 7.8 6.1 5.0 6.0 6.5 5.9 6.9 8.3 9.7 10.7 8.5 8.6 7.2 6.4 6.7 6.6 6.4 5.5 5.6 6.8 6.3 5.5 4.8 5.0 4.1 4.5 4.8
-2.5 -2.4 -1.3 -0.7 -1.9 -2.4 -2.4 -2 .7 -1 .9 -0 .5 -0 .1 0.0 0.8 -0 .7 -1 .7 -1 .4 -1 .4 -0 .2 1.9 2.3 3.3 4.7 1.6 0.3 -2.5 -4.2 -1.8 -2.0 -0.8 -1.0 -1.2 0.2 -0.2 0.1 -0.8 -1.8 -2.1 -1.0 0.0
1 1. 1 1 0. 5 1 0. 2 1 0. 0 9 .5 8 .9 8 .3 7 .6 7 .1 7 .0 7 .0 7 .0 7 .2 7 .0 6 .6 6 .2 5 .9 5 .8 6 .3 6 .9 7 .7 8 .9 9 .3 9 .4 8.7 7.7 7.2 6.7 6.6 6.3 6.0 6.1 6.0 6.1 5.9 5.4 4.9 4.6 4.6
11.0 9.5 6.0 9.0 11.1 8.7 7.8 7.3 6.9 7.0 4.8 5.5 4.7 4.0 3.6 5.4 5.7 6.4 4.7 6.1 6.0 7.2 5.5 5.8 5.0 4.9 3.5 3.6 4.9 4.6 4.7 4.4 3.9 3.6 2.9 3.7 3.2 3.8 2.8
-1.2 -2.4 -1.1 -0 .6 0.1 -0 .8 1.8 -1 .7 -4 .2 -1 .6 -3 .0 -1 .7 -2 .2 -3 .0 -1 .1 -0 .1 0.9 2.4 1.1 0.6 0.3 0.8 0.8 -0 .3 -1.0 -2.2 -2.0 -2.2 -0.2 -0.3 1.2 0.9 -1.0 -1.0 -1.8 -0.7 -0.6 0.2 -0.2
9.9 9.3 9.0 8.9 8.9 8.7 9.1 8.7 7.6 7.2 6.5 6.0 5.5 4.8 4.5 4.4 4.7 5.3 5.5 5.7 5.8 6.0 6.2 6.1 5.9 5.3 4.8 4.3 4.2 4.1 4.4 4.7 4.4 4.2 3.7 3.5 3.4 3.4 3.4
Denver 10.2 1 0.1 8.3 9.8 9.2 8.7 9.6 8.7 7.8 7.6 7.3 6.9 7.2 6.1 5.7 5.5 5.1 5.7 6.0 8.0 8.6 9.8 8.5 8.8 6.9 7.4 5.3 5.2 4.8 4.1 4.3 4.8 4.2 4.8 4.3 6 .1* 5.4 4.6 4.6
-1.6 -2.2 -1.7 0.0 -1 .0 -1 .4 1.3 -1 .1 -1 .4 -1 .1 -2 .3 -1 .8 -0 .6 -1 .5 -1 .6 -1 .4 -2 .1 -0 .5 0.3 2.5 3.5 4.1 2.5 0.8 -1.6 -2.3 -3.2 -3.6 -2.1 -3.3 -1.0 -0.5 -0.6 0.6 0.0 1.4 1.2 -0.2 0.3 #
10.6 10.0 9.6 9.6 9.4 9.0 9.3 9.1 8.7 8.4 7.9 7.4 7.3 6.9 6.5 6.1 5.6 5.5 5.6 6.2 7.1 8.1 8.7 8.9 8.5 7.9 7.1 6.2 5.7 4.9 4.6 4.5 4.3 4.5 4.5 4.9 4.8 4.7 4.8
Douglas 14.5 9.8 9.2 10.1 8.4 6.4 7.5 8.1 8.2 5.7 6.4 7.0 6.4 5.8 5.5 7.0 6.1 8.3 5.9 7.4 7.1 5.8 4.3 5.5 4.4 3.9 4.4 5.2 5.3 3.8 3.8 4.7 4.9 3.9 4.1 4.2 6.5 2.9 3.5
-12.0 -13.9 -10.1 -8.9 -6.1 -3.4 -1.7 -2.0 -0.3 -0.6 -1.1 -1.0 -1.8 0.1 -0 .9 0.0 -0 .3 2.5 0.4 0.4 0.9 -2 .5 -1 .6 -1 .9 -2.6 -1.9 0.1 -0.3 0.9 -0.1 -0.6 -0.5 -0.5 0.1 0.3 -0.4 1.6 -1.0 -0.6
1 9.1 1 5.6 1 3.1 10 .9 9.4 8.5 8.1 7 .6 7 .5 7.4 7.1 6.8 6 .4 6 .4 6.2 6.2 6.1 6 .7 6 .8 6.9 7.2 6.5 6 .1 5 .7 5.0 4 .5 4.5 4 .5 4.7 4 .7 4.5 4.4 4 .3 4.3 4 .4 4.3 4 .7 4.4 4 .3
Jefferson 9.1 9.1 8.5 9.3 8.5 8.0 6.8 7.6 7.5 7.3 7.2 6.6 6.3 7.4 5.3 6.0 5.6 6.0 6.5 7.3 7.6 7.2 6.3 7.3 5.8 5.4 3.9 4.5 4.7 4.5 4.4 4.4 3.8 4.0 3.7 4.2 3.7 3.7 3.6
0.0 0.3 -1.9 -0.4 -0.6 -1.1 -1.7 -1.7 -1.0 -0.8 0.5 -1 .0 -1 .2 0.1 -1 .9 -0 .5 -0 .7 -1 .4 1.1 1.2 1.9 1.2 -0 .2 0.0 -1.8 -1.8 -2.3 -2.8 -1.1 -0.9 0.5 -0.1 -0.9 -0.6 -0.7 -0.2 -0.1 -0.3 -0.1
9.5 9.6 9.1 9.0 8.9 8.6 8.2 7.7 7.5 7.3 7.4 7.1 6.9 6.9 6.4 6.3 6.1 5.8 6.0 6.3 6.8 7.1 7.1 7.1 6.6 6.2 5.6 4.9 4.6 4.4 4.5 4.5 4.3 4.1 4.0 3.9 3.9 3.8 3.8
Me tro Av erag e 1 0.5 9.7 8 .5 10 .0 9.3 8.0 7.7 7 .9 7 .4 6.9 6.7 7.0 7 .1 6 .2 5.3 6.1 5.9 6 .2 6 .5 7.9 8.4 9.0 7 .4 7 .7 6.5 6 .1 5.3 5 .5 5.5 4 .8 4.9 5 .4 4.9 4.8 4 .3 4.9 4.6 4 .2 4.4
-2.6 -3.4 -2.6 -0.9 -1.2 -1.7 -0.8 -2.1 -1.9 -1.1 -0.9 -0.9 -0.3 -0.8 -1.4 -0.9 -1.2 0.0 1.2 1.8 2.5 2.8 0.9 -0 .2 -1.9 -2.9 -2.1 -2.2 -1.0 -1.3 -0.3 -0.1 -0.6 0.0 -0.7 -0.5 -0.3 -0.6 0.2
11.4 10.5 9.9 9.7 9.4 8.9 8.7 8.2 7.7 7.5 7.2 7.0 6.9 6.7 6.4 6.2 5.9 5.9 6.2 6.6 7.2 8.0 8.2 8.1 7.6 6.9 6.4 5.9 5.6 5.3 5.2 5.2 5.0 5.0 4.8 4.7 4.6 4.5 4.5
* vacancy rate affected by new units leasing up
20122009 201020082005 20112006 20072004
Vacancy Rates by Coun ty
2013
Due to rounding of the vacancy rate, numbers may not always add exactly.
Third Figure = Twelve Month Average
Second Figure = Change from Year Ago
First Figure = Rate for Quarter in Percent
Boulder/
Broomfield

8/13/2019 4Q Vacancy Survey
http://slidepdf.com/reader/full/4q-vacancy-survey 9/27
II-12
County 1st 2nd 3rd 4th 1st 2nd 3rd 4th 1st 2nd 3rd 4th 1st 2nd 3rd 4th 1st 2nd 3rd 4th 1st 2nd 3rd 4th 1st 2nd 3rd 4th 1st 2nd 3rd 4th 1st 2nd 3rd 4th 1st 2nd 3rd
Adams Up to 8 0.0 27.3 0.0 0.0 10.0 7.7 9.1 0.0 0.0 0.0 15.4 0.0 0.0 0.0 0.0 10.0 0.0 0.0 0.0 0.0 0.0 0.0 0.0 0.0 0.0 0.0 50.0 0.0 0.0 0.0 0.0 0.0
9 to 50 4.5 6.7 9.3 6 .6 9 .6 6 .7 6 .4 11 .3 4.0 3.9 7.4 3 .8 1 .0 12 .1 0 .0 3 .8 7 .4 10.6 7.0 7.2 7.7 10.6 10.1 7.7 7.1 8.8 7.9 6.9 4.5 5 .9 6 .6 2 .9 3.9 5.7 3.6 3 .4 1.3 2.8 4.7
5 1 to 9 9 1 4.8 1 4.5 8.2 9 .4 11 .9 7 .7 6 .5 5 .6 9.6 5.2 5.8 12.5 16 .6 9 .4 6 .3 7 .7 6 .9 5 .1 4.3 4.7 8.2 10.2 8.7 9.4 10.3 8 .7 9.8 7 .8 8 .3 6 .3 4 .1 5 .3 1.2 2.8 3.4 3 .4 2.6 2.1 1.3
1 00 to 19 9 9.2 1 1.2 7.4 9 .0 8 .8 7 .5 8 .0 6 .2 5.6 6.1 6.8 9 .1 8 .6 5 .4 5 .6 5 .6 5 .7 4.2 5.8 9.4 7.5 9.1 10.2 5.7 6 .2 5.8 5.9 6.1 6.5 3.8 6 .2 5 .2 3.4 6.4 6.3 3.8 3.0 3.3 3.7
2 00 to 34 9 9.0 8.8 7.4 12 .4 11 .1 8 .5 7 .8 8 .2 6.3 5.8 6.3 6 .9 7 .7 5 .9 5 .9 6 .6 6 .4 6.8 7.3 8.6 8.6 7.7 6.8 6.9 8 .1 5.3 4.4 6.6 6.1 5.2 5 .3 5 .2 4.9 4.8 4.0 4.7 4.3 4.0 5.9
3 50 u p 1 0.7 9.7 8.2 12 .4 10 .5 10 .0 7 .7 8 .9 8.2 6.8 6.3 7 .1 7 .2 7 .0 6 .2 9 .0 6 .9 7.5 8.3 9.2 8.4 9.2 5.1 5.7 4 .9 4.5 3.4 4.4 4.5 5.8 5 .1 5 .4 4.6 4.7 3.9 4.6 6.5 3.8 6.4 Arapahoe Up to 8 7.0 13.5 5.2 17.5 10.6 11.8 8.0 6.3 7.3 10.8 8.8 5.6 5.9 11.0 3.8 1.6 2.7 1.4 8.5 0.0 5.0 1.8 5.2 10.0 2.0 1.8 1.6 1.8 6.1 11.1 6.8 0.0 2.4 5.6 7.9 3.9 8.2 0.0 0.0
9 to 50 8.0 8.1 5.7 10 .5 10 .4 11 .7 6 .0 7 .8 5.3 8.8 4.8 15 .2 14 .3 8 .2 6 .4 1 .8 5 .8 3.6 6.9 9.0 1 0.4 1 4.2 8.9 1 3.7 9.2 9.7 4.9 9.7 5.6 2 .9 3 .0 6 .3 3.3 1.2 2.1 4 .9 3.8 3.0 0.8
5 1 to 9 9 9.4 1 0.2 1 0.0 10 .6 9 .3 8 .9 9 .1 9 .6 7.9 9.0 8.3 15 .3 6 .8 7 .6 4 .7 4 .3 10 .8 5.5 8.3 8.5 7.9 1 0.8 1 0.6 6.4 8.8 8.5 5.1 4.2 4.0 4 .4 2 .6 3 .0 1.4 6.8 2.9 1 .8 1.8 5.2 2.0
1 00 to 19 9 9.9 9.7 8.6 9 .2 9 .5 8 .8 6 .9 5 .0 7.2 7.2 7.6 7 .5 9 .0 7 .2 6 .6 7 .5 5 .0 5.3 4.9 6.6 7.0 6.3 8.3 9.2 9 .1 7.5 5.8 5 .4 5.4 5.8 5 .6 4 .7 4.5 4.3 3.7 3.9 4 .2 4.5 4.4
2 00 to 34 9 1 0.1 9.3 8.8 10 .8 8 .2 7 .1 5 .8 7 .1 6.6 5.8 5.1 6 .7 7 .2 5 .0 4 .4 5 .2 6 .3 5.6 7.5 8.7 1 0.4 9.3 8.7 7.4 5 .6 5.0 5.8 5.5 5.1 4.4 4 .3 5 .1 4.9 4.3 4.2 5.2 4.1 3.9 3.7
3 50 u p 1 2.1 1 0.4 9.9 9 .5 9 .2 6 .8 7 .8 8 .3 7.5 7.6 8.2 6 .9 8 .0 6 .7 5 .1 6 .5 6 .7 6.5 6.7 8.2 9.8 12.9 8.3 9.2 7.9 7.1 7.8 7.7 7.9 6 .3 6 .6 8 .7 7.8 6.8 5.5 5.2 4.3 5.0 5.8
Up to 8 4.4 0.0 9.1 9 .8 12 .3 10 .2 3 .6 2 .1 7.3 9.1 7.3 0 .0 2 .1 5 .6 0 .0 0 .0 0 .0 0.0 0.0 0.0 0.0 6.7 3.6 0.0 2 .7 0.0 0.0 0.0 0.0 0.0 5 .8 1 .7 3.3 4.7 4.7 0.0 2.0 2.0 1.9
9 to 50 5.3 7.2 7.0 6.0 4.0 5.7 8.0 5.4 4.8 4.4 4.5 2.6 2.4 3.3 3.3 2.1 1.6 2.2 4.4 1.6 2.1 5.5 3.7 5.4 2.5 2.4 2.0 1.3 1.4 0.7 0.3 0.0 0.4 1.9 1.4 0.4 1.5 1.0 0.0
5 1 to 9 9 8.3 10.3 4.9 7 .4 11 .0 8 .0 5 .2 5 .1 3.7 6.8 6.5 5 .8 2 .2 2 .5 3 .2 3 .6 5 .0 2.9 5.2 4.1 2.9 7.3 3.4 5.8 6 .0 8.3 1.4 6 .2 4.4 2.0 1 .7 1 .4 1.3 1.7 2.0 0.7 1.1 4.4 1.6
1 00 to 19 9 1 0.0 6.8 4.6 8 .2 7 .8 10 .0 5 .3 6 .2 6.9 7.3 5.0 4 .5 4 .3 5 .9 2 .8 3 .4 4 .2 3.7 3.9 4.8 4.8 7.7 4.8 5.5 4 .7 5.8 3.0 2.4 2.8 3.9 4 .6 2 .7 3.9 3.8 1.4 2.2 1.9 3.4 2.0
2 00 to 34 9 1 0.3 1 0.5 6.5 10 .1 11 .8 7 .8 7 .0 8 .9 6.4 7.9 4.9 6 .9 5 .7 4 .0 3 .6 5 .8 5 .4 7.2 4.4 5.3 5.3 6.2 6.7 5.8 6 .1 5.3 3.5 3.6 6.2 5.4 4 .6 5 .1 3.9 3.7 2.8 4.2 2.8 3.8 3.0
3 50 u p 1 4.7 1 0.6 7.0 8 .8 13 .8 9 .7 10 .5 7 .0 9.0 6.0 3.9 4.8 4 .1 2 .3 4 .7 7 .4 7 .8 8 .4 5.6 9.1 9.1 8.4 4.9 5.9 4.1 3.9 4.3 4.5 4.7 4 .8 5 .8 5 .2 4.4 3.7 4.1 4 .3 4.6 4.1 3.3
Den ver Up to 8 7.8 8.3 7.8 11 .3 10 .6 8 .0 6 .1 9 .0 4.9 8.6 4.9 3 .2 5 .1 5 .1 5 .2 8 .4 7 .1 7.1 7.0 8.8 6.9 4.3 3.7 2.6 5 .2 5.6 3.3 3.6 1.7 3.1 2 .4 2 .1 0.7 3.9 1.7 4.6 2.4 3.2 4.7
9 to 50 1 1.2 1 1.3 1 0.8 11 .6 12 .3 11 .4 12 .7 11 .4 8.2 7.3 6.0 6 .3 6 .4 6 .2 7 .6 6 .1 5 .3 5.8 6.6 8.2 6.4 9.1 7.1 9.1 6 .6 7.3 6.0 3.9 3.9 4.3 3 .4 3 .0 2.4 3.8 2.7 3.5 3 .1 3.6 3.8
5 1 to 9 9 1 2.7 1 1.6 5.7 10 .7 11 .0 8 .1 11 .2 10 .9 7.4 8.0 7.2 6.6 5 .7 4 .7 5 .2 4 .5 4 .7 4.8 4.9 5.9 4.4 6.0 6.5 8.7 7.9 7.3 6.2 5.8 4.3 6 .1 4 .4 3 .7 4.0 5.2 5.2 4.8 3.1 6.2 6.4
1 00 to 19 9 9.9 9.9 6.3 7 .0 6 .3 5 .7 7 .9 6 .4 6.2 5.0 7.0 7 .3 8 .0 4 .3 4 .9 4 .0 4 .5 4.4 4.4 5.9 8.6 6.3 7.2 6.5 7 .4 7.4 6.8 7 .5 5.7 3.7 3 .3 5 .7 4.1 4.0 3.7 3.9 4 .5 3.7 4.5
2 00 to 34 9 9.5 7.7 6.7 9 .0 8 .2 7 .3 7 .0 6 .8 7.6 5.9 6.8 6 .8 7 .5 7 .9 6 .3 6 .3 5 .2 6.3 6.3 9.2 1 0.4 9.6 8.5 7.6 5 .4 6.7 4.6 4.8 4.5 3.2 4 .5 5 .0 4.5 5.4 4.7 9 .0 * 7 .2 5.1 5.1
3 50 u p 9 .7 1 2. 7 1 1. 0 1 0. 9 9 .9 11 .3 12 .1 10 .5 8 .8 10 .8 8 .4 7 .2 7 .3 5 .3 4 .9 5 .3 5 .2 5 .7 6 .4 8 .0 7 .9 12 .8 10 .0 11 .1 8 .4 8 .5 5 .2 5 .1 5. 2 5 .0 4 .6 4 .8 4 .5 4 .6 4 .4 5 .4 4 .9 4 .4 4 .0
Douglas Up to 8
9 to 50 2.0 2.6 3.6 1.2 10.8 2.0 0.0 6.0 8.0 4.8 4.0 14.0 10.8 13.3 7.1 14.3 0.0 0.0 0.0 21.4 7.1 14.3 7.1 0.0 0.0 0.0
51 to 99 11.7 5.6 1.6 1.3 0.0 3.1 7.8 19.2
100 to 199 10.3 5.9 6.5 4.4 4.3 4.3 4.3 4.3 11.3 4.3 4.8
2 00 to 34 9 1 5.1 9.6 9.8 10 .4 9 .9 6 .6 7 .5 8 .8 8.7 6.5 7.3 7 .3 7 .7 6 .1 5 .8 6 .5 5 .6 7.6 6.0 8.0 7.4 5.9 4.6 5.9 4 .1 3.6 4.2 4.8 5.2 3.5 4 .0 4 .2 4.5 4.5 3.1 4.6 8.6 3.1 3.4
3 50 u p 1 4.5 1 0.5 9.1 10 .3 7 .6 6 .3 7 .5 7 .7 7.9 5.3 5.8 6.9 5 .7 5 .6 5 .3 7 .3 6 .4 8.7 5.8 7.1 6.9 5.5 4.1 5.1 4.5 3.9 4.4 5.4 5.6 3 .9 3 .7 4 .7 5.3 3.3 5.0 4.0 5.1 2.8 3.5
J ef fe rs on U p t o 8 1 2. 9 12 .1 16 .2 12 .7 13 .0 17 .6 9 .1 11 .1 4 .4 5 .1 2 .4 1 .2 3 .0 9 .6 5 .8 6 .0 3 .5 3 .9 4 .0 10 .3 7 .6 7 .1 13 .8 8 .1 5 .5 4 .4 6 .9 3 .9 3. 8 5 .2 3 .1 1 .7 2 .4 1 .7 3 .0 0 .8 2 .4 1 .5 0 .8
9 to 50 1 0.6 11.4 7.9 11 .5 9 .1 8 .2 9 .7 8 .3 7.3 7.9 9.1 8 .9 7 .3 7 .9 6 .6 6 .2 4 .9 5.6 4.5 5.9 7.5 7.7 5.8 8.1 5 .5 5.9 4.6 3 .3 3.0 3.4 3 .6 2 .8 3.5 3.2 1.4 2.8 2.5 2.0 1.9 5 1 to 9 9 8.2 9.3 7.0 8 .4 6 .8 7 .5 6 .5 6 .0 4.9 7.0 9.2 5 .9 5 .8 6 .7 6 .2 5 .0 7 .8 7.3 8.6 7.7 8.8 9.0 6.0 1 2.2 6 .7 5.8 5.6 4 .4 4.3 4.5 4 .5 3 .1 4.6 4.3 2.5 2.8 3.5 4.1 3.6
1 00 to 19 9 9.6 9.9 8.4 9 .5 8 .3 9 .2 7 .0 6 .9 8.7 8.8 6.6 6 .3 7 .4 6 .4 5 .2 5 .6 4 .8 7.7 6.6 8.5 9.8 8.2 6.4 8.0 7 .2 7.0 5.0 4 .8 4.6 4.6 4 .2 4 .2 3.3 3.8 3.2 4.2 3 .5 3.4 3.3
2 00 to 34 9 1 0.9 1 1.1 1 1.9 10 .0 10 .4 9 .8 8 .3 8 .6 9.5 8.1 7.9 7 .3 6 .1 8 .6 5 .6 6 .5 6 .3 5.9 7.7 8.4 7.5 8.0 7.5 6.8 5 .8 5.3 3.1 4.1 5.0 4.2 3 .7 3 .9 3.9 3.8 3.8 4.4 4 .2 4.3 3.6
350 up 6.5 5.6 4.0 7.7 6.6 5.2 4.4 7.1 4.6 5.2 6.4 5.8 5.7 6.5 4.7 5.5 5.0 4.5 4.7 5.2 5.7 4.7 4.5 6.1 4.7 4.4 3.7 5.0 4.8 5.2 5.7 5.2 3.9 4.3 4.6 4.5 3.3 3.1 4.1
Metro Up to 8 8.4 9.8 8.6 12 .5 11 .0 10 .3 6 .6 7 .6 5.5 8.3 5.7 3 .8 4 .4 7 .2 4 .6 6 .0 4 .8 4.8 5.9 7.2 6.3 4.9 7.1 5.0 4 .6 4.2 3.7 3.0 2.8 4.5 3 .8 1 .5 2.2 3.7 3.3 2.6 3.1 2.0 2.3
Average 9 to 50 9.6 10.0 9.1 10.7 10.6 10.1 10.3 10.1 7.3 7.3 6.3 7.5 7.1 6.9 6.9 5.4 5.1 5.5 6.1 7.4 6.8 9.3 7.1 9.3 6.5 7.1 5.5 4.5 3.7 3.7 3.3 3.2 2.6 3.4 2.4 3.4 2.9 3.1 2.9
5 1 to 9 9 1 1.1 11.1 6.8 9 .3 9 .8 7 .9 8 .6 8 .2 6.9 7.6 7.6 8 .7 6 .5 6 .1 5 .3 4 .8 6 .9 5.4 6.3 6.5 6.5 8.3 7.0 9.3 7 .9 7.5 5.9 5 .4 4.5 5.0 3 .7 3 .4 3.2 4.8 3.8 3.3 2 .7 5.0 4.2
1 00 to 19 9 9.7 9.7 7.4 8 .7 8 .2 8 .1 7 .1 6 .1 7.1 6.9 6.8 7 .1 7 .7 5 .9 5 .3 5 .4 4 .8 5.2 5.2 7.1 7.8 7.2 7.3 7.4 7 .2 7.0 5.5 5 .4 5.1 4.5 4 .8 4 .8 3.9 4.3 3.8 3.8 3 .7 3.8 3.8
2 00 to 34 9 1 0.4 9.2 8.4 10 .5 9 .4 7 .8 7 .0 7 .7 7.4 6.4 6.3 6 .9 7 .1 6 .3 5 .3 6 .0 5 .9 6.3 6.9 8.4 9.0 8.4 7.7 7.1 5 .9 5.5 4.6 5.2 5.3 4.3 4 .5 4 .9 4.6 4.5 4.0 5.5 5.0 4.1 4.3
3 50 u p 1 1.1 1 0.1 9.1 10 .0 9 .3 8 .0 8 .3 8 .5 7.6 7.4 7.2 6.8 6 .9 6 .0 5 .2 6 .6 6 .3 6.6 6.5 7.9 8.3 10.3 7.1 8.2 6.7 6.2 5.7 6.1 6.1 5 .6 5 .6 6 .5 5.9 5.3 4.9 4 .9 4.8 4.3 4.9
* vacancy rate affected by new units leasing up
(In Percent)
2011201020052004 2006 2013
Vacancy Rates by Size of Building by Count y
20082007 2009 2012
Boulder/
Broomfield
Number of
Units

8/13/2019 4Q Vacancy Survey
http://slidepdf.com/reader/full/4q-vacancy-survey 10/27
II-13
1s t 2nd 3rd 4th 1st 2 nd 3rd 4th 1s t 2nd 3rd 4th 1st 2 nd 3rd 4th 1st 2 nd 3rd 4th 1s t 2nd 3rd 4th 1s t 2nd 3rd 4th 1s t 2nd 3rd 4th 1st 2nd 3rd 4th 1st 2nd 3rd
Adams49 9 b el ow 1 8. 3 1 4. 0 6 .7 9 .5 7. 5 8. 8 1 2.8 6 .6 2 .2 6 .3 13 .0 9. 2 9 .2 3 .5 3 .3 4 .7 4 .2 6. 2 4. 9 7 .7 8 .3 7 .8 6 .4 2. 8 16 .4 1 7. 6 2. 8 11 .9 1 .9 1 0.5 7. 4 3 .4 1 .3 6. 3 2 .2 3 .2 0 .7 7. 8 4 .9
500 to 749 7.8 10.2 5.8 10.3 9.1 8.0 8.4 7.2 5.4 4.9 6.0 6.5 7.5 5.5 5.5 6.7 5.8 5.6 7.1 8.9 7.5 8.2 7.3 6.1 6.9 5.0 4.4 6.0 5.9 4.9 4.7 4.4 4.1 3.8 3.7 3.8 2.9 3.5 3.2
750 to 999 9.8 9.8 7.9 11.0 9.6 8.6 7.2 8.7 7.6 6.4 6.0 7.7 8.0 7.3 6.5 7.7 6.6 6.8 7.6 9.2 9.0 8.9 6.6 6.5 6.9 5.3 4.6 6.0 5.7 5.9 6.0 5.7 4.8 5.9 4.8 4.7 7.2 3.9 7.2
1000 abov e 10.3 9.0 9.7 15.0 14.6 9.8 7.5 8.4 8.1 7.3 6.9 7.6 7.5 6.3 5.8 7.8 7.6 8.1 8.1 8.4 8.3 8.4 6.0 6.3 6.1 4.9 4.4 4.7 5.2 4.4 5.1 5.6 4.8 4.7 4.1 5.4 5.1 4.2 6.9
Arapahoe499 below 5.5 11.4 10.0 11.0 5.0 5.8 9.3 11.8 9.1 7.4 9.6 11.6 10.1 6.4 7.0 8.2 9.0 11.3 12.5 18.8 16.2 17.3 15.2 11.4 18.0 18.4 13.9 14.3 13.1 10.0 12.4 8.4 7.3 5.0 4.0 4.9 3.2 3.7 3.9
500 to 749 11.6 10.0 8.7 10.0 7.8 7.2 6.4 6.6 6.3 6.4 6.5 6.8 8.3 5.5 4.4 5.2 7.1 5.8 6.5 6.5 9.4 12.6 7.5 8.5 6.8 6.6 6.0 5.4 5.4 4.6 5.3 6.9 5.3 6.6 5.0 4.0 3.4 5.2 4.9
750 to 999 9.3 8.2 8.2 9.5 8.3 7.2 6.4 6.9 6.7 7.5 6.5 7.1 7.7 6.7 5.3 6.2 5.7 5.6 6.8 7.9 9.4 9.2 9.0 8.5 6.6 5.7 6.3 6.6 5.9 5.2 5.5 6.6 7.3 5.2 5.0 5.5 3.8 4.1 4.7
1 00 0 a bo ve 1 2. 0 1 2.0 1 0. 6 1 1. 2 10 .2 8 .3 7. 2 7 .8 7 .6 6 .3 6 .7 7 .5 6. 9 5 .9 5 .0 6 .1 6 .4 6 .1 6. 6 8. 8 1 0.0 9 .4 7 .9 8 .5 6 .6 5 .1 6. 8 6 .7 7 .1 6. 0 5 .0 6 .9 5 .8 5. 0 4 .4 5 .5 5 .4 4. 4 4 .8
499 below 12.9 9.6 8.1 6.1 8.3 8.5 4.3 4.1 3.6 4.3 4.5 5.1 4.3 6.5 3.8 4.1 3.7 5.1 4.5 4.9 4.9 7.9 5.0 5.3 4.8 6.5 3.9 1.4 2.0 3.1 3.0 3.6 1.6 3.9 2.4 3.4 2.3 2.2 2.8
500 to 749 7.2 7.8 4.8 8.8 12.1 5.3 9.0 5.4 5.2 5.0 3.7 4.2 3.7 2.3 2.2 5.5 6.7 7.0 4.2 5.2 5.4 6.6 5.8 6.1 4.8 4.3 3.0 2.5 2.6 2.2 4.2 3.6 3.8 2.6 2.4 2.1 1.3 3.6 1.9
750 to 999 11.9 8.7 4.9 9.2 9.8 8.2 8.9 7.4 5.7 7.9 5.5 6.6 5.6 4.4 3.8 5.7 6.0 7.0 4.8 6.0 5.7 7.6 6.0 6.3 5.6 5.3 3.2 3.2 5.9 5.0 4.6 4.8 3.9 3.7 2.7 4.0 3.6 4.3 2.7
10 00 ab ov e 1 2. 8 1 1. 4 7 . 0 9 . 1 1 3. 7 1 2.2 6 .9 9 .6 1 1. 4 8 . 6 4. 7 5. 4 4 .5 3 .6 4 .4 5 .4 5 .2 6. 2 5 .1 7 .6 7 .3 6 .8 5 .0 5. 0 4 .7 4 .1 4 .1 5. 4 6 .0 6 .0 5. 5 4 .6 4 .5 4 .0 3. 8 4 .5 4 .1 3 .6 3. 4
Denver 499 below 8.4 11.1 9.4 9.4 9.4 8.7 9.1 8.3 6.3 5.8 5.4 4.8 5.2 3.5 5.4 4.4 3.6 3.8 4.1 4.8 5.5 7.0 5.6 5.7 5.4 6.2 4.9 3.5 3.4 3.3 2.3 2.6 2.8 4.5 3.4 4.1 3.4 3.0 3.2
500 to 749 8.6 9.7 7.2 9.0 8.3 8.2 10.0 8.7 7.1 7.1 6.5 5.8 6.0 4.9 4.9 5.2 4.6 5.0 5.2 6.8 6.9 6.9 5.9 7.1 5.6 5.8 4.3 3.8 4.2 4.0 3.5 4.0 3.8 4.6 3.9 5.4 3.9 3.8 4.1
750 to 999 10.1 10.4 8.4 8.8 8.3 8.3 8.5 8.3 8.6 8.0 8.4 7.2 7.7 6.7 4.9 5.3 5.6 5.9 6.3 8.5 7.9 10.1 9.3 9.4 6.9 7.3 5.5 5.8 4.4 3.5 4.5 5.5 4.4 4.6 4.3 5.6 5.0 4.2 4.4
1000 above 13.1 10.7 10.6 12.5 12.4 10.5 10.6 9.5 9.2 9.2 8.3 9.2 9.4 8.6 8.2 7.0 6.0 7.1 7.6 10.6 13.4 15.4 12.6 11.9 9.4 10.5 6.6 7.2 6.9 5.6 5.8 5.7 5.2 5.3 5.2 8.8* 8 .7 6.8 5.9
Douglas499 below 5.7 9.5 8.7 9.8 8.3 4.2 8.7 1.9 1.4 2.2 1.8 9.1 9.1 9.4 8.6 8.6 0.0 21.4 7.1 14.3 7.1 0.0 0.0 6.1 6.1 3.0 1.1 35.8
500 to 749 12.3 7.2 8.0 5.6 4.2 8.9 7.2 6.3 4.2 2.8 3.4 4.1 4.5 5.9 4.8 5.4 3.9 5.4 5.1 6.1 5.7 6.7 4.9 7.9 3.3 4.3 2.3 5.2 2.7 4.3 5.1 6.7 2.3 2.4 0.3 4.3 3.1 3.1 2.8
750 to 999 13.8 10.3 6.7 8.8 6.9 5.6 6.7 6.2 6.2 5.3 5.7 5.9 5.1 4.8 4.7 5.5 5.3 8.2 5.9 6.8 6.7 5.9 3.7 4.9 4.8 4.5 4.3 4.6 4.2 4.3 3.9 4.4 4.9 4.1 4.0 3.9 4.8 2.9 3.7
1 00 0 ab ov e 1 5. 9 9 .8 11 .9 1 1. 8 1 0. 6 6 .9 8 .2 1 0. 2 10 .7 6 .7 7. 4 8 .8 7 .9 7 .2 6 .8 9 .3 7. 8 8. 9 5 .7 8 .3 7 .6 5 .3 5. 0 5. 9 4 .0 3 .1 4 .6 5. 9 7 .1 3 .1 3 .6 4. 7 5 .0 3 .7 4. 7 4 .9 4 .9 2 .9 3. 4
Jefferson499 below 7.7 9.5 5.2 5.5 11.3 6.9 6.2 6.2 11.0 9.1 9.3 9.0 6.6 11.9 6.7 7.6 7.0 8.1 6.7 6.3 7.3 9.0 9.9 8.2 4.8 5.0 4.9 4.8 4.7 4.1 2.6 2.0 4.2 1.7 0.2 3.2 3.3 3.4 2.7
500 to 749 9.4 8.5 8.3 9.9 7.7 7.2 6.1 6.1 6.4 6.5 6.5 5.7 5.1 7.9 4.6 5.4 5.5 5.4 5.5 6.8 7.3 7.4 6.0 7.5 5.5 5.2 3.8 4.3 4.7 3.7 4.0 3.1 3.5 3.4 4.0 3.5 3.1 3.0 2.7
750 to 999 9.0 9.4 9.9 9.1 9.3 9.8 7.6 8.2 7.7 7.8 7.6 6.3 6.2 6.3 5.1 5.9 5.1 6.2 6.4 7.9 8.0 7.2 6.1 7.1 6.4 5.9 3.9 4.2 4.9 4.6 4.3 5.0 3.7 3.9 3.5 4.2 4.3 4.1 4.1
1000 abov e 9.0 9.1 6.9 8.9 8.6 6.8 6.4 9.0 7.8 7.1 7.2 7.9 7.7 7.6 6.4 6.4 6.4 6.1 7.9 7.2 7.4 6.1 6.1 6.7 5.2 5.0 4.0 5.1 4.4 5.6 5.5 5.1 4.3 5.2 4.2 5.1 3.4 4.0 4.0
499 below 9.2 10.7 8.8 8.9 8.3 7.6 8.1 8.5 7.4 6.5 7.2 7.5 7.1 5.6 5.4 5.5 5.2 5.7 6.1 8.5 7.5 10.1 8.3 6.9 9.0 9.9 7.5 6.8 6.4 5.7 6.0 4.0 3.8 4.3 3.0 3.8 6.4 3.3 3.3
500 to 749 9.6 9.5 7.5 9.6 8.4 7.5 7.9 7.2 6.4 6.3 6.2 6.0 6.7 5.5 4.6 5.4 5.8 5.5 5.9 6.9 7.7 8.9 6.6 7.4 6.1 5.8 4.8 4.7 4.8 4.2 4.5 5.0 4.3 4.9 4.1 4.2 3.3 4.2 4.0
750 to 999 10.1 9.3 8.1 9.4 8.6 8.0 7.3 7.6 7.2 7.3 6.8 6.9 7.1 6.4 5.2 6.1 5.7 6.3 6.6 8.0 8.2 8.6 7.5 7.7 6.4 5.9 5.1 5.5 5.3 4.8 5.0 5.7 5.3 4.8 4.4 4.9 4.7 4.0 4.6
1000 abov e 12.1 10.6 9.7 11.4 11.3 8.8 7.8 8.9 8.7 7.4 7.1 8.0 7.6 6.8 6.2 6.9 6.5 6.9 7.0 8.8 9.6 9.4 7.8 8.1 6.6 6.0 5.6 6.2 6.4 5.4 5.1 5.8 5.1 4.8 4.5 5.9 5.6 4.5 4.8
* vacancy rate affected by new units leasing up
Metro
Average
Square Feet
in UnitCounty
Boulder/
Broomfield
Vacancy Rates by Size of Apartment Unit by County
2007 2008 20122009 2010 20112006
(In Percent)
201320052004

8/13/2019 4Q Vacancy Survey
http://slidepdf.com/reader/full/4q-vacancy-survey 11/27
II-14
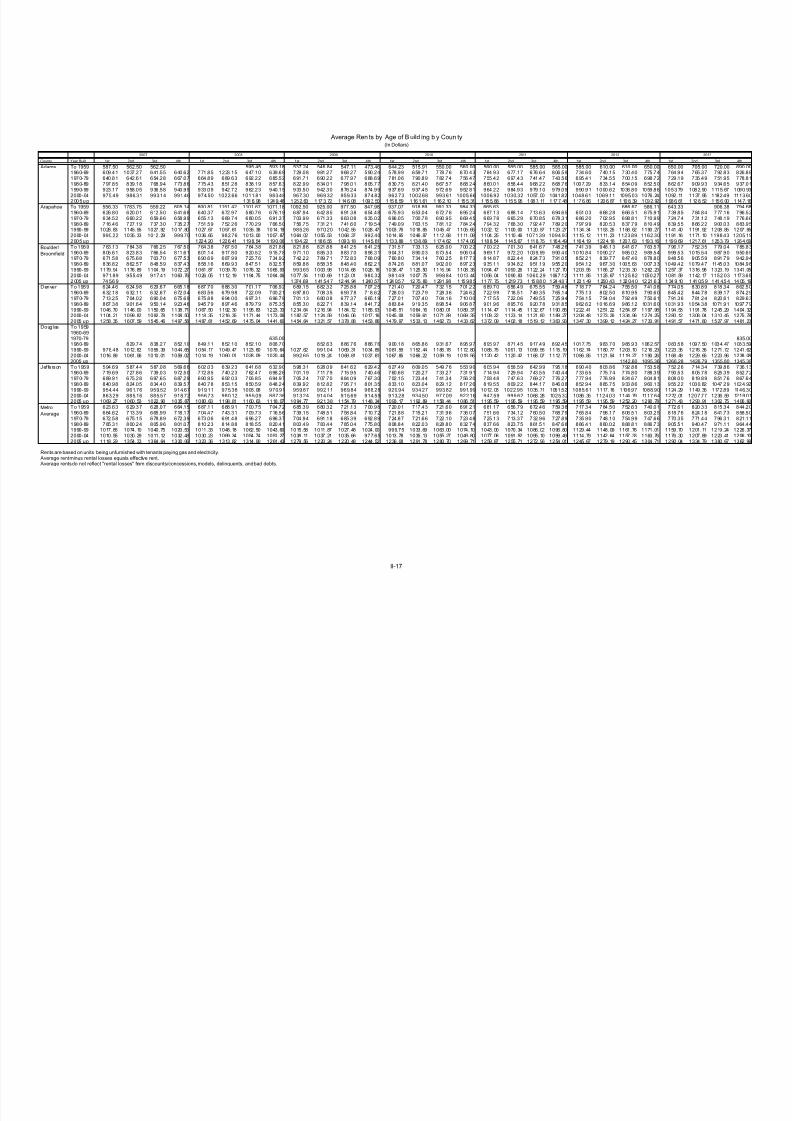
County Year 1st 2nd 3rd 4th 1st 2nd 3rd 4th 1st 2nd 3rd 4th 1st 2nd 3rd 4th 1st 2nd 3rd 4th 1st 2nd 3rd 4th 1st 2nd 3rd 4th 1st 2nd 3rd 4th 1st 2nd 3rd 4th 1st 2nd 3rd
To 1939 14.0 0.0 8.3 8.3 0.0 0.01940-49 0.0 50.0 0.0 0.0 0.0 0.0 0.0 0.0 0.0 0.01950-59 0.0 0.0 0.0 0.0 16.7 16.7 0.0 0.0 21.2 0.0 0.0 0.0 20.0 0.0 7.7 7.7 7.7 3.8 4.5 0.0 10.0 10.0 20.0 0.0 0.0 0.0 0.0 10.0 0.0 10.0 0.0 30.0 40.0 1960-69 3.1 16.5 7.1 10. 4 9. 2 7. 6 5.6 7.7 5.2 6.8 8.2 7.6 9.1 9.3 8.9 8.7 5.8 8.8 6.5 6. 0 11. 4 12. 0 14.2 8.7 1 0.3 8.0 7.3 1 0.7 7.6 6.8 8.2 6.4 6.2 6.2 5.0 2.7 5. 1 4. 9 5. 3 1970-79 12.3 12.4 7.8 11. 3 8. 5 8. 3 10.1 8.8 6.7 5.8 7.2 9.4 9.6 8.0 7.7 12.2 7.5 7.9 9.2 10. 6 8. 9 10. 9 9.7 8.7 1 0.0 6.4 5.1 7.9 8.9 5.8 6.2 5.3 5.0 4.8 4.3 4.1 3. 1 3. 8 4. 5 1980-89 6.7 8.2 7.5 10.8 9.7 8.8 8.0 8.3 8.3 6.4 6.6 7.1 8.1 4.9 5.7 6.9 5.7 5.9 7.2 9.1 7.7 7.7 6.3 5.9 6.2 5.0 4.1 4.4 4.0 4.6 4.8 4.7 4.4 3.9 3.6 4.0 3.9 4.1 2.9 1990-99 8.5 6.4 6.9 12. 3 10. 2 10. 7 6.4 8.0 7.1 5.1 4.5 6.7 6.8 4.8 3.9 4.5 6.4 7.6 6.0 8. 7 6. 4 5. 1 5.8 5.6 5.1 4.5 4.2 5.2 5.3 5.5 5.5 5.8 3.6 5.0 3.9 5.3 3. 5 4. 0 10. 4 2000-04 13.8 9.9 8.4 13. 7 13. 1 8. 2 6.9 7.9 6.5 6.7 5.6 6.1 6.4 6.8 5.3 6.2 6.5 6.3 6.5 7. 3 7. 5 7. 5 4.9 4.8 4.5 4.1 4.1 4.7 4.6 5.1 4.7 5.2 4.1 5.5 4.7 4.7 4. 5 3. 4 3. 8 2005 up 0.0 3.3 4.2 30.0 22.1 45.8 21.4 3.4 6.5 8.2 8.3 4.3 6.7 5.3 4.8 5.5 6.1 7.5 7.0 6.5 9.1 31.8* 3.6 55.5
To 1939 0.0 5.1 9.1 9.1 0.0 0.0 9.1 9.1 9.1 4.5 4.5 0.0 9.1 0.0 9.1 1.5 0.0 1940-491950-59 4.5 7 .4 3 .9 5 .1 2 .2 3 .9 3 .9 3.1 0.0 3.0 15.4 0.0 11.1 0 .0 11.1 0 .0 0 .0 0 .0 0 .0 0 .0 0 .0 5 .0 0 .0 0.0 0.0 0.0 0.0 0.0 0.0 16.7 0 .0 16.7 2.1 1960-69 7.4 8.5 7.8 10. 2 10. 5 9. 7 9.8 9.2 7.7 9.5 16.7 8.8 7.5 7.9 6.6 6.4 8.9 7.3 7.0 9. 0 9. 1 9. 4 9.5 7.1 7.0 5.0 4.8 4.5 5.3 4.6 3.8 5.1 1.8 3.3 2.0 3.2 4. 0 3. 8 5. 1 1970-79 13.0 1 4.1 1 3.6 1 4. 4 10. 4 9. 6 9.9 9.7 9.1 9.1 9.5 9.0 1 0.0 6.9 5.9 6.4 6.6 4.8 7.4 9. 2 10. 5 13. 7 9.9 1 1.1 9.1 9.6 7.7 7.1 7.5 5.6 7.2 8.7 7.6 7.5 6.1 4.1 4. 6 6. 6 6. 5 1980-89 8.8 7.2 7.3 8.3 8.0 6.6 5.7 6.3 5.9 6.4 5.4 6.8 7.7 5.6 4.9 5.8 5.2 5.7 6.9 6.6 7.4 7.8 6.4 7.0 6.1 4.8 4.7 5.3 4.5 4.6 5.1 6.8 6.3 6.1 5.2 5.7 3.3 3.8 4.3 1990-99 6.8 6.0 5.8 6.9 5.6 5.7 5.3 6.1 5.4 5.1 4.2 5.3 4.8 4.2 4.0 5.4 5.4 5.0 4.7 5.6 6.6 5.7 6.3 6.8 3.7 3.9 3.3 4.5 4.7 4.7 4.5 5.9 6.1 5.0 4.4 5.3 4.7 4.1 4.9 2000-04 20.0 15.1 10.8 11. 6 9. 8 7. 4 5.6 6.7 7.6 6.5 4.7 7.5 7.3 7.4 4.7 6.2 5.9 6.2 7.2 6. 9 11. 1 11. 1 5.7 6.0 5.0 4.8 4.5 4.2 5.2 3.9 3.3 4.5 4.4 3.3 3.3 4.2 4. 6 3. 6 3. 4 2005 up 98.2 22.9 19.7 23.4 31.9 28.1 27.5 21.0 18.6 10.2 23.2 18.9 17.1 13.3 9.6 10.0 7.6 5.7 5.2 5.7 4.9 5.4 4.5 To 1939 13.3 0.0 0.0 0.0 0.0 0.0 0.0 0.0 0.0 14.3 0.0 0.01940-49 0.0 0.0 0.0 0.0 0.0 0.0 0.0 0.0 0.0 0.0 0.0 0.0 0.0 0.0 0.0 0.0 0.0 0.0 0.0 0.0 0.0 0.0 0.0 0.0 0.0 0.0 0.0 0.0 0.0 0.0 0.0 0.0 0.0 0.0 12.5 0.0 0.0 0.0 0.0 1 95 0-59 0 .01960-69 6.1 9.7 0.9 5.0 7.3 7.2 10.8 3.9 4.0 5.2 5.0 2.9 2.8 1.6 2.5 3.1 4.7 2.0 1.2 1.9 2.2 3.1 7.8 2.9 2.9 4.0 1.4 2.2 2.9 3.1 1.9 2.6 1.2 1.7 2.0 2.2 0.5 0.9 0.0 1970-79 11.8 9.2 6.9 8. 6 9. 0 8. 1 5.0 5.5 2.9 5.6 3.7 4.6 3.1 4.5 2.3 3.3 3.2 3.8 4.4 4. 4 5. 0 10. 3 4.9 5.5 5.0 4.3 3.4 2.8 2.9 4.6 4.1 3.4 1.3 2.7 2.2 2.3 2. 1 2. 1 2. 3 1980-89 7.7 9.5 3.5 15. 0 13. 2 9. 6 6.5 7.7 5.1 7.2 5.1 5.4 6.8 5.5 4.3 8.3 10.1 13.9 6.3 7. 0 5. 6 4. 3 2.7 5.7 5.1 3.7 4.6 4.8 6.8 5.5 7.1 7.0 11.2 3.6 4.1 4.4 3. 0 6. 1 4. 0 1990-99 9.8 6.2 7.5 8.0 8.2 4.4 5.9 3.8 4.2 4.3 6.7 6.5 6.3 4.8 7.5 7.2 7.6 6.8 7.2 6.0 6.0 4.0 4.1 3.7 3.5 5.1 4.7 3.0 4.2 2.8 3.2 4.0 3.9 2.9 2000-04 12.2 15.7 6.2 7. 3 18. 5 7. 1 12.8 9.2 11.0 7.2 5.3 7.4 8.2 3.4 3.7 4.3 4.8 5.8 5.2 6. 5 6. 8 7. 6 4.7 5.0 4.8 4.7 3.4 2.3 2.5 3.4 3.5 3.8 4.1 3.6 2.4 4.2 3. 3 3. 2 2. 3 2005 up 9.5 2.6 5.2 7.8 0.6 0.6 0.6 3.4 1.1 5.3 22.1 12.1 5.4 5.2 4.8 4.4 4.5 6.7 4.0 4.2 3.8 To 1939 7.1 9.7 6.1 6.2 7.2 5.8 5.0 6.1 4.4 3.9 3.6 3.7 3.6 2.7 4.2 3.4 4.4 3.8 4.9 5.8 9.3 6.9 5.8 4.2 5.6 5.5 2.4 2.6 2.1 2.6 1.8 2.4 1.5 3.2 2.6 2.2 2.2 2.2 2.0 1940-49 7.5 15.4 8.0 5. 5 7. 9 8. 2 6.0 7.0 3.8 5.2 6.1 4.3 5.4 6.8 7.3 7.5 4.0 6.1 4.4 7. 0 5. 0 6. 5 4.9 5.0 5.4 6.1 4.6 3.1 2.7 2.8 2.8 3.0 2.5 3.6 1.5 3.0 3. 1 18. 9 12. 0
1950-59 12.1 10.3 13. 4 13. 3 9. 8 9. 5 14.2 11.7 12.7 8.9 6.9 6.0 10.3 9.0 8.6 6.7 5.2 8.2 7.2 9. 3 8. 8 9. 7 6.7 8.9 6.8 7.6 7.7 4.3 5.1 4.6 3.8 1.3 3.0 5.0 2.2 2. 8 2. 2 2. 6 3. 3 1960-69 10.8 12.1 10. 6 10. 0 9. 2 10. 5 15.3 11.4 6.9 8.5 7.3 6.3 5.1 5.3 5.8 4.2 4.5 4.0 4.6 6. 4 6. 0 8. 8 7.5 9.9 8.0 7.4 7.6 5.1 5.9 6.3 4.1 3.8 2.8 4.6 3.7 4. 2 5. 0 4. 2 4. 8 1970-79 11.8 11.6 8. 5 10. 6 10. 9 11. 5 12.0 10.7 9.6 9.2 8.2 5.5 5.8 4.9 5.6 6.5 5.3 5.7 6.4 7. 6 7. 4 10. 8 9.4 9.9 6.7 6.8 4.5 5.0 4.3 3.9 4.2 5.0 5.0 6.1 4.4 6. 7 5. 1 3. 7 3. 0 1980-89 6.9 8.0 6.5 7.7 5.6 5.6 8.2 6.9 6.0 6.1 6.4 8.1 7.1 6.8 4.6 5.3 5.7 6.5 5.2 6.9 6.7 6.8 5.6 5.9 6.2 6.1 4.3 4.1 4.5 3.9 4.0 5.2 3.8 4.4 5.0 5.1 4.7 4.7 5.6
1990-99 8.6 7.9 7.1 7. 6 7. 5 5. 9 5.9 8.0 8.3 7.4 4.6 8.7 11.3 9.1 8.0 5.2 4.9 5.8 6.5 10. 3 10. 9 8. 5 7.1 7.0 5.3 5.7 4.8 4.3 4.4 3.6 3.7 3.6 5.4 5.0 4.7 5.7 5. 5 3. 7 3. 9 2000-04 13.9 8.0 11.1 13. 0 11. 4 9. 3 6.2 5.7 5.9 7.0 6.2 6.8 6.9 5.0 4.7 5.1 4.9 5.3 6.2 8. 1 7. 5 6. 4 7.0 6.9 4.8 7.6 4.4 4.8 4.5 3.7 4.0 5.1 4.8 4.1 4.4 5.8 5. 2 4. 7 4. 0 2005 up 0.0 3.6 33.1 30.9 19.7 28.4 18.5 13.4 7.6 5.1 6.5 9.2 16.3 24.1 29.7 23.1 21.8 19.4 17.6 10.8 11.1 8.6 5.4 7.3 6.7 4.8 4.3 4.6 15.7* 11.5 7.5 7.7 To 19391940-49
1950-59 1960-69 1970-79 11.3 11.3 3.1 7.8 1980-89 3.5 1.9 2.7 0.7 8.1 2.6 0.0 6.0 8.0 4.8 4.0 5.5 5.5 4.5 4.1 4.5 4.5 7.6 15.1 8.9 6.7 6.1 4.2 4.4 4.3 4.3 3.7 2.2 4.4 3.2 3.4 0.2 0.2 0.5 1.7 2.2
1990-99 10.3 7.9 9.4 10. 4 9. 2 8. 3 8.2 8.8 8.3 4.9 6.1 6.4 6.9 6.9 6.4 8.0 7.1 9.5 7.6 7. 8 7. 3 4. 6 3.1 5.4 3.7 3.4 4.5 5.1 4.3 3.8 4.1 3.6 5.5 3.4 4.1 5.1 4. 1 4. 0 4. 7 2000-04 17.5 12.3 9.1 9. 5 8. 4 4. 9 7.2 7.7 8.1 6.4 6.6 7.5 6.1 5.2 5.1 6.6 5.7 7.9 5.1 7. 2 7. 0 5. 5 4.6 5.3 4.5 4.1 4.2 5.4 6.1 3.8 3.9 5.4 4.6 4.3 4.0 3.7 5. 4 2. 5 2. 9
2005 up 9.5 8.4 28.2 0.0 3.6To 1939 6.8 6.5 15.9 8. 9 2. 4 4. 8 0.0 7.1 1 4.3 4.8 0.0 0.0 0.0 0.0 0.0 37.5 0.0 0.0 0.0 0. 0 0. 0 4. 5 12.5 1 2.5 0.0 0.0 0.0 0.0 0.0 0.0 4.5 0.0 0.0 0.0 0.0 12.5 0. 0 12. 5 0. 0 1940-49
1 95 0-5 9 11 .1 12 .8 6. 7 7. 3 9. 8 10. 4 1 0. 5 1 2. 4 2 6. 7 2 7. 7 2 6. 4 5. 8 7 .1 17 .4 5 .8 7 .3 2 .9 8 .7 9 .3 10. 8 11. 0 11. 5 1 2. 6 1 0. 2 6. 1 7. 0 9. 1 7. 5 9. 0 6 .8 4 .7 2 .4 3 .5 2 .4 4 .9 3. 4 1. 5 1. 1 4. 4 1960-69 4.9 7.7 6. 7 10. 1 8 .6 7. 1 8 .8 5.9 7.7 7.8 8.3 5.4 6.0 5.4 4.2 4.9 5.1 6.3 5.3 7. 1 5 .6 4. 7 4 .5 10.8 4.1 6.2 4.6 4.4 4.7 3.2 2.7 2.6 3.3 3.6 2.4 2. 8 3 .0 3. 7 2 .6 1970-79 12.5 11.7 11. 1 11. 9 10. 9 11. 0 9.7 9.0 9.2 8.9 8.2 6.9 6.4 8.3 5.6 5.8 5.4 6.8 6.7 7. 4 9. 0 9. 2 8.9 9.0 7.9 7.7 4.0 4.7 4.3 5.1 4.9 4.1 3.8 4.2 2.8 3. 8 3. 7 3. 4 2. 9 1980-89 6.1 7.5 5.3 7.2 6.6 6.8 5.1 6.0 5.5 5.8 5.9 5.5 5.8 7.8 4.6 5.8 5.1 5.0 5.1 6.5 5.8 6.4 4.8 5.3 4.4 4.4 3.5 3.8 4.2 4.6 3.7 4.4 3.5 3.4 4.3 5.1 3.6 3.1 3.0
1990-99 3.3 4.0 8.2 7.1 8.5 6.5 4.9 5.9 4.9 4.8 5.8 7.5 5.5 5.7 6.3 6.3 6.3 4.5 5.0 7.9 6.5 5.9 5.1 6.3 4.5 4.2 4.3 4.6 5.2 5.1 4.5 4.8 4.4 4.7 4.3 4.7 3.6 4.0 4.9 2000-04 7.6 6.9 5.7 6.5 5.8 3.3 3.1 8.2 8.4 6.9 7.5 7.2 7.0 7.3 4.7 7.6 7.2 6.5 4.9 4.9 8.0 4.7 5.7 7.1 7.3 4.3 3.5 4.3 5.0 2.5 4.4 4.5 3.6 4.1 5.5 5.7 6.2 5.5 4.3
2005 up 28.8 22.7 17.4 10.6 8.5 18.2 9.6 6.0 6.5 5.2 11.5 24.2 11.6 10.6 7.4 7.1 5.9 5.3 3.9 3.5 6.1 7.2 4.2 10.2 11.0 3.4 1.1 5.7 3.5 4.1 4.3 3.2 To 1939 7.1 9.6 6.5 6.3 7.1 5.7 5.8 6.6 4.7 3.9 3.4 3.7 3.6 2.6 4.2 3.7 4.4 3.7 4.7 5.9 9.2 6.8 5.8 4.3 5.5 5.5 2.4 2.6 2.1 2.5 1.8 2.3 1.5 3.2 2.5 2.3 2.3 2.2 2.0 1940-49 7.2 15.4 7.3 5. 4 7. 7 8. 0 5.8 6.7 3.8 5.1 6.0 4.2 5.3 6.7 7.2 7.4 4.0 6.0 4.3 6. 9 5. 0 6. 4 4.9 4.9 5.1 5.9 4.5 3.0 2.6 2.6 2.7 2.9 2.4 3.6 1.8 2.8 2. 9 17. 6 11. 4 1 95 0-5 9 10 .3 1 0. 2 10 .8 1 1. 0 8. 7 8. 7 11. 7 11. 4 14. 5 11. 4 13. 0 5. 9 10. 0 9 .5 8 .3 6 .7 5 .0 8 .3 7 .6 9. 4 9. 1 10. 0 7. 7 8. 9 6. 6 7. 3 7. 9 5. 2 6. 3 4 .8 3 .9 1 .3 3 .0 4 .9 2 .5 2 .9 2. 2 2. 6 3. 9
1960-69 7.3 10.9 7. 2 9 .6 9. 2 8 .9 10.5 8.3 6.6 8.1 10.1 6.4 6.2 5.6 5.6 5.1 6.0 5.6 5.1 6. 6 6 .8 7. 7 8 .2 8.4 7.0 6.3 5.8 4.9 5.2 4.9 3.9 4.0 2.9 4.0 3.0 3. 3 4 .0 3. 9 4 .0 1970-79 12.4 12.2 10. 2 11. 9 10. 4 10. 3 10.3 9.6 8.6 8.5 8.1 7.3 7.5 6.6 5.8 6.8 5.8 5.9 6.9 8. 1 8. 5 11. 2 8.9 9.4 7.9 7.6 5.3 5.8 5.7 5.0 5.6 5.9 5.3 5.6 4.5 4. 7 4. 1 4. 4 4. 2 1980-89 7.7 7.5 6.8 8.5 7.7 6.9 6.6 6.7 6.2 6.3 5.8 6.8 7.3 6.1 4.9 5.9 5.5 6.1 6.3 7.1 7.0 7.4 5.9 6.3 5.9 5.0 4.4 4.7 4.5 4.4 4.7 5.8 5.4 4.9 4.7 5.1 3.6 4.0 4.3
1990-99 8.3 6.9 7.1 8.9 7.9 7.4 5.9 7.0 6.6 5.6 4.9 6.5 6.1 5.6 5.4 6.0 6.0 6.2 5.6 7.6 7.3 6.2 5.9 6.5 4.7 4.6 4.0 4.6 4.6 4.5 4.6 5.1 4.9 4.6 4.1 4.9 4.2 4.0 5.1 2000-04 16.0 12.0 9.5 11. 3 10. 6 7. 1 6.8 7.3 7.6 6.6 5.8 7.0 6.8 6.1 4.8 6.0 5.8 6.4 6.2 7. 2 8. 2 7. 5 5.4 5.8 4.9 5.1 4.2 4.5 5.0 3.9 3.9 4.9 4.4 4.1 4.0 4.5 4. 8 3. 7 3. 5 2005 up 24.8 14.1 17.7 22.7 13.9 21.1 14.4 10.8 7.2 22.8 12.7 17.2 19.0 25.9 26.0 20.0 17.2 13.5 11.0 13.1 12.7 12.5 8.9 8.0 7.8 6.0 5.0 5.2 7.9 10.1 5.6 6.4
* vacancy rate affected by new units leasing up
Vacancy Rates by Age of Buildi ng by County
201120072005 2006 20122010 2013
(In Percent)
Metro Average
Jefferson
Douglas
Denver
Boulder/
Broomfield
Arapahoe
Adams
2004 20092008

8/13/2019 4Q Vacancy Survey
http://slidepdf.com/reader/full/4q-vacancy-survey 12/27
II-15
1 st 2 nd 3 rd 4th 1 st 2 nd 3 rd 4th 1 st 2 nd 3 rd 4th 1st 2 nd 3 rd 4 th 1st 2 nd 3rd 4 th 1s t 2nd 3rd 4 th 1 st 2n d 3 rd 4th 1s t 2 nd 3rd 4th 1s t 2 nd 3 rd 4 th 1 st 2n d 3 rd
Efficie ncy 4 .6 13 .9 3 .5 1 9.2 18 .8 1 3.2 9 .5 6.6 4 .3 6.5 7 .4 7.3 5 .9 4.2 4 .2 3.3 4.9 2.2 4.1 24.9 6.3 6 .3 2 5.8 1 .4 2 3.8 2 3.3 0 .8 7 .7 7.7 6.9 5.8 4.8 1.3 3.8 1 .2 3 .7 1 .4 7 .7 5 .3
1 Bed 8.5 9.2 6.4 10.1 9.4 7.5 7.1 6.6 5.9 4.9 5.7 5.8 6.8 5.6 5.0 5.9 5.3 5.6 7.4 8.6 8.5 8.1 5.5 5.2 6.2 4.7 4.2 5.6 5.2 5.0 4.7 4.4 3.7 3.9 3.9 3.9 5.7 3.3 3.9
2 Bed, 1 Bath 9.9 11.7 8.0 11.8 8.7 9.2 8.9 9.2 7.1 5.9 6.3 9.4 9.2 7.7 6.3 9.1 7.2 7.3 6.7 8.6 8.2 9.7 7.5 8.0 7.6 5.6 5.0 6.5 5.8 6.3 6.6 6.1 5.5 5.4 4.4 4.7 3.9 3.5 4.8
2 Bed , 2 Ba th 11 .4 9 .9 8 .2 1 4.0 13 .2 1 0.5 8 .2 9.8 7 .9 7.5 6 .9 7.9 8 .0 7.1 7 .4 8.1 7.4 7.9 8.2 8.4 8.4 8 .4 6.4 6 .6 6 .4 5 .3 4 .7 5 .7 6.2 5.2 5.9 6.4 5.3 6.0 4 .3 5 .1 5 .0 4 .8 9 .4
3 Bed 10 .9 7 .7 12 .0 1 0.3 11 .3 8.2 7 .4 9.2 10 .0 8.8 8 .7 8.9 8 .9 6.2 5 .5 9.7 9.5 9.4 7.4 8.1 7.0 6 .6 5.4 7 .1 6 .3 4 .6 3 .8 4 .6 4.3 3.2 3.0 4.1 4.0 4.6 4 .4 6 .1 5 .5 3 .9 6 .5 All 9.6 9.9 7.6 11.7 10.6 8.7 7.7 8.1 7.0 6.1 6.4 7.4 7.8 6.3 5.9 7.4 6.4 6.8 7.5 8.8 8.4 8.5 6.7 6.3 6.8 5.2 4.4 5.7 5.6 5.2 5.3 5.3 4.5 4.9 4.2 4.5 5.2 3.8 5.7
Efficie ncy 10 .1 13 .7 1 0.7 1 1.3 7 .0 5.4 8 .0 8.5 7 .5 8.4 5 .9 9.5 7 .1 4.3 5.0 4.1 5.2 6.4 1 0.2 4 .5 3.4 16 .9 3.1 4 .5 1 1.4 1 0.2 9 .6 4.7 5.8 5.1 5.5 4.2 3.7 8.5 3 .8 4 .2 2 .8 4 .7 3 .7
1 Bed 10.5 8.8 7.8 9.2 7.4 6.7 5.7 6.4 5.9 6.1 5.6 6.4 7.1 5.4 4.4 5.7 6.7 5.7 6.3 7.7 10.2 11.3 8.7 8.8 6.8 6.3 6.3 6.0 5.8 4.7 5.0 6.4 5.1 5.3 4.5 4.1 3.6 4.5 4.8
2 Bed , 1 Bath 9 .3 8 .9 9 .1 1 0.6 9 .9 8.1 9 .0 9.4 8 .6 8.5 9.6 10.2 1 0.7 8 .4 6.4 6 .6 6.7 6 .2 7.7 9 .2 8.8 10 .8 8.8 9 .4 8 .0 7 .5 7 .8 8.1 7.7 5.6 7.7 8.7 9.9 6.7 6 .4 6 .0 3 .7 5 .1 5 .0
2 Bed , 2 Bath 12 .0 10 .8 1 0.6 1 0.8 10 .2 7.8 6 .9 7.5 7 .4 7.2 6 .5 7.1 7 .4 6.0 5 .1 6.0 6.1 5.7 7.0 8.1 9.3 8.9 8.1 8 .2 7 .1 5 .6 6 .4 6 .8 6.7 6.3 5.8 6.7 6.7 5.5 4.9 5 .9 4 .8 4 .4 4 .7
3 Bed 11 .6 13 .5 1 2.1 1 1.1 11 .1 9.7 9 .6 9.8 10 .0 7.3 10 .8 9.2 9 .1 7.8 6.9 7.2 7.5 8.8 7.0 14 .6 1 3.1 13 .2 1 0.2 8 .4 8 .9 8 .2 9 .7 7.6 6.8 7.0 5.0 8.7 5.6 4.5 3 .5 5 .8 6 .6 4 .5 4 .6
All 10.8 9.8 9.2 10.1 8.9 7.4 6.8 7.4 7.0 6.8 6.7 7.4 7.8 6.1 5.0 6.0 6.5 5.9 6.9 8.3 9.7 10.7 8.5 8.6 7.2 6.4 6.7 6.6 6.4 5.5 5.6 6.8 6.3 5.5 4.8 5.0 4.1 4.5 4.8
Efficie ncy 14 .1 12 .6 5 .5 7.6 7 .2 7.9 3 .8 4.2 5 .1 8.0 6 .9 8.1 8 .8 8.6 4 .0 8.5 9 .1 12.4 5.2 5.9 8.3 8 .3 4.9 3 .9 4 .1 5 .1 1 .5 1 .2 2.6 3.5 3.3 4.0 1.3 5.6 1 .4 1 .4 1 .1 1 .7 0 .6
1 Bed 9.8 7.3 4.9 7.6 10.3 5.6 6.9 4.6 4.9 4.5 3.9 4.8 3.8 2.5 2.5 4.0 4.3 4.6 3.2 4.9 4.8 6.0 5.1 5.2 5.0 4.4 2.8 2.7 4.7 3.6 3.7 3.6 3.8 3.3 2.4 3.4 2.8 3.8 2.5
2 Bed, 1 Ba th 9 .0 9 .3 6 .2 1 1.2 10 .4 9.5 9 .1 9.9 6 .4 9.5 5 .7 6.7 5 .7 5.8 3 .4 5.7 5.5 6.1 4.7 5.3 5.6 7 .8 6.2 6 .2 5 .3 4 .6 3 .9 4 .6 4.8 5.3 5.4 5.0 3.0 3.5 2 .9 3 .2 3 .6 3 .2 3 .3
2 Bed, 2 Ba th 10 .8 8 .7 6 .0 9.7 14 .0 1 0.8 9 .2 9.4 9 .6 9.2 5 .1 5.7 5 .0 4.4 5.2 6.4 7.1 8.2 6.8 8 .4 7.5 8 .7 5.8 6 .8 5 .3 5 .7 4 .6 4 .1 5.8 5.4 5.2 5.3 4.4 3.8 4 .0 4 .6 3 .9 4 .4 3 .2
3 Bed 18 .1 19 .2 10 .1 8.9 12 .4 1 3.7 6 .9 8.8 10 .4 7.2 5.3 4.7 5.0 3.9 3.8 7.3 6.8 9 .5 4.5 5 .3 6.7 5 .1 6.1 5 .2 3 .9 5 .1 3 .3 5.0 2.0 5.2 5.4 4.4 1.6 4.7 3 .3 4 .9 3 .2 2 .5 2 .4
All 11.0 9.5 6.0 9.0 11.1 8.7 7.8 7.3 6.9 7.0 4.8 5.5 4.7 4.0 3.6 5.4 5.7 6.4 4.7 6.1 6.0 7.2 5.5 5.8 5.0 4.9 3.5 3.6 4.9 4.6 4.7 4.4 3.9 3.6 2.9 3.7 3.2 3.8 2.8
Efficie ncy 10 .1 10 .9 9 .8 1 0.3 9 .7 1 0.4 11 .4 9.0 7 .1 8.2 7.3 5.6 7.1 4.7 5.1 4.7 4.4 4 .8 5.1 5 .8 5.9 8 .4 6.9 6 .9 5 .7 6 .8 4 .8 3.7 2.8 3.2 2.5 3.3 3.1 4.1 2 .9 3 .4 3 .9 5 .5 5 .7
1 Bed 8.8 9.3 7.4 8.6 7.8 7.5 8.7 7.9 6.9 6.5 6.6 6.3 6.6 5.4 5.2 4.9 4.5 5.0 5.4 7.4 7.2 7.8 7.2 7.7 6.3 6.4 4.7 4.5 4.4 3.9 3.9 4.2 3.9 4.4 4.1 6.1 4.4 4.0 4.2
2 Bed , 1 Bath 11 .2 11 .5 7 .9 9.3 9 .8 9.7 10 .7 9.8 9 .7 9.3 9 .1 6.6 6 .3 5.5 5 .5 6.7 6.1 5.8 6.4 8.9 8.7 9 .7 7.5 8 .8 5 .9 7 .2 5 .7 6 .4 6.0 4.5 5.0 6.8 5.1 5.9 4 .6 6 .7 6 .6 4 .7 4 .5
2 B ed , 2 Ba th 1 1. 7 1 0. 0 9 .4 1 1. 4 1 0. 7 9 .2 9 .6 8 .9 8 .0 7 .9 6 .9 8 .4 8 .7 8 .7 6 .9 6 .4 5 .9 6 .5 6 .7 8 .9 1 2. 0 1 4. 0 1 1. 7 1 1. 2 8 .8 9 .8 6 .4 6 .5 5 .8 4 .8 5 .4 5 .4 4 .9 5 .1 5 .4 7 .3 7 .3 5 .6 5 .2
3 B ed 1 2. 5 13 .5 1 4. 3 1 5. 4 1 4. 2 1 5. 9 1 5. 0 1 6. 0 1 8. 5 1 4. 7 1 6. 1 1 3. 1 1 2. 8 6 .1 7 .0 7 .4 7 .4 10 .1 11 .7 14 .0 13 .9 20 .1 15 .5 14 .1 1 1.5 8 .9 4 .6 6 .4 6 .8 4 .4 3 .6 5 .6 4 .7 4 .7 2 .8 3 .5 4 .5 4 .2 5 .0
All 10.2 10.1 8.3 9.8 9.2 8.7 9.6 8.7 7.8 7.6 7.3 6.9 7.2 6.1 5.7 5.5 5.1 5.7 6.0 8.0 8.6 9.8 8.5 8.8 6.9 7.4 5.3 5.2 4.8 4.1 4.3 4.8 4.2 4.8 4.3 6.1* 5.4 4.6 4.6
Efficien cy 33 .3 41 .7 25 .0 0.0 2 .1 2 .1 0.0 0 .0 4.2 2 .1 8.3 0 .0 6.3 0 .0 2.1 0 .0 8.3 0 .0 0.0 0 .0 4.2 0 .0 6.3 0.0 2 .1 2 .1 6 .3 2 .1 4.2 2.1 8.3 2.1 6.3 0.0 0.0 4 .2 0 .0 6 .3 1
1 Bed 12.7 7.7 7.1 8.5 5.9 5.3 6.2 5.7 4.8 4.9 4.5 4.6 4.4 4.2 4.3 4.9 4.8 8.5 5.9 7.1 6.6 5.8 4.0 4.7 4.5 4.4 4.0 4.2 3.9 4.6 3.7 4.8 4.9 3.7 3.7 4.0 6.3 3.1 3.1
2 Bed, 1 Ba th 12 .1 12 .3 6 .2 9.1 11 .1 7.6 9 .0 9.0 9 .7 6.9 8 .7 9.2 7 .9 6.4 6 .3 7.5 6 .2 5.9 5 .8 5.7 6.8 6.4 2.9 6.0 5 .0 3 .6 5 .1 6 .1 4 .6 3.1 4.7 2.6 4.4 4.4 3.4 2 .9 8 .5 2 .9 4 .8
2 Bed, 2 Ba th 16 .2 9 .8 1 1.8 1 1.8 9 .7 7.2 8 .2 9.9 10 .7 6.0 7 .0 8.2 7 .7 6.9 6 .0 8.6 7 .4 8.6 5 .2 8.7 8.0 5.6 5.0 5.9 4 .1 3 .5 4 .2 5 .9 7 .5 3.0 3.2 4.9 5.3 3.9 4.9 4 .9 6 .1 2 .8 3 .6
3 Bed 18 .1 11 .5 1 3.1 1 4.0 14 .2 6.2 8 .9 1 2.1 12 .2 8.0 9 .8 1 0.9 9 .1 7.9 8 .8 11.6 8.5 9.2 9.0 6 .7 6.6 5 .9 5.6 7 .1 5 .2 2 .7 5 .6 5 .5 5.7 3.9 5.5 6.1 4.2 3.6 4 .3 5 .4 4 .8 2 .5 3 .2
All 14.5 9.8 9.2 10.1 8.4 6.4 7.5 8.1 8.2 5.7 6.4 7.0 6.4 5.8 5.5 7.0 6.1 8.3 5.9 7.4 7.1 5.8 4.3 5.5 4.4 3.9 4.4 5.2 5.3 3.8 3.8 4.7 4.9 3.9 4.1 4.2 6.5 2.9 3.5 Efficie ncy 6 .8 7 .9 8 .2 6.4 9 .1 1 2.1 9 .8 4.8 9 .7 12.9 8.6 12.1 1 2.5 10.6 5.1 7 .1 6.7 8 .4 7.6 7 .6 9.9 9 .3 6.9 11 .3 8 .8 3 .0 4 .2 2.5 7.1 2.6 0.4 2.3 5.9 3 .4 1 .1 3 .5 2 .7 3 .3 1.4
1 Bed 8.5 8.4 8.3 9.1 7.7 6.5 5.6 5.8 6.3 6.5 6.5 5.5 4.9 7.2 4.4 5.4 5.2 5.6 5.9 7.1 6.9 6.7 5.4 6.7 4.9 4.9 3.9 4.5 4.7 4.2 4.2 3.6 3.3 3.8 3.9 3.7 3.9 3.8 3.7
2 Bed , 1 Bath 9 .9 10 .0 9 .6 1 0.1 10 .6 1 0.0 9 .8 10.0 8 .6 8.3 8.4 6.5 6.9 7.2 6.4 6 .5 6.0 6 .8 6.1 7 .4 7.8 7 .1 7.0 8 .1 6 .5 6 .1 4 .1 4.5 5.2 4.6 4.4 5.2 3.6 3.1 3 .7 4 .1 4 .2 3 .0 2 .8
2 Bed , 2 Bath 9 .2 9 .6 7 .9 8.9 7 .8 7.7 5 .6 8.1 6 .8 6.3 6 .8 7.6 7.1 7.8 5.6 6.6 5.9 5.6 7.5 7 .6 8.0 7 .2 7.0 7 .1 6 .5 6 .0 3 .9 5 .0 4.3 5.0 4.6 4.8 4.6 4.5 3 .6 5 .3 3 .2 4 .0 4 .5
3 Bed 12.2 10.1 9.0 10.0 9.0 8.5 7.7 8.3 9.9 9.0 8.5 7.4 7.8 7.0 7.0 5.7 6.9 8.1 6.8 7.3 8.0 6.5 5.9 6.5 4.4 5.2 3.4 3.4 3.3 5.2 5.9 5.0 3.7 4.6 3.7 3.7 3.5 4.5 3.0
All 9.1 9.1 8.5 9.3 8.5 8.0 6.8 7.6 7.5 7.3 7.2 6.6 6.3 7.4 5.3 6.0 5.6 6.0 6.5 7.3 7.6 7.2 6.3 7.3 5.8 5.4 3.9 4.5 4.7 4.5 4.4 4.4 3.8 4.0 3.7 4.2 3.7 3.7 3.6
Efficie ncy 10 .2 11 .8 9 .6 1 0.0 9 .2 9.7 9 .9 7.9 7 .0 8.6 7 .2 7.0 7 .4 5.3 4 .9 5.1 5 .2 5.9 6 .0 6.9 6 .3 9.7 7 .4 6.6 7 .0 7 .1 5 .2 3 .7 4 .1 3.7 3.0 3.5 3.1 4.7 2.6 3.3 3 .3 4 .9 4 .6
1 Bed 9.6 8.8 7.3 9.0 7.9 6.8 6.7 6.5 6.1 5.9 5.8 5.9 6.2 5.4 4.6 5.3 5.4 5.6 5.9 7.4 8.0 8.6 6.9 7.3 6.1 5.7 4.9 5.1 5.0 4.4 4.4 4.9 4.3 4.5 4.0 4.4 4.3 4.0 4.1
2 Bed, 1 Ba th 10 .1 10 .4 8 .4 1 0.3 9 .9 9.1 9 .5 9.6 8 .5 8.2 8 .3 8.2 8 .1 7.0 5 .9 6.9 6 .4 6.4 6.6 8.1 8.0 9.2 7.4 8.3 6 .8 6 .3 5 .7 6 .4 6.1 5.2 6.0 6.5 6.0 5.2 4.7 5 .2 4 .7 4 .1 4 .3
2 Bed, 2 Ba th 11 .7 10 .1 9 .5 1 1.1 10 .6 8.6 7 .7 8.5 8 .0 7.2 6 .6 7.6 7 .6 7.0 5 .9 6.7 6 .4 6.6 7 .0 8.3 9 .3 9.2 8.0 8.1 6 .9 6 .4 5 .5 6 .1 6 .1 5.4 5.4 5.9 5.6 5.1 4.7 5 .8 5 .1 4 .5 5 .1
3 Bed 13 .4 12 .2 1 1.4 1 1.1 11 .4 9.9 8 .6 1 0.1 11 .0 8.9 9 .7 9.0 8 .8 6.8 6 .7 8.0 7 .8 9.1 7 .7 10.2 9.4 9.7 8.1 8.0 7 .1 6 .0 5 .6 5 .6 5.1 5.1 4.7 6.0 4.3 4.5 3.7 5 .1 5 .1 4 .0 4 .4
All 10.5 9.7 8.5 10.0 9.3 8.0 7.7 7.9 7.4 6.9 6.7 7.0 7.1 6.2 5.3 6.1 5.9 6.2 6.5 7.9 8.4 9.0 7.4 7.7 6.5 6.1 5.3 5.5 5.5 4.8 4.9 5.4 4.9 4.8 4.3 4.9 4.6 4.2 4.4
* vacancy rate affected by new units leasing up
2013
(In Percent)
Vacancy Rates by Apartment Type by County
20112004 2006
M e t r o A v e r a g e
B o u l d e r / B r o o m f i e l d
D e n v e r
D o u g l a s
J e f f e r s o n
A d a m s
A r a p a h o e
Apartment Type
County 2010 2012200820072005 2009

8/13/2019 4Q Vacancy Survey
http://slidepdf.com/reader/full/4q-vacancy-survey 13/27
II-16
County 1st 2nd 3rd 4th 1st 2nd 3rd 4th 1st 2nd 3rd 4th 1st 2nd 3rd 4th 1st 2nd 3rd 4th 1st 2nd 3rd 4th 1st 2nd 3rd 4
Adams
Efficiency 600.10 630.40 629.71 645.76 643.24 636.28 633.13 524.15 577.47 545.73 537.85 599.85 587.55 674.19 659.39 613.67 557.55 527.74 610.85 638.59 647.56 649.30 650.79 671.53 701.46 721.47 635.85 73
1 Bed 697.89 712.23 703.81 721.63 717.07 765.23 752.28 745.74 736.51 748.66 725.94 695.11 754.64 770.89 784.46 769.27 789.71 766.82 822.10 797.86 816.52 789.62 778.08 771.42 794.79 806.27 826.73 82
2 Bed, 1 Bath 766.98 843.24 774.76 801.97 817.23 848.16 819.32 815.05 811.43 878.07 861.62 776.56 857.24 860.80 891.80 846.93 861.82 830.40 858.73 852.48 830.95 843.82 848.13 858.56 863.02 889.58 902.76 93
2 Bed, 2 Bath 993.45 1009.73 982.53 982.56 963.46 1016.66 1020.40 1013.34 1006.93 1009.62 970.65 923.00 1013.25 1012.72 1035.89 1030.50 1036.53 1047.53 1080.14 1051.87 1116.15 1062.60 1067.54 1061.47 1077.02 1116.03 1150.05 112
3 Bed 1146.78 1245.65 1195.80 1184.33 1199.67 1270.60 1291.58 1256.68 1204.98 1237.07 1125.97 1077.46 1113.73 1173.47 1203.03 1200.72 1255.98 1204.07 1308.25 1236.80 1246.64 1241.14 1282.64 1283.09 1315.65 1358.96 1479.06 128
All 822.92 855.15 823.49 844.30 835.88 890.07 882.52 872.68 863.63 884.23 848.22 809.39 874.56 892.48 914.71 892.65 904.78 886.33 935.46 909.71 934.03 906.85 893.86 893.35 910.71 933.96 962.53 94 ArapahoeEfficiency 533.57 541.01 551.00 524.86 537.20 571.37 543.53 551.67 565.86 548.82 551.88 534.69 514.25 564.44 602.73 572.34 604.83 546.36 571.32 575.42 593.65 629.83 617.47 656.03 632.68 674.74 686.78 67
1 Bed 685.63 706.18 710.79 704.39 715.97 722.66 729.40 738.70 738.98 709.33 738.43 722.13 731.76 737.27 754.90 762.02 755.00 759.68 763.50 775.02 787.86 814.37 816.94 815.01 823.70 848.95 872.20 86
2 Bed, 1 Bath 763.23 790.50 785.71 779.96 776.96 815.42 809.18 808.18 805.67 757.07 789.78 782.27 810.60 820.17 826.76 836.34 810.53 820.77 835.52 835.36 843.87 867.12 877.57 853.50 875.36 917.45 930.55 93
2 Bed, 2 Bath 933.87 999.36 947.92 956.38 972.83 968.01 998.71 1021.66 1001.23 978.55 1025.35 1001.19 974.12 1004.12 1044.61 1046.47 1035.97 1055.76 1052.06 1061.60 1068.62 1131.74 1137.46 1133.25 1116.60 1152.42 1179.87 116
3 Bed 1078.45 1224.26 1165.91 1166.23 1179.71 1225.42 1274.25 1236.44 1269.28 1218.78 1206.83 1255.12 1235.90 1262.30 1299.39 1325.81 1283.60 1322.59 1305.15 1289.19 1302.07 1376.53 1375.89 1392.63 1356.72 1390.48 1431.93 142
All 790.19 831.48 814.41 813.83 827.45 837.62 850.72 865.30 859.01 828.46 862.16 847.95 841.03 856.54 881.97 889.67 879.65 892.08 892.61 900.48 909.56 956.30 956.62 950.93 950.29 979.47 1007.31 99
Boulder/BroomfieldEfficiency 791.67 723.26 676.61 707.64 608.89 760.59 776.53 760.98 713.64 712.88 719.32 714.41 731.22 747.61 731.30 737.71 752.78 798.59 816.26 782.56 805.66 852.01 816.43 868.49 864.99 893.42 810.59 83
1 Bed 823.76 816.66 819.32 835.84 834.33 847.52 868.08 850.00 843.51 880.02 859.59 844.49 850.10 882.44 876.48 878.39 875.48 893.63 905.02 929.51 942.26 962.03 1017.54 971.61 991.77 1041.22 1045.16 105
2 Bed, 1 Bath 806.63 832.45 828.15 839.98 842.97 872.58 882.77 899.52 912.01 917.76 898.18 880.94 865.38 898.44 919.67 939.04 961.14 960.80 958.95 961.02 996.00 1012.48 1059.78 1056.15 1085.71 1084.64 1110.98 112
2 Bed, 2 Bath 1225.12 1207.09 1130.87 1156.10 1124.72 1128.19 1153.34 1137.12 1087.21 1104.97 1117.28 1085.42 1095.48 1180.20 1167.59 1172.99 1170.00 1168.75 1193.74 1197.83 1255.23 1267.41 1272.76 1273.80 1354.92 1412.06 1439.82 141
3 Bed 1188.26 1253.23 1215.52 1267.50 1258.75 1220.86 1285.12 1291.99 1216.97 1280.24 1283.15 1320.96 1317.18 1381.29 1376.10 1292.24 1375.22 1371.89 1374.00 1390.50 1453.69 1455.25 1512.71 1472.61 1526.98 1568.64 1583.28 157
All 950.20 945.89 920.61 936.53 921.46 952.22 974.68 962.27 942.18 967.19 951.11 943.23 946.60 995.07 993.25 996.22 1003.08 1016.15 1031.18 1037.94 1070.38 1091.12 1115.69 1103.61 1150.02 1194.57 1194.19 119
Denver Efficiency 648.26 626.70 627.27 631.27 636.83 649.30 664.01 646.67 647.05 663.25 675.65 721.60 648.52 664.78 672.42 680.93 720.46 717.25 746.82 723.18 737.93 815.19 816.45 808.01 844.54 884.42 886.17 88
1 Bed 747.32 764.54 784.46 780.33 784.21 822.74 814.55 808.35 806.46 790.70 798.49 793.86 793.92 818.10 819.69 823.59 834.82 839.20 866.16 864.70 881.34 904.86 919.51 862.38 901.61 915.25 950.36 96
2 Bed, 1 Bath 872.37 892.55 862.73 834.07 827.45 872.11 885.58 877.57 885.53 869.53 897.82 878.06 898.55 906.66 896.83 888.26 868.55 860.92 900.15 896.31 947.96 959.23 979.48 919.45 957.98 958.24 993.68 101
2 Bed, 2 Bath 1038.52 1090.88 1119.93 1107.75 1103.91 1137.85 1131.52 1149.92 1169.04 1126.14 1097.55 1163.05 1108.16 1143.62 1125.83 1135.90 1133.45 1147.66 1166.21 1181.63 1250.83 1290.11 1298.80 1250.77 1302.49 1327.00 1362.69 135
3 Bed 1320.61 1292.57 1341.53 1402.28 1529.22 1490.17 1411.77 1405.35 1495.73 1456.48 1439.59 1397.92 1263.72 1321.12 1309.38 1332.35 1318.35 1301.38 1448.66 1381.17 1420.19 1429.85 1494.50 1653.35 1424.02 1457.73 1471.85 157
All 841.23 859.56 874.42 860.00 866.49 909.03 906.12 903.41 901.44 881.37 888.07 902.66 883.87 909.46 905.01 910.73 915.30 918.05 950.14 940.81 973.39 1005.98 1015.87 985.09 1008.67 1025.93 1055.92 106
Douglas
Efficiency 735.00 742.00 620.00 725.00 742.00 675.00 675.00 687.50 742.00 742.00 742.00 570.00 835.00 600.00 784.50 710.00 710.00 728.00 782.00 745.00 742.00 790.00 795.00 787.50 885.00 896.00 900.00 93
1 Bed 844.42 874.75 866.33 921.34 895.89 922.36 927.68 874.49 861.40 861.56 900.19 874.91 908.53 917.84 949.36 936.07 946.23 921.16 946.09 921.35 949.78 948.13 960.55 1003.31 1005.37 1032.08 1057.44 108
2 Bed, 1 Bath 994.83 1009.32 1008.83 966.15 912.07 953.66 974.98 1034.22 939.81 939.64 1020.57 1011.95 1038.55 1094.79 1106.59 1092.49 1097.67 1070.52 1128.00 1077.86 1102.37 1099.92 1118.67 1186.36 1170.55 1218.70 1218.95 119
2 Bed, 2 Bath 1118.32 1137.48 1124.68 1153.86 1136.87 1166.03 1153.70 1128.07 1131.33 1115.79 1187.23 1144.54 1180.02 1197.13 1217.95 1176.85 1220.34 1214.56 1253.30 1249.01 1233.92 1267.69 1281.57 1324.29 1329.91 1412.23 1371.85 135
3 Bed 1330.29 1374.25 1369.97 1370.85 1363.59 1367.92 1435.08 1362.63 1319.20 1354.96 1446.95 1406.91 1474.66 1555.55 1567.48 1545.91 1503.32 1550.72 1590.98 1452.82 1516.24 1612.31 1544.48 1621.09 1605.32 1704.51 1644.69 163
All 1001.11 1030.35 1016.13 1043.09 1018.16 1045.23 1051.05 1020.79 1002.54 999.55 1058.13 1027.15 1055.12 1085.79 1112.52 1089.60 1099.47 1086.51 1120.37 1092.40 1109.74 1131.19 1140.85 1186.98 1186.34 1242.74 1235.84 123
Jefferson
Efficiency 514.94 534.47 586.67 599.82 601.94 571.56 584.69 564.74 560.38 561.07 540.43 556.80 557.52 556.99 594.63 593.84 595.32 561.67 602.76 596.41 608.94 636.58 619.65 625.85 681.21 703.19 709.82 67
1 Bed 725.51 717.85 727.21 743.42 730.26 736.34 754.70 729.24 723.15 720.93 724.18 725.32 726.04 745.26 766.70 752.94 750.47 764.29 787.22 789.83 807.02 827.41 857.89 841.52 869.21 890.37 928.32 90
2 Bed, 1 Bath 763.60 769.02 773.93
803.14 779.40 785.34 802.53 778.09 787.50 789.60 780.35 917.03 798.69 814.16 816.09 815.55 816.91 816.50 844.89 838.82 849.31 867.10 873.24 863.55 878.46 901.06 944.53 92
2 Bed, 2 Bath 930.57 919.74 934.15 925.48 943.30 971.72 988.27 953.89 936.59 936.01 951.02 962.08 969.19 965.82 985.51 954.99 973.16 994.94 1008.49 1000.72 1018.26 1037.18 1081.12 1103.71 1107.51 1178.82 1208.44 114
3 Bed 1066.16 1070.83 1044.82 1035.05 1059.12 1084.21 1127.62 1086.38 1080.05 1119.47 1118.76 1122.91 1111.09 1133.51 1157.06 1156.45 1164.89 1184.76 1221.11 1219.64 1213.65 1229.41 1241.19 1241.30 1235.79 1284.50 1372.52 131
All 818.76 812.15 823.11 826.07 825.00 827.14 847.43 819.71 814.84 812.41 818.18 848.75 833.94 845.38 863.99 847.17 851.33 862.86 888.02 889.19 897.65 919.55 949.28 941.79 958.08 1003.19 1035.64 99
Metro Average
Efficiency 624.60 613.25 618.84 623.83 618.90 635.74 645.31 629.66 632.37 638.61 645.74 676.71 628.95 645.61 656.95 655.70 677.32 674.53 706.77 695.27 710.79 773.67 765.09 770.85 778.51 809.86 823.49 81
1 Bed 732.58 744.71 752.78 759.88 759.28 781.73 782.91 775.89 772.32 760.75 770.94 756.42 770.29 787.18 798.11 795.33 799.90 799.50 819.58 822.47 838.93 856.38 866.10 848.30 868.14 889.81 918.82 92
2 Bed, 1 Bath 808.62 838.29 821.36 817.69 811.42 841.35 841.57 841.81 841.40 834.13 845.57 850.90 852.62 869.51 876.64 870.33 866.15 858.27 883.64 877.73 893.91 911.04 923.56 906.18 930.39 952.66 976.12 98
2 Bed, 2 Bath 1003.81 1034.80 1018.11 1021.31 1020.84 1040.72 1052.78 1056.04 1043.45 1027.33 1042.66 1035.87 1032.92 1058.99 1074.70 1068.95 1071.28 1085.16 1097.10 1098.45 1130.98 1162.32 1174.35 1170.70 1182.71 1227.38 1254.11 123
3 Bed 1162.03 1225.86 1198.79 1199.53 1230.57 1261.69 1290.76 1258.64 1245.42 1250.45 1229.25 1222.57 1216.55 1267.18 1285.56 1283.99 1286.43 1292.61 1336.55 1295.00 1316.48 1359.15 1374.33 1406.98 1378.91 1421.42 1468.13 143
All 842.69 863.53 858.36 860.36 861.26 886.14 892.22 888.81 881.92 870.37 880.99 875.39 877.16 899.97 912.68 908.77 911.41 915.08 936.46 932.02 952.60 979.80 986.42 978.99 992.77 1022.33 1048.63 104
2007
Average rents do not reflect "rental losses" from discounts, concessions, models, delinquents, and bad debts.
Average rent minus rental losses equals effective rent.
2010 20122008
Rents are based on the units being unfurnished with tenants paying electricity and gas.
(In Dollars)
Average Rent s by Ap artm ent Type b y Count y
2011 20132009
8/13/2019 4Q Vacancy Survey
http://slidepdf.com/reader/full/4q-vacancy-survey 14/27
II-17
County Year Built 1st 2nd 3rd 4th 1st 2nd 3rd 4th 1st 2nd 3rd 4th 1st 2nd 3rd 4th 1st 2nd 3rd 4th 1st 2nd 3rd 4th 1st 2nd 3rd
Adams To 1959 587.50 562.50 562.50 595.45 593.18 537.24 546.84 547.11 473.46 644.23 515.91 550.00 560.00 560.00 585.00 585.00 585.00 585.00 610.00 610.00 650.00 650.00 705.00 720.00 61960-69 609.41 1037.27 641.55 640.62 771.85 1223.15 647.10 639.69 729.08 981.27 968.27 590.24 578.99 659.71 778.76 670.43 784.93 677.17 676.64 806.59 734.60 740.15 730.40 775.74 764.94 765.37 792.83 81970-79 640.81 642.61 654.28 667.07 664.89 689.63 692.22 685.52 691.71 690.22 677.97 688.69 781.06 790.89 782.74 756.47 755.42 697.43 741.47 743.56 695.41 734.55 700.15 698.72 729.19 735.49 751.95 71980-89 797.85 839.18 768.94 773.86 775.43 851.28 838.19 857.63 822.99 834.01 798.01 805.77 830.75 821.40 867.57 868.24 860.01 858.44 968.22 868.76 1007.29 833.14 854.09 852.50 862.67 909.93 934.65 91990-99 923.17 958.05 936.58 940.95 933.09 942.72 962.23 940.15 933.50 942.30 876.24 874.99 937.69 937.45 972.69 952.81 964.22 984.93 979.10 979.09 990.91 1000.62 1036.80 1059.86 1053.79 1082.90 1115.67 10
2000-04 975.49 986.31 993.14 991.46 974.50 1022.66 1011.81 983.48 967.30 969.32 959.33 874.82 962.73 1002.68 993.61 1005.66 1006.92 1030.32 1057.00 1041.82 1048.61 1069.11 1095.03 1076.24 1092.11 1137.95 1182.49 112 00 5 u p 1 31 6. 98 1 24 9. 48 1 25 2. 63 1 17 3. 72 1 14 6. 08 1 09 3. 50 1 15 8. 59 1 16 1. 61 1 16 2. 10 1 15 5. 31 1 15 5. 88 1 15 5. 95 1 08 7. 11 1 17 7. 48 1 17 6. 86 1 20 6. 87 1 10 8. 39 1 09 2. 92 1 08 6. 61 1 12 8. 52 1 15 6. 00 1 1
Arapahoe To 1959 556.33 1783.75 559.22 805.14 800.81 1151.42 1101.67 1071.18 1092.50 925.00 977.50 847.98 937.07 918.89 991.33 984.33 665.63 686.67 586.11 643.33 906.38 71960-69 626.80 620.01 612.50 641.68 640.37 672.97 580.76 676.19 687.94 642.85 691.38 654.48 675.93 653.04 672.76 695.24 687.13 688.14 713.63 694.65 651.03 668.28 666.51 675.91 739.85 784.84 777.16 71970-79 634.52 660.22 659.66 658.99 655.13 689.74 680.05 691.37 703.99 671.33 663.08 635.02 696.05 700.78 690.95 669.45 669.78 665.29 670.85 678.31 686.20 702.95 698.81 710.99 724.74 731.12 748.19 71980-89 716.46 727.19 737.30 735.27 751.59 752.26 770.29 766.50 756.75 731.21 741.60 719.54 749.09 763.15 781.12 784.24 794.32 768.30 792.47 789.20 797.99 820.53 837.79 810.49 839.55 866.22 900.03 81990-99 1028.83 1145.55 1027.92 1017.80 1027.67 1057.61 1035.38 1014.19 985.26 970.20 1042.55 1028.47 1003.76 1018.85 1045.47 1105.65 1032.12 1100.00 1120.57 1123.27 1134.34 1153.25 1168.62 1190.27 1141.40 1191.92 1208.85 122000-04 990.22 1035.33 1012.29 999.70 1036.65 982.76 1013.00 1057.87 1064.02 1055.53 1068.37 992.40 1014.95 1046.87 1112.68 1111.09 1104.25 1110.46 1071.39 1094.93 1115.12 1111.23 1123.89 1162.30 1191.16 1171.10 1198.43 122005 up 1224.20 1226.41 1198.54 1190.06 1194.22 1186.55 1093.18 1145.61 1133.88 1138.89 1174.62 1174.06 1188.54 1145.67 1118.75 1164.49 1164.19 1224.18 1207.63 1193.16 1199.69 1217.61 1253.79 12To 1959 763.13 784.38 766.25 767.50 764.38 767.50 764.38 821.88 821.88 821.88 841.25 841.25 731.57 733.13 625.00 700.22 700.22 701.30 641.67 748.26 741.39 948.13 641.67 763.57 796.17 752.35 779.04 71960-69 805.61 823.83 766.54 811.61 801.14 917.80 920.52 915.78 971.10 885.33 883.70 898.31 904.31 890.03 873.54 906.04 969.17 972.20 1039.59 990.40 1010.84 1090.27 985.02 989.54 999.53 1015.54 987.90 91970-79 671.58 675.68 703.70 677.53 690.69 687.99 725.76 734.92 742.22 789.71 772.83 768.09 760.80 734.14 760.25 817.73 814.87 822.44 824.73 791.05 852.21 839.77 847.40 878.80 948.56 905.59 891.79 91980-89 836.82 862.57 848.59 837.43 858.16 869.93 847.51 832.57 859.88 858.35 848.40 862.21 874.26 881.07 902.00 897.23 935.11 934.82 951.19 955.20 954.12 967.30 1005.63 1007.33 1049.42 1079.47 1145.03 101990-99 1179.94 1176.89 1104.19 1072.27 1061.87 1039.70 1076.32 1065.93 993.65 1003.98 1014.68 1026.18 1038.47 1125.50 1116.94 1108.35 1094.47 1090.26 1122.24 1127.70 1203.55 1185.27 1233.30 1262.23 1257.37 1316.98 1323.19 132000-04 971.89 955.49 917.41 1063.76 1026.05 1112.19 1194.75 1094.06 1077.54 1100.69 1123.01 980.32 981.49 1007.75 998.84 1013.44 1056.04 1090.83 1060.29 1067.12 1111.85 1125.67 1125.82 1050.27 1081.59 1142.17 1152.03 112 005 up 74 5.6 9 1 374 .69 1 41 5.4 7 12 44. 94 1 240 .57 1 24 0.5 7 12 75. 80 1 291 .98 1 15 9.8 5 11 77. 75 1 219 .73 1 15 8.8 0 1 24 4.0 7 1 23 1. 49 1 250 .43 1 32 0.4 0 12 21 .6 3 1 34 9. 10 1 41 0.5 9 1 41 4.5 4 14
Denver To 1959 624.46 624.98 629.67 665.18 687.70 688.30 701.17 706.92 689.15 682.32 725.88 707.25 721.40 720.47 732.15 701.22 689.70 656.49 675.55 759.48 718.77 784.24 755.50 741.08 774.05 830.89 818.34 81960-69 632.18 632.11 632.67 672.04 683.56 679.98 722.09 700.21 697.80 708.35 693.78 718.62 728.03 723.79 728.36 724.62 722.99 718.51 749.35 765.14 775.13 802.50 810.95 790.60 845.42 844.78 839.17 81970-79 713.25 704.02 690.04 675.69 675.88 694.00 697.31 696.78 701.13 680.08 677.37 665.19 727.01 707.40 704.16 710.00 717.55 722.06 749.55 725.94 754.15 754.04 792.49 750.61 791.36 781.24 820.61 81980-89 867.38 901.64 950.14 923.46 945.79 897.46 879.79 875.35 855.30 822.71 839.14 841.72 883.84 919.35 898.54 906.87 901.96 895.76 920.78 931.85 982.62 1016.69 986.12 1031.60 1031.93 1054.38 1071.91 101990-99 1046.70 1146.00 1150.65 1138.71 1067.50 1192.30 1195.83 1223.33 1234.64 1216.94 1184.72 1185.93 1045.51 1064.16 1080.01 1089.37 1114.47 1114.45 1132.67 1190.85 1222.41 1251.22 1254.87 1197.98 1194.53 1191.78 1245.29 142000-04 1104.21 1099.82 1092.78 1108.50 1118.35 1216.35 1171.44 1173.06 1182.57 1124.59 1046.06 1017.16 1045.08 1059.61 1071.89 1069.35 1109.22 1123.14 1121.80 1189.27 1208.48 1273.26 1334.96 1274.25 1280.12 1308.04 1310.45 122005 up 1258.35 1607.59 1545.46 1497.58 1487.61 1452.69 1475.04 1441.60 1454.64 1321.57 1378.88 1453.86 1479.97 1533.13 1462.73 1433.62 1372.09 1402.18 1519.12 1363.93 1347.30 1399.12 1424.27 1733.91 1491.57 1471.80 1527.97 14
Douglas To 19591960-691970-79 635.00 81980-89 829.74 838.27 852.10 849.11 852.10 852.10 808.70 852.63 886.76 886.76 900.18 865.86 931.67 895.97 895.97 871.45 917.49 892.45 1017.75 983.70 985.93 1062.57 1083.58 1097.50 1034.47 101990-99 976.48 1012.82 1055.39 1044.65 1054.17 1049.47 1123.60 1070.64 1027.62 991.04 1069.31 1034.89 1081.59 1152.44 1186.78 1172.80 1085.75 1091.13 1099.56 1115.19 1162.74 1180.77 1203.10 1216.23 1223.35 1276.35 1271.72 122000-04 1016.89 1061.06 1010.01 1059.02 1014.19 1060.01 1028.09 1020.44 992.65 1019.24 1069.81 1037.61 1067.85 1066.22 1059.19 1018.56 1120.42 1120.42 1168.07 1112.77 1086.85 1121.54 1119.27 1190.26 1168.49 1229.65 1223.96 122005 up 1142.60 1095.36 1266.28 1426.79 1355.80 13
Jef ferson To 1959 594.69 587.44 587.08 569.66 602.03 639.23 641.68 632.90 598.31 628.09 641.62 629.42 627.49 609.05 549.76 553.90 605.94 658.59 642.99 795.18 690.40 803.86 792.88 753.58 752.26 714.34 739.86 71960-69 719.69 727.86 739.03 972.50 772.85 740.23 762.47 698.26 701.19 711.79 715.95 740.46 760.68 720.27 733.27 731.91 714.94 729.94 743.55 740.44 733.65 775.74 774.80 788.39 790.53 805.78 825.39 81970-79 689.91 675.28 697.65 687.29 690.95 692.03 706.85 694.97 705.24 707.70 684.09 767.30 702.15 723.44 741.34 756.20 758.48 747.63 769.27 776.27 777.94 776.99 824.67 804.81 808.00 819.89 851.76 81980-89 840.98 824.05 834.40 839.57 840.78 853.15 850.59 848.24 839.92 812.82 795.71 801.35 833.10 823.04 829.12 817.26 819.55 809.22 844.17 846.08 852.94 885.75 933.86 960.13 955.22 1030.82 1047.29 10
1990-99 954.44 961.76 959.52 914.67 919.11 975.38 1008.08 970.91 959.87 992.11 969.84 968.28 920.94 934.27 993.82 991.99 1012.03 1022.95 1035.71 1051.52 1085.61 1117.16 1106.97 1088.90 1124.29 1149.35 1172.89 112000-04 863.29 885.16 885.57 918.72 956.73 980.12 955.09 887.36 913.24 914.04 915.69 914.59 913.28 934.50 977.09 922.16 947.59 995.62 1068.28 1025.32 1086.35 1124.03 1144.79 1117.64 1222.01 1207.77 1236.59 122005 up 1069.27 1060.53 1022.90 1035.87 1080.63 1198.81 1160.63 1118.07 1094.77 921.38 1154.79 1148.34 1093.17 1192.89 1158.44 1086.51 1195.59 1195.59 1195.59 1195.59 1195.59 1195.59 1252.20 1290.78 1271.43 1293.91 1302.75 14To 1959 623.63 629.37 628.07 664.15 687.11 688.91 700.75 704.72 685.39 680.32 721.13 700.98 720.01 717.43 721.60 691.21 681.17 656.79 672.46 759.38 717.34 784.50 752.63 740.01 772.61 820.33 815.34 81960-69 664.62 713.39 665.99 718.17 704.47 743.31 709.73 716.56 739.15 748.51 758.84 710.72 721.88 715.21 731.96 736.07 751.66 734.12 760.50 768.79 765.84 798.17 806.51 803.25 818.76 824.18 841.73 81970-79 672.58 675.15 678.89 672.39 673.06 691.48 696.27 696.37 704.94 691.18 685.39 692.89 724.87 721.66 722.10 723.48 725.13 713.37 732.96 727.89 735.90 748.10 754.99 747.66 770.35 771.44 796.31 81980-89 785.31 800.24 805.96 801.07 810.23 814.88 818.55 820.41 803.49 783.44 785.04 775.80 808.84 822.03 828.80 832.74 837.66 823.75 861.51 847.68 886.41 880.02 888.81 886.73 905.51 940.47 971.11 91990-99 1017.86 1074.10 1040.75 1020.53 1011.33 1048.18 1062.50 1043.60 1015.58 1011.87 1027.48 1024.00 999.75 1033.69 1063.00 1074.10 1043.00 1070.34 1086.02 1096.80 1129.44 1148.09 1161.76 1171.01 1159.70 1201.11 1219.24 122000-04 1010.55 1030.29 1011.12 1032.48 1030.23 1069.34 1054.74 1051.27 1038.11 1037.21 1035.66 977.65 1013.78 1035.13 1055.27 1049.80 1077.06 1091.52 1095.10 1099.49 1114.79 1142.64 1157.33 1163.76 1176.30 1207.89 1223.41 122005 up 1118.29 1354.33 1364.64 1330.06 1323.36 1313.82 1314.90 1261.43 1279.56 1220.24 1220.48 1244.52 1236.08 1291.78 1280.70 1269.71 1259.87 1255.71 1272.96 1254.01 1245.67 1279.19 1290.45 1304.71 1290.04 1334.79 1380.67 13
2013
(In Dollars)
Average rent minus rental losses equals effective rent.
Boulder/
Broomfield
2012
Average Ren ts by Age of B uild ing b y Coun ty
Rents are based on units being unfurnished with tenants paying gas and electricity.
2011
Metro
Average
2007
Average rents do not reflect "rental losses" from discounts/concessions, models, delinquents, and bad debts.
2008 2009 2010

8/13/2019 4Q Vacancy Survey
http://slidepdf.com/reader/full/4q-vacancy-survey 15/27
II-18
County 1st 2nd 3rd 4th 1st 2nd 3rd 4th 1st 2nd 3rd 4th 1st 2nd 3rd 4th 1st 2nd 3rd 4th 1st 2nd 3rd 4th 1st 2nd 3rd
Adams Up to 8 656.25 821.00 1600.00 748.30 937.50 862.50 592.50 862.50 862.50 862.50 237.50 782.25 556.25 362.50 672.00 672.00 1367.00 1367.00 1367.00 1367.00
9 to 50 607.73 1636.88 604.21 610.29 1015.49 1398.37 600.99 614.36 986.14 1766.34 1499.32 622.13 649.78 675.90 968.40 621.37 902.24 738.30 624.73 1032.74 724.26 731.58 704.35 656.13 729.67 693.04 744.18 7
51 to 99 600.96 517.41 581.38 604.82 611.40 580.12 583.07 581.23 630.73 621.46 607.77 643.83 741.41 788.26 765.50 705.50 795.27 632.34 592.71 625.72 680.20 714.32 630.43 632.18 676.15 663.76 678.97 7
100 to 199 656.48 693.10 689.93 707.29 725.82 761.36 763.03 759.07 763.07 758.45 724.13 739.03 769.95 772.47 768.79 752.60 720.03 718.97 739.78 747.67 740.35 774.16 774.76 767.55 795.86 801.93 815.81 8
200 to 349 855.96 906.60 864.60 875.93 872.92 913.51 921.66 908.57 883.67 902.78 859.09 847.98 854.88 896.93 945.09 905.72 917.87 917.85 932.64 924.68 942.39 936.64 944.29 928.61 940.28 974.11 1022.59 9
350 and up 855.48 841.58 841.91 878.21 856.06 902.85 897.59 900.67 892.07 896.62 869.51 805.06 967.47 948.28 941.53 952.12 956.12 935.87 1044.10 961.71 1016.68 920.81 894.69 910.19 920.77 942.45 954.06 9
Arapahoe Up to 8 592.41 1193.23 528.67 1166.47 598.53 1196.76 664.41 1205.11 2136.93 786.30 1255.03 637.75 619.23 668.13 634.53 633.96 619.36 650.08 583.34 568.76 696.22 630.24 689.56 652.69 609.37 622.29 659.43 7
9 to 50 636.71 632.12 540.56 609.44 583.54 640.09 633.17 613.56 643.98 621.31 615.04 593.84 629.42 662.49 634.14 653.45 639.52 658.65 642.19 634.27 661.87 677.22 673.69 662.36 690.83 704.98 746.08 7
51 to 99 632.01 645.63 642.86 621.83 631.53 602.32 629.44 651.98 631.78 610.64 751.13 706.37 673.96 686.27 703.20 696.66 707.06 685.24 697.16 707.69 727.29 717.79 751.31 738.32 784.11 935.63 936.82 8
100 to 199 675.11 709.50 712.63 701.81 729.28 723.45 764.38 740.34 751.57 724.44 733.28 731.88 747.04 715.59 701.06 720.31 731.76 726.87 740.53 757.94 765.13 806.08 782.95 795.39 790.57 780.89 843.04 8
200 to 349 873.91 928.54 892.58 867.80 894.34 886.56 914.59 941.42 934.60 923.67 932.00 882.21 899.12 926.87 962.83 988.93 958.12 960.55 958.03 968.98 974.98 1046.71 1030.46 1027.52 1026.48 1038.37 1079.55 10
350 and up 761.04 794.40 794.66 809.59 813.58 835.79 829.43 837.14 821.08 785.49 843.99 861.57 833.75 850.44 876.90 872.21 865.76 885.44 891.06 896.41 907.94 931.22 951.32 930.72 932.85 976.13 989.21 9
Up to 8 699.20 715.49 706.61 763.60 1339.81 726.72 747.44 742.95 1606.98 787.50 725.11 747.59 758.65 768.17 759.82 728.98 754.10 739.38 710.44 767.47 759.00 795.35 731.51 778.41 794.49 773.68 796.00 8
9 to 50 790.01 831.91 837.94 864.68 870.73 842.03 781.61 836.92 835.91 870.50 901.56 888.29 814.09 857.30 872.99 811.88 882.34 890.23 902.14 924.39 947.06 953.69 1000.66 961.41 971.30 980.99 1075.56 10
51 to 99 728.05 726.45 755.00 920.67 871.56 931.95 917.17 887.11 929.34 917.00 889.64 887.72 918.71 953.16 942.44 917.37 947.45 969.82 1042.91 1052.99 1054.23 1085.30 1066.92 1064.90 990.34 989.43 1071.42 10
100 to 199 847.02 879.98 849.64 822.47 826.62 937.56 941.22 935.70 969.45 972.64 898.74 950.56 946.07 1022.61 1029.87 1020.00 1048.91 1076.79 1078.29 1044.88 1068.74 1083.50 1092.93 1123.97 1205.68 1248.65 1232.21 12
200 to 349 873.23 850.98 885.67 871.41 882.40 893.42 926.64 916.85 911.30 937.80 909.09 893.32 891.99 896.19 901.39 936.35 961.11 965.44 989.85 1000.14 1015.76 1025.32 1070.29 1078.51 1095.90 1121.89 1111.14 11
350 and up 1231.34 1271.10 1100.29 1146.02 1049.72 1072.37 1089.39 1083.65 980.22 1024.11 1070.97 1006.60 1044.11 1118.93 1102.53 1108.73 1074.07 1083.10 1091.70 1103.34 1158.47 1202.59 1217.60 1143.11 1216.67 1302.61 1292.37 12
Denver Up to 8 586.42 719.62 616.57 676.64 626.13 628.21 625.60 653.76 645.67 642.49 729.48 701.58 643.35 713.54 697.41 643.88 651.28 648.49 688.79 696.78 701.87 720.53 703.92 719.56 731.53 732.74 741.67 7
9 to 50 576.60 573.38 589.80 621.32 640.59 660.84 661.62 668.24 653.98 653.04 698.63 840.63 689.93 719.14 698.94 695.72 668.21 688.47 695.06 775.56 747.64 781.67 805.26 798.40 823.24 856.87 875.11 8
51 to 99 683.41 718.25 713.91 742.64 738.61 738.11 726.64 728.25 719.28 744.95 725.06 790.59 807.52 772.46 787.52 802.48 804.36 758.20 872.85 816.81 830.37 810.49 842.52 795.31 844.68 866.87 933.42 8
100 to199 770.65 846.77 864.61 846.30 853.74 860.13 836.28 838.49 799.88 805.81 831.69 845.24 813.32 891.85 929.35 927.30 923.22 920.29 938.35 971.87 936.09 1009.07 990.95 1015.56 979.81 996.04 1037.31 11
200 to 349 954.11 987.68 1019.78 961.55 901.06 1031.09 1010.22 1006.33 1029.02 999.50 962.68 977.79 970.90 987.23 975.96 994.31 975.66 968.30 1021.78 983.00 1027.01 1028.65 1069.79 1045.31 1056.12 1092.54 1113.35 10
350 and up 857.55 840.27 856.13 856.07 927.52 917.70 925.62 924.47 913.57 899.54 922.85 883.46 882.90 909.36 895.96 906.30 926.51 934.71 941.58 954.77 1027.91 1081.64 1073.51 1010.35 1058.87 1035.63 1064.22 10
Douglas Up to 8
9 to 50 737.40 679.04 512.50 548.21 523.21 523.21 523.21 523.21 548.21 523.21 487.50 487.50 548.21 523.21 709.88
51 to 99 635.00 689.10 8
100 to 199 837.50 834.78 931.67 895.97 895.97 895.97 895.97 824.18 850.26 920.27
200 to 349 957.84 1020.27 1045.12 1042.40 993.11 1021.55 1031.21 1001.68 963.76 988.55 1085.25 1056.94 1103.63 1095.50 1094.76 1088.04 1120.80 1130.81 1157.95 1135.01 1141.23 1144.94 1163.43 1195.34 1230.44 1302.66 1271.16 12
350 and up 1024.94 1039.65 1004.84 1044.95 1032.73 1057.30 1063.59 1042.29 1031.41 1014.80 1040.39 1007.31 1047.59 1090.61 1125.67 1102.57 1096.01 1067.58 1106.87 1072.50 1077.92 1132.55 1126.61 1180.60 1157.42 1201.30 1218.40 12
Jef ferson Up to 8 677.43 665.57 678.97 671.74 675.78 661.29 699.15 716.44 725.09 742.45 763.31 733.50 704.16 746.87 706.06 710.14 713.79 750.73 732.64 741.58 738.19 765.18 752.52 749.35 755.48 784.11 792.91 7
9 to 50 625.40 624.46 631.13 965.25 648.62 666.41 669.36 648.92 660.09 659.62 663.44 1237.78 677.34 673.96 671.70 667.56 676.16 671.02 781.16 800.08 791.81 812.30 809.72 800.68 804.10 834.52 840.44 8
51 to 99 694.60 691.22 705.70 738.21 716.12 695.28 721.56 686.57 715.79 686.35 853.60 768.27 692.30 759.05 760.49 743.78 735.52 746.96 760.45 758.32 714.04 735.52 759.64 745.03 738.23 752.29 795.31 8
100 to 199 739.11 748.48 766.53 760.66 764.11 720.49 753.59 739.11 766.96 765.49 765.82 766.20 829.89 820.92 810.34 792.22 791.98 792.02 816.59 817.93 832.48 853.07 810.49 838.06 866.67 871.46 913.28 9
200 to 349 877.25 868.17 863.16 857.88 888.96 892.28 911.92 883.11 850.55 824.13 851.12 866.58 864.85 876.89 912.50 876.87 889.18 905.43 904.97 897.59 917.35 937.38 1005.56 980.56 1007.96 1058.11 1092.99 10350 and up 877.47 856.25 873.11 836.38 844.53 890.33 895.52 862.98 853.57 891.88 835.10 854.48 849.31 864.07 888.37 903.48 906.19 914.52 954.98 948.79 953.53 969.27 1038.44 1027.67 1037.06 1087.77 1127.57 10
Up to 8 616.97 798.14 643.56 757.37 708.78 743.86 662.93 742.42 903.01 702.10 823.15 706.29 667.23 722.10 694.44 674.97 677.34 696.32 689.48 696.63 720.12 721.34 721.79 729.96 732.15 748.91 758.60 7
9 to 50 603.26 654.36 608.74 694.46 667.16 712.43 665.16 667.72 678.59 710.62 741.74 868.55 685.29 712.29 711.04 688.04 695.03 702.23 723.13 781.63 756.95 787.62 794.69 785.41 806.95 840.54 859.63 8
51 to 99 672.73 681.36 689.24 717.69 711.97 706.32 701.83 704.28 708.10 704.81 756.41 768.06 765.69 765.54 776.58 771.52 785.58 748.57 793.02 789.47 797.17 793.26 807.21 781.69 819.04 846.92 898.82 8
100 to 199 729.34 774.22 775.13 768.92 781.86 790.21 802.30 791.94 798.84 791.39 789.55 796.14 812.94 829.13 838.11 830.85 831.18 826.77 838.90 852.74 854.97 895.38 872.23 884.20 902.26 913.20 952.82 9
200 to 349 894.77 930.38 923.31 902.60 898.18 933.58 945.78 945.05 935.29 930.67 925.13 910.94 916.46 937.59 957.52 960.23 957.30 957.79 974.55 968.07 990.43 1016.90 1036.21 1026.89 1038.28 1068.03 1097.95 10
350 and up 872.67 870.43 869.11 882.95 891.76 912.11 911.16 907.03 890.56 876.38 896.55 880.34 894.90 920.23 929.36 925.03 925.21 931.46 956.36 948.91 979.45 1000.11 1006.18 992.15 1005.42 1034.17 1055.50 10
Average Ren ts by Size of B uild ing b y Coun ty
201020092007 2008 2013
(In Dollars)
Boulder/
Broomfield
Metro
Average
Average rent minus rental losses equals effective rent.
Average rents do not reflect "rental losses" from discounts/concessions, models, delinquents, and bad debts.
2012
Rents reflect units being unfurnished with tenants paying gas and electricity.
Number of Units2011
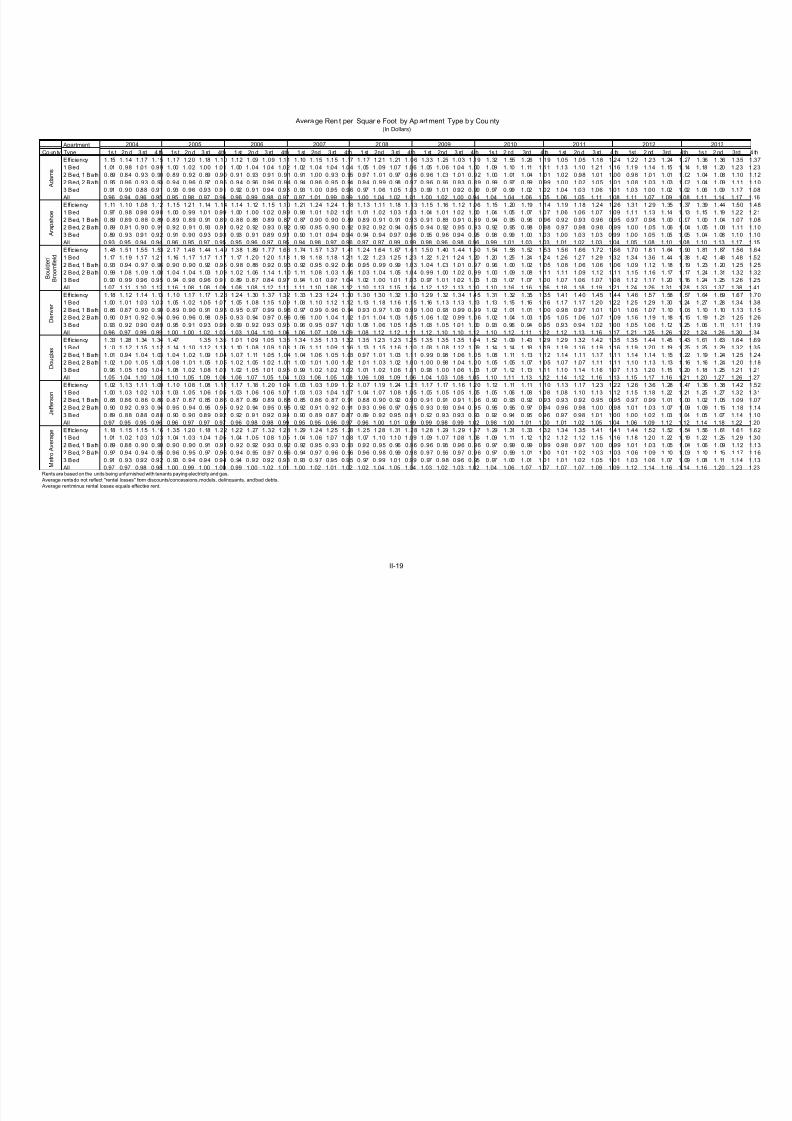
8/13/2019 4Q Vacancy Survey
http://slidepdf.com/reader/full/4q-vacancy-survey 16/27
II-19
Apartment
Co un ty Type 1s t 2n d 3 rd 4 th 1s t 2n d 3 rd 4th 1 st 2n d 3 rd 4th 1 st 2nd 3 rd 4th 1 st 2nd 3 rd 4th 1 st 2nd 3 rd 4th 1s t 2 nd 3rd 4 th 1 st 2n d 3 rd 4 th 1st 2 nd 3rd 4th 1s t 2 nd 3rd
Eff ic iency 1.15 1.14 1.17 1.15 1.17 1.20 1.18 1.10 1.12 1.09 1.09 1.11 1.10 1.15 1.15 1.17 1.17 1.21 1.21 1.06 1.33 1.25 1.03 1.19 1.32 1.55 1.26 1.19 1.05 1.05 1.18 1.24 1.22 1.23 1.24 1.27 1.36 1.36 1.35
1 Bed 1.01 0.98 1.01 0.99 1.00 1.02 1.00 1.01 1.00 1.04 1.04 1.02 1.02 1.04 1.04 1.04 1.05 1.09 1.07 1.06 1.05 1.06 1.04 1.00 1.09 1.10 1.11 1.11 1.13 1.10 1.21 1.16 1.19 1.14 1.15 1.14 1.18 1.20 1.23
2 Bed, 1 Bath 0.89 0.84 0.93 0.90 0.89 0.92 0.89 0.90 0.91 0.93 0.91 0.91 0.91 1.00 0.93 0.95 0.97 1.01 0.97 0.96 0.96 1.03 1.01 0.92 1.00 1.01 1.04 1.01 1.02 0.98 1.01 1.00 0.98 1.01 1.01 1.02 1.04 1.08 1.10
2 Bed, 2 Bath 0.95 0.96 0.93 0.93 0.94 0.96 0.97 0.95 0.94 0.96 0.96 0.94 0.94 0.96 0.95 0.94 0.94 0.99 0.98 0.97 0.96 0.96 0.93 0.89 0.99 0.97 0.99 0.99 1.00 1.02 1.05 1.01 1.08 1.03 1.03 1.02 1.04 1.09 1.11
3 Bed 0.91 0.90 0.88 0.91 0.93 0.96 0.93 0.91 0.92 0.91 0.94 0.93 0.93 1.00 0.95 0.96 0.97 1.06 1.05 1.03 0.99 1.01 0.92 0.90 0.97 0.99 1.02 1.02 1.04 1.03 1.06 1.01 1.03 1.00 1.02 1.02 1.06 1.09 1.17
All 0.96 0.94 0.96 0.95 0.95 0.98 0.97 0.96 0.96 0.99 0.98 0.97 0.97 1.01 0.99 0.99 1.00 1.04 1.02 1.01 1.00 1.02 1.00 0.94 1.04 1.04 1.06 1.05 1.06 1.05 1.11 1.08 1.11 1.07 1.09 1.08 1.11 1.14 1.17
Eff ic iency 1.11 1.10 1.08 1.12 1.15 1.21 1.14 1.14 1.14 1.12 1.15 1.10 1.21 1.24 1.24 1.18 1.13 1.11 1.18 1.13 1.15 1.16 1.12 1.06 1.15 1.20 1.19 1.14 1.19 1.18 1.24 1.26 1.31 1.29 1.35 1.37 1.39 1.44 1.50
1 Bed 0.97 0.98 0.98 0.98 1.00 0.99 1.01 0.99 1.00 1.00 1.02 0.99 0.98 1.01 1.02 1.01 1.01 1.02 1.03 1.03 1.04 1.01 1.02 1.00 1.04 1.05 1.07 1.07 1.06 1.06 1.07 1.09 1.11 1.13 1.14 1.13 1.15 1.19 1.22
2 Bed, 1 Bath 0.89 0.89 0.88 0.89 0.89 0.89 0.91 0.89 0.88 0.88 0.89 0.87 0.87 0.90 0.90 0.89 0.89 0.91 0.91 0.93 0.91 0.88 0.91 0.89 0.94 0.95 0.96 0.96 0.92 0.93 0.96 0.95 0.97 0.98 1.00 0.97 1.00 1.04 1.07
2 Bed, 2 Bath 0.89 0.91 0.90 0.91 0.92 0.91 0.93 0.91 0.92 0.92 0.93 0.92 0.90 0.95 0.90 0.92 0.92 0.92 0.94 0.95 0.94 0.92 0.95 0.93 0.92 0.95 0.98 0.98 0.97 0.98 0.98 0.99 1.00 1.05 1.06 1.04 1.05 1.08 1.11
3 Bed 0.89 0.93 0.91 0.92 0.91 0.90 0.93 0.93 0.93 0.91 0.89 0.91 0.90 1.01 0.94 0.94 0.94 0.94 0.97 0.96 0.95 0.96 0.94 0.95 0.98 0.99 1.00 1.03 1.00 1.03 1.03 0.99 1.00 1.05 1.05 1.05 1.04 1.08 1.10
All 0.93 0.95 0.94 0.94 0.96 0.95 0.97 0.95 0.95 0.96 0.97 0.95 0.94 0.98 0.97 0.96 0.97 0.97 0.99 0.99 0.98 0.96 0.98 0.96 0.99 1.01 1.03 1.03 1.01 1.02 1.03 1.04 1.05 1.08 1.10 1.08 1.10 1.13 1.17
Eff ic iency 1.48 1.51 1.55 1.53 2.17 1.48 1.44 1.49 1.38 1.89 1.77 1.66 1.74 1.57 1.37 1.41 1.24 1.64 1.67 1.61 1.50 1.40 1.44 1.50 1.54 1.58 1.52 1.53 1.56 1.66 1.72 1.66 1.70 1.81 1.64 1.90 1.81 1.87 1.56
1 Bed 1.17 1.19 1.17 1.21 1.16 1.17 1.17 1.17 1.17 1.20 1.20 1.18 1.18 1.18 1.18 1.21 1.22 1.23 1.25 1.23 1.22 1.21 1.24 1.20 1.20 1.25 1.24 1.24 1.26 1.27 1.29 1.32 1.34 1.36 1.44 1.38 1.42 1.48 1.48
2 Bed, 1 Bath 0.93 0.94 0.97 0.96 0.90 0.90 0.92 0.95 0.98 0.88 0.92 0.93 0.92 0.95 0.92 0.96 0.95 0.99 0.99 1.03 1.04 1.03 1.01 0.97 0.96 1.00 1.02 1.05 1.08 1.06 1.06 1.06 1.09 1.12 1.18 1.19 1.23 1.20 1.25
2 Bed, 2 Bath 0.99 1.08 1.09 1.08 1.04 1.04 1.03 1.09 1.02 1.06 1.14 1.10 1.11 1.08 1.03 1.06 1.03 1.04 1.05 1.04 0.99 1.00 1.02 0.99 1.00 1.09 1.08 1.11 1.11 1.09 1.12 1.11 1.15 1.16 1.17 1.17 1.24 1.31 1.32
3 Bed 0.90 0.99 0.96 0.95 0.94 0.98 0.96 0.91 0.89 0.87 0.84 0.97 0.94 1.01 0.97 1.04 1.02 1.00 1.01 1.03 0.97 1.01 1.02 1.03 1.03 1.07 1.07 1.00 1.07 1.06 1.07 1.08 1.12 1.17 1.20 1.16 1.24 1.25 1.26
All 1.07 1.11 1.10 1.12 1.16 1.08 1.08 1.09 1.08 1.08 1.12 1.11 1.11 1.10 1.08 1.12 1.10 1.13 1.15 1.14 1.12 1.12 1.13 1.10 1.10 1.16 1.16 1.16 1.18 1.18 1.19 1.21 1.24 1.26 1.31 1.28 1.33 1.37 1.38
Eff ic iency 1.18 1.12 1.14 1.13 1.10 1.17 1.17 1.23 1.24 1.30 1.37 1.32 1.33 1.23 1.24 1.30 1.30 1.30 1.32 1.30 1.29 1.32 1.34 1.45 1.31 1.32 1.35 1.35 1.41 1.40 1.45 1.44 1.46 1.57 1.58 1.57 1.64 1.69 1.67
1 Bed 1.00 1.01 1.03 1.03 1.05 1.02 1.05 1.07 1.05 1.08 1.15 1.09 1.08 1.10 1.12 1.12 1.13 1.18 1.16 1.15 1.16 1.13 1.13 1.13 1.13 1.15 1.16 1.16 1.17 1.17 1.20 1.22 1.25 1.29 1.30 1.24 1.27 1.28 1.34
2 Bed, 1 Bath 0.86 0.87 0.90 0.90 0.89 0.90 0.91 0.93 0.95 0.97 0.99 0.96 0.97 0.99 0.96 0.94 0.93 0.97 1.00 0.99 1.00 0.98 0.99 0.99 1.02 1.01 1.01 1.00 0.98 0.97 1.01 1.01 1.06 1.07 1.10 1.06 1.10 1.10 1.13
2 Bed, 2 Bath 0.90 0.91 0.92 0.94 0.96 0.96 0.98 0.95 0.93 0.94 0.97 0.96 0.96 1.00 1.04 1.02 1.01 1.04 1.03 1.05 1.06 1.02 0.99 1.06 1.02 1.04 1.03 1.05 1.05 1.06 1.07 1.09 1.16 1.19 1.18 1.15 1.19 1.21 1.25
3 Bed 0.93 0.92 0.90 0.89 0.95 0.91 0.93 0.95 0.99 0.92 0.93 0.95 0.96 0.95 0.97 1.00 1.08 1.06 1.05 1.05 1.08 1.05 1.01 1.00 0.93 0.96 0.94 0.95 0.93 0.94 1.02 1.00 1.05 1.06 1.12 1.25 1.06 1.11 1.11
All 0.96 0.97 0.99 0.99 1.00 1.00 1.02 1.03 1.03 1.04 1.10 1.06 1.06 1.07 1.09 1.09 1.08 1.12 1.12 1.11 1.12 1.10 1.10 1.12 1.10 1.12 1.11 1.12 1.12 1.13 1.16 1.17 1.21 1.25 1.26 1.22 1.24 1.26 1.30
Eff ic iency 1.33 1.28 1.34 1.34 1.47 1.35 1.35 1.01 1.09 1.05 1.35 1.34 1.35 1.13 1.32 1.35 1.23 1.23 1.25 1.35 1.35 1.35 1.04 1.52 1.09 1.43 1.29 1.29 1.32 1.42 1.35 1.35 1.44 1.45 1.43 1.61 1.63 1.64
1 Bed 1.10 1.12 1.15 1.12 1.14 1.10 1.12 1.13 1.10 1.08 1.09 1.08 1.06 1.11 1.09 1.16 1.13 1.15 1.16 1.10 1.08 1.08 1.12 1.09 1.14 1.14 1.18 1.19 1.19 1.16 1.19 1.16 1.19 1.20 1.19 1.25 1.25 1.29 1.32
2 Bed, 1 Bath 1.01 0.94 1.04 1.03 1.04 1.02 1.09 1.04 1.07 1.11 1.05 1.04 1.04 1.06 1.05 1.03 0.97 1.01 1.03 1.11 0.99 0.98 1.06 1.05 1.08 1.11 1.13 1.12 1.14 1.11 1.17 1.11 1.14 1.14 1.15 1.22 1.19 1.24 1.25
2 Bed, 2 Bath 1.02 1.00 1.05 1.03 1.08 1.01 1.05 1.05 1.02 1.05 1.02 1.01 1.00 1.01 1.00 1.02 1.01 1.03 1.02 1.00 1.00 0.98 1.04 1.00 1.05 1.05 1.07 1.05 1.07 1.07 1.11 1.11 1.10 1.13 1.13 1.16 1.16 1.24 1.20
3 Bed 0.96 1.05 1.09 1.04 1.08 1.02 1.08 1.03 1.02 1.05 1.01 0.95 0.99 1.02 1.02 1.02 1.01 1.02 1.06 1.01 0.98 1.00 1.06 1.03 1.07 1.12 1.13 1.11 1.10 1.14 1.16 1.07 1.13 1.20 1.15 1.20 1.18 1.25 1.21
All 1.05 1.04 1.10 1.08 1.10 1.05 1.09 1.08 1.06 1.07 1.05 1.04 1.03 1.06 1.05 1.08 1.06 1.08 1.09 1.06 1.04 1.03 1.08 1.05 1.10 1.11 1.13 1.12 1.14 1.12 1.16 1.13 1.15 1.17 1.16 1.21 1.20 1.27 1.26
Eff ic iency 1.02 1.13 1.11 1.09 1.10 1.08 1.08 1.11 1.17 1.18 1.20 1.04 1.03 1.03 1.09 1.12 1.07 1.19 1.24 1.21 1.17 1.17 1.16 1.20 1.12 1.11 1.11 1.10 1.13 1.17 1.23 1.22 1.26 1.36 1.28 1.47 1.36 1.38 1.42
1 Bed 1.00 1.03 1.02 1.03 1.03 1.05 1.06 1.05 1.03 1.06 1.06 1.07 1.03 1.03 1.04 1.07 1.04 1.07 1.08 1.05 1.05 1.05 1.05 1.05 1.05 1.06 1.08 1.08 1.08 1.10 1.13 1.12 1.15 1.18 1.22 1.21 1.25 1.27 1.32 2 Bed, 1 Bath 0.88 0.86 0.86 0.88 0.87 0.87 0.85 0.86 0.87 0.89 0.89 0.88 0.85 0.86 0.87 0.91 0.88 0.90 0.92 0.90 0.91 0.91 0.91 1.06 0.90 0.93 0.92 0.93 0.93 0.92 0.95 0.95 0.97 0.99 1.01 1.00 1.02 1.05 1.09
2 Bed, 2 Bath 0.90 0.92 0.93 0.94 0.95 0.94 0.95 0.95 0.92 0.94 0.95 0.95 0.92 0.91 0.92 0.91 0.93 0.96 0.97 0.95 0.93 0.93 0.94 0.95 0.95 0.95 0.97 0.94 0.96 0.98 1.00 0.98 1.01 1.03 1.07 1.09 1.09 1.15 1.18
3 Bed 0.89 0.88 0.88 0.88 0.90 0.90 0.89 0.92 0.92 0.91 0.92 0.94 0.90 0.89 0.87 0.87 0.89 0.92 0.95 0.91 0.92 0.93 0.93 0.93 0.92 0.94 0.95 0.96 0.97 0.98 1.01 1.00 1.00 1.02 1.03 1.04 1.05 1.07 1.14
All 0.97 0.95 0.95 0.96 0.96 0.97 0.97 0.97 0.96 0.98 0.98 0.99 0.95 0.95 0.96 0.97 0.96 1.00 1.01 0.99 0.99 0.98 0.99 1.02 0.98 1.00 1.01 1.00 1.01 1.02 1.05 1.04 1.06 1.09 1.12 1.12 1.14 1.18 1.22
Eff ic iency 1.18 1.15 1.15 1.16 1.35 1.20 1.18 1.22 1.22 1.27 1.32 1.28 1.29 1.24 1.25 1.28 1.25 1.28 1.31 1.28 1.28 1.29 1.29 1.37 1.29 1.31 1.33 1.32 1.34 1.35 1.41 1.41 1.44 1.52 1.52 1.54 1.56 1.61 1.61
1 Bed 1.01 1.02 1.03 1.03 1.04 1.03 1.04 1.05 1.04 1.05 1.08 1.05 1.04 1.06 1.07 1.08 1.07 1.10 1.10 1.09 1.09 1.07 1.08 1.06 1.09 1.11 1.12 1.12 1.12 1.12 1.15 1.16 1.18 1.20 1.22 1.19 1.22 1.25 1.29
2 Bed, 1 Bath 0.89 0.88 0.90 0.90 0.90 0.90 0.91 0.91 0.92 0.92 0.93 0.92 0.92 0.95 0.93 0.93 0.92 0.95 0.96 0.96 0.96 0.95 0.96 0.96 0.97 0.99 0.99 0.99 0.98 0.97 1.00 0.99 1.01 1.03 1.05 1.04 1.06 1.09 1.12
2 Bed, 2 Bath 0.92 0.94 0.94 0.95 0.96 0.95 0.97 0.96 0.94 0.95 0.97 0.96 0.94 0.97 0.96 0.96 0.96 0.98 0.99 0.98 0.97 0.96 0.97 0.96 0.97 0.99 1.01 1.00 1.01 1.02 1.03 1.03 1.06 1.09 1.10 1.09 1.10 1.15 1.17
3 Bed 0.91 0.93 0.92 0.92 0.93 0.94 0.94 0.94 0.94 0.92 0.92 0.93 0.93 0.97 0.95 0.95 0.97 0.99 1.01 0.99 0.97 0.98 0.96 0.95 0.97 1.00 1.01 1.01 1.01 1.02 1.05 1.01 1.03 1.06 1.07 1.09 1.08 1.11 1.14
All 0.97 0.97 0.98 0.98 1.00 0.99 1.00 1.00 0.99 1.00 1.02 1.01 1.00 1.02 1.01 1.02 1.02 1.04 1.05 1.04 1.03 1.02 1.03 1.02 1.04 1.06 1.07 1.07 1.07 1.07 1.09 1.09 1.12 1.14 1.16 1.14 1.16 1.20 1.23
2013
(In Dollars)
Average Ren t per Squar e Foot by Ap art ment Type by Cou nty
2011
Average rent minus rental losses equals effective rent.
Average rents do not reflect "rental losses" from discounts/concessions, models, delinquents, and bad debts.
Rents are based on the units being unfurnished with tenants paying electricity and gas.
A d a m s
A r a p a h o e
D e n v e r
B o u l d e r /
B r o o m f i e l d
M e t r o A v e r a g e
D o u g l a s
J e f f e r s o n
20092008 2010 2012200720062004 2005

8/13/2019 4Q Vacancy Survey
http://slidepdf.com/reader/full/4q-vacancy-survey 17/27
II-20
County 1st 2 nd 3rd 4th 1st 2 nd 3rd 4th 1st 2 nd 3rd 4th 1st 2 nd 3rd 4th 1st 2 nd 3rd 4th 1st 2 nd 3rd 4th 1st 2 nd 3 rd 4th 1st 2 nd 3rd 4th 1st 2 nd 3rd 4th 1st 2 nd 3rd
Adams 499 below 1.07 1.09 1.25 1.23 1.31 1.27 1.22 1.27 1.22 1.13 1.05 1.09 1.09 1.47 1.47 1.28 1.32 1.31 1.30 1.28 1.37 1.28 1.30 1.33 1.25 1.49 1.36 1.23 1.24 1.23 1.28 1.38 1.29 1.35 1.33 1.38 1.46 1.33 1.35 1
500 to 749 0.99 0.96 1.00 0.99 0.99 1.00 0.96 0.96 0.96 1.00 1.02 1.00 1.01 1.04 1.02 1.03 1.05 1.09 1.07 1.07 1.07 1.07 1.06 1.04 1.11 1.12 1.13 1.12 1.15 1.09 1.24 1.18 1.21 1.15 1.15 1.13 1.18 1.21 1.24 1
750 to 999 0.94 0.91 0.93 0.92 0.92 0.96 0.96 0.98 0.95 0.98 0.96 0.95 0.95 0.98 0.96 0.98 0.98 1.02 1.00 0.99 0.96 1.00 0.98 0.91 1.01 1.01 1.03 1.02 1.03 1.02 1.07 1.02 1.07 1.04 1.05 1.05 1.07 1.10 1.12 1
1000 above 0.95 0.95 0.93 0.95 0.95 0.98 0.97 0.95 0.96 0.96 0.96 0.95 0.96 0.99 0.97 0.96 0.95 1.03 1.01 1.00 0.98 0.98 0.94 0.88 0.98 0.99 1.01 1.00 1.00 1.02 1.02 1.02 1.03 1.02 1.04 1.03 1.06 1.10 1.14 1
Arapahoe 499 below 1.01 1.06 1.08 1.10 0.97 1.05 0.97 1.02 1.01 1.01 1.07 1.03 1.10 1.16 1.14 1.11 1.02 1.09 1.13 1.16 1.17 1.15 1.16 1.10 1.45 1.48 1.41 1.18 1.18 1.20 1.20 1.23 1.25 1.26 1.31 1.31 1.35 1.39 1.42 1
500 to 749 0.94 0.96 0.94 0.94 0.98 0.97 0.98 0.96 0.96 0.96 0.97 0.95 0.94 0.98 1.00 1.00 1.01 1.02 1.02 1.00 1.02 0.99 0.99 0.98 1.03 1.04 1.05 1.04 1.05 1.03 1.05 1.06 1.08 1.10 1.11 1.10 1.13 1.15 1.20 1
750 to 999 0.94 0.94 0.94 0.94 0.95 0.93 0.96 0.95 0.96 0.96 0.97 0.95 0.94 0.95 0.95 0.94 0.95 0.96 0.97 0.99 0.98 0.95 0.98 0.96 0.97 0.98 1.01 1.02 1.00 1.01 1.02 1.03 1.05 1.06 1.08 1.07 1.08 1.13 1.15 1
1000 above 0.91 0.93 0.93 0.93 0.94 0.93 0.95 0.93 0.93 0.94 0.94 0.94 0.91 1.01 0.93 0.93 0.94 0.93 0.96 0.96 0.94 0.94 0.96 0.94 0.93 0.96 1.00 1.01 0.99 1.00 1.00 1.01 1.02 1.07 1.09 1.06 1.07 1.10 1.13 1
499 below 1.37 1.37 1.35 1.38 1.85 1.36 1.33 1.37 1.34 1.40 1.34 1.38 1.40 1.36 1.43 1.39 1.34 1.39 1.39 1.43 1.40 1.61 1.42 1.39 1.42 1.43 1.44 1.60 1.47 1.54 1.56 1.63 1.62 1.74 1.81 1.70 1.68 1.73 1.64 1
500 to 749 1.17 1.14 1.12 1.17 1.16 1.17 1.14 1.13 1.11 1.17 1.18 1.19 1.21 1.17 1.19 1.22 1.24 1.30 1.31 1.29 1.30 1.31 1.31 1.27 1.25 1.25 1.26 1.28 1.33 1.32 1.36 1.38 1.41 1.43 1.47 1.48 1.51 1.54 1.53 1
750 to 999 1.01 1.05 1.06 1.08 0.98 1.00 1.01 1.05 1.05 1.03 1.06 1.03 1.02 1.05 1.01 1.04 1.03 1.04 1.09 1.08 1.06 1.07 1.07 1.05 1.06 1.11 1.12 1.12 1.14 1.14 1.14 1.16 1.18 1.21 1.28 1.25 1.29 1.33 1.37 1
1000 above 0.99 1.08 1.06 1.06 1.01 1.03 1.05 1.06 1.01 1.00 1.08 1.05 1.06 1.04 0.99 1.04 0.99 1.02 1.02 1.01 0.96 0.98 1.00 0.97 0.98 1.09 1.06 1.06 1.07 1.08 1.10 1.10 1.14 1.14 1.16 1.14 1.22 1.27 1.26 1
Denver 499 below 1.14 1.13 1.16 1.13 1.13 1.08 1.10 1.16 1.19 1.25 1.35 1.31 1.34 1.18 1.22 1.32 1.30 1.31 1.32 1.34 1.33 1.37 1.39 1.56 1.39 1.38 1.41 1.40 1.40 1.43 1.48 1.51 1.53 1.56 1.60 1.56 1.64 1.71 1.70 1
500 to 749 1.01 1.01 1.04 1.02 1.02 1.02 1.03 1.06 1.05 1.08 1.10 1.08 1.08 1.10 1.12 1.11 1.12 1.14 1.13 1.11 1.12 1.09 1.11 1.13 1.13 1.13 1.13 1.12 1.15 1.15 1.18 1.20 1.22 1.26 1.28 1.22 1.25 1.26 1.30 1
750 to 999 0.89 0.90 0.93 0.95 0.96 0.96 0.99 0.98 0.97 0.98 1.11 1.02 1.02 1.04 1.08 1.04 1.04 1.11 1.10 1.09 1.11 1.08 1.07 1.09 1.06 1.11 1.11 1.12 1.11 1.10 1.13 1.13 1.18 1.23 1.22 1.17 1.20 1.23 1.28 1
1000 above 0.90 0.93 0.93 0.96 0.97 0.98 0.99 1.00 0.98 0.97 1.01 0.99 0.99 1.01 1.02 1.02 1.02 1.06 1.06 1.08 1.09 1.05 1.02 1.04 1.01 1.04 1.02 1.03 1.03 1.05 1.10 1.08 1.15 1.18 1.21 1.20 1.17 1.20 1.23 1
Douglas 499 below
500 to 749 0.86 0.94 0.98 0.92 0.98 0.94 1.13 1.01 0.99 1.08 1.01 1.00 0.97 1.00 1.01 1.06 1.01 1.02 1.07 1.06 1.03 1.05 1.08 1.00 1.19 1.05 1.16 1.20 1.21 1.21 1.23 1.18 1.20 1.20 1.18 1.19 1.24 1.39 1.37 1
750 to 999 1.11 1.09 1.16 1.13 1.14 1.09 1.12 1.12 1.10 1.09 1.08 1.08 1.06 1.11 1.09 1.15 1.12 1.14 1.15 1.11 1.07 1.05 1.11 1.08 1.12 1.14 1.16 1.16 1.17 1.14 1.18 1.14 1.18 1.18 1.18 1.25 1.24 1.28 1.30 1
1000 above 1.01 1.02 1.06 1.04 1.08 1.02 1.06 1.05 1.03 1.06 1.02 1.00 1.00 1.02 1.01 1.01 1.01 1.03 1.03 1.00 1.00 1.00 1.05 1.01 1.06 1.08 1.10 1.08 1.09 1.09 1.12 1.12 1.11 1.15 1.14 1.17 1.16 1.24 1.21 1
Jef ferson 499 below 2.56 1.09 1.09 1.07 1.08 1.05 1.04 1.07 1.13 1.10 1.11 0.99 0.99 0.98 0.99 1.08 0.99 1.37 1.41 1.40 1.41 1.39 1.36 1.40 1.24 1.21 1.07 1.08 1.16 1.18 1.24 1.19 1.17 1.51 1.21 1.52 1.32 1.35 1.41 1
500 to 749 0.99 1.02 1.02 1.02 1.02 1.04 1.05 1.03 1.03 1.06 1.05 1.05 1.02 1.02 1.02 1.06 1.02 1.04 1.05 1.02 1.03 1.03 1.03 1.02 1.03 1.04 1.05 1.06 1.07 1.08 1.11 1.11 1.13 1.16 1.21 1.18 1.21 1.24 1.29 1
750 to 999 0.92 0.92 0.91 0.94 0.93 0.95 0.94 0.95 0.94 0.94 0.95 0.95 0.91 0.93 0.94 0.96 0.95 0.97 1.00 0.96 0.96 0.97 0.98 1.05 0.97 0.99 1.01 0.99 1.00 1.00 1.03 1.03 1.05 1.08 1.11 1.10 1.13 1.15 1.21 1
1000 above 0.89 0.91 0.89 0.90 0.91 0.91 0.91 0.92 0.89 0.91 0.94 0.96 0.91 0.90 0.90 0.89 0.91 0.96 0.97 0.94 0.93 0.91 0.93 0.94 0.93 0.94 0.96 0.94 0.95 0.97 0.99 0.97 0.99 1.01 1.04 1.07 1.07 1.14 1.14 1
499 below 1.31 1.16 1.18 1.16 1.32 1.11 1.11 1.15 1.17 1.20 1.25 1.23 1.26 1.22 1.25 1.28 1.23 1.30 1.30 1.33 1.32 1.32 1.35 1.42 1.40 1.41 1.40 1.36 1.34 1.38 1.41 1.46 1.47 1.52 1.55 1.53 1.55 1.60 1.59 1
500 to 749 0.99 0.99 1.00 1.00 1.01 1.01 1.02 1.02 1.01 1.03 1.05 1.03 1.02 1.05 1.06 1.07 1.07 1.09 1.08 1.07 1.08 1.06 1.07 1.06 1.09 1.09 1.10 1.10 1.11 1.10 1.14 1.14 1.17 1.18 1.20 1.17 1.20 1.22 1.27 1
750 to 999 0.95 0.95 0.96 0.96 0.97 0.97 0.98 0.99 0.98 0.98 1.01 0.98 0.97 0.99 0.99 1.00 1.00 1.03 1.03 1.02 1.01 1.00 1.02 1.01 1.02 1.04 1.06 1.06 1.06 1.05 1.08 1.07 1.10 1.12 1.13 1.12 1.14 1.18 1.22 1
1000 above 0.93 0.95 0.95 0.96 0.97 0.97 0.98 0.98 0.96 0.96 0.98 0.98 0.96 1.00 0.97 0.97 0.97 1.00 1.00 1.00 0.98 0.97 0.98 0.96 0.97 1.01 1.01 1.01 1.01 1.03 1.04 1.04 1.07 1.10 1.11 1.11 1.11 1.16 1.18 1
2013 Apartment
Size (Sq. Ft)
20122006 2008
(In Dollars)
Average Ren t Per Squar e Foot b y Apart ment Uni t Size by Cou nty
20092004 2005 2007 2010
Rents are based on units being unfurnished with tenants paying gas and electricity.
Average rents do not reflect "rental losses" due to concessions, discounts, model, delinquents and bad debts.
2011
Boulder/
Broomfield
Metro
Average

8/13/2019 4Q Vacancy Survey
http://slidepdf.com/reader/full/4q-vacancy-survey 18/27
II-21
B uil din g Typ e 1 st 2 nd 3 rd 4 th 1 st 2 nd 3 rd 4 th 1 st 2 nd 3 rd 4 th 1 st 2 nd 3 rd 4 th 1 st 2 nd 3 rd 4 th 1 st 2 nd 3 rd 4 th 1 st 2 nd 3 rd 4 th 1 st 2 nd 3 rd 4 th 1 st 2 nd 3 rd 4 th 1 st 2 nd 3 rd 4 th
Size
U p t o 8 1 .4 2 .3 2 .8 - 1. 5 6 .5 2 .4 3 .5 4 .3 2 .6 1 .2 4 .1 0 .3 6 .6 22 .2 1 .2 1 5.3 1 3. 9 1 6. 6 3 .9 7 .1 26 .9 8 .0 24 .2 6 .4 3 .4 9 .9 4 .7 2 .1 3 .8 5 .2 4 .2 5 .2 4 .6 0 .1 5 .5 2 .4 2 .4 2 .7 6 .4 - 2. 1
9 - 50 5.3 -0.1 3.7 3.5 2.3 2.8 1.3 -7.1 6.8 3.3 5.2 2.1 3.5 13.8 4.9 11.6 8.2 12.1 1.7 4.3 3.6 10.7 13.7 26.5 -8.5 4.8 7.3 3.8 5.0 4.2 8.1 8.9 3.9 4.2 6.0 3.2 4.9 4.2 4 .9 4.4
51 - 99 4.5 4.7 8.8 6.8 5.4 3.6 4.7 7.3 7.4 11.0 13.2 5.7 4.8 6.8 7.9 5.0 5.9 11.2 5.6 6.8 5.3 5.0 13.3 12.2 4.9 4.9 5.7 6.5 4.7 5.9 7.3 8.2 5.2 3.2 1.1 6.5 3.5 2.4 10 .2 3.4
100 - 199 5 .6 9 .1 11 .0 11. 1 10. 0 9 .6 11. 1 13. 6 13 .4 14 .0 14 .7 13 .9 11. 1 11. 5 13. 5 8 .5 8 .2 8 .7 13. 0 7 .4 3 .6 5 .9 7 .3 5 .1 5 .4 6 .7 10 .4 10 .4 10 .8 13 .0 8 .0 10 .3 7 .8 7 .7 5 .5 - 3. 1 10. 5 4 .3 4 .2 5 .6
200 t o 349 14. 5 17 .2 17. 2 16. 7 15 .1 18. 5 19. 7 18 .2 19. 0 20 .1 17. 0 16 .2 14 .1 13. 7 14 .3 11. 0 11 .8 14. 3 12. 9 10 .0 10. 3 9 .1 8 .7 6 .9 11. 3 9 .9 14. 4 10 .5 10. 3 10 .9 9 .0 9 .0 8 .4 9 .8 8 .9 7 .7 8 .2 9 .2 11 .6 6 .1
350 up 23. 9 19. 5 18. 7 16. 9 19. 9 17. 3 20. 3 20. 5 17. 9 18. 6 17 .9 17. 7 18 .4 11. 3 9 .7 10. 9 11 .0 10. 4 13. 3 9 .1 6 .6 7 .0 13. 4 9 .0 11. 5 11 .2 15. 5 9 .8 8 .7 12 .6 12. 9 8 .4 10. 8 11. 0 11. 9 9 .7 5 .6 10. 5 7 .0 10. 9
Age
To 1959 3.6 - 9.1 2.9 5.2 2.4 2.0 5.5 10.2 9.5 6.8 6.7 7.2 6.5 9.2 6.6 5.8 8.4 1.4 2.8 5.2 2.9 3.1 8.5 4.9 4.4 4.2 4.6 3.8 5.0 2.7 5.7 11.9 4.2 4.8 5.9 4.6 6.2 4.5 4 .7 5.3
1 96 0- 69 6 .8 2 .7 2 .6 0 .2 2 .8 6 .5 5 .8 5 .8 9 .4 14 .2 1 0. 9 6 .0 1 .9 15 .3 1 0. 6 1 2.8 1 5. 5 1 5. 5 6 .6 8 .2 5 .4 1 0.5 10 .4 8 .6 16 .9 4 .2 9 .6 7 .7 9 .6 6 .5 9 .4 7 .9 5 .7 6 .6 5 .6 3 .0 4 .6 6 .5 5 .6 5 .6
1970-79 5 .1 1 .7 12. 3 7 .9 9 .4 5 .6 12. 5 11 .4 12. 5 16 .5 13 .6 12 .0 10. 6 10 .8 12 .1 7 .8 10 .0 10 .9 12. 4 10. 7 6 .5 8 .4 5 .7 7 .5 4 .5 9 .3 14. 8 11. 1 8 .3 9 .2 10. 4 8 .3 5 .6 10. 7 9 .4 9 .1 11 .2 5 .9 17 .7 6 .9
1980-89 13. 4 9 .1 10. 3 12 .4 8 .7 15. 1 18 .7 14. 3 12 .6 16. 2 16. 9 16. 4 13. 6 12 .2 12 .2 10 .8 10 .8 12 .2 14. 3 9 .1 7 .9 6 .7 9 .7 6 .9 6 .7 9 .6 13. 2 9 .8 7 .9 13. 7 11 .7 8 .5 12 .2 9 .1 7 .8 9 .8 6 .4 7 .7 7 .7 6 .1
1990-99 17. 4 19 .0 18. 7 16 .3 13. 8 18 .6 20. 0 17 .1 18. 9 17 .7 17 .3 15 .4 18. 2 11 .1 12 .0 12 .0 9 .7 7 .7 11. 5 11. 2 3 .5 6 .2 8 .0 3 .3 7 .3 7 .7 12. 3 8 .6 7 .5 11. 1 9 .2 8 .1 8 .4 9 .7 10. 5 7 .2 7 .1 8 .1 7 .3 7 .0
2000-04 16. 0 18 .1 18. 6 16. 4 19 .0 23. 8 21. 2 24 .5 22. 7 20 .7 19. 2 19 .2 18 .5 13. 3 12 .0 11. 4 10 .5 12. 6 8 .7 8 .3 7 .6 8 .8 16. 7 10 .5 13. 6 11 .7 14. 6 11 .1 11. 1 11 .9 11. 5 10. 1 10 .8 9 .7 11. 7 6 .9 5 .5 12. 2 6 .0 14. 1
2005 up 16.0 18.0 1 0.7 21.0 16.9 -5.4 23.0 17.6 7 .3 4 .2 34.1 32.9 8 .1 18.6 12.2 18.0 17.5 22.7 15.5 22.0 11.2 18.9 1 8.6 9.4 8.9 9 .0 13.1 8.4 2.8 5 .8 10.5 7 .9 3.2
County
Adams 14.5 18.4 17.3 15.5 13.6 17.6 15.5 15.5 16.7 18.1 18.1 14.7 14.7 16.2 12.6 12.6 12.0 12.5 11.8 11.1 7.1 11.8 10.4 8.3 12.4 11.9 14.6 10.4 10.6 13.8 14.5 10.4 14.2 10.8 8.1 5.5 5.7 7.9 7.2 14.4
Arapahoe 17.2 14.2 17.3 13.4 15.3 16.7 17.9 14.5 14.6 16.1 15.8 17.1 12.1 13.3 13.3 10.7 12.0 15.4 12.5 10.8 9.5 7.4 10.8 9.9 11.6 11.4 17.1 12.4 8.9 11.7 10.4 8.8 8.7 11.0 11.4 8.3 8.2 10.2 8.0 4.8
Bou lder /B room fi el d 12. 1 19. 4 19. 2 17. 4 25. 1 11. 9 17. 8 19. 8 18. 2 22. 6 19 .5 17. 3 17 .6 12 .3 10. 5 9 .5 8 .7 7 .0 7 .7 5 .5 4 .0 7 .2 8 .3 5 .3 3 .9 7 .5 7 .2 5 .6 13. 7 12. 3 5 .3 8 .0 6 .4 6 .1 6 .3 2 .5 8 .3 7 .9 7 .6 6 .2
D enver 15. 1 15. 1 15. 7 15. 8 12. 3 13. 3 17. 9 15. 0 16. 5 18. 8 16. 8 14 .6 13. 6 10. 8 10. 6 7 .9 11. 6 9 .8 15 .4 7 .4 10 .2 8 .9 13 .8 9 .2 7 .7 9 .7 13 .3 10. 4 10. 6 12. 3 10. 3 9 .2 7 .7 8 .3 7 .8 9 .5 7 .2 6 .1 10. 9 6 .9
D ougl as 26. 6 28. 2 22. 5 23. 3 20. 6 25. 8 22. 6 26. 7 22. 8 26. 1 17 .4 19. 0 18 .9 16 .7 13. 9 11 .1 8 .4 9 .9 16 .4 11. 2 8 .7 7 .8 12 .3 9 .0 11 .5 5 .3 13 .4 6 .5 9 .3 9 .1 11 .7 9 .2 8 .6 13 .5 15 .7 9 .5 7 .1 14 .6 7 .2 13. 3
J ef fe rso n 7 .4 5 .7 7 .7 9 .9 8 .9 1 0. 6 1 1. 8 14 .7 1 2. 4 9 .4 12 .9 10 .5 14 .6 7 .8 10 .7 11 .6 8 .3 11 .2 7 .8 6 .8 3 .5 4 .6 8 .1 8 .1 8 .3 6 .4 8 .9 6 .4 5 .6 7 .7 7 .8 6 .7 8 .6 7 .6 8 .7 4 .8 4 .9 7 .4 10 .4 7 .5
Average 15.2 15.5 16.1 15.1 15.0 15.4 17.3 16.7 16.4 17.1 16.3 15.3 14.3 12.3 12.0 10.5 10.7 12.1 12.3 9.1 7.8 7.9 10.8 8.7 9.7 9.6 13.6 9.8 9.5 11.4 10.4 8.8 9.1 9.7 9.6 7.4 7.2 8.9 8.8 7.7
2013
Average Rent Minus Rental Losses Equals Effective Rent
(In Percent)
Discounts/Concessions, Models, Delinquents, and Bad Debts
Rental Losses from
2006 201120052004 20092008 201220102007

8/13/2019 4Q Vacancy Survey
http://slidepdf.com/reader/full/4q-vacancy-survey 19/27
II-22
Building
Type 1st 2nd 3rd 4th 1st 2nd 3rd 4th 1st 2nd 3rd 4th 1st 2nd 3r d 4 th 1st 2nd 3rd 4th 1st 2nd 3rd 4th 1st 2nd 3rd 4th 1st 2nd 3rd 4th 1st 2nd 3rd 4th 1st 2nd 3rd 4th
Size (in units)
Up t o 6 9 .8 12 .2 11 .4 11 .0 17 .5 12 .8 10 .0 11 .9 8 .1 9 .5 9 .8 4 .0 11 .0 29 .5 5 .7 21 .3 18 .7 21 .4 9 .8 14 .3 33 .2 12 .9 31 .3 11 .3 8 .0 14. 1 8 .4 5 .1 6 .6 9 .7 8 .0 6 .7 6 .7 3 .8 8 .8 5 .0 5 .5 4 .7 8 .6 1 .6
9 - 50 14. 9 10 .0 12. 8 14 .1 12. 9 12 .9 11. 6 3 .0 14. 1 10 .5 11. 5 9 .7 10. 6 20 .7 11. 8 17 .0 13. 3 17 .6 7 .8 11. 7 10 .3 20. 1 20 .7 35. 7 -1. 9 11 .9 12. 8 8 .3 8 .7 7 .9 11. 4 12 .1 6 .4 7 .6 8 .3 6 .6 7 .8 7 .3 7 .9 7 .8
51 - 99 15.6 15.9 15.5 16.0 15.2 11.5 13.3 15.5 14.3 18.6 20.8 14.4 11.2 13.0 13.3 9.8 12.8 16.6 11.9 13.3 11.7 13.3 20.3 21.5 12.8 12.4 11.6 12.0 9.2 10.9 11.0 11.6 8.4 7.9 4.9 9.8 6.2 7.4 14.4 7.2
100 - 199 15.4 18.8 18.4 19.8 18.2 17.7 18.2 19.7 20.5 20.8 21.6 20.9 18.9 17.4 18.8 13.8 13.1 14.0 18.2 14.5 11.4 13.1 14.6 12.4 12.7 13.6 16.0 15.9 15.9 17.5 12.9 15.1 11.7 12.0 9.3 0.7 14.2 8.1 8.0 9.7
200 to 349 24.9 26.4 25.7 27.2 24.5 26.3 26.7 25.9 26.4 26.5 23.3 23.1 21.2 20.0 19.6 17.0 17.7 20.5 19.8 18.4 19.4 17.5 16.5 13.9 17.2 15.4 19.0 15.7 15.6 15.2 13.4 13.8 13.0 14.3 12.9 13.3 13.2 13.3 15.9 11.7
350 up 35.1 29.5 27.9 26.9 29.3 25.3 28.7 29.0 25.5 26.0 25.1 24.5 25.3 17.3 14.9 17.5 17.3 17.0 19.8 17.0 14.9 17.3 20.5 17.2 18.2 17.4 21.3 15.8 14.9 18.2 18.5 14.9 16.7 16.3 16.8 14.6 10.4 14.9 12.0 16.2
Age (year built)
To 1959 11. 9 1 .5 11. 4 13 .4 10. 2 8 .8 13. 3 18 .5 17. 7 14 .0 14. 5 11. 7 12 .8 15. 3 12 .8 11. 4 13 .0 7 .2 8 .5 12. 5 11 .3 10. 9 14 .8 11. 1 10 .2 10. 4 9 .2 7 .2 8 .7 5 .9 8 .2 14. 1 6 .4 8 .5 8 .3 7 .1 8 .5 8 .3 8 .6 8 .7
1960-69 17.1 12.9 13.4 11.3 11.5 15.4 16.3 14.1 16.0 22.2 21.0 12.5 8.1 20.9 16.2 17.9 21.5 21.0 11.7 14.8 12.2 18.2 18.7 17.1 23.9 10.4 15.3 12.6 14.8 11.4 13.3 11.9 8.7 10.6 8.6 6.3 8.6 10.4 9.5 9.9
1970-79 12.4 12.6 19.5 17.4 18.6 15.9 22.8 21.0 21.1 25.0 21.7 19.3 18.1 17.4 17.9 14.6 15.8 16.8 19.3 18.8 15.0 19.6 14.7 16.9 12.4 16.9 20.1 16.9 14.1 14.1 15.9 14.3 10.9 16.3 13.8 13.8 15.3 10.3 21.9 11.5
1980-89 25.8 21.2 20.4 24.3 19.2 22.0 25.2 21.0 18.8 22.5 22.7 23.2 20.9 18.3 17.1 16.7 16.3 18.2 20.6 16.2 15.0 14.1 15.6 13.2 12.6 14.6 17.6 14.5 12.4 18.2 16.4 14.3 17.6 14.0 12.5 14.9 10.0 11.7 12.0 11.0
1990-99 25.2 25.9 25.6 25.1 21.4 26.0 25.9 24.2 25.5 23.3 22.2 22.0 24.4 16.7 17.3 18.0 15.7 13.9 17.1 18.8 10.8 12.4 13.9 9.8 11.9 12.3 16.3 13.2 12.1 15.6 13.9 13.2 13.3 14.3 14.6 12.1 11.3 12.1 12.4 12.0
2000-04 24.6 25.7 26.0 25.2 27.4 30.9 28.0 31.8 30.3 27.4 25.0 26.3 25.3 19.4 16.9 17.4 16.3 19.0 14.9 15.4 15.8 16.3 22.1 16.3 18.5 16.8 18.7 15.7 16.1 15.8 15.4 15.0 15.2 13.8 15.7 11.5 10.3 15.9 9.5 18.7
200 5 u p 40. 8 3 2.1 28 .4 43. 7 3 0.8 15 .7 37. 4 2 8.4 14 .5 27. 0 4 6.8 50 .2 27 .2 4 4.5 3 8.2 38 .0 3 4.6 3 6. 2 26 .5 3 5.1 2 3.9 3 1.4 2 7.5 1 7.4 1 6. 7 14 .9 1 8.1 1 3.6 1 0. 7 15 .9 1 6.1 14.3 1 2.7
County
Adams 24.1 28.3 24.9 27.2 24.2 26.4 23.2 23.6 23.6 24.3 24.5 22.0 22.5 22.6 18.5 20.0 18.5 19.3 19.3 19.9 15.5 20.3 17.1 14.6 19.2 17.1 19.1 16.2 16.1 19.0 19.9 15.6 18.7 15.7 12.3 10.0 10.8 11.7 12.9 19.7
Arapahoe 28.0 24.0 26.5 23.5 24.2 24.1 24.7 21.9 21.6 23.0 22.6 24.5 19.9 19.5 18.3 16.7 18.4 21.3 19.5 19.1 19.2 18.1 19.3 18.5 18.8 17.8 23.8 19.0 15.3 17.2 16.0 15.6 15.0 16.6 16.2 13.3 12.4 14.7 12.7 9.9
Boulder/Broomfield 23.1 28.9 25.2 26.4 36.2 20.6 25.5 27.0 25.1 29.7 24.3 22.8 22.3 16.4 14.1 14.9 14.3 13.4 12.4 11.6 10.0 14.4 13.8 11.1 8.9 12.4 10.7 9.2 18.6 16.9 10.0 12.4 10.3 9.8 9.3 6.2 11.5 11.7 10.4 9.6Denver 25.2 25.3 24.0 25.6 21.5 22.1 27.5 23.7 24.3 26.4 24.1 21.5 20.8 16.9 16.3 13.4 16.7 15.5 21.4 15.4 18.7 18.7 22.2 18.0 14.6 17.1 18.6 15.6 15.5 16.5 14.6 14.0 11.9 13.1 12.1 15.6 12.6 10.7 15.5 13.0
Douglas 41.1 38.0 31.7 33.4 29.0 32.2 30.1 34.8 31.0 31.8 23.8 26.0 25.3 22.6 19.4 18.1 14.5 18.2 22.3 18.6 15.8 13.6 16.6 14.4 16.0 9.2 17.8 11.7 14.7 12.8 15.5 13.8 13.5 17.4 19.9 13.7 13.6 17.5 10.7 18.3
Jefferson 16.5 14.8 16.2 19.2 17.4 18.6 18.6 22.3 19.9 16.7 20.2 17.1 20.9 15.2 16.1 17.6 13.9 17.2 14.3 14.1 11.1 11.8 14.4 15.4 14.1 11.9 12.8 10.9 10.3 12.3 12.2 11.0 12.4 11.5 12.4 9.0 8.6 11.1 14.0 12.1
Average 25.7 25.2 24.5 25.1 24.3 23.5 24.9 24.6 23.7 24.1 23.1 22.3 21.4 18.5 17.3 16.6 16.6 18.3 18.8 17.0 16.3 16.9 18.2 16.4 16.2 15.7 18.9 15.4 15.0 16.2 15.3 14.3 14.0 14.5 13.8 12.3 11.8 13.0 13.2 12.9
2010 2012
Economic Vacancy Rates by Size, Age and County
2005 2006
as a Percentage of Gross Potential Rent
20092007 2008
Defined as Physcial Vacancy Plus Concessions and Writeoffs
201320112004
(In Percent)
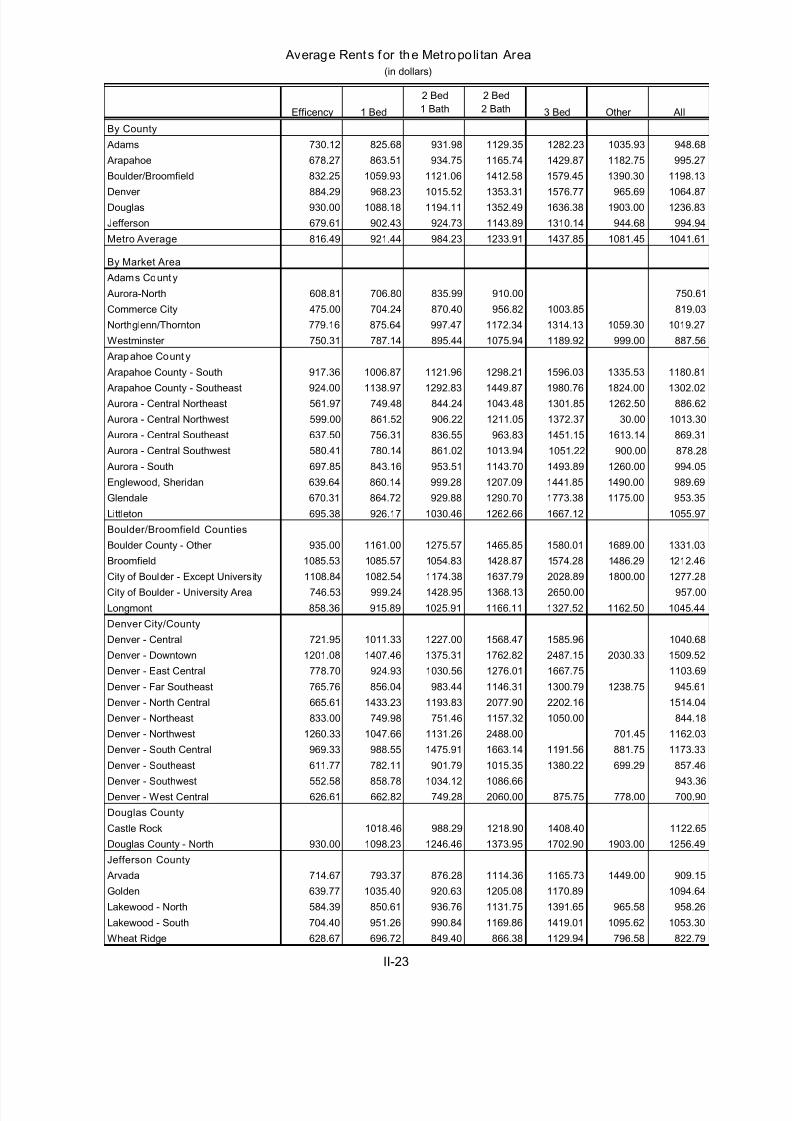
8/13/2019 4Q Vacancy Survey
http://slidepdf.com/reader/full/4q-vacancy-survey 20/27
II-23
2 Bed 2 Bed
1 Bath 2 Bath
By County
Adams 730.12 825.68 931.98 1129.35 1282.23 1035.93 948.68
Arapahoe 678.27 863.51 934.75 1165.74 1429.87 1182.75 995.27
Boulder/Broomfield 832.25 1059.93 1121.06 1412.58 1579.45 1390.30 1198.13
Denver 884.29 968.23 1015.52 1353.31 1576.77 965.69 1064.87Douglas 930.00 1088.18 1194.11 1352.49 1636.38 1903.00 1236.83
Jefferson 679.61 902.43 924.73 1143.89 1310.14 944.68 994.94
Metro Average 816.49 921.44 984.23 1233.91 1437.85 1081.45 1041.61
By Market Area
Adams County
Aurora-North 608.81 706.80 835.99 910.00 750.61
Commerce City 475.00 704.24 870.40 956.82 1003.85 819.03
Northglenn/Thornton 779.16 875.64 997.47 1172.34 1314.13 1059.30 1019.27
Westminster 750.31 787.14 895.44 1075.94 1189.92 999.00 887.56
Arapahoe Count y
Arapahoe County - South 917.36 1006.87 1121.96 1298.21 1596.03 1335.53 1180.81
Arapahoe County - Southeast 924.00 1138.97 1292.83 1449.87 1980.76 1824.00 1302.02 Aurora - Central Northeast 561.97 749.48 844.24 1043.48 1301.85 1262.50 886.62
Aurora - Central Northwest 599.00 861.52 906.22 1211.05 1372.37 30.00 1013.30
Aurora - Central Southeast 637.50 756.31 836.55 963.83 1451.15 1613.14 869.31
Aurora - Central Southwest 580.41 780.14 861.02 1013.94 1051.22 900.00 878.28
Aurora - South 697.85 843.16 953.51 1143.70 1493.89 1260.00 994.05
Englewood, Sheridan 639.64 860.14 999.28 1207.09 1441.85 1490.00 989.69
Glendale 670.31 864.72 929.88 1290.70 1773.38 1175.00 953.35
Littleton 695.38 926.17 1030.46 1262.66 1667.12 1055.97
Boulder/Broomfield Counties
Boulder County - Other 935.00 1161.00 1275.57 1465.85 1580.01 1689.00 1331.03
Broomfield 1085.53 1085.57 1054.83 1428.87 1574.28 1486.29 1212.46
City of Boulder - Except University 1108.84 1082.54 1174.38 1637.79 2028.89 1800.00 1277.28
City of Boulder - University Area 746.53 999.24 1428.95 1368.13 2650.00 957.00
Longmont 858.36 915.89 1025.91 1166.11 1327.52 1162.50 1045.44
Denver City/County
Denver - Central 721.95 1011.33 1227.00 1568.47 1585.96 1040.68
Denver - Downtown 1201.08 1407.46 1375.31 1762.82 2487.15 2030.33 1509.52
Denver - East Central 778.70 924.93 1030.56 1276.01 1667.75 1103.69
Denver - Far Southeast 765.76 856.04 983.44 1146.31 1300.79 1238.75 945.61
Denver - North Central 665.61 1433.23 1193.83 2077.90 2202.16 1514.04
Denver - Northeast 833.00 749.98 751.46 1157.32 1050.00 844.18
Denver - Northwest 1260.33 1047.66 1131.26 2488.00 701.45 1162.03
Denver - South Central 969.33 988.55 1475.91 1663.14 1191.56 881.75 1173.33
Denver - Southeast 611.77 782.11 901.79 1015.35 1380.22 699.29 857.46
Denver - Southwest 552.58 858.78 1034.12 1086.66 943.36Denver - West Central 626.61 662.82 749.28 2060.00 875.75 778.00 700.90
Douglas County
Castle Rock 1018.46 988.29 1218.90 1408.40 1122.65
Douglas County - North 930.00 1098.23 1246.46 1373.95 1702.90 1903.00 1256.49
Jefferson County
Arvada 714.67 793.37 876.28 1114.36 1165.73 1449.00 909.15
Golden 639.77 1035.40 920.63 1205.08 1170.89 1094.64
Lakewood - North 584.39 850.61 936.76 1131.75 1391.65 965.58 958.26
Lakewood - South 704.40 951.26 990.84 1169.86 1419.01 1095.62 1053.30
Wheat Ridge 628.67 696.72 849.40 866.38 1129.94 796.58 822.79
Average Rents for the Metropoli tan Area
(in dollars)
Efficency 1 Bed 3 Bed Other All
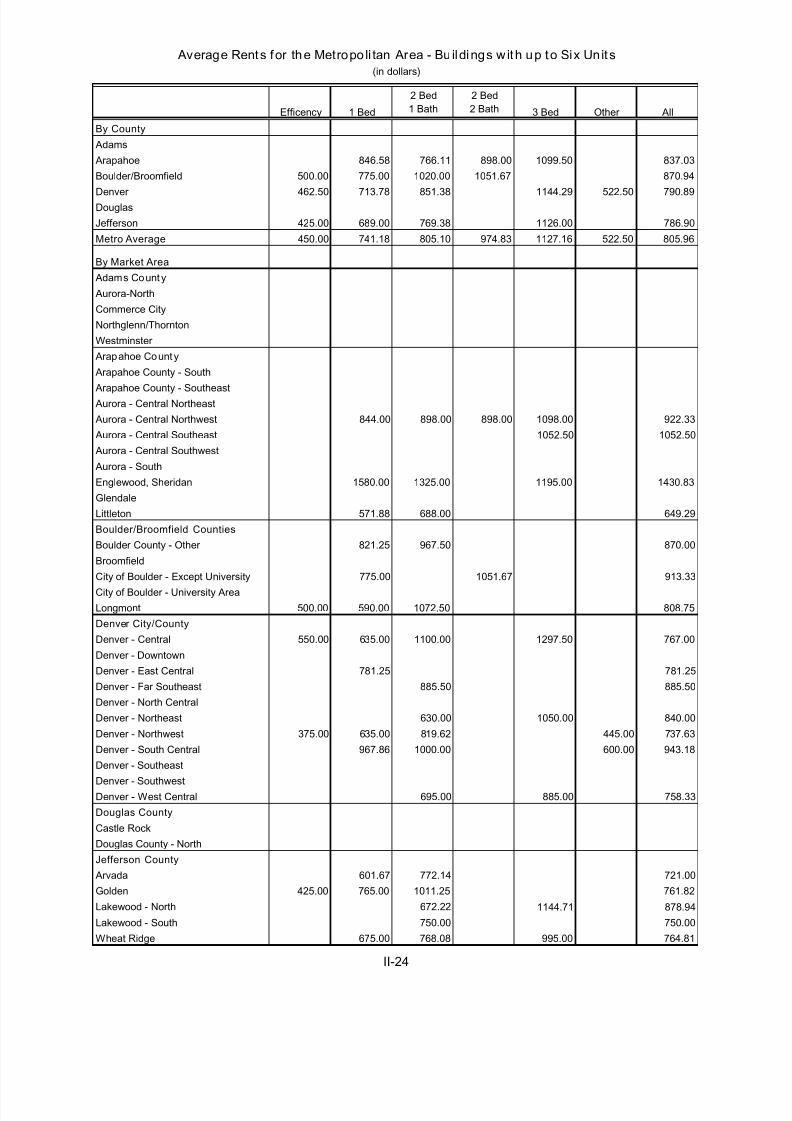
8/13/2019 4Q Vacancy Survey
http://slidepdf.com/reader/full/4q-vacancy-survey 21/27

8/13/2019 4Q Vacancy Survey
http://slidepdf.com/reader/full/4q-vacancy-survey 22/27
II-25
2 Bed 2 Bed
1 Bath 2 Bath
By County
Adams 495.00 702.75 822.97 950.08 900.00 785.36
Arapahoe 618.75 668.12 750.59 1095.52 1242.43 763.67
Boulder/Broomfield 698.75 857.90 1401.38 1133.50 1586.67 985.49
Denver 637.91 854.14 1080.76 1175.74 1117.21 1506.80 877.23Douglas
Jefferson 649.00 670.74 732.82 858.44 897.25 983.19 732.90
Metro Average 637.25 819.97 913.14 1095.29 1116.48 1258.78 848.86
By Market Area
Adams County
Aurora-North 600.00 750.00 690.00
Commerce City 475.00 768.41 918.00 1019.00 900.00 850.56
Northglenn/Thornton 650.00 800.00 900.00 733.33
Westminster 555.00 625.00 725.00 795.00 700.63
Arapahoe County
Arapahoe County - South
Arapahoe County - Southeast Aurora - Central Northeast
Aurora - Central Northwest 892.00 1161.00 1237.00 1140.33
Aurora - Central Southeast
Aurora - Central Southwest
Aurora - South
Englewood, Sheridan 651.84 790.00 665.00
Glendale 645.00 675.90 760.30 1275.00 734.10
Littleton 575.00 677.97 655.00 950.00 707.50
Boulder/Broomfield Counties
Boulder County - Other
Broomfield 700.00 800.00 714.29
City of Boulder - Except University 910.00 912.65 1150.00 1170.00 1600.00 963.03
City of Boulder - University Area 765.00 1017.35 1685.29 1368.13 2650.00 1294.35
Longmont 560.00 685.09 785.00 880.63 873.33 723.07
Denver City/County
Denver - Central 638.74 862.20 1131.64 1111.03 1185.71 879.40
Denver - Downtown 675.00 880.00 950.00 847.80
Denver - East Central 515.00 849.60 833.67
Denver - Far Southeast
Denver - North Central 665.61 902.08 1193.83 1147.00 827.71
Denver - Northeast 686.25 802.22 766.54
Denver - Northwest 650.00 767.09 751.00 752.46
Denver - South Central 757.72 867.05 1026.88 1600.00 1350.00 2600.00 1066.73
Denver - Southeast
Denver - Southwest 296.25 701.40 591.53Denver - West Central 650.00 745.00 850.00 778.00 744.28
Douglas County
Castle Rock
Douglas County - North
Jefferson County
Arvada 600.00 723.44 924.00 756.36
Golden 673.68 720.00 830.00 711.85
Lakewood - North 575.00 665.50 706.27 855.67 863.33 921.56 713.34
Lakewood - South 742.50 834.00 1032.50 958.28
Wheat Ridge 562.50 638.82 759.87 900.00 785.00 709.03
Average Rents for the Metropoli tan Area - Bu ildings w ith Seven to Th ir ty-Six Uni ts
(in dollars)
Efficency 1 Bed 3 Bed Other All

8/13/2019 4Q Vacancy Survey
http://slidepdf.com/reader/full/4q-vacancy-survey 23/27
II-26
2 Bed 2 Bed
1 Bath 2 Bath
By County
Adams 736.11 826.23 932.95 1129.92 1285.01 1035.93 949.56
Arapahoe 678.92 864.68 939.36 1165.96 1431.53 1182.75 996.98
Boulder/Broomfield 834.42 1066.80 1116.70 1414.62 1579.35 1390.30 1202.64
Denver 917.36 979.91 1012.63 1355.17 1595.14 895.79 1079.42Douglas 930.00 1088.18 1194.11 1352.49 1636.38 1903.00 1236.83
Jefferson 684.09 910.00 938.33 1145.09 1316.52 940.75 1003.99
Metro Average 832.03 924.93 987.37 1 234.54 1 442.02 1 071.74 1 046.80
By Market Area
Adams County
Aurora-North 608.81 709.89 841.26 910.00 752.95
Commerce City 696.67 862.99 950.00 1050.00 814.49
Northglenn/Thornton 779.16 876.03 998.26 1172.34 1314.91 1059.30 1019.72
Westminster 751.97 787.38 896.00 1076.64 1189.92 999.00 887.97
Arapahoe County
Arapahoe County - South 917.36 1006.87 1121.96 1298.21 1596.03 1335.53 1180.81
Arapahoe County - Southeast 924.00 1138.97 1292.83 1449.87 1980.76 1824.00 1302.02 Aurora - Central Northeast 561.97 749.48 844.24 1043.48 1301.85 1262.50 886.62
Aurora - Central Northwest 599.00 861.53 906.40 1212.27 1378.96 30.00 1012.52
Aurora - Central Southeast 637.50 756.31 836.55 963.83 1456.97 1613.14 869.22
Aurora - Central Southwest 580.41 780.14 861.02 1013.94 1051.22 900.00 878.28
Aurora - South 697.85 843.16 953.51 1143.70 1493.89 1260.00 994.05
Englewood, Sheridan 639.64 863.69 999.68 1207.09 1445.97 1490.00 993.33
Glendale 671.34 869.42 961.02 1290.70 1787.22 1175.00 963.89
Littleton 702.60 935.18 1073.16 1266.43 1667.12 1069.23
Boulder/Broomfield Counties
Boulder County - Other 935.00 1162.80 1278.59 1465.85 1580.01 1689.00 1332.36
Broomfield 1085.53 1086.96 1055.22 1428.87 1574.28 1486.29 1213.40
City of Boulder - Except Universi ty 1116.20 1094.73 1174.71 1645.68 2037.13 1800.00 1289.33
City of Boulder - University Area 746.45 997.42 1320.00 922.71
Longmont 873.28 929.20 1028.42 1169.42 1341.43 1162.50 1055.23
Denver City/County
Denver - Central 743.96 1110.55 1293.14 1606.82 1890.23 1120.99
Denver - Downtown 1212.59 1412.38 1375.31 1773.75 2487.15 2030.33 1517.57
Denver - East Central 825.24 930.60 1030.56 1276.01 1667.75 1113.08
Denver - Far Southeast 765.76 856.04 983.78 1146.31 1300.79 1238.75 945.63
Denver - North Central 1544.19 2077.90 2400.00 1730.69
Denver - Northeast 833.00 750.31 750.71 1157.32 844.79
Denver - Northwest 1325.00 1100.88 2113.00 2488.00 710.00 1251.63
Denver - South Central 1011.94 1012.72 1520.95 1666.61 1190.12 741.49 1188.52
Denver - Southeast 611.77 782.11 901.79 1015.35 1380.22 699.29 857.46
Denver - Southwest 624.53 865.23 1034.12 1086.66 953.07Denver - West Central 626.61 663.69 751.30 2060.00 887.50 694.41
Douglas County
Castle Rock 1018.46 988.29 1218.90 1408.40 1122.65
Douglas County - North 930.00 1098.23 1246.46 1373.95 1702.90 1903.00 1256.49
Jefferson County
Arvada 714.67 794.56 884.36 1114.36 1175.91 1449.00 913.86
Golden 1055.55 1205.08 1170.89 1119.88
Lakewood - North 585.56 870.37 975.40 1142.23 1414.50 975.94 983.88
Lakewood - South 704.40 951.54 992.65 1169.86 1419.01 1108.37 1053.87
Wheat Ridge 631.61 701.74 861.30 866.26 1132.97 796.58 830.20
Average Rents for the Metropoli tan Area - Buildings w ith Th ir ty -Seven and Above Uni ts
(in dollars)
Efficency 1 Bed 3 Bed Other All

8/13/2019 4Q Vacancy Survey
http://slidepdf.com/reader/full/4q-vacancy-survey 24/27
II-27
2 Bed 2 Bed
1 Bath 2 Bath
By County
Adams 624.00 699.09 910.00 885.24 762.25
Arapahoe 705.00 929.07 920.86 1333.35 2808.89 1336.45 1027.76
Boulder/Broomfield 1200.00 1649.00 2198.00 1626.02
Denver 1004.94 1227.27 1514.80 1594.44 1372.24 886.02 1323.49Douglas
Jefferson 989.26 1145.06 1065.53
Metro Average 951.40 1092.93 1220.65 1492.28 1594.08 977.44 1210.15
By Market Area
Adams County
Aurora-North 624.00 762.00 910.00 910.00 784.72
Commerce City
Northglenn/Thornton
Westminster 679.00 884.00 752.21
Arapahoe County
Arapahoe County - South 963.00 1149.00 1537.00 2652.00 1397.00 1297.81
Arapahoe County - Southeast 1475.00 2100.00 3600.00 1732.11 Aurora - Central Northeast
Aurora - Central Northwest
Aurora - Central Southeast
Aurora - Central Southwest 1257.00 1637.00 1931.00 1460.34
Aurora - South 811.27 944.00 966.33 870.60
Englewood, Sheridan 734.00 780.00 933.00 831.68
Glendale 691.86 785.72 904.57 1019.91 1175.00 829.02
Littleton 538.00 788.00 938.00 810.20
Boulder/Broomfield Counties
Boulder County - Other
Broomfield
City of Boulder - Except University 1200.00 1649.00 2198.00 1626.02
City of Boulder - University Area
Longmont
Denver City/County
Denver - Central 788.25 1076.82 1051.07 1541.22 1820.00 1146.67
Denver - Downtown 1269.35 1412.86 1361.88 1761.20 2607.00 1735.00 1530.24
Denver - East Central 525.00 650.00 725.00 750.00 955.00 697.32
Denver - Far Southeast 921.67 1192.88 1305.62 1105.40 1350.00 1475.00 1162.60
Denver - North Central 1544.19 2077.90 2400.00 1730.69
Denver - Northeast
Denver - Northwest 1325.00 1797.00 2113.00 2488.00 1786.21
Denver - South Central 1154.05 1177.68 1946.82 1755.67 1105.88 835.82 1343.13
Denver - Southeast 589.00 695.00 843.00 877.00 619.00 734.62
Denver - Southwest 595.00 774.99 837.00 724.83Denver - West Central 648.00 745.00 948.00 2060.00 731.26
Douglas County
Castle Rock
Douglas County - North
Jefferson County
Arvada
Golden 1841.10 2294.58 2082.96
Lakewood - North
Lakewood - South 870.00 948.00 907.66
Wheat Ridge
Average Rents for the Metropoli tan Area - Buildings w ith Five Stor ies and Above
(in dollars)
Efficency 1 Bed 3 Bed Other All

8/13/2019 4Q Vacancy Survey
http://slidepdf.com/reader/full/4q-vacancy-survey 25/27
II-28
1st 2nd 3rd 4th 1st 2nd 3rd 4th 1st 2nd 3rd 4th 1st 2nd 3rd 4th 1st 2nd 3rd 4th 1st 2nd 3rd 4th 1st 2nd 3rd 4
Efficency 588.78 665.67 659.18 687.09 663.36 729.95 728.63 512.76 521.40 514.20 493.62 629.64 493.45 595.20 686.00 653.36 497.49 514.25 594.00 676.73 702.27 677.27 624.16 701.75 732.81 671.40 635.00 80
1 Bed 703.81 701.13 687.88 708.60 695.61 741.40 752.27 735.45 714.80 712.92 698.05 708.81 721.02 745.48 783.20 765.16 783.66 786.37 803.36 792.03 779.40 793.20 767.72 780.22 793.75 812.60 821.52 82
2 Bed, 1 Bath 730.18 756.23 745.73 771.42 790.21 796.14 821.64 790.32 781.20 772.57 768.97 764.09 839.67 811.42 880.89 797.46 844.36 788.36 865.35 832.92 793.02 797.12 808.12 795.92 809.32 826.07 845.39 88
2 Bed, 2 Bath 960.29 1044.99 948.32 939.24 938.80 990.08 971.09 970.45 970.46 977.07 933.63 935.27 985.21 971.53 989.41 990.97 994.69 1051.94 1070.68 1056.45 1054.66 1023.82 1066.03 1038.05 1103.39 1140.50 1178.69 115
3 Bed 1123.86 1247.29 1159.33 1207.00 1195.71 1220.91 1299.10 1219.00 1263.30 1263.95 1144.13 1091.43 1134.00 1164.66 1207.00 1169.86 1271.24 1255.18 1318.75 1312.31 1301.78 1302.55 1311.26 1348.67 1396.50 1388.50 1417.33 124
Other 1084.29 961.60 982.40 985.00 979.20 966.40 933.00 1081.45 825.00 796.69 792.40 834.73 835.53 830.00 863.86 1201.80 772.84 851.95 856.54 856.05 863.63 797.60 874.60 745.20 888.15 942.41 1013.43 101
All 777.35 793.34 785.30 819.27 800.82 860.09 846.85 819.93 804.19 830.88 792.58 791.26 841.34 848.31 880.96 857.15 871.26 863.85 886.50 873.69 881.63 872.27 870.20 854.94 868.39 897.33 930.56 92
Efficency 572.71 563.38 581.18 484.08 522.83 549.66 539.97 506.74 520.67 471.39 508.58 491.69 478.53 505.62 563.55 499.53 531.60 516.17 514.86 519.33 554.33 591.89 548.46 679.69 580.76 681.42 640.71 61
1 Bed 677.63 703.54 705.76 695.46 692.64 702.28 712.16 696.99 698.93 671.26 695.23 682.06 696.61 704.76 714.65 716.19 728.56 717.26 740.27 722.67 740.45 777.85 785.29 766.38 781.08 816.84 846.26 82
2 Bed, 1 Bath 732.67 749.17 757.65 759.97 769.82 799.46 813.51 783.15 774.87 737.18 759.10 755.78 776.51 796.06 804.76 801.30 792.67 789.15 795.98 794.31 803.43 822.21 823.32 808.42 849.53 868.36 889.87 88
2 Bed, 2 Bath 877.04 938.19 918.27 920.55 922.50 926.97 943.52 960.37 939.21 932.95 964.12 912.03 910.27 939.95 968.34 959.54 984.18 985.32 992.22 997.97 1004.74 1122.12 1127.86 1081.10 1062.30 1113.35 1162.13 114
3 Bed 1050.00 1182.21 1131.18 1134.12 1165.40 1194.58 1194.51 1187.51 1202.94 1211.50 1179.00 1196.42 1182.00 1263.00 1289.50 1292.50 1235.87 1319.84 1341.35 1245.69 1276.50 1348.30 1410.00 1408.33 1372.33 1334.40 1418.96 143
Other 1082.00 1096.10 952.78 994.00 943.33 992.22 987.78 1012.33 890.44 844.00 892.22 924.33 1126.40 1063.00 1064.17 1062.83 1062.17 1037.83 1037.83 1065.33 1069.48 1184.89 1211.22 1182.22 1190.44 1205.40 1337.78 128
All 743.36 773.73 781.29 793.85 793.42 803.78 813.80 817.00 811.29 766.91 797.97 775.82 804.38 806.11 831.40 829.84 825.08 838.79 844.77 840.24 849.43 902.88 899.56 885.48 891.96 939.48 946.55 94
Efficency 793.80 687.14 623.39 687.68 591.11 782.25 761.20 748.00 703.73 711.21 731.84 694.11 730.69 732.50 730.75 737.93 736.33 756.13 805.71 760.00 784.38 809.63 782.72 818.56 858.80 892.22 744.05 78
1 Bed 789.33 812.86 801.96 821.48 831.50 848.72 929.41 819.20 814.27 837.06 838.45 848.61 876.13 881.92 847.46 840.79 869.68 887.72 919.34 916.29 954.05 958.53 948.68 959.71 1005.91 1053.17 1075.00 108
2 Bed, 1 Bath 785.23 816.75 828.98 799.47 834.40 847.82 864.36 878.08 878.45 860.57 868.03 859.19 852.88 848.26 882.52 933.47 954.84 954.21 920.81 923.49 978.23 964.20 1038.39 1073.99 1084.78 1066.17 1094.46 112
2 Bed, 2 Bath 1191.40 1102.55 1094.49 1044.47 1157.47 1130.67 1158.99 1176.93 1027.71 1040.15 1063.13 1081.09 1084.97 1185.00 1128.96 1159.90 1159.27 1138.14 1155.16 1274.69 1267.79 1337.68 1259.27 1257.63 1404.73 1471.72 1480.95 144
3 Bed 1164.25 1167.00 1124.79 1190.86 1190.50 1252.50 1292.55 1276.23 1221.75 1283.62 1268.54 1291.75 1294.50 1319.40 1304.91 1273.25 1319.44 1336.88 1370.50 1324.48 1458.50 1417.50 1405.00 1344.00 1375.00 1582.75 1589.50 155
Other 1001.69 1001.69 799.65 796.65 796.65 1004.55 1056.08 1038.82 1038.82 1038.82 1038.82 1056.08 1088.82 1095.91 1120.91 1255.40 1344.80 1388.82 1288.82 1379.55 1494.80 921.65 921.65 921.54 922.58 947.69 947.69 117
All 903.27 892.11 883.58 897.03 900.88 939.52 962.40 933.41 908.63 912.98 900.89 898.70 901.77 976.65 952.14 957.92 961.79 969.13 991.60 993.85 1014.74 1038.85 1095.91 1080.40 1088.75 1140.87 1171.68 116
Efficency 600.00 545.37 547.26 562.62 585.05 586.95 579.56 567.78 560.87 569.66 583.13 598.60 591.04 604.62 589.58 592.16 612.51 630.74 664.63 631.86 662.74 693.65 720.82 686.98 747.69 789.88 798.15 77
1 Bed 692.91 721.58 713.33 687.00 709.48 712.36 716.15 729.99 717.59 710.60 729.80 714.86 728.44 712.75 731.88 736.69 738.83 737.69 746.61 768.28 780.53 797.76 824.09 771.98 829.48 839.92 857.19 87
2 Bed, 1 Bath 793.58 834.57 808.30 770.75 761.44 801.30 794.22 808.07 813.26 772.78 784.20 745.70 838.18 844.91 828.27 802.27 794.33 765.12 809.20 818.78 878.81 876.38 862.23 809.29 848.19 858.42 894.97 93
2 Bed, 2 Bath 1004.05 999.88 1027.05 1057.62 1017.87 996.59 996.61 1003.89 1015.48 1012.45 965.53 985.72 1010.27 990.80 966.00 977.63 978.63 984.13 998.38 1017.09 1104.38 1179.63 1093.91 1131.19 1129.26 1191.32 1243.51 121
3 Bed 1373.00 1377.23 1381.72 1387.00 1416.45 1394.00 1389.81 1384.29 1249.63 1295.50 1225.00 1218.19 1203.15 1203.47 1213.79 1214.33 1213.67 1196.67 1246.15 1274.74 1307.16 1309.29 1319.95 1424.24 1313.90 1384.05 1373.07 141
Other 1111.77 1074.60 1106.67 1118.67 1082.00 1004.00 1000.00 998.29 1063.00 1382.00 917.50 1058.13 1061.29 1068.02 638.75 523.67 524.67 523.33 1381.00 548.60 571.27 642.80 693.27 2008.34 671.40 671.07 708.60 69
All 772.75 780.31 798.44 787.32 792.76 800.19 808.46 809.75 794.74 785.91 785.26 779.53 801.41 814.14 809.30 806.79 818.53 800.94 853.34 834.48 867.56 888.95 887.05 859.14 890.44 906.70 933.29 96
Efficency 738.00 738.00 613.00 713.00 738.00 663.00 663.00 688.00 738.00 738.00 738.00 563.00 838.00 588.00 750.00 713.00 713.00 738.00 788.00 738.00 738.00 788.00 788.00 750.00 888.00 888.00 888.00 93
1 Bed 842.33 830.32 856.56 886.05 865.20 858.90 848.82 830.38 831.26 828.04 862.26 822.73 864.82 862.86 941.95 898.70 910.71 903.17 905.08 887.06 923.88 944.90 912.17 1006.37 1008.43 1019.86 1073.73 103
2 Bed, 1 Bath 1016.00 923.97 960.00 916.68 901.53 969.33 991.46 916.67 920.75 872.31 1027.94 924.92 1039.00 1020.53 1090.13 1038.62 1041.00 1041.10 1130.33 1021.08 1153.27 1038.12 1085.51 1161.45 1129.75 1173.57 1196.54 118
2 Bed, 2 Bath 1129.93 1129.08 1114.46 1152.86 1116.84 1168.58 1141.68 1088.58 1096.33 1045.20 1126.49 1101.38 1122.12 1194.51 1207.70 1160.00 1194.26 1208.90 1205.62 1184.93 1258.34 1220.53 1265.45 1323.42 1260.79 1388.96 1349.51 128
3 Bed 1283.45 1283.43 1360.10 1345.38 1357.65 1351.22 1430.44 1377.22 1287.69 1294.31 1431.09 1366.47 1415.61 1607.57 1606.43 1514.00 1395.54 1537.89 1540.09 1330.50 1556.00 1528.73 1530.67 1566.27 1565.18 1727.50 1577.50 149
Other 1238.00 1238.00 1238.00 1244.26 1388.00 1542.00 1038.00 1038.00 1038.00 1913.00 1913.00 1913.00 191
All 949.20 1007.50 950.61 1010.31 941.51 1009.32 1018.39 956.59 981.90 963.78 1015.36 1011.78 1036.39 1024.27 1111.17 1043.79 1061.57 1015.33 1071.85 1046.92 1049.33 1053.92 1091.66 1141.19 1137.94 1184.58 1188.00 119
Efficency 487.79 490.23 659.00 656.60 660.00 524.93 524.16 523.09 521.12 520.75 516.23 522.91 517.02 516.98 529.60 541.00 568.29 581.65 634.25 632.53 655.12 657.82 656.25 588.72 662.36 697.47 711.01 701 Bed 705.16 724.01 734.14 702.80 717.96 722.68 729.85 718.27 684.40 694.00 691.44 702.01 698.46 711.34 752.37 737.28 724.24 747.63 761.23 767.34 774.56 798.99 858.65 830.30 855.70 869.33 916.80 85
2 Bed, 1 Bath 696.79 709.98 736.78 742.88 757.63 756.43 768.54 745.31 749.32 757.26 756.89 749.52 776.46 786.35 771.55 809.40 807.31 772.33 811.44 797.76 816.16 822.89 815.48 832.59 821.21 839.43 874.10 88
2 Bed, 2 Bath 891.33 887.10 916.88 893.44 937.69 939.20 958.37 905.91 911.90 881.18 914.68 919.93 926.46 921.66 956.22 924.78 939.75 968.47 1006.82 951.88 991.00 1008.94 1107.92 1092.83 1091.13 1203.04 1228.88 110
3 Bed 1078.17 1106.91 1022.00 1057.24 1081.94 1080.96 1111.56 1032.26 1033.11 1086.62 1083.50 1083.97 1079.86 1093.17 1130.85 1145.26 1131.56 1155.84 1159.13 1166.11 1165.13 1187.11 1278.56 1165.68 1145.74 1237.68 1343.44 128
Other 905.33 870.20 914.86 923.45 901.41 912.25 911.88 951.90 957.18 941.87 938.69 938.41 940.47 940.71 979.35 979.35 984.61 939.06 943.29 949.08 835.00 877.30 999.25 1003.84 907.00 1024.20 1020.71 86
All 787.85 760.35 799.72 785.33 798.25 783.40 808.45 769.71 776.89 773.87 767.07 780.74 787.94 795.47 828.57 823.47 828.82 813.50 837.55 836.43 847.52 877.08 913.87 902.83 927.45 960.76 996.00 95
Efficency 586.53 566.95 589.55 602.37 584.82 592.10 582.07 566.98 570.29 581.92 588.23 596.64 571.13 579.18 613.21 617.73 614.10 602.36 644.04 635.77 657.78 680.71 706.89 699.90 701.34 737.33 720.84 73
1 Bed 710.35 729.68 729.66 719.42 722.14 735.56 745.89 738.93 724.82 710.88 726.67 711.90 728.63 735.15 749.67 747.91 760.10 759.83 778.94 780.20 789.42 814.21 842.59 820.61 844.78 865.87 892.10 88
2 Bed, 1 Bath 757.41 771.34 781.57 784.33 789.41 809.05 826.45 801.88 804.14 769.97 782.65 769.37 809.55 826.90 838.76 830.29 834.19 810.13 858.70 835.18 841.84 854.70 862.09 834.47 863.38 880.43 898.29 93
2 Bed, 2 Bath 963.58 986.29 965.70 966.17 962.72 980.89 988.95 988.68 966.46 964.30 982.39 963.07 964.45 973.29 992.71 986.01 997.82 1018.22 1032.43 1031.29 1057.14 1102.00 1139.03 1130.18 1130.91 1192.96 1232.96 119
3 Bed 1126.32 1196.56 1153.74 1170.80 1199.32 1210.45 1268.08 1214.02 1209.31 1216.93 1198.11 1193.86 1162.92 1235.78 1252.71 1244.29 1257.54 1277.71 1332.51 1271.46 1315.06 1340.94 1359.79 1406.18 1367.40 1394.86 1458.05 142
Other 1010.05 967.78 960.13 982.78 956.20 980.00 979.97 992.55 942.14 932.00 912.25 947.68 992.85 1045.31 986.29 998.70 989.53 976.16 1023.93 979.81 980.29 907.35 953.47 1122.00 947.60 1012.20 1019.68 103
All 795.55 802.30 813.88 817.84 820.85 833.75 841.81 829.24 821.14 808.42 817.09 811.32 836.61 842.70 856.64 846.36 858.97 863.37 881.67 870.71 891.85 916.08 919.97 911.12 934.82 960.57 987.63 99
2013
(in dollars)
Median Rents by Apartment Type by County
Average rent minus rental losses equals effective rent.
Rents are based on units being unfurnished with tenants paying gas and electricity.
Average rents do not reflect "rental losses" from discounts/concessions, models, delinquents, and bad debts.
M e t r o A v e r a g e
B o u l d e r / B r o o m f i e l d
J e f f e r s o n
D o u g l a s
2012County
D e n v e r
A d a m s
A r a p a h o e
Apartment Type20112008 201020092007

8/13/2019 4Q Vacancy Survey
http://slidepdf.com/reader/full/4q-vacancy-survey 26/27
II-31
First Second Third Fourth Year-End
2004 Units to Start Quarter/Year 274148 274479 275208 276249 274148Units Added this Quarter 331 729 1041 447 2548Total Units Available 274479 275208 276249 276696 276696Quarterly Vacancy Rate 0.105 0.097 0.085 0.100 0.100Units Rented 246122 248897 253381 249522 249522Units Vacant 28889 26843 23400 27706 27706Number Absorbed this Quarter/Year 1278 2776 4483 -3876 4679
2005 Units to Start Quarter/Year 276696 277485 278560 278929 276696
Units Added this Quarter 789 1075 369 284 2517Total Units Available 277485 278560 278929 279213 279213Quarterly Vacancy Rate 0.093 0.080 0.077 0.079 0.079Units Rented 252228 256765 257943 257645 257645Units Vacant 25789 22327 21518 22100 22100Number Absorbed this Quarter/Year 2706 4537 1178 -298 8123
2006 Units to Start Quarter/Year 279213 279367 279497 279572 279213Units Added this Quarter 154 130 75 379 738Total Units Available 279367 279497 279572 279951 279951Quarterly Vacancy Rate 0.074 0.069 0.067 0.070 0.070Units Rented 258694 260212 260841 260354 260354Units Vacant 20673 19285 18731 19597 19597Number Absorbed this Quarter/Year 1049 1518 629 -487 2709
2007 Units to Start Quarter/Year 279951 280071 280713 281299 279951Units Added this Quarter 120 642 586 914 2262Total Units Available 280071 280713 281299 282213 282213Quarterly Vacancy Rate 0.071 0.062 0.053 0.061 0.061Units Rented 260186 263309 266390 264998 264998
Units Vacant 19885 17404 14909 17215 17215Number Absorbed this Quarter/Year -168 3123 3081 -1392 4644
2008 Units to Start Quarter/Year 282213 282430 282706 284311 282213Units Added this Quarter 217 276 1605 789 2887
Total Units Available 282430 282706 284311 285100 285100
Quarterly Vacancy Rate 0.059 0.062 0.065 0.079 0.079
Units Rented 265767 265178 265831 262577 262577Units Vacant 16663 17528 18480 22523 22523Number Absorbed this Quarter/Year 769 -589 653 -3254 -2421
2009 Units to Start Quarter/Year 285100 286501 287194 288722 285100Units Added this Quarter 1401 693 1528 169 3791
Total Units Available 286501 287194 288722 288891 288891
Quarterly Vacancy Rate 0.084 0.090 0.074 0.077 0.077
Units Rented 262435 261347 267357 266646 266646Units Vacant 24066 25847 21365 22245 22245Number Absorbed this Quarter/Year -142 -1088 6010 -711 4069
2010 Units to Start Quarter/Year 288891 289064 289160 289160 288891
Units Added this Quarter 173 96 0 229 498Total Units Available 289064 289160 289160 289389 289389
Quarterly Vacancy Rate 0.065 0.061 0.053 0.055 0.055
Units Rented 270275 271521 273835 273473 273473Units Vacant 18789 17639 15325 15916 15916Number Absorbed this Quarter/Year 3629 1246 2314 -362 6827
2011 Units to Start Quarter/Year 289389 289451 289970 290535 289389
Units Added this Quarter 62 519 565 292 1438
Total Units Available 289451 289970 290535 290827 290329
Quarterly Vacancy Rate 5.5% 4.8% 4.8% 5.4% 5.4%
Units Rented 273531 276051 276478 275009 275009Units Vacant 15920 13919 14057 15818 15791Number Absorbed this Quarter/Year 58 2520 427 -1469 1536
2012 Units to Start Quarter/Year 290827 291103 291666 292229 290827
Units Added this Quarter 276 563 563 329 1731
Total Units Available 291103 291666 292229 292558 292558
Quarterly Vacancy Rate 4.9% 4.8% 4.3% 4.9% 4.9%
Units Rented 276816 277700 279792 278147 278147
Units Vacant 14287 13966 12437 14411 14411Number Absorbed this Quarter/Year 1807 885 2092 -1645 3138
2013 Units to Start Quarter/Year 292558 293649 293878 294107 292558
Units Added this Quarter 1091 229 229 832 2381
Total Units Available 293649 293878 294107 294939 294939
Quarterly Vacancy Rate 4.6% 4.2% 4.4% 5.2% 5.2%
Units Rented 280281 281799 281799 281059 279715Units Vacant 13610 12321 12321 15484 15224Number Absorbed this Quarter/Year 2330 1519 1519 -1793 1569
Due to rounding of the vacancy rate, numbers may not always add exactly.Quarterly absorption totals will not equal year-end total because absorption is the change from time period to time period.Comparisons should be made using comparable time periods, quarter to quarter or year-end to year-end.
Apartment Unit Absorpt ion by Quarter and Year

8/13/2019 4Q Vacancy Survey
http://slidepdf.com/reader/full/4q-vacancy-survey 27/27
DEFINITION OF JEFFERSON COUNTY MARKET AREAS
AND CENSUS TRACTS
Market Area Boundaries:
Arvada North: Jefferson; East Sheridan Blvd. and Boulder-Denver Turnpike;South: Wheat Ridge and Colorado 58; West Jefferson County
Golden North: Colorado 58; East and South: I-70; West: Jefferson County line
Lakewood-North North: City of Wheat Ridge and Edgewater; East: Sheridan; South: Alameda; West: I-70
Lakewood-South North: Alameda; East: City and County of Denver boundary; South andWest: Jefferson County
Wheat Ridge All of City of Wheat Ridge and City of Edgewater
Census Tracts:
Arvada 98.04 (pt), 98.05 (pt), 98.12 (pt), 98.14 (pt), 98.15 (pt 98.l8 (pt), 98.19(pt), 98.20 (pt), 98.21 (pt), 102.04 (pt), 102.05 (pt), 102.06,102.07,102.08 (pt), 102.99 (pt), 103.03 (pt), 103.04, 103.05, 103.06,103.07
Golden 98.04 (pt), 98.08 (pt), 98.10 (pt), 99 (pt), 100 (pt), 101 (pt), 117.14 (pt)
Lakewood - North 98.07 (pt), 105.4 (pt), 108.3 108.98, 109.01 (pt), 109.02, 110, 111,112.01, 112.01 (pt), 112.02, 113 (pt), 114, 115.50, 115.87,115.88,116.01, 116.02, 117.13 (pt), 117.14 (pt)
Lakewood - South 117.01, 117.02, 117.08, 117.09 (pt), 117.10 (pt), 117.11, 117.12 (pt),117.16, 117.17 (pt), 117.18 (pt), 117.19 (pt) 118.01, 118.03, 118.04 (pt),119.04 (pt), 119.51 (pt), 119.83, 119.88, 120.33 (pt), 120.11 (pt), 120.15(pt), 120.16 (pt), 120.17 (pt), 120.29 (pt), 120.50 (pt), 120.54 (pt)
Wheat Ridge,Edgewater
Wheat Ridge - 98.05 (pt), 98.06 (pt), 103.08 (pt), 104.02 (pt), 104.05(pt), 104.06 (pt), 105.02 (pt), 105.03, 105.04 (pt), 106.03 (pt), 106.04(pt), 107.01, 107.02 (pt)Edgewater - 107 (pt), 113, 114 (pt)


![Untitled-1 [] · No Vacancy No Vacancy No Vacancy OBC 47.758 55.89 52.33 No Vacancy 55.13 52.46 52.33 53.00 43.80 No Vacancy No Vacancy sc 45.331 58.33 No Vacancy No Vacancy 50.67](https://img.pdfslide.us/doc/110x75/5fb0660e3185c15b9b1e7853/untitled-1-no-vacancy-no-vacancy-no-vacancy-obc-47758-5589-5233-no-vacancy.jpg)