Embed Size (px)
Citation preview

APPENDIX 13ARROW LNG PLANTGreenhouse Gas Impact Assessment


A PEL Company
FINAL REPORT
GREENHOUSE GAS IMPACT ASSESSMENT
ARROW LNG PLANT
Coffey Environments Australia Pty Ltd
On behalf of
Arrow CSG (Australia) Pty Ltd
Job No: 3678C 22 November 2011

3678 C1-04 Coffey Arrow LNG - FINAL Greenhouse Gas Assessment_v6.docx ii Arrow LNG Plant– Greenhouse Assessment Coffey Environments on behalf of Arrow Energy | PAEHolmes Job 3678C
PROJECT TITLE: ARROW LNG PLANT – GREENHOUSE GAS EMISSIONS ASSESSMENT
JOB NUMBER: 3678C
PREPARED FOR COFFEY ENVIRONMENTS AUSTRALIA PTY LTD
ON BEHALF OF
ARROW CSG (AUSTRALIA) PTY LTD
PREPARED BY: M Kelly
APPROVED FOR RELEASE BY: C Kolominskas
DISCLAIMER & COPYRIGHT: This report is subject to the copyright statement located at www.paeholmes.com © Queensland Environment Pty Ltd trading as PAEHolmes ABN 86 127 101 642
DOCUMENT CONTROL
VERSION DATE PREPARED BY REVIEWED BY
Draft 25/06/2010 J Steele M Scholl
1-01 Draft 12/05/2011 S Colson M Goodfellow
1-02 Draft 14/06/2011 M Kelly M Goodfellow
1-03 Draft 21/10/2011 S Colson M Goodfellow
1-04 Draft 24/10/2011 S Colson M Goodfellow
1-05 FINAL 22/11/2011 M Kelly C Kolominskas
1-06 FINAL 23/11/2011 M Kelly C Kolominskas Queensland Environment Pty Ltd trading as PAEHolmes ABN 86 127 101 642 BRISBANE: Level 1, La Melba, 59 Melbourne Street, South Brisbane QLD 4101 PO Box 3306, South Brisbane QLD 4101 Ph: +61 7 3004 6400 Fax: +61 7 3844 5858
ADELAIDE: 72 North Terrace, Littlehampton SA 5250 PO Box 1230, Littlehampton SA 5250 Ph: +61 8 8391 4032 Fax: +61 7 3844 5858
PERTH: Level 18, Central Park Building, 152-158 St Georges Terrace, Perth WA 6000 Ph: +61 8 9288 4522 Fax: +61 8 9288 4400
SYDNEY: Suite 203, Level 2, Building D, 240 Beecroft Road Epping NSW 2121 Ph: +61 2 9870 0900 Fax: +61 2 9870 0999
MELBOURNE: Suite 62, 63 Turner Street, Port Melbourne VIC 3207 PO Box 23293, Docklands VIC 8012 Ph: +61 3 9681 8551 Fax: +61 3 9681 3408
GLADSTONE: Suite 2, 36 Herbert Street, Gladstone QLD 4680 Ph: +61 7 4972 7313 Fax: +61 7 3844 5858
Email: [email protected] Website: www.paeholmes.com

3678 C1-04 Coffey Arrow LNG - FINAL Greenhouse Gas Assessment_v6.docx iii Arrow LNG Plant– Greenhouse Assessment Coffey Environments on behalf of Arrow Energy | PAEHolmes Job 3678C
DISCLAIMER
PAEHolmes acts in all professional matters as a faithful advisor to the Client and exercises all reasonable skill and care in the provision of its professional services.
Reports are commissioned by and prepared for the exclusive use of the Client. They are subject to and issued in accordance with the agreement between the Client and PAEHolmes. PAEHolmes is not responsible for any liability and accepts no responsibility whatsoever arising from the misapplication or misinterpretation by third parties of the contents of its reports.
Except where expressly stated, PAEHolmes does not attempt to verify the accuracy, validity or comprehensiveness of any information supplied to PAEHolmes for its reports.
Reports cannot be copied or reproduced in whole or part for any purpose without the prior written agreement of PAEHolmes.
Where site inspections, testing or fieldwork have taken place, the report is based on the information made available by the client or their nominees during the visit, visual observations and any subsequent discussions with regulatory authorities. The validity and comprehensiveness of supplied information has not been independently verified and, for the purposes of this report, it is assumed that the information provided to PAEHolmes is both complete and accurate. It is further assumed that normal activities were being undertaken at the site on the day of the site visit(s), unless explicitly stated otherwise.
3678 C1-04 Coffey Arrow LNG - FINAL Greenhouse Gas Assessment_v6.docx iv Arrow LNG Plant– Greenhouse Assessment Coffey Environments on behalf of Arrow Energy | PAEHolmes Job 3678C
ES1 EXECUTIVE SUMMARY
Arrow Energy proposes to construct the Arrow LNG Plant in the Curtis Island Industry Precinct at the southwestern end of Curtis Island, approximately 6 km north of Gladstone and 85 km southeast of Rockhampton, off Queensland’s central coast.
The LNG plant will have a base-case capacity of 16 Mtpa, with a total plant capacity of up to 18 Mtpa. The plant will consist of four LNG trains, each with a nominal capacity of 4 Mtpa. The project will be undertaken in two phases of two trains (nominally 8 Mtpa), with a financial investment decision process for each phase.
The primary objectives of this study are to estimate the greenhouse gas emissions resulting from the construction and operation of the Arrow LNG Plant, identify methods to reduce or mitigate those emissions and comment on the potential impact of these emissions with respect to climate change. Impacts have been assessed in line with the Final Terms of Reference for the Shell Australia LNG (now Arrow Energy) EIS, as issued by the Coordinator General, January 2010.
Four configuration options regarding LNG plant and site utilities construction/operation are being investigated by Coffey Environments; i.e., an all mechanical option using gas turbine compressor drives and generators, an all electrical option using electricity from the grid (mains power) and two mechanical/electrical options. Only the “all mechanical” and the “all electrical” scenarios have been assessed, for identified worst-case periods.
PAEHolmes has estimated greenhouse gas emissions based upon the methods outlined in the following documents:
The World Resources Institute/World Business Council for Sustainable Development Greenhouse Gas Protocol (WRI & WBCSD, 2004).
The National Greenhouse and Energy Reporting (Measurement) Determination 2008 as amended – Reporting Year 2010-11 (DCCEE, 2010d) and National Greenhouse and Energy Reporting (Measurement) Determination 2008 (DCC, 2008d).
The National Greenhouse and Energy Reporting System Measurement Technical Guidelines 2010 (Technical Guidelines) (DCCEE, 2010e).
The Australian Government Department of Climate Change National Greenhouse Accounts Factors 2010 (DCCEE, 2010f).
Direct (scope 1) and indirect (scope 2) greenhouse gas emissions from the full operation (i.e. four LNG trains) of Arrow LNG Plant have been estimated to be 8.2 Mt CO2-e/annum for the “all electrical” option versus 6.4 Mt CO2-e/annum for the “all mechanical” option. The majority of emissions are associated with gas combustion for the facility’s compression and power requirements and start-up flaring with the ”all mechanical” configuration and electricity consumption with the “all electrical” alternative.
The operational greenhouse emissions for the “all electrical” option represents approximately 1.5% of the Australian Government’s 2020 emissions target (i.e., 5% emissions reduction from 2000 levels). Following the introduction of a carbon price this intensity is expected to fall. If the facility was provided with electricity exclusively from a combined cycle gas fired power plant the “all electrical” option would have half the greenhouse gas emissions indicated above.

3678 C1-04 Coffey Arrow LNG - FINAL Greenhouse Gas Assessment_v6.docx v Arrow LNG Plant– Greenhouse Assessment Coffey Environments on behalf of Arrow Energy | PAEHolmes Job 3678C
For the “all electrical” scenario, Phase 1 (i.e., 2014-2022) will generate a total of 20.5 Mt CO2-e of scope 1 and scope 2 emissions from the operation of the Arrow LNG Plant, while Phase 2 (i.e., 2022-2042) will generate a total of 151.4 Mt CO2-e. In comparison, the associated scope 1 and scope 2 greenhouse gas emissions from plant construction were estimated to be 793 kt CO2-e (i.e., 3.9% of the operational emissions) for Phase 1, and 648 kt CO2-e (0.4% of the operational emissions) for Phase 2.
The direct and indirect (scope 1 and 2) greenhouse gas emissions associated with the worst case scenario from the Arrow LNG Plant are small (i.e., 15.5%) in comparison with greenhouse gas emissions associated with the end-use of the product fuel. It is assumed that these end-use emissions will occur only from the combustion of LNG for heating and electricity purposes (though there will be minimal fugitive losses during shipping, regasification and distribution). In comparison with other fossil fuels, particularly coal, combusting LNG for heating purposes emits less greenhouse gas emissions per unit of thermal energy produced. If LNG is combusted to produce electricity in combined cycle gas turbine power plants, the greenhouse gas reductions, when compared to other fossil fuels, are even greater per MWh of electricity generated.
A number of greenhouse gas emission mitigation measures have been incorporated throughout the Arrow LNG Plant design process, including high efficiency gas turbines for power generation for the “all mechanical” option. When considering this option, the emissions intensity (t CO2-e/t LNG) is among the lowest emission intensities of existing and proposed LNG facilities in Australia and abroad, demonstrating that Arrow LNG Plant utilises Best Available Technology (BAT).
For this assessment, the current default power grid emission intensity for Queensland has been used. Note that the emissions intensity for the “all electrical” option, is a function of the power grid’s emissions intensity at the time of consumption. The lower limit of the grid’s emission intensity range would be a grid sourced exclusively from combined cycle gas turbines (CCGT). This range encompasses the “all mechanical” option (a grid supply with the same power generation technology as this option).
Arrow Energy is developing an greenhouse gas standard as part of an integrated Health, Safety and Environmental Management System and has committed to the ongoing measurement and monitoring of Arrow LNG Plant’s emissions and energy consumption, through a range of voluntary and mandatory schemes, including:
the National Greenhouse and Energy Reporting (NGER) System; and
the Energy Efficiency Opportunities Program (EEO).

3678 C1-04 Coffey Arrow LNG - FINAL Greenhouse Gas Assessment_v6.docx vi Arrow LNG Plant– Greenhouse Assessment Coffey Environments on behalf of Arrow Energy | PAEHolmes Job 3678C
ES2 GLOSSARY Abbreviation Meaning
AGRU Acid Gas Removal Unit
ALARP As Low As Reasonably Practical
API American Petroleum Institute
APLNG Australia Pacific LNG
BAT Best Available Technology
CCGT Combined Cycle Gas Turbine
CCS Carbon Capture and Sequestration
CDIAC Carbon Dioxide Information Analysis Centre
CDM Clean Development Mechanism
COP Conference of Parties
CPRS Carbon Pollution Reduction Scheme
CSG Coal Seam Gas
DCC Department of Climate Change
DCCEE Department of Climate Change and Energy Efficiency
EEO Energy Efficiency Opportunities
EIT Economies In Transition
EITE Emission Intensive Trade Exposed
ELNG Egyptian LNG
EPA Environmental Protection Agency
FLNG Prelude Floating LNG
GEC Gas Electricity Certificate
GHG Greenhouse Gas
GLNG Gladstone LNG
GT Gas Turbine
GWP Global Warming Potential
HMR Heavy Mixed Refrigerant
IAC Inlet Air Chilling
IEMS Integrated Environmental Management System
IPCC Intergovernmental Panel on Climate Change
JI Joint Implementation
LMR Light Mixed Refrigerant
LNG Liquefied Natural Gas
LULUCF Land Use, Land Use Change and Forestry
MOF Materials Offloading Facility
NGA Australia’s National Greenhouse Accounts
NGER National Greenhouse and Energy Reporting
OECD Organisation for Economic Co-operation and Development
Off-gas Gas generated when the LNG is expanded
PNG LNG Papua New Guinea LNG
QCLNG Queensland Curtis LNG
QGS Queensland Gas Scheme
SESP Smart Energy Savings Program
TWAF Temporary Worker Accommodation Facility
UNFCCC United Nations Framework Convention on Climate Change
USC Ultra Super Critical

3678 C1-04 Coffey Arrow LNG - FINAL Greenhouse Gas Assessment_v6.docx vii Arrow LNG Plant– Greenhouse Assessment Coffey Environments on behalf of Arrow Energy | PAEHolmes Job 3678C
TABLE OF CONTENTS
ES1 EXECUTIVE SUMMARY IV
ES2 GLOSSARY VI
1 INTRODUCTION 13 1.1 Proponent 13 1.2 Arrow LNG Plant 13
1.2.1 LNG Plant 13 1.2.2 Feed Gas Pipeline 17 1.2.3 Dredging 18
1.3 Objectives of Study 18
2 LEGISLATIVE CONTEXT OF THE ASSESSMENT 20 2.1 International Framework 20
2.1.1 Intergovernmental Panel on Climate Change 20 2.1.2 United Nations Framework Convention on Climate Change (UNFCCC) 20 2.1.3 Kyoto Protocol 21 2.1.4 International Agreement Post-Kyoto 22
2.2 Australian Context 22 2.2.1 Australia and the Kyoto Protocol 22 2.2.2 The National Greenhouse and Energy Reporting Act (NGER Act) 23 2.2.3 Energy Efficiency Opportunities Program 24 2.2.4 The Clean Energy Legislative Package 24 2.2.5 Proposed Legislation - The Coalition’s Direct Action Plan 26 2.2.6 Australian Context Post-Kyoto 27
2.3 Queensland Greenhouse Policy 27 2.3.1 Smart Energy Savings Program 28 2.3.2 Queensland Gas Scheme 28
2.4 Summary of Relevant Policies 29
3 EXISTING ENVIRONMENT 30 3.1 Australia’s Greenhouse Gas Inventory 30
4 GREENHOUSE GAS EMISSION ESTIMATION METHODOLOGY 32 4.1 Emission Estimating Methods 32
4.1.1 Introduction 32 4.1.2 The Greenhouse Gas Protocol 32 4.1.3 National Greenhouse and Energy Reporting (Measurement) Determination 2008 (and Amendment) 34 4.1.4 National Greenhouse Accounts Factors 35
5 FORECASTED GREENHOUSE GAS EMISSION ESTIMATES FOR THE ARROW LNG PLANT 36 5.1 Summary of Activities 37 5.2 Construction Emissions 38 5.3 Operational Emissions 41 5.4 Annual Summary of Emissions 44
6 IMPACT OF GREENHOUSE GAS EMISSIONS FROM ARROW LNG PLANT 46 6.1 Potential Impacts 46 6.2 Residual Impacts 47
7 BENCHMARKING LIQUIEFIED NATURAL GAS 48 7.1 Emissions per GJ Heat Produced from Combustion 48 7.2 Emissions per MWh Electricity Sent Out 49
8 AVOIDANCE, MITIGATION AND MANAGEMENT MEASURES 50 8.1 Avoidance 51
8.1.1 Power Generation 51

3678 C1-04 Coffey Arrow LNG - FINAL Greenhouse Gas Assessment_v6.docx viii Arrow LNG Plant– Greenhouse Assessment Coffey Environments on behalf of Arrow Energy | PAEHolmes Job 3678C
8.1.2 Renewable Energy 51 8.1.3 Carbon Capture and Storage 51 8.1.4 Fugitive Losses 51 8.1.5 Gas Processing and Compression Emissions 52 8.1.6 Comparison with Best Available Technology 52
8.2 Emissions Offsetting Opportunities 55 8.3 Emissions Trading 55
9 GREENHOUSE GAS AND ENERGY MANAGEMENT PLAN 56 9.1 Arrow Energy’s Policies 56
9.1.1 Voluntary Initiatives 56 9.1.2 Mandatory Reporting 56
10 CONCLUSIONS 57
11 REFERENCES 59
APPENDIX A A-1 A.1 Scope 1 Emissions – Construction A-1
A.1.1 Fuel Combustion – Diesel for Stationary Energy and Construction Vehicles A-1 A.1.2 Fuel Combustion - Diesel for Transport Energy A-3
A.1.2.1 Marine Vessels - Dredging Equipment A-3 A.1.2.2 Marine Vessels - Tug Boats A-5
A.1.3 Fuel Combustion - Fuel Oil for Transport Energy A-7 A.1.3.1 Passenger Marine Vessels – Fast Cats A-7 A.1.3.2 Passenger/Vehicles Marine Vessels – Ro-Pax A-8 A.1.3.3 Vegetation Clearing A-11
A.2 Scope 1 Emissions – Operation A-12 A.2.1 Fuel Combustion – CSG for Stationary Energy A-12 A.2.2 Fuel Combustion - Diesel for Transport Energy A-15
A.2.2.1 Marine Vessels - Tug Boats A-15 A.2.2.2 Vehicles A-18
A.2.3 Fuel Combustion - Fuel Oil for Transport Energy A-20 A.2.3.1 Passenger Marine Vessels – Fast Cats A-20 A.2.3.2 Passenger/Vehicles Marine Vessels – Ro-Pax A-22
A.2.4 Fugitive Emissions - Venting from the Acid Gas Removal Unit A-24 A.2.5 Fugitive Emissions – Process Flaring A-26
A.2.5.1 Fugitive Emissions - Start-Up Flaring A-26 A.2.5.2 Fugitive Emissions - Pilot Lights Flaring & Maintenance Flaring A-28
A.2.6 Fugitive Emissions – Facility-Level Fugitives & Transmission A-30 A.2.6.1 Facility-Level Fugitives A-30 A.2.6.2 Transmission A-32
A.3 Scope 2 Emissions A-33 A.3.1.1 Construction A-34 A.3.1.2 Operations A-34
A.4 Scope 3 Emissions – Construction & Operation A-35 A.4.1 Full Fuel Cycles A-35 A.4.2 End Use of LNG A-37
APPENDIX B B-1
APPENDIX C C-1
APPENDIX D D-1

3678 C1-04 Coffey Arrow LNG - FINAL Greenhouse Gas Assessment_v6.docx ix Arrow LNG Plant– Greenhouse Assessment Coffey Environments on behalf of Arrow Energy | PAEHolmes Job 3678C
LIST OF TABLES
Table 1: NGER Reporting Thresholds ................................................................................. 24
Table 2: Summary of Greenhouse Gas Emissions Policies Relevant to Arrow LNG Plant ............. 29
Table 3: Estimates of Greenhouse Emissions ...................................................................... 30
Table 4: Australian Greenhouse Emissions 1990 and 2007 Kyoto Baseline by Sector ................ 31
Table 5: Scope 1 Greenhouse Gas Emission Sources ........................................................... 33
Table 6: Scope 3 Greenhouse Gas Emission Sources ........................................................... 34
Table 7: Activities Associated with the Project .................................................................... 37
Table 8: Annual Forecast Greenhouse Gas Emissions Associated with Construction Activities – “All Mechanical” Scenario ................................................................................. 39
Table 9: Annual Forecast Greenhouse Gas Emissions Associated with Construction Activities – “All Electrical” Scenario .................................................................................... 40
Table 10: Annual Forecast Greenhouse Gas Emissions Associated with Operational Activities – “All Mechanical” Scenario (4 LNG Trains) ......................................................... 42
Table 11: Annual Forecast Greenhouse Gas Emissions Associated with Operational Activities - “All Electrical” Scenario (4 LNG Trains) ............................................................... 43
Table 12: Greenhouse Emissions by Scope Associated with Arrow LNG Plant ........................... 45
Table 13: Estimates of Greenhouse Emissions .................................................................... 46
Table 14: Emissions per MWh of Electricity Sent Out ........................................................... 49
Table 15: Measures to Reduce Greenhouse Gas Emissions Intensity ...................................... 50
Table 16: Potential Avoidance Options .............................................................................. 52
Table 17: Energy Content Factor and Emission Factors Associated with Diesel Combusted for Construction Activities .................................................................................... A-1
Table 18: Data Input Associated with Diesel Combusted for Construction Activities ................. A-2
Table 19: Greenhouse Gas Emissions Associated with Diesel Combusted for Construction Activities ...................................................................................................... A-2
Table 20: Energy Content Factor and Emission Factors Associated with Diesel Combusted in Dredging Equipment ....................................................................................... A-4
Table 21: Data Input Associated with Diesel Combusted in Dredging Equipment ..................... A-4
Table 22: Greenhouse Gas Emissions Associated with Diesel Combusted in Dredging Equipment .................................................................................................... A-4
Table 23: Energy Content Factor and Emission Factors Associated with Diesel Combusted in Tug Boats for Bulk Materials Movement ............................................................. A-5
Table 24: Data Input Associated with Diesel Combusted in Tug Boats for Bulk Materials Movement .................................................................................................... A-6
Table 25: Greenhouse Gas Emissions Associated with Diesel Combusted in Tug Boats for Bulk Materials Movement ....................................................................................... A-6
Table 26: Energy Content Factor and Emission Factors Associated with Fuel Oil Combusted in Passenger Marine Vessels ............................................................................... A-7
Table 27: Data Input Associated with Fuel Oil Combusted in Passenger Marine Vessels ........... A-8
Table 28: Greenhouse Gas Emissions Associated with Fuel Oil Combusted in Passenger Marine Vessels .............................................................................................. A-8
Table 29: Energy Content Factor and Emission Factors Associated with Fuel Oil Combusted in Passenger/Vehicle Marine Vessels .................................................................... A-9

3678 C1-04 Coffey Arrow LNG - FINAL Greenhouse Gas Assessment_v6.docx x Arrow LNG Plant– Greenhouse Assessment Coffey Environments on behalf of Arrow Energy | PAEHolmes Job 3678C
Table 30: Data Input Associated with Fuel Oil Combusted in Passenger/Vehicle Marine Vessels ......................................................................................................... A-9
Table 31: Greenhouse Gas Emissions Associated with Fuel Oil Combusted in Passenger/Vehicle Marine Vessels .................................................................. A-10
Table 32: Vegetation Clearance Emission Factors and Areas Cleared ................................... A-11
Table 33: Additional Constants Required for CO2 Site-Specific Emissions Factor Estimation .... A-13
Table 34: Energy Content Factor and Emission Factors Associated with Gas Combusted in Stationary Engines ....................................................................................... A-14
Table 35: Activity Data Used to Estimate the Amount of Gas Combusted in Stationary Engines ...................................................................................................... A-14
Table 36: Greenhouse Gas Emissions Associated with Gas Combusted in Stationary Engines .. A-14
Table 37: Energy Content Factor and Emission Factors Associated with Diesel Combusted in Tug Boats for Bulk Materials and LNG Movement .............................................. A-15
Table 38: Data Inputs Associated with Diesel Combusted in Tug Boats for Bulk Materials and LNG Movements .......................................................................................... A-17
Table 39: Greenhouse Gas Emissions Associated with Diesel Combusted in Tug Boats for Bulk Materials and LNG Movements ....................................................................... A-17
Table 40: Energy Content Factor and Emission Factors Associated with Diesel Combusted in Vehicles for Personnel Transport .................................................................... A-19
Table 41: Data Input Associated with Diesel Combusted in Vehicles for Personnel Transport .. A-19
Table 42: Greenhouse Gas Emissions Associated with Diesel Combusted in Vehicles for Personnel Transport ..................................................................................... A-19
Table 43: Energy Content Factor and Emission Factors Associated with Fuel Oil Combusted in Passenger Marine Vessels ............................................................................. A-20
Table 44: Data Input Associated with Fuel Oil Combusted in Passenger Marine Vessels ......... A-21
Table 45: Greenhouse Gas Emissions Associated with Fuel Oil Combusted in Passenger Marine Vessels ............................................................................................ A-21
Table 46: Energy Content Factor and Emission Factors Associated with Fuel Oil Combusted in Passenger/Vehicle Marine Vessels .................................................................. A-22
Table 47: Data Input Associated with Fuel Oil Combusted in Passenger/Vehicle Marine Vessels ....................................................................................................... A-23
Table 48: Greenhouse Gas Emissions Associated with Fuel Oil Combusted in Passenger/Vehicle Marine Vessels .................................................................. A-23
Table 49: Data Input Associated with Venting from the AGRU ............................................ A-25
Table 50: Greenhouse Gas Emissions Associated with Venting from the AGRU ..................... A-25
Table 51: Energy Content Factor and Emission Factors Associated with Start-Up Flaring ........ A-26
Table 52: Data Input Associated with CSG Start-Up Flaring ............................................... A-27
Table 53: Greenhouse Gas Emissions Associated with CSG Start-Up Flaring ......................... A-27
Table 54: Energy Content Factor and Emission Factors Associated with Process CSG Flaring .. A-28
Table 55: Data Input Associated with Process CSG Flaring ................................................ A-29
Table 56: Greenhouse Gas Emissions Associated with Process CSG Flaring .......................... A-29
Table 57: Data Inputs for General Leaks Site-Specific Emission Factor Estimation (API, 2009) A-30
Table 58: General Leaks Estimation Methods Comparison ................................................. A-31
Table 59: Data Input Associated with Facility-Level Leaks from Gas Processing Plants ........... A-31

3678 C1-04 Coffey Arrow LNG - FINAL Greenhouse Gas Assessment_v6.docx xi Arrow LNG Plant– Greenhouse Assessment Coffey Environments on behalf of Arrow Energy | PAEHolmes Job 3678C
Table 60: Greenhouse Gas Emissions Associated with Facility-Level Leaks from Gas Processing Plants ......................................................................................... A-31
Table 61: Emission Factors Associated with CSG Transmission ........................................... A-32
Table 62: Data Input Associated with CSG Transmission ................................................... A-32
Table 63: Greenhouse Gas Emissions Associated with CSG Transmission ............................. A-32
Table 64: Energy Content Factor and CO2 Emission Factor of Electricity Purchased from the Grid in Queensland ...................................................................................... A-33
Table 65: Data Input Associated with Electricity Purchased from the Grid during Construction A-34
Table 66: Emissions of Scope 2 CO2 and Energy Consumed from Electricity Purchased from the Grid in Queensland during Construction ..................................................... A-34
Table 67: Data Input Associated with Electricity Purchased from the Grid and Energy Consumed during Operation .......................................................................... A-34
Table 68: Scope 2 Emissions Associated with Electricity Purchased from the Grid in Queensland during Operation ........................................................................ A-34
Table 69: Energy Content Factor and Scope 3 Emission Factors Associated with Full Fuel Cycles ........................................................................................................ A-36
Table 70: Data Input Associated with Full Fuel Cycles ....................................................... A-36
Table 71: Scope 3 Emissions Associated with Upstream Activities - Full Fuel Cycles of Diesel, Fuel Oil and Electricity (Excluding CSG) ........................................................... A-37
Table 72: Energy Content Factor and Scope 3 Emission Factors Associated with End-Use of LNG ........................................................................................................... A-38
Table 73: Data Input Associated with End-Use of LNG ...................................................... A-38
Table 74: Scope 3 Greenhouse Gas Emissions Associated with End-Use of LNG .................... A-38
Table 75: Garnaut Target Emissions for 2020 and 2050 for Australia .................................... B-2
Table 76: Climate Change Impacts Predicted by the Garnaut Review .................................... B-3
Table 77: Terms of Reference Cross Reference Table for the Greenhouse Gas Assessment Technical Study ............................................................................................. D-2
LIST OF FIGURES
Figure 1: Emissions per GJ of Fuel Combusted ................................................................... 48
Figure 2: Greenhouse Gas Emission Intensity of LNG Facilities .............................................. 54

3678 C1-04 Coffey Arrow LNG - FINAL Greenhouse Gas Assessment_v6.docx xii Arrow LNG Plant– Greenhouse Assessment Coffey Environments on behalf of Arrow Energy | PAEHolmes Job 3678C

3678 C1-04 Coffey Arrow LNG - FINAL Greenhouse Gas Assessment_v6.docx 13 Arrow LNG Plant Project – Greenhouse Assessment Coffey Environments on behalf of Arrow Energy | PAEHolmes Job 3678C
1 INTRODUCTION
1.1 Proponent
Arrow CSG (Australia) Pty Ltd (Arrow Energy) proposes to develop a liquefied natural gas (LNG) facility on Curtis Island off the central Queensland coast near Gladstone. The project, known as the Arrow LNG Plant, is a component of the larger Arrow LNG Project.
The proponent is a subsidiary of Arrow Energy Holdings Pty Ltd which is wholly owned by a joint venture between Royal Dutch Shell plc and PetroChina Company Limited.
1.2 Arrow LNG Plant
Arrow Energy proposes to construct the Arrow LNG Plant in the Curtis Island Industry Precinct at the southwestern end of Curtis Island, approximately 6 km north of Gladstone and 85 km southeast of Rockhampton, off Queensland’s central coast. In 2008, approximately 10% of the southern part of the island was added to the Gladstone State Development Area to be administered by the Queensland Department of Local Government and Planning. Of that area, approximately 1,500 ha (25%) has been designated as the Curtis Island Industry Precinct and is set aside for LNG development. The balance of the Gladstone State Development Area on Curtis Island has been allocated to the Curtis Island Environmental Management Precinct, a flora and fauna conservation area.
The Arrow LNG Plant will be supplied with coal seam gas from gas fields in the Surat and Bowen basins via high-pressure gas pipelines to Gladstone, from which a feed gas pipeline will provide gas to the LNG plant on Curtis Island. A tunnel is proposed for the feed gas pipeline crossing of Port Curtis.
The project is described below in terms of key infrastructure components: LNG plant, feed gas pipeline and dredging.
1.2.1 LNG Plant
Overview. The LNG plant will have a base-case capacity of 16 Mtpa, with a total plant capacity of up to 18 Mtpa. The plant will consist of four LNG trains, each with a nominal capacity of 4 Mtpa. The project will be undertaken in two phases of two trains (nominally 8 Mtpa), with a financial investment decision process for each phase. Report emissions are based on 18 Mtpa LNG case.
Operations infrastructure associated with the LNG plant includes the LNG trains (where liquefaction occurs; see ‘Liquefaction Process’ below), LNG storage tanks, cryogenic pipelines, seawater inlet for desalination and stormwater outlet pipelines, water and wastewater treatment, a 110 m high flare stack, power generators (see ‘LNG Plant Power’ below), administrative buildings and workshops.
Construction infrastructure associated with the LNG plant includes construction camps (see ‘Workforce Accommodation’ below), a concrete batching plant and laydown areas.
The plant will also require marine infrastructure for the transport of materials, personnel and product (LNG) during construction and operations (see ‘Marine Infrastructure’ below).
Construction Schedule. The plant will be constructed in two phases. Phase 1 will involve the construction of LNG trains 1 and 2, two LNG storage tanks (each with a capacity of between 120,000 m3 and 180,000 m3), Curtis Island construction camp and, if additional capacity is

3678 C1-04 Coffey Arrow LNG - FINAL Greenhouse Gas Assessment_v6.docx 14 Arrow LNG Plant Project – Greenhouse Assessment Coffey Environments on behalf of Arrow Energy | PAEHolmes Job 3678C
required, a mainland workforce accommodation camp. Associated marine infrastructure will also be required as part of Phase 1. Phase 2 will involve the construction of LNG trains 3 and 4 and potentially a third LNG storage tank. Construction of Phase 1 is scheduled to commence in 2014 with train 1 producing the first LNG cargo in 2017. Construction of Phase 2 is anticipated to commence approximately five years after the completion of Phase 1 but will be guided by market conditions and a financial investment decision at that time.
Construction Method. The LNG plant will generally be constructed using a modular construction method, with preassembled modules being transported to Curtis Island from an offshore fabrication facility. There will also be a substantial stick-built component of construction for associated infrastructure such as LNG storage tanks, buildings, underground cabling, piping and foundations. Where possible, aggregate for civil works will be sourced from suitable material excavated and crushed on site as part of the bulk earthworks. Aggregate will also be sourced from mainland quarries and transported from the mainland launch site to the plant site by roll-on, roll-off vessels. A concrete batching plant will be established on the plant site. Bulk cement requirements will be sourced outside of the batching plant and will be delivered to the site by roll-on roll-off ferries or barges from the mainland launch site.
1.2.1.1 LNG Plant Power
Power for the LNG plant and associated site utilities may be supplied from the electricity grid (mains power), gas turbine generators, or a combination of both, leading to four configuration options that will be assessed:
Base case (mechanical drive): The mechanical drive configuration uses gas turbines to drive the LNG train refrigerant compressors, which is the traditional powering option for LNG facilities. This configuration would use coal seam gas and end flash gas (produced in the liquefaction process) to fuel the gas turbines that drive the LNG refrigerant compressors and the gas turbine generators that supply electricity to power the site utilities. Construction power for this option would be provided by diesel generators.
Option 1 (mechanical/electrical – construction and site utilities only): This configuration uses gas turbines to drive the refrigerant compressors in the LNG trains. During construction, mains power would provide power to the site via a cable (30-MW capacity) from the mainland. The proposed capacity of the cable is equivalent to the output of one gas turbine generator. The mains power cable would be retained to power the site utilities during operations, resulting in one less gas turbine generator being required than the proposed base case.
Option 2 (mechanical/electrical): This configuration uses gas turbines to drive the refrigerant compressors in the LNG trains and mains power to power site utilities. Under this option, construction power would be supplied by mains power or diesel generators.
Option 3 (all electrical): Under this configuration mains power would be used to supply electricity for operation of the LNG train refrigerant compressors and the site utilities. A switchyard would be required. High-speed electric motors would be used to drive the LNG train refrigerant compressors. Construction power would be supplied by mains power or diesel generators.
1.2.1.2 Liquefaction Process
The coal seam gas enters the LNG plant where it is metered and split into two pipe headers which feed the two LNG trains. With the expansion to four trains the gas will be split into four LNG trains.

3678 C1-04 Coffey Arrow LNG - FINAL Greenhouse Gas Assessment_v6.docx 15 Arrow LNG Plant Project – Greenhouse Assessment Coffey Environments on behalf of Arrow Energy | PAEHolmes Job 3678C
For each LNG train, the coal seam gas is first treated in the acid gas removal unit where the carbon dioxide and any other acid gases are removed. The gas is then routed to the dehydration unit where any water is removed and then passed through a mercury guard bed to remove mercury. The coal seam gas is then ready for further cooling and liquefaction.
A propane, precooled, mixed refrigerant process will be used by each LNG train to liquefy the predominantly methane coal seam gas. The liquefaction process begins with the propane cycle. The propane cycle involves three pressure stages of chilling to pre-cool the coal seam gas to -33°C and to compress and condense the mixed refrigerant, which is a mixture of nitrogen, methane, ethylene and propane. The condensed mixed refrigerant and precooled coal seam gas are then separately routed to the main cryogenic heat exchanger, where the coal seam gas is further cooled and liquefied by the mixed refrigerant. Expansion of the mixed refrigerant within the heat exchanger removes heat from the coal seam gas. This process cools the coal seam gas from -33°C to approximately -157°C. At this temperature the coal seam gas is liquefied (LNG) and becomes 1/600th of its original volume. The expanded mixed refrigerant is continually cycled to the propane precooler and reused.
LNG is then routed from the end flash gas system to a nitrogen stripper column which is used to separate nitrogen from the methane, reducing the nitrogen content of the LNG to less than 1 mole per cent (mol%). LNG separated in the nitrogen stripper column is pumped for storage on site in full containment storage tanks where it is maintained at a temperature of -163°C.
A small amount of off-gas is generated from the LNG during the process. This regasified coal seam gas is routed to an end flash gas compressor where it is prepared for use as fuel gas.
Finally, the LNG is transferred from the storage tanks onto LNG carriers via cryogenic pipelines and loading arms for transportation to export markets. The LNG will be regasified back into sales specification gas on shore at its destination location.
1.2.1.3 Workforce Accommodation
The LNG plant (Phase 1), tunnel, feed gas pipeline, and dredging components of the project each have their own workforces with peaks occurring at different stages during construction. The following peak workforces are estimated for the project:
LNG plant Phase 1 peak workforce of 3,500, comprising 3,000 construction workers: 350 engineering, procurement and construction (EPC) management workers and 150 Arrow Energy employees.
Tunnel peak workforce of up to 100.
Feed gas pipeline (from the mainland to Curtis Island) peak workforce of up to 75.
A dredging peak workforce of between 20 and 40.
Two workforce construction camp locations are proposed: the main construction camp at Boatshed Point on Curtis Island, and a possible mainland overflow construction camp, referred to as a temporary workers accommodation facility (TWAF). Two potential locations are currently being considered for the mainland TWAF; in the vicinity of Gladstone city on the former Gladstone Power Station ash pond No.7 (TWAF7) or in the vicinity of Targinnie on a primarily cleared pastoral grazing lot (TWAF8). Both potential TWAF sites include sufficient space to accommodate camp infrastructure and construction laydown areas. The TWAF and its associated construction laydown areas will be decommissioned on completion of the Phase 1 works.
Of the 3,000 construction workers for the LNG plant, it is estimated that between 5% and 20% will be from the local community (and thus will not require accommodation) and that the

3678 C1-04 Coffey Arrow LNG - FINAL Greenhouse Gas Assessment_v6.docx 16 Arrow LNG Plant Project – Greenhouse Assessment Coffey Environments on behalf of Arrow Energy | PAEHolmes Job 3678C
remaining fly-in, fly-out workers will be accommodated in construction camps. An additional 350 EPC management and 150 Arrow Energy employees are expected to relocate to Gladstone with the majority housed in company facilitated accommodation.
The tunnel workforce of 100 people and gas pipeline workforce of 75 people are anticipated to be accommodated in the mainland in company facilitated accommodation. The dredging workforce of 20 to 40 workers will be housed onboard the dredge vessel.
Up to 2,500 people will be housed at the Boatshed Point construction camp on Curtis Island. Its establishment will be preceded by a pioneer camp at the same locality which will evolve into the completed construction camp.
1.2.1.4 Marine Infrastructure
Marine facilities include the LNG jetty, materials offloading facility (MOF), personnel jetty and mainland launch site.
LNG Jetty. LNG will be transferred from the storage tanks on the site to the LNG jetty via above ground cryogenic pipelines. Loading arms on the LNG jetty will deliver the product to an LNG carrier. The LNG jetty will be located in North China Bay, adjacent to the northwest corner of Hamilton Point.
MOF. Delivery of materials to the site on Curtis Island during the construction and operations phases will be facilitated by a MOF where roll-on, roll-off or lift-on, lift-off vessels will dock to unload preassembled modules, equipment, supplies and construction aggregate. The MOF will be connected to the LNG plant site via a heavy-haul road.
Boatshed Point (MOF 1) is the base-case MOF option and would be located at the southern tip of Boatshed Point. The haul road would be routed along the western coastline of Boatshed Point (abutting the construction camp to the east) and enters the LNG Plant site at the southern boundary. A quarantine area will be located south of the LNG plant and will be accessed via the northern end of the haul road.
Two alternative options are being assessed, should the Boatshed Point option be determined to be not technically feasible:
South Hamilton Point (MOF 2): This MOF option would be located at the southern tip of Hamilton Point. The haul road from this site would traverse the saddle between the hills of Hamilton Point to the southwest boundary of the LNG plant site. The quarantine area for this option will be located southwest of the LNG plant near the LNG storage tanks.
North Hamilton Point (MOF 3): This option involves shared use of the MOF being constructed for the Santos Gladstone LNG Project (GLNG Project) on the northwest side of Hamilton Point (south of Arrow Energy’s proposed LNG jetty). The GLNG Project is also constructing a passenger terminal at this site, but it will not be available to Arrow Energy contractors and staff. The quarantine area for this option would be located to the north of the MOF. The impacts of construction and operation of this MOF option and its associated haul road were assessed as part of the GLNG Project and will not be assessed in this EIS.
Personnel Jetty. During the peak of construction, base case of up to 1,100 people may require transport to Curtis Island from the mainland on a daily basis. A personnel jetty will be constructed at the southern tip of Boatshed Point to enable the transfer of workers from the mainland launch site to Curtis Island by high-speed vehicle catamarans (Fastcats) and vehicle or passenger ferries (ROPAX). This facility will be adjacent to the MOF constructed at Boatshed Point. The haul road will be used to transport workers to and from the personnel jetty to the

3678 C1-04 Coffey Arrow LNG - FINAL Greenhouse Gas Assessment_v6.docx 17 Arrow LNG Plant Project – Greenhouse Assessment Coffey Environments on behalf of Arrow Energy | PAEHolmes Job 3678C
construction camp and LNG plant site. A secondary access for pedestrians will be provided between the personnel jetty and the construction camp.
Mainland Launch Site. Materials and workers will be transported to Curtis Island via the mainland launch site. The mainland launch site will contain both a passenger terminal and a roll-on, roll-off facility. The passenger terminal will include a jetty and transit infrastructure, such as amenities, waiting areas and car parking. The barge or roll-on ,roll-off facility will have a jetty, associated laydown areas, workshops and storage sheds.
The two location options for the mainland launch site are:
Launch site 1: This site is located north of Gladstone city near the mouth of the Calliope River, adjacent to the existing RG Tanna coal export terminal.
Launch site 4N: This site is located at the northern end of the proposed reclamation area for the Fishermans Landing Northern Expansion Project, which is part of the Port of Gladstone Western Basin Master Plan. The availability of this site will depend on how far progressed the Western Basin Dredging and Disposal Project is at the time of construction.
1.2.2 Feed Gas Pipeline
An approximately 8-km long feed gas pipeline will supply gas to the LNG plant from its connection to the Arrow Surat Pipeline (formerly the Surat Gladstone Pipeline) on the mainland adjacent to Rio Tinto’s Yarwun alumina refinery. The feed gas pipeline will be constructed in three sections:
A short length of feed gas pipeline will run from the proposed Arrow Surat Pipeline to the tunnel launch shaft, which will be located on a mudflat south of Fishermans Landing, just south of Boat Creek. This section of pipeline will be constructed using conventional open-cut trenching methods within a 40-m wide construction right of way.
The next section of the feed gas pipeline will traverse Port Curtis harbour in a tunnel to be bored under the harbour from the mainland tunnel launch shaft to a receival shaft on Hamilton Point. The tunnel under Port Curtis will have an excavated diameter of up to approximately 6 m and will be constructed by a tunnel boring machine that will begin work at the mainland launch shaft. Tunnel spoil material will be processed through a de-sanding plant to remove the bentonite and water and will comprise mainly a finely graded fill material, which will be deposited in a spoil placement area established within bund walls constructed adjacent to the launch shaft. Based on the excavated diameter, approximately 223,000 m3 of spoil will be treated as required for acid sulfate soil and re-used as fill at this location.
From the tunnel receival shaft on Hamilton Point, the remaining section of the feed gas pipeline will run underground to the LNG plant, parallel to the above ground cryogenic pipelines. This section will be constructed using conventional open-cut trenching methods within a 30-m wide construction right of way.
Should one of the electrical plant power options be chosen, it is intended that a power connection will be provided by a third party to the tunnel launch shaft, whereby Arrow Energy would construct a power cable within the tunnel to the LNG plant.
Other infrastructure, such as communication cables, water and wastewater pipelines, may also be accommodated within the tunnel.

3678 C1-04 Coffey Arrow LNG - FINAL Greenhouse Gas Assessment_v6.docx 18 Arrow LNG Plant Project – Greenhouse Assessment Coffey Environments on behalf of Arrow Energy | PAEHolmes Job 3678C
1.2.3 Dredging
Dredging required for LNG shipping access and swing basins has been assessed under the Gladstone Ports Corporation’s Port of Gladstone Western Basin Dredging and Disposal Project. Additional dredging within the marine environment of Port Curtis may be required to accommodate the construction and operation of the marine facilities. Up to five sites may require dredging:
Dredge site 1 (dredge footprint for launch site 1): The dredging of this site would facilitate the construction and operation of launch site 1. This dredge site is located in the Calliope River and extends from the intertidal area abutting launch site 1, past Mud Island to the main shipping channel. The worst-case dredge volume estimated at this site is approximately 900,000 m3.
Dredge site 2 (dredge footprint for launch site 4N): The dredging of this site would facilitate the construction and operation of launch site 4N. This dredge site would abut launch site 4N and extend east from the launch site to the shipping channel. The worst-case dredge volume identified at this site is approximately 2,500 m3.
Dredge site 3 (dredge footprint for Boatshed Point MOF 1): The dredging of this site would facilitate the construction and operation of the personnel jetty and MOF at Boatshed Point. This dredge site would encompass the area around the marine facilities, providing adequate depth for docking and navigation. The worst-case dredge volume identified at this site is approximately 50,000 m3.
Dredge site 4 (dredge footprint for Hamilton Point South MOF 2): The dredging of this site would facilitate the construction and operation of the MOF at Hamilton Point South. This dredge site would encompass the area around the marine facilities, providing adequate depth for docking and navigation. The worst-case dredge volume identified at this site is approximately 50,000 m3.
Dredge site 5 (dredge footprint for LNG jetty): The dredging of this site will facilitate the construction of the LNG jetty at Hamilton Point. This dredge site extends from the berth pocket to be dredged as part of the Western Basin Strategic Dredging and Disposal Project to the shoreline and is required to enable a work barge to assist with construction of the jetty. The worst-case dredge volume identified is approximately 120,000 m3.
The spoil generated by dredging activities will be placed and treated for acid sulfate soils (as required) in the Port of Gladstone Western Basin Dredging and Disposal Project reclamation area.
1.3 Objectives of Study
The primary objectives of this study are to estimate the greenhouse gas emissions resulting from the construction and operation of the Arrow LNG Plant, identify methods to reduce or mitigate those emissions and comment on the potential impact of these emissions with respect to climate change. Impacts have been assessed in line with the Final Terms of Reference for the Shell Australia LNG (now Arrow Energy) EIS.
The following tasks formed the scope of work of the study and the outcomes of each task are included in this report:
Fulfil the requirements of the Final Terms of Reference for the Shell Australia LNG (now Arrow Energy) EIS, as issued by the Coordinator General, January 2010.
Identify and review relevant international, federal and state greenhouse gas and climate change related policies.

3678 C1-04 Coffey Arrow LNG - FINAL Greenhouse Gas Assessment_v6.docx 19 Arrow LNG Plant Project – Greenhouse Assessment Coffey Environments on behalf of Arrow Energy | PAEHolmes Job 3678C
Identify worst case scenarios based on the project description (i.e., base case all mechanical, option 1 mechanical/electrical – construction and site utilities only, option 2 mechanical electrical, and option 3 all electrical).
Collate anticipated emissions of greenhouse gases from project activities (construction activities, operation and maintenance, and decommissioning and rehabilitation) in an inventory of projected annual emissions for each relevant greenhouse gas, with total emissions expressed in ‘CO2 equivalent’.
Estimate emissions of greenhouse gases from upstream activities, which includes the extraction and processing of CSG to produce compressed CSG, and off-site electricity generation from fossil fuels.
Compare emissions to global, national and state totals.
Identify and describe measures to avoid, reduce, mitigate and manage greenhouse gas emissions for project activities, and describe how these measures would be implemented, monitored and audited.
Assess residual and cumulative impacts of greenhouse gases arising from project activities with respect to identified issues, taking into account implemented mitigation measures and relevant assessment frameworks.

3678 C1-04 Coffey Arrow LNG - FINAL Greenhouse Gas Assessment_v6.docx 20 Arrow LNG Plant Project – Greenhouse Assessment Coffey Environments on behalf of Arrow Energy | PAEHolmes Job 3678C
2 LEGISLATIVE CONTEXT OF THE ASSESSMENT
This section identifies the key international, federal and state government policies and laws regulating greenhouse gas emissions, and the prescribed methods and factors for estimating greenhouse gas emissions.
2.1 International Framework
2.1.1 Intergovernmental Panel on Climate Change
The Intergovernmental Panel on Climate Change (IPCC) is a panel established in 1988 by the World Meteorological Organisation and the United Nations Environment Programme, to provide independent scientific advice on climate change. The panel was asked to prepare, based on available scientific information, a report on all aspects relevant to climate change and its impacts and to formulate realistic response strategies. This first assessment report of the IPCC served as the basis for negotiating the United Nations Framework Convention on Climate Change (UNFCCC) (IPCC, 2004).
The IPCC also produce a variety of guidance documents and recommended methodologies for greenhouse emissions inventories, including:
2006 IPCC Guidelines for National Greenhouse Gas Inventories; and
Good Practice Guidance and Uncertainty Management in National Greenhouse Gas Inventories (2000).
Since the UNFCCC entered into force in 1994, the IPCC remains the pivotal source for scientific and technical information relevant to climate change and greenhouse emissions.
The IPCC operates under the following mandate: “to provide the decision-makers and others interested in climate change with an objective source of information about climate change. The IPCC does not conduct any research nor does it monitor climate-related data or parameters. Its role is to assess on a comprehensive, objective, open and transparent basis the latest scientific, technical and socio-economic literature produced worldwide, relevant to the understanding of the risk of human-induced climate change, its observed and projected impacts and options for adaptation and mitigation. IPCC reports should be neutral with respect to policy, although they need to deal objectively with policy relevant scientific, technical and socio economic factors. They should be of high scientific and technical standards, and aim to reflect a range of views, expertise and wide geographical coverage” (Copenhagen Climate Council, 2011).
The stated aims of the IPCC are to assess scientific information relevant to:
human-induced climate change;
the impacts of human-induced climate change; and
options for adaptation and mitigation.
The IPCC released its fourth assessment report in 2007. IPCC reports are widely cited in climate change debates and policies, and are generally regarded as authoritative.
2.1.2 United Nations Framework Convention on Climate Change (UNFCCC)
The UNFCCC sets an overall framework for intergovernmental efforts to tackle the challenge posed by climate change. It recognises that the climate system is a shared resource, the stability of which can be affected by industrial and other emissions of carbon dioxide and other

3678 C1-04 Coffey Arrow LNG - FINAL Greenhouse Gas Assessment_v6.docx 21 Arrow LNG Plant Project – Greenhouse Assessment Coffey Environments on behalf of Arrow Energy | PAEHolmes Job 3678C
greenhouse gases. The convention enjoys near universal membership, with 172 countries (parties) having ratified the contained treaty, the Kyoto Protocol – see 2.1.3. Australia ratified the Kyoto Protocol in December 2007.
Under the UNFCCC, governments:
gather and share information on greenhouse gas emissions, national policies and best practices;
launch national strategies for addressing greenhouse gas emissions and adapting to expected impacts, including the provision of financial and technological support to developing countries; and
cooperate in preparing for adaptation to the impacts of climate change.
2.1.3 Kyoto Protocol
The Kyoto Protocol entered into force on 16 February 2005.
The Kyoto Protocol builds upon the UNFCCC by committing to individual, legally binding targets to limit or reduce their greenhouse gas emissions. Annex I Parties are countries that were members of the Organisation for Economic Co-operation and Development (OECD) in 1992, plus countries with economies in transition (the EIT Parties), such as Russia. Annex II Parties consist of the OECD members of Annex I, but not the EIT Parties. Non-Annex I Parties are in most cases developing countries.The greenhouse gases included in the Kyoto Protocol are:
carbon dioxide (CO2);
methane (CH4);
nitrous oxide (N2O);
hydrofluorocarbons (HFCs);
perfluorocarbons (PFCs); and
sulfur hexafluoride (SF6).
The emission reduction targets are calculated based on a party’s domestic emission greenhouse inventories (which include the sectors Land Use, Land Use Change and Forestry (LULUCF), Energy, Industrial Processes, etc). Domestic inventories require approval by the Kyoto Enforcement Branch. The Kyoto Protocol requires developed countries to meet national targets for greenhouse gas emissions over a five year period between 2008 and 2012.
To achieve their targets, Annex I Parties must put in place domestic policies and measures. The Kyoto Protocol provides an indicative list of policies and measures that might help mitigate climate change and promote sustainable development.
Under the Kyoto Protocol, developed countries can use a number of flexible mechanisms to assist in meeting their targets. These market mechanisms include:
Joint Implementation (JI) – where developed countries invest in greenhouse gas emission reduction projects in other developed countries; and
Clean Development Mechanism (CDM) – where developed countries (Annex I & II Parties) invest in greenhouse gas emission reduction projects in developing countries (Non-Annex I Parties).

3678 C1-04 Coffey Arrow LNG - FINAL Greenhouse Gas Assessment_v6.docx 22 Arrow LNG Plant Project – Greenhouse Assessment Coffey Environments on behalf of Arrow Energy | PAEHolmes Job 3678C
Annex I countries that fail to meet their emissions reduction targets during the 2008-2012 period may be liable for a 30 percent penalty (additional to the level of exceedance). Countries would have to make up the exceedance plus penalty in the post-2012 commitment period.
2.1.4 International Agreement Post-Kyoto
An international framework for mitigating the impacts of climate change past the Kyoto period was discussed at the 15th United Nations Conference of Parties (COP), Copenhagen, in December 2009. It concluded with an agreement that the global temperature rise should be capped through significant emission reductions by all countries; however no legally binding agreement was ratified. The Copenhagen Accord was drafted and supported by the majority countries, and outlined the following (UNFCCC, 2009):
the global temperature increase should be held below 2°C;
emissions targets for developed countries and actions to reduce emissions by developing countries should be specified;
an international framework for measurement, reporting and verification of greenhouse gas emissions will be developed; and
financial assistance will be provided for developing countries to reduce emissions and adapt to climate change.
Nations went to Copenhagen with national emission reduction targets, both unconditional and dependent on global emission reduction commitments. On 27 January 2010, Australia officially presented its full target range to the Copenhagen Accord. The Accord is not legally binding to the extent of the Kyoto Protocol and the specification of national emissions reduction commitments for the period 2012-2020 will be subject to further negotiation.
At the 16th United Nations COP in Cancún, November - December 2010, the Cancún Agreements were developed. While not legally binding, the Agreements anchor the mitigation pledges made by both developed and developing countries in the Copenhagen Accord under the UNFCCC. This is seen as an important step in securing a new global treaty to replace the Kyoto Protocol after 2012. Other outcomes from the conference include the establishment of a new Green Climate Fund to support developing countries with climate change adaption, as well as technology sharing mechanism.
2.2 Australian Context
2.2.1 Australia and the Kyoto Protocol
Australia submitted its ‘instrument of ratification’ on 12 December 2007. Ratification came into force for Australia on 11 March 2008 following a mandatory 90 day waiting period.
Under the protocol, developed countries are legally required to take domestic action to reduce greenhouse emissions. Each developed country’s target was negotiated and agreed. Australia’s national target is to achieve an average of 108% of 1990 emissions for the five years of the first commitment period (2008-2012). Any new sources that begin emitting during this period will contribute to Australia’s Kyoto target.
The National Greenhouse Gas Inventory 2007 from the Australian Government Department of Climate Change (DCC), now the Department of Climate Change and Energy Efficiency (DCCEE), shows that 2007 emissions were 109.3% of 1990 baseline (refer to Table 4). The DCCEE is projecting that emissions will reduce to an average of 583 Mt CO2-e per annum over 2008-12.

3678 C1-04 Coffey Arrow LNG - FINAL Greenhouse Gas Assessment_v6.docx 23 Arrow LNG Plant Project – Greenhouse Assessment Coffey Environments on behalf of Arrow Energy | PAEHolmes Job 3678C
This is 107 per cent of 1990 levels, meaning that Australia is expected to meet its Kyoto obligations (DCC, 2009a).
The Kyoto Protocol requires Australia to implement a range of monitoring and reporting commitments. Specifically, Australia is required to report its annual greenhouse emissions every year during the 2008 to 2012 commitment period.
2.2.2 The National Greenhouse and Energy Reporting Act (NGER Act)
Federal parliament passed the National Greenhouse and Energy Reporting Act 2007 (the NGER Act) in September 2007 (DCCEE, 2007). The NGER Act establishes a mandatory obligation on corporations which exceed the defined thresholds to report greenhouse gas emissions, energy consumption, energy production and other related information.
The NGER Act is one of a number of legislative instruments related to greenhouse reporting, which together form the National Greenhouse and Energy Reporting (NGER) System, as follows:
The National Greenhouse and Energy Reporting Regulations 2008 (DCC, 2008c) and the National Greenhouse and Energy Reporting Amendment Regulations 2008 (DCC, 2009d) which provide the necessary details that allow compliance with, and administration of, the NGER Act.
The National Greenhouse and Energy Reporting (Measurement) Determination 2008 (DCC, 2008d) and National Greenhouse and Energy Reporting (Measurement) Amendment Determination – Reporting Year 2010-2011 (DCCEE, 2010d) which provides methods and criteria for calculating greenhouse gas emissions and energy data under the NGER Act.
The National Greenhouse and Energy Reporting (Audit) Determination 2009 (DCCEE, 2009e) which sets out the requirements for preparing, conducting and reporting on greenhouse and energy audits.
The NGER Act is seen as an important first step in the establishment of a domestic emissions trading scheme. This intention is explicitly stated in the objectives for the NGER Act, as follows:
establish a baseline of emissions for participants in a future Australian emissions trading scheme;
inform the Australian public;
meet international reporting obligations; and
assist policy formulation of all Australian governments while avoiding duplication of similar reporting requirements.
Corporate and facility reporting thresholds for greenhouse gas emissions and energy consumption or energy production are provided in Table 1. Based on the findings of this study, annual greenhouse gas emissions from Arrow LNG Plant will exceed the NGER facility threshold (refer to Section 5 for emission estimates). Existing Arrow Energy Limited facilities exceeded the corporate thresholds in 2009-2010. Therefore Arrow will be required to report greenhouse gas emissions and energy consumption/production from the Arrow LNG Plant.

3678 C1-04 Coffey Arrow LNG - FINAL Greenhouse Gas Assessment_v6.docx 24 Arrow LNG Plant Project – Greenhouse Assessment Coffey Environments on behalf of Arrow Energy | PAEHolmes Job 3678C
Table 1: NGER Reporting Thresholds
Year Corporate Threshold Facility Threshold
GHG Emissions (kt CO2-e)
Energy Usage (TJ)
GHG Emissions (kt CO2-e)
Energy Usage (TJ)
2008-2009 125 500
25 100 2009-2010 87.5 350
2010-2011 50 200 Source: DCCEE (2007)
2.2.3 Energy Efficiency Opportunities Program
The Energy Efficiency Opportunities (EEO) Program is designed to improve the energy efficiency of large businesses (DRET, 2010). Participation is mandatory for corporations that use more than 0.5 PJ of energy. Participating corporations must assess their energy efficiency, and energy efficiency opportunities with a payback period less than four years, and publicly report the results. This means that if the resulting efficiencies of an identified improvement measure can recover the costs of implementing the program within four years, the initiative must be assessed in detail.
According to Arrow Energy Limited’s latest annual report (Arrow, 2009), the company is currently subject to the reporting requirement of the Energy Efficiency Opportunities Act 2006. Consequently, the Group is required to determine its energy usage in addition to identify, investigate and evaluate energy saving opportunities. The assessments undertaken will then be reported publicly, along with the actions intended to be taken.
2.2.4 The Clean Energy Legislative Package
On 10 July 2011, the Australian Government released its Clean Energy Plan, which incorporates a Carbon Pricing Mechanism. Under this policy, from 1 July 2012, the eligible industries in Australia will be required to pay for every tonne of carbon pollution released to the atmosphere (Australian Government, 2011a). This mechanism has replaced the Carbon Pollution Reduction Scheme (CPRS) put forward by the Australian Government in 2008, which was intended to be the principal mechanism used to reduce Australia’s greenhouse gas emissions for the Kyoto period, and beyond. The centrepiece of the CPRS was a “cap and trade” emissions trading scheme to constrain greenhouse gas emissions and establish a price for greenhouse gas emissions in Australia. On 27 April 2010 the Australian Government announced the deferral of the CPRS implementation date.
Although the framework of the proposed carbon mechanism resembles that proposed in the Green and White Papers (DCCEE, 2008a and DCCEE, 2008b), the carbon price mechanism involves the following distinguishing features:
The carbon price mechanism will consist of two distinct stages. For the first three years, a fixed price stage will operate with the price of all carbon permits set by the government. The carbon price will start at $23 AUD per tonne and rise by 5 % a year (an intended real increase of 2.5% at an expected inflation rate of 2.5%, the mid-point of the RBA inflation target), resulting in a carbon price of $24.15 AUD per tonne in 2013-14 and $25.40 AUD per tonne in 2014-15 (Australian Government, 2011a). During this fixed price period, businesses will be able to acquire as many permits at the set price as required to meet their obligations.
Subsequent to this three year period, a flexible cap and trade emissions trading scheme will commence (refer to Section 2.2.4.1).

3678 C1-04 Coffey Arrow LNG - FINAL Greenhouse Gas Assessment_v6.docx 25 Arrow LNG Plant Project – Greenhouse Assessment Coffey Environments on behalf of Arrow Energy | PAEHolmes Job 3678C
During the fixed price stage, eligible Australian carbon credit units (ACCUs) produced from Australian projects under the Carbon Farming Initiative (CFI), will be accepted as currency as an alternative of purchasing Australian Permits. CFI will produce carbon credits eligible for local and international compliance (e.g., Emission Trading Scheme - ETS) and voluntary markets (e.g., National Carbon Offset Standard - NCOS) (Carbon Neutral, 2011). Only 5 % of liable entities’ obligation may be met by surrendering eligible ACCUs during the fixed price stage. However, Australia’s carbon price will not be linked to international carbon markets during the fixed price period.
The Clean Energy Plan is expected to cut pollution by a minimum of 5% below 2000 levels by 2020 and by 80% below 2000 levels by 2050.
Before the flexible price period, the Government will set annual caps on pollution for the first five years which will be extended each year to assist businesses planning their strategy for compliance.
The threshold for facilities will be identical to that employed for NGER reporting (i.e., 25,000 kt CO2-e/year or more - excluding emissions from transport fuels and some synthetic greenhouse gases) and will be used to identify whether a facility will be covered by the carbon pricing mechanism.
2.2.4.1 Emissions Trading
Subsequent to the fixed price stage, a variable price as part of a “cap and trade” system will be implemented where the carbon price will be set by the market. The number of permits issued by the Government each year will be capped. In cap and trade schemes, an aggregate cap is enforced. Organisations within the cap are able to trade emission permits to meet their permitting liabilities. International carbon markets and land abatement programs will also be available to acquire permits for compliance. During the flexible price period, an unlimited amount of eligible ACCUs can be surrendered for compliance, as opposed to the 5% limit set for the fixed price period.
Carbon permits can enter the market either by auction or by administrative allocation. Companies will have an economic incentive to pay for permits if their internal costs of abatement are higher than the price of permits, and to directly reduce their emissions if their internal costs of abatement are lower than the price of permits. In theory, companies that own permits would be willing to sell them if the revenue received from selling permits exceeds the profits from using them.
These market incentives are designed to encourage the cheapest abatement to occur first.
The carbon price mechanism will cover the same emissions as proposed previously, with the exception of the definite exclusion of agricultural carbon emissions. Approximately 60 % of Australia’s carbon pollution is expected to be covered by the carbon price, which encompasses the following emission sources:
stationary energy production (e.g., natural gas, coal, petroleum fuels, electricity);
some business transport;
industrial processes (e.g., cement or aluminium production);
fugitive emissions (other than from decommissioned coal mines); and
emissions from non-legacy waste.
The scheme will have broad economic ramifications beyond large emitters with direct obligations. Households are likely to experience increased costs associated with carbon intensive

3678 C1-04 Coffey Arrow LNG - FINAL Greenhouse Gas Assessment_v6.docx 26 Arrow LNG Plant Project – Greenhouse Assessment Coffey Environments on behalf of Arrow Energy | PAEHolmes Job 3678C
goods and services such as electricity, gas and food. However, a significant portion of the scheme is devoted to measures to ease the transition to carbon-constrained economy and assistance from the Australian Government will be provided to approximately 8 million households.
2.2.4.2 Support Measures
Assistance will be provided through allocation of permits early in each compliance period to new and existing entities undertaking an eligible emissions-intensive trade-exposed (EITE) activity prescribed in regulations. The most emissions-intensive trade-exposed activities will receive assistance to cover 94.5% of industry average carbon costs in the first year of the carbon price. Less emissions-intensive trade-exposed activities will also receive assistance to cover 66% of industry average carbon costs. Assistance will be reduced by 1.3% each year to encourage industry to cut pollution (Australian Government, 2011a).
2.2.4.3 The Arrow LNG Plant and the Carbon Price Mechanism
Arrow will be a direct participant in the carbon price mechanism as it is currently proposed, since Arrow is part of the stationary energy sector, is a large supplier of gas and currently reports to NGER (Australian Government, 2011b). This means that Arrow must report their emissions and hold emission permits at the end of each period. As the cost of permits fluctuates, it may be more economically viable to pursue emission mitigation and avoidance measures than to obtain permits for all emissions. The extent of emissions reductions will largely be determined by market forces.
Under current proposals the cost of permits will be set eventually by the market. The goal of a market based mechanism will be to achieve the lowest cost emission mitigation across the portion of the economy covered by the scheme. The price of permits will determine what emission mitigation and avoidance measures are worth investing in. The extent of emissions reductions at any particular facility will ultimately be determined by the cost of permits vs the cost of available abatement options.
The objective of the carbon price is to change Australia’s electricity generation by encouraging investment in renewable energy like wind and solar power but by also encouraging the use of cleaner fuels like natural gas. A Clean Technology Investment Program of $800 million AUD over seven years from 2011-12 will also be implemented and will include funds to support the conversion of facilities from coal to natural gas.
2.2.5 Proposed Legislation - The Coalition’s Direct Action Plan
On 1 December 2009, a new Opposition Leader was elected by the Liberal Party. Under the new leadership, the Opposition is seeking to defeat the proposed emissions trading scheme. The policy currently put forward by the Opposition is the Direct Action Plan (LPA, 2010). This policy remains in force after the announcement made by the Australian Government in regards to the carbon tax on 10 July 2011 (LPA, 2011).
The centrepiece of this policy is the replenishment of soil carbons – a large CO2 abatement through bio-sequestration (currently soil carbons are not recognised under the Kyoto Protocol; however future global agreements on CO2 reductions may include them).
The policy will also introduce an Emissions Reduction Fund to facilitate 140 million tonnes of CO2 abatement per annum by 2020. The fund is intended to aid projects that will:
reduce CO2 emissions;
3678 C1-04 Coffey Arrow LNG - FINAL Greenhouse Gas Assessment_v6.docx 27 Arrow LNG Plant Project – Greenhouse Assessment Coffey Environments on behalf of Arrow Energy | PAEHolmes Job 3678C
not result in price increases for consumers;
deliver additional practical environmental benefits;
protect Australian jobs; and
would not proceed without fund assistance.
A particular target of the policy is the nation’s oldest and most inefficient power generation facilities, which will have the ability to use the fund to introduce programs to increase efficiency, or switch to less carbon intensive fuels, such as natural gas.
The Direct Action Plan is essentially a ‘baseline and credit’ approach, where:
if businesses reduce their emissions below their baseline they have the opportunity to offer the abatement for sale to the government; and
while no penalties are proposed for businesses that remain at their baseline levels of emissions, financial penalties are proposed for those businesses that emit more than their baseline levels.
The Coalition have claimed that the Direct Action Plan would match the 5% emission reductions outlined in the governments draft CPRS legislation (LPA, 2010) (now deferred); however no emission reduction target was specified.
2.2.5.1 The Arrow LNG Plant and the Direct Action Plan
While the nature of the Arrow LNG Plant will lead to an increase in greenhouse gas emissions over the life of the project, and hence an increase from the baseline ‘historic average’, the proposed policy should not impose penalties on Arrow. The policy states that, “provision will be made to ensure penalties will not apply to new entrants or business expansion at ‘best practice’”. While the policy does not go into further detail on how the expansion at best practice would be assessed, it is expected that this will involve consideration of the emission intensity of the business.
The Direct Action Plan may therefore provide options for Arrow to further reduce the emission intensity of their operation, if significant abatement opportunities arise which Arrow would not pursue without the fund’s contribution. The policy as it is currently proposed should not place a financial burden on Arrow, or any further effort on top of the current NGER system.
2.2.6 Australian Context Post-Kyoto
Currently an unconditional emission reduction target of 5% below 2000 levels by 2020 is supported by both major political parties. This was part of Australia’s submission to the United Nations COP in Copenhagen. Other conditional targets included in the submission are 15% below 2000 levels and 25% below 2000 levels. These targets would require a global agreement that has developed countries contributing comparably to Australia. However, at present, Australia has no legally binding emission reduction target after the Kyoto period, which ends in 2012. The targets pledged in the Copenhagen Accord and anchored with the Cancún Agreements will nonetheless be treated as serious political commitments, and will likely form the basis of targets agreed to under a replacement of the Kyoto Protocol.
2.3 Queensland Greenhouse Policy
The Queensland Government’s climate change mitigation strategy is presented in ClimateQ: toward a greener Queensland (Queensland Government, 2009). It is a consolidation and update

3678 C1-04 Coffey Arrow LNG - FINAL Greenhouse Gas Assessment_v6.docx 28 Arrow LNG Plant Project – Greenhouse Assessment Coffey Environments on behalf of Arrow Energy | PAEHolmes Job 3678C
to previous Qld Government strategies - ClimateSmart 2050 and the ClimateSmart Adaptation Plan 2007-12.
ClimateQ outlines a commitment to reduce Queensland’s greenhouse gas emissions by 60% by 2050, in line with the Australian Government’s long-term target. This is proposed to be achieved through a variety of short, medium and long-term strategies, such as:
improving energy efficiency;
reducing the emissions intensity of the Queensland energy sector;
mode switching and fuel efficiency in the transport sector;
reduction of land clearing; and
carbon sequestration.
2.3.1 Smart Energy Savings Program
Improving energy efficiency in the residential, commercial and industrial sectors has been identified by ClimateQ as a key strategy, as reductions in greenhouse gas emissions can be achieved with little or no cost. For small to medium sized businesses that use 100 to 500 TJ of energy, energy auditing and reporting will be mandatory under the Smart Energy Savings Program (SESP), introduced through Clean Energy Act 2008.
For larger businesses, using more than 500 TJ, energy auditing and reporting is mandatory under the national EEO Program. As detailed in Section 2.2.3 it is expected that Arrow LNG Plant will participant in the EEO Program, and as such will not have to report under the SESP.
2.3.2 Queensland Gas Scheme
Greenhouse gas emissions from the stationary energy sector will be reduced through the Queensland Gas Scheme (QGS). Under the QGS, Queensland electricity retailers and large electricity users will be required to source a portion of their electricity from gas-fired generation at rates of:
15% by 2010; and
18% by 2020.
The QGS has been in effect since 2005. In the period 2005 to 2009, the QGS required 13% of electricity in Queensland be generated from gas.
The Government administers targets through tradeable gas electricity certificates (GECs). Accredited gas fired power stations earn tradeable gas electricity certificates for each MWh of electricity produced. Electricity retailers and large consumers must purchase and surrender GECs equivalent to proportion of electricity that must be generated by gas under the QGS. Since 2005, the average price of GECs has been $16, and the scheme has generated $158 million through GECs sales, making gas fired power generation economically competitive with coal-fired generation (DME, 2008).
The Queensland Government’s rationale for increasing electricity sourced from natural gas is that, in comparison to coal-fired generation, natural gas produces approximately half the emissions per unit of electricity generated. Therefore, natural gas has been identified as a key transitional fuel source while renewable energy and clean coal technologies are developed.

3678 C1-04 Coffey Arrow LNG - FINAL Greenhouse Gas Assessment_v6.docx 29 Arrow LNG Plant Project – Greenhouse Assessment Coffey Environments on behalf of Arrow Energy | PAEHolmes Job 3678C
As the Arrow LNG plant is not generating electricity for retail use, it will not be a direct participant in the QGS, and will not be required to trade GECs. Indirectly, the QGS may affect the amount of coal seam gas available to the Arrow LNG Plant. As the required percentage of gas-fired electricity in Queensland increases, the amount of gas available to the Arrow LNG Plant may decrease, given that the product fuel will not be used in Queensland. However, the extent to which this impacts the Arrow LNG Plant, if at all, will be dependent on a number of factors, including the total gas available to Queensland electricity generators, and the total amount of electricity generated.
2.4 Summary of Relevant Policies
A summary of the relevant policies relating to emissions of greenhouse gases and electricity consumption/generation from Arrow LNG Plant is presented in Table 2.
Table 2: Summary of Greenhouse Gas Emissions Policies Relevant to Arrow LNG Plant
Level Policy Arrow LNG Plant Participation Section in
Report International Kyoto
Protocol INDIRECT As Arrow LNG Plant is planned to be operational after 2013, emissions will not count towards Australia’s Kyoto target for the 2008-2012 period.
Section 2.1.3
Australia NGER MANDATORY Arrow already participates in NGER and will have to annually report greenhouse gas emissions and energy consumption/production associated with Arrow LNG Plant.
Section 2.2.2
EEO Program MANDATORY (expected) It is expected that Arrow will report energy usage and energy efficiency opportunities associated with Arrow LNG Plant.
Section 2.2.3
Carbon Price Mechanism (proposed)
MANDATORY Arrow will be a participant in the proposed Carbon Price Mechanism and will have to annually report emissions from Arrow LNG Plant and hold emission permits at the end of each period. Assistance from the government will potentially be given if LNG production qualifies as an EITE industry.
Section 2.2.4
Direct Action Plan (proposed)
VOLUNTARY It is expected that the Direct Action Plan will place no demand on Arrow LNG Plant. Opportunities may exist for Arrow LNG Plant to receive funding to further reduce its emissions intensity.
Section 2.2.5
Queensland SESP NONE (expected) Arrow will only have to report energy efficiency data from Arrow LNG Plant if it does not do so under the EEO Program
Section 2.3.1
QGS INDIRECT Arrow LNG Plant is not a direct participant in trading of GECs. QGS may impact supply of CSG to Arrow LNG Plant; however this is dependent on a number of market factors.
Section 2.3.2

3678 C1-04 Coffey Arrow LNG - FINAL Greenhouse Gas Assessment_v6.docx 30 Arrow LNG Plant Project – Greenhouse Assessment Coffey Environments on behalf of Arrow Energy | PAEHolmes Job 3678C
3 EXISTING ENVIRONMENT
According to the IPPC, Global surface temperature has increased by 0.74 ± 0.18ºC during the 100 years ending 2005 and that: “most of the observed increase in globally averaged temperatures since the mid-twentieth century is very likely due to the observed increase in anthropogenic greenhouse gas concentrations” (IPCC, 2007a). “Very likely” is defined as greater than 90% probability of occurrence (IPCC, 2007a).
Climate change is a global occurrence. The degree to which climate change occurs and the associated impacts will vary worldwide. The most recent and authoritative work in predicting the future impacts that global GHG emissions will have on Australian climate patterns and the Australian economy is the Garnaut Climate Change Review (Garnaut, 2008).
The Garnaut Review builds on the climate change modelling undertaken by the CSIRO, and global greenhouse gas emissions scenarios developed by the IPCC. It also builds on previous attempts to quantify the social and economic impacts of climate change in particular, the Stern Review on the Economics of Climate Change, which was prepared for the British Government and released in October 2006 (Stern, 2006). The impacts associated with climate change predicted by the Garnaut Review are described in Appendix B. It should be noted that the Garnaut Review 2011 (Garnaut, 2011) does not provide an updated set of predictions, only a reaffirmation of the 2008 predictions.
Attributing the potential impacts associated with climate change to a single source of greenhouse gas emissions is problematic. The potential impacts associated with greenhouse gas emissions from the Arrow LNG Plant will be in proportion with its contribution to global greenhouse emissions.
The global greenhouse gas emissions associated with the consumption of fossil fuels for 2007 is presented in Table 3, along with Australian’s energy sector and Queensland’s total emissions.
Table 3: Estimates of Greenhouse Emissions
Geographic Coverage
Source Coverage Timescale Emissions (Mt CO2-e)
Global a Consumption of fossil fuels 2007 29,335
Australia b Energy sector 2007 408.2
Queensland c Total GHG emissions including Land Use, Land Use Change and Forestry (LULUCF) activities
2007 181.6
a. UNSD (2011) b. Section 2, DCC (2009a) - Energy sector includes stationary energy, transport and fugitive emissions. c. DCC (2009c) - Emissions including land use change.
Concentrations of greenhouse gases in the atmosphere are typically expressed in terms of global averages. In 2010, the concentration of nitrous oxide was approximately 322.5 ppb (NOAA, 2011a), while the concentration of sulphur hexafluoride was approximately 6.9 ppt (NOAA, 2011b). More recently, in August 2011, the mean global concentration of carbon dioxide was measured at 388.02 ppm (NOAA, 2011c).
3.1 Australia’s Greenhouse Gas Inventory
Australia’s greenhouse gas emissions increased by 9.3% between 1990 and 2007, as seen in Table 4. The largest increase was in the energy sector, with emissions increasing by 42.5% between 1990 and 2007. Emissions from the Arrow LNG Plant will be categorised as part of the energy sector.
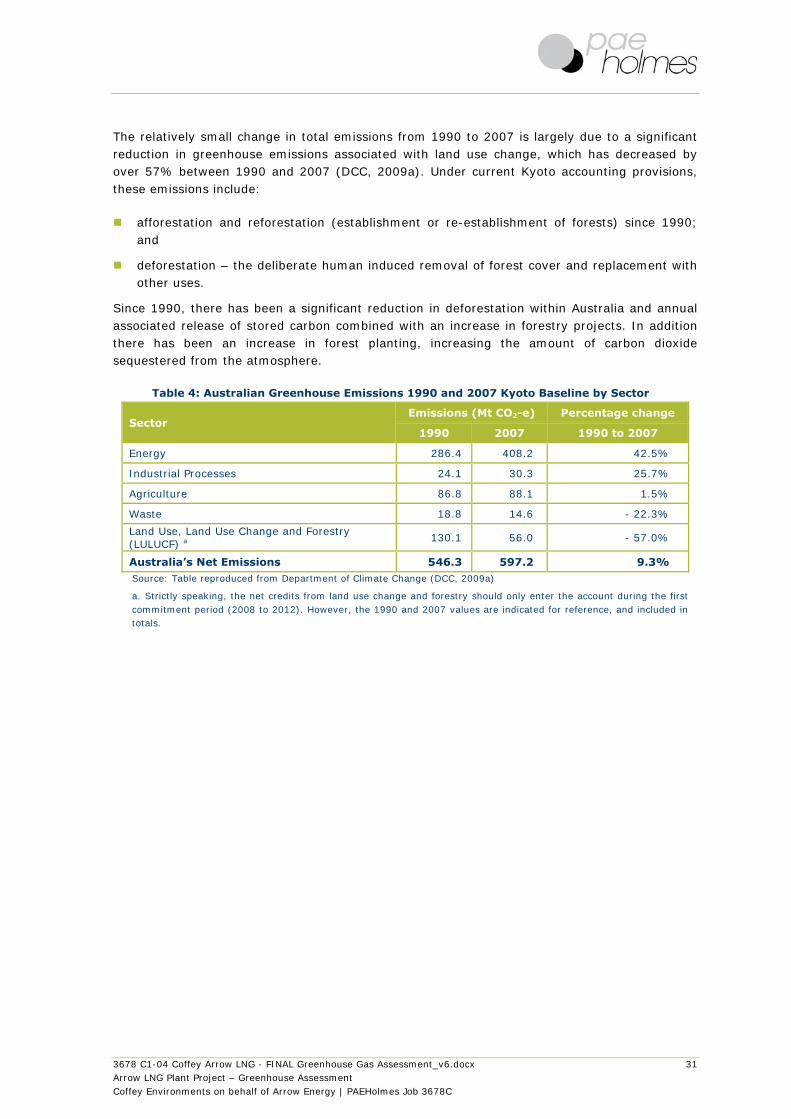
3678 C1-04 Coffey Arrow LNG - FINAL Greenhouse Gas Assessment_v6.docx 31 Arrow LNG Plant Project – Greenhouse Assessment Coffey Environments on behalf of Arrow Energy | PAEHolmes Job 3678C
The relatively small change in total emissions from 1990 to 2007 is largely due to a significant reduction in greenhouse emissions associated with land use change, which has decreased by over 57% between 1990 and 2007 (DCC, 2009a). Under current Kyoto accounting provisions, these emissions include:
afforestation and reforestation (establishment or re-establishment of forests) since 1990; and
deforestation – the deliberate human induced removal of forest cover and replacement with other uses.
Since 1990, there has been a significant reduction in deforestation within Australia and annual associated release of stored carbon combined with an increase in forestry projects. In addition there has been an increase in forest planting, increasing the amount of carbon dioxide sequestered from the atmosphere.
Table 4: Australian Greenhouse Emissions 1990 and 2007 Kyoto Baseline by Sector
Sector Emissions (Mt CO2-e) Percentage change
1990 2007 1990 to 2007
Energy 286.4 408.2 42.5%
Industrial Processes 24.1 30.3 25.7%
Agriculture 86.8 88.1 1.5%
Waste 18.8 14.6 - 22.3%
Land Use, Land Use Change and Forestry (LULUCF) a 130.1 56.0 - 57.0%
Australia’s Net Emissions 546.3 597.2 9.3% Source: Table reproduced from Department of Climate Change (DCC, 2009a)
a. Strictly speaking, the net credits from land use change and forestry should only enter the account during the first commitment period (2008 to 2012). However, the 1990 and 2007 values are indicated for reference, and included in totals.

3678 C1-04 Coffey Arrow LNG - FINAL Greenhouse Gas Assessment_v6.docx 32 Arrow LNG Plant Project – Greenhouse Assessment Coffey Environments on behalf of Arrow Energy | PAEHolmes Job 3678C
4 GREENHOUSE GAS EMISSION ESTIMATION METHODOLOGY
4.1 Emission Estimating Methods
4.1.1 Introduction
Greenhouse gas emission calculations are generally of the form:
where:
= Estimated emissions of GHG i (t CO2-e)
= Basis of emission estimate (for example, amount of fuel combusted for energy generation)
(generally in the units of GJ for fuel combustion)
= Emission factor for GHG i (t CO2-e/Activity)
The activity data used to determine greenhouse gas emissions for this assessment were provided by Coffey Environments.
PAEHolmes has estimated greenhouse gas emissions based upon the methods outlined in the following documents:
The World Resources Institute/World Business Council for Sustainable Development Greenhouse Gas Protocol (WRI & WBCSD, 2004).
The National Greenhouse and Energy Reporting (Measurement) Determination 2008 as amended – Reporting Year 2010-11 (DCCEE, 2010d) and National Greenhouse and Energy Reporting (Measurement) Determination 2008 (DCC, 2008d).
The National Greenhouse and Energy Reporting System Measurement Technical Guidelines 2010 (Technical Guidelines) (DCCEE, 2010e).
The Australian Government Department of Climate Change National Greenhouse Accounts Factors 2010 (DCCEE, 2010f).
4.1.2 The Greenhouse Gas Protocol The Greenhouse Gas Protocol (WRI & WBCSD, 2004) establishes an international standard for accounting and reporting of greenhouse gas emissions. The Greenhouse Gas Protocol has been adopted by the International Organization for Standardization, endorsed by greenhouse gas initiatives (such as the Carbon Disclosure Project) and is compatible with existing greenhouse gas trading schemes.
Under this protocol, three ‘scopes’ of emissions (scope 1, scope 2 and scope 3) are defined for greenhouse gas accounting and reporting purposes. This terminology has been adopted in Australian greenhouse reporting and measurement methods and has been employed in this assessment. The definitions for scope 1, scope 2 and scope 3 emissions are provided below.
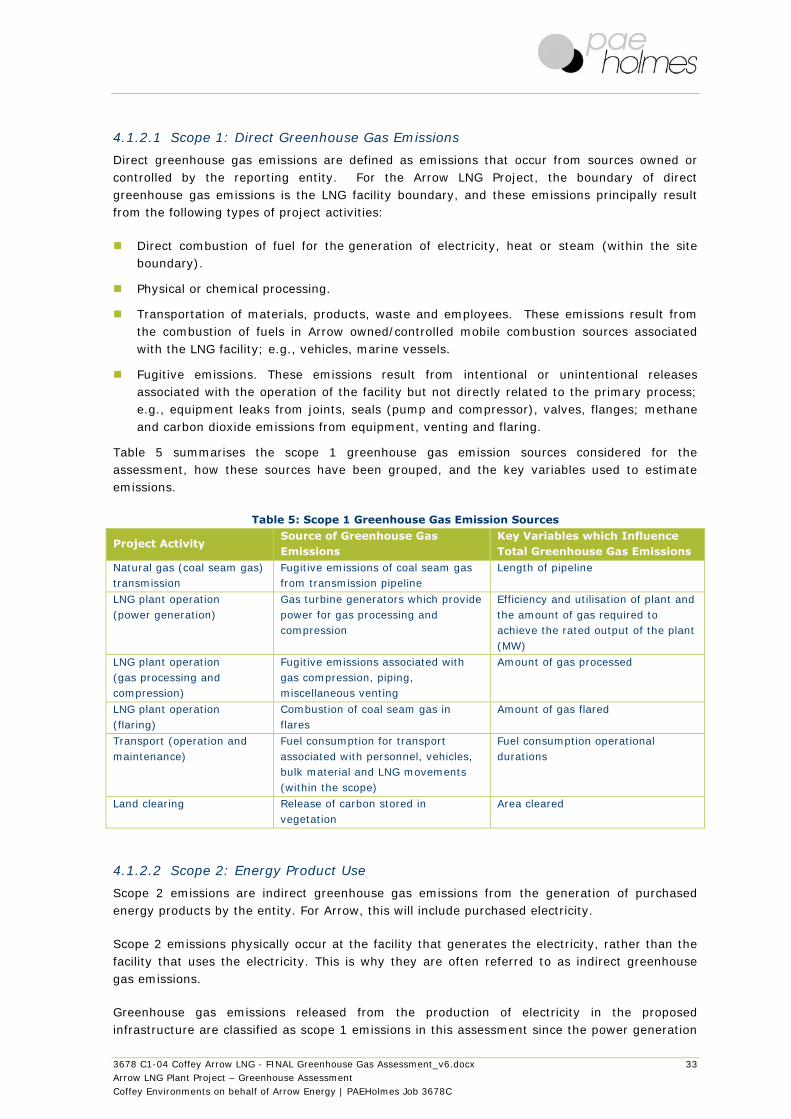
3678 C1-04 Coffey Arrow LNG - FINAL Greenhouse Gas Assessment_v6.docx 33 Arrow LNG Plant Project – Greenhouse Assessment Coffey Environments on behalf of Arrow Energy | PAEHolmes Job 3678C
4.1.2.1 Scope 1: Direct Greenhouse Gas Emissions
Direct greenhouse gas emissions are defined as emissions that occur from sources owned or controlled by the reporting entity. For the Arrow LNG Project, the boundary of direct greenhouse gas emissions is the LNG facility boundary, and these emissions principally result from the following types of project activities:
Direct combustion of fuel for the generation of electricity, heat or steam (within the site boundary).
Physical or chemical processing.
Transportation of materials, products, waste and employees. These emissions result from the combustion of fuels in Arrow owned/controlled mobile combustion sources associated with the LNG facility; e.g., vehicles, marine vessels.
Fugitive emissions. These emissions result from intentional or unintentional releases associated with the operation of the facility but not directly related to the primary process; e.g., equipment leaks from joints, seals (pump and compressor), valves, flanges; methane and carbon dioxide emissions from equipment, venting and flaring.
Table 5 summarises the scope 1 greenhouse gas emission sources considered for the assessment, how these sources have been grouped, and the key variables used to estimate emissions.
Table 5: Scope 1 Greenhouse Gas Emission Sources
Project Activity Source of Greenhouse Gas Emissions
Key Variables which Influence Total Greenhouse Gas Emissions
Natural gas (coal seam gas) transmission
Fugitive emissions of coal seam gas from transmission pipeline
Length of pipeline
LNG plant operation (power generation)
Gas turbine generators which provide power for gas processing and compression
Efficiency and utilisation of plant and the amount of gas required to achieve the rated output of the plant (MW)
LNG plant operation (gas processing and compression)
Fugitive emissions associated with gas compression, piping, miscellaneous venting
Amount of gas processed
LNG plant operation (flaring)
Combustion of coal seam gas in flares
Amount of gas flared
Transport (operation and maintenance)
Fuel consumption for transport associated with personnel, vehicles, bulk material and LNG movements (within the scope)
Fuel consumption operational durations
Land clearing Release of carbon stored in vegetation
Area cleared
4.1.2.2 Scope 2: Energy Product Use
Scope 2 emissions are indirect greenhouse gas emissions from the generation of purchased energy products by the entity. For Arrow, this will include purchased electricity.
Scope 2 emissions physically occur at the facility that generates the electricity, rather than the facility that uses the electricity. This is why they are often referred to as indirect greenhouse gas emissions.
Greenhouse gas emissions released from the production of electricity in the proposed infrastructure are classified as scope 1 emissions in this assessment since the power generation

3678 C1-04 Coffey Arrow LNG - FINAL Greenhouse Gas Assessment_v6.docx 34 Arrow LNG Plant Project – Greenhouse Assessment Coffey Environments on behalf of Arrow Energy | PAEHolmes Job 3678C
is under the control of Arrow. However, electricity purchased from the grid during construction or operation will have associated scope 2 emissions.
4.1.2.3 Scope 3: Other Indirect Greenhouse Gas Emissions
Scope 3 emissions are defined as those emissions that are a consequence of the activities of an entity, but which arise from sources not owned or controlled by that entity. Some examples of scope 3 activities provided in the Greenhouse Gas Protocol are extraction and production of purchased materials, transportation of purchased fuels, and use of sold products and services.
In the case of Arrow LNG Plant, scope 3 emissions quantified in this assessment will include emissions associated with fuel cycles (including extraction of coal seam gas), electricity consumption from the grid and the end-use of produced LNG. It should be noted that the emissions associated with the extraction of coal seam gas will be comprehensively estimated in the Environmental Impact Statements for upstream gas extraction activities by Arrow LNG Plant’s gas providers. The estimates of scope 3 emissions associated with gas extraction are presented in this assessment for transparency and completeness.
The Greenhouse Gas Protocol allows optional reporting of scope 3 emissions. If an organisation believes that scope 3 emissions are a significant component of the total emissions inventory, these can be reported along with scope 1 and scope 2 emissions. However, the Greenhouse Gas Protocol notes that reporting scope 3 emissions can result in double counting of emissions and can also make comparisons between organisations and/or products difficult (because reporting is voluntary). Double counting needs to be avoided when compiling national (country) inventories under the Kyoto Protocol. The Greenhouse Gas Protocol also recognises that compliance regimes are more likely to focus on the “point of release” of emissions (i.e., direct emissions) and/or indirect emissions from the purchase of electricity.
Table 6 presents the scope 3 emission sources considered for the Arrow LNG Plant.
Table 6: Scope 3 Greenhouse Gas Emission Sources
Greenhouse Gas Emission Source Key Variables which Influence Total
Greenhouse Gas Emissions Fuel cycles of all fuels including coal seam gas, diesel and fuel oil (indirect emissions due to extraction, production and transport of fuels consumed)
Amount of fuel used
Electricity consumption from the grid Amount of electricity consumed
LNG end use Amount of LNG produced
4.1.3 National Greenhouse and Energy Reporting (Measurement) Determination 2008 (and Amendment)
The National Greenhouse and Energy Reporting Determination 2008 (Determination, DCC (2008d)) provides for the measurement of:
greenhouse gas emissions;
the production of energy; and
the consumption of energy.
The Determination provides guidance for the estimation of scope 1 and scope 2 emissions. In the Determination there are four categories of scope 1 emissions:
fuel combustion;

3678 C1-04 Coffey Arrow LNG - FINAL Greenhouse Gas Assessment_v6.docx 35 Arrow LNG Plant Project – Greenhouse Assessment Coffey Environments on behalf of Arrow Energy | PAEHolmes Job 3678C
fugitive emissions from fuels, which deals with emissions released from the extraction, production, flaring of fuel, processing and distribution of fossil fuels;
industrial processes emissions; and
waste emissions.
Where possible, PAEHolmes has employed methods consistent with those described in the Determination related to scope 1 and scope 2 emissions. Refer to Appendix A for further information.
4.1.4 National Greenhouse Accounts Factors
The National Greenhouse Accounts (NGA) Factors (DCCEE, 2010f) provides emission factors for use in a variety of emission reporting frameworks. This document replaces the Australian Greenhouse Office Factors and Methods Workbook. The Department of Climate Change, using the Australian Greenhouse Emissions Information System, has derived default emission factors.
The NGA Factors are relevant for the purposes of estimating scope 2 and scope 3 emissions, since it provides emission factors for grid supplied electricity by state (scope 2 and scope 3) or emissions associated with fuel cycles (scope 3).

3678 C1-04 Coffey Arrow LNG - FINAL Greenhouse Gas Assessment_v6.docx 36 Arrow LNG Plant Project – Greenhouse Assessment Coffey Environments on behalf of Arrow Energy | PAEHolmes Job 3678C
5 FORECASTED GREENHOUSE GAS EMISSION ESTIMATES FOR THE ARROW LNG PLANT
Four configuration options regarding LNG plant and site utilities construction/operation are being investigated by Coffey Environments; i.e., an all mechanical option using gas turbine generators, an all electrical option using electricity from the grid (mains power) and two mechanical/electrical options. As requested by Coffey Environments, only the “all mechanical” and the “all electrical” scenarios will be assessed. The respective description of the assessed options are provided in the project description (refer to section 1.2.1.1). It should be noted that the “all electrical” option was identified as the worst case option as it is the most greenhouse gas intensive when the default emissions intensity for the Queensland power grid is used (though the emissions intensity of the grid is in practice variable and dependent of the electricity generation mix at the time of consumption).
The project development will include (Coffey Environments, 2011v):
Construction Phase 1, which involves the construction of LNG trains 1 and 2. Phase 1 is expected to commence in 2014 and occur for three and a half years.
A construction/operations period of a year where the construction of LNG train 2 and the operation of LNG train 1 will occur simultaneously (Year 1).
Full operation of LNG trains 1 and 2 (Year 2 - Year 5).
Construction Phase 2 which involves the construction of LNG trains 3 and 4. Phase 2 is expected to commence in Year 6 and end in Year 9 (included). During this stage, construction of LNG trains 3 and 4, and operation of LNG trains 1 and 2 will occur simultaneously.
Full operation of LNG trains 3 and 4 (Year 10 - Year 25).
In order to present conservative estimates, the scenarios that generate the highest greenhouse emission estimates for construction and operation have been chosen. Year 10 to Year 25 were selected in relation to operational emissions as it was assumed that these years will generate similar emissions and that the full operation of the four LNG trains will result in the highest generation of emissions. In regards to construction emissions, it was assumed that both construction phases will generate similar emissions except for the land clearing, which is assumed to take place in the first year of the construction period. Therefore construction activities, which exclude land clearing, is taken to be representative of typical construction activities. In regards to operational emissions, start-up flaring emissions are expected to be generated during Year 1 and Year 9. Therefore operational activities, which exclude start-up flaring, is taken to be the most representative of typical operations.
The emission estimates associated with the construction of the Arrow LNG Plant are presented in section 5.2 and the emission estimates associated to the operation of the four LNG trains are presented in section 5.3. Annual greenhouse emission estimates are also presented in Table 12 based on the project’s timeline described above and the number of LNG trains on-line.

3678 C1-04 Coffey Arrow LNG - FINAL Greenhouse Gas Assessment_v6.docx 37 Arrow LNG Plant Project – Greenhouse Assessment Coffey Environments on behalf of Arrow Energy | PAEHolmes Job 3678C
5.1 Summary of Activities
The activities associated with the project during the construction and operation of the plant for the “all mechanical” and the “all electrical” options are summarised in Table 7.
Table 7: Activities Associated with the Project
Category Activity Construction Operation
Fuel combustion
Stationary engines (CSG) - All mechanical:
power generation for utilities and LNG trains
Stationary engines (diesel) All mechanical:
construction activities and construction camp
-
Tug boats (diesel) Both options:
bulk material and LNG movements
Both options: bulk material movement
Dredging equipment (diesel)
Both options -
Passenger marine vessels – Fast Cats (fuel oil)
Both options Both options
Passenger/vehicles marine vessels – Ro-Pax (fuel oil)
Both options Both options
Vehicles for personnel transport (diesel)
- Both options
Fugitive emissions
Venting - Both options
Flaring - Both options
Facility-level fugitives - Both options
Transmission - Both options
Energy consumption
Electricity consumption for construction power
All electrical -
Electricity consumption at the TWAF
Both options -
Electricity consumption for operation power and accommodation
- All electrical
Land clearing Clearing of vegetation Both options -

3678 C1-04 Coffey Arrow LNG - FINAL Greenhouse Gas Assessment_v6.docx 38 Arrow LNG Plant Project – Greenhouse Assessment Coffey Environments on behalf of Arrow Energy | PAEHolmes Job 3678C
5.2 Construction Emissions
The total (scope 1, scope 2 and scope 3) greenhouse gas emissions associated with the construction of the Arrow LNG Plant have been estimated to be approximately 0.9 Mt CO2-e for Phase 1 (i.e., 2014-2022) and 0.7 Mt CO2-e for Phase 2 (i.e., 2022-2042) for the worst-case “all electrical” option (refer to Table 12). These emissions are considered insignificant in comparison with the total operational emissions for both phases (refer to Table 12).
Scope 1 construction emissions are associated with power generation (to run construction activities and the construction camp) for the “all mechanical” option and are associated with land clearing (in the first year) and fuel combusted for transport energy for both options.
Scope 2 construction emissions are associated with electricity consumed at Curtis Island for construction activities for the “all electrical” option and the electricity consumed at the TWAF for both options. For the “all mechanical” option, the total scope 1 and scope 2 emissions were estimated to be approximately 0.4 Mt CO2-e for Phase 1 and 0.3 Mt CO2-e for Phase 2 (refer to Table 12). For the “all electrical” option, the total scope 1 and scope 2 emissions were estimated to be approximately 0.8 Mt CO2-e for Phase 1 and 0.6 Mt CO2-e for Phase 2 (refer to Table 12).
The “all electrical” option involves almost three times the quantity of scope 3 emissions (i.e., 92 kt CO2-e for Phase 1 and 81 kt CO2-e for Phase 2) as the “all mechanical” option (i.e., 32 kt CO2-e for Phase 1 and 28 kt CO2-e for Phase 2) due to the extraction, production and transport of fuel combusted for power generation and electricity losses in delivery in the T&D network.
When comparing the emissions associated with power consumption during construction for each scenario, the “all electrical” scenario is expected to generate 134.4 kt CO2-e/annum (as scope 2 emissions) while the “all mechanical” scenario is expected to generate 49 kt CO2-e/annum (as scope 1 emissions). The “all electrical” option will thus involve more than three times the amount of emissions to meet the main power supply requirement during the construction of the Arrow LNG Plant.

3678 C1-04 Coffey Arrow LNG - FINAL Greenhouse Gas Assessment_v6.docx 39 Arrow LNG Plant Project – Greenhouse Assessment Coffey Environments on behalf of Arrow Energy | PAEHolmes Job 3678C
Table 8: Annual Forecast Greenhouse Gas Emissions Associated with Construction Activities – “All Mechanical” Scenario
Category Activity Emissions [tonnes CO2-e/annum]
CO2 a CH4 N2O Total (CO2-e)
CONSTRUCTION - SCOPE 1 EMISSIONS
Fuel Combustion
Construction power - construction activities and construction camp (diesel)
48,748 70 141 48,959
Dredging equipment (diesel) 888 3 6 897
Marine vessels - tug boats (diesel) 786 2 6 794
Passenger marine vessels - fast cats (fuel oil) 1,606 1 13 1,620
Passenger/vehicles marine vessels - Ro-Pax (fuel oil) 6,743 6 55 6,804
Land clearing Vegetation removal (only included in Year 1) 64,032 0 0 64,032
CONSTRUCTION - SCOPE 2 EMISSIONS
Energy Consumption Electricity consumption at the TWAF 17,483 - - 17,483
CONSTRUCTION - SCOPE 3 EMISSIONS
Energy Consumption/ Production
Full fuel cycle - diesel (marine vessels) 128 - - 128
Full fuel cycle - diesel (construction activities) 3,734 - - 3,734
Full fuel cycle - fuel oil (marine vessels) 607 - - 607
Full fuel cycle - electricity (TWAF) 2,554 - - 2,554
TOTAL SCOPE 1 EMISSIONS (excluding vegetation clearing) 58,770 82 221 59,074
TOTAL SCOPE 2 EMISSIONS 17,483 - - 17,483
TOTAL SCOPE 3 EMISSIONS 7,022 - - 7,022
OVERALL 83,276 82 221 83,580
Note: Calculated with activity data estimates and emission estimation techniques detailed in Appendix A.
a. Scope 2 and scope 3 emissions are presented as CO2 emissions while they are in fact a combination of CO2, CH4 and N2O emissions.

3678 C1-04 Coffey Arrow LNG - FINAL Greenhouse Gas Assessment_v6.docx 40 Arrow LNG Plant Project – Greenhouse Assessment Coffey Environments on behalf of Arrow Energy | PAEHolmes Job 3678C
Table 9: Annual Forecast Greenhouse Gas Emissions Associated with Construction Activities – “All Electrical” Scenario
Category Activity Emissions [tonnes CO2-e/annum]
CO2 a CH4 N2O Total (CO2-e)
CONSTRUCTION - SCOPE 1 EMISSIONS
Fuel Combustion
Dredging equipment (diesel) 888 3 6 897
Marine vessels - tug boats (diesel) 786 2 6 794
Passenger marine vessels - fast cats (fuel oil) 1,606 1 13 1,620
Passenger/vehicles marine vessels - Ro-Pax (fuel oil) 6,743 6 55 6,804
Land clearing Vegetation removal (only included in Year 1) 64,032 0 0 64,032
CONSTRUCTION - SCOPE 2 EMISSIONS
Energy Consumption
Electricity consumption for construction power (construction activities and construction camp)
134,429 - - 134,429
Electricity consumption at the TWAF 17,483 - - 17,483
CONSTRUCTION - SCOPE 3 EMISSIONS
Energy Consumption/ Production
Full fuel cycle - diesel (marine vessels) 128 - - 128
Full fuel cycle - fuel oil (marine vessels) 607 - - 607
Full fuel cycle - electricity (TWAF) 2,554 - - 2,554
Full fuel cycle - electricity (construction power) 17,082 - - 17,082
TOTAL SCOPE 1 EMISSIONS (excluding vegetation clearing) 10,022 12 81 10,115
TOTAL SCOPE 2 EMISSIONS 151,913 - - 151,913
TOTAL SCOPE 3 EMISSIONS 20,371 - - 20,371
OVERALL 182,306 12 81 182,398
Note: Calculated with activity data estimates and emission estimation techniques detailed in Appendix A.
a. Scope 2 and scope 3 emissions are presented as CO2 emissions while they are in fact a combination of CO2, CH4 and N2O emissions.

3678 C1-04 Coffey Arrow LNG - FINAL Greenhouse Gas Assessment_v6.docx 41 Arrow LNG Plant Project – Greenhouse Assessment Coffey Environments on behalf of Arrow Energy | PAEHolmes Job 3678C
5.3 Operational Emissions
The total (scope 1, scope 2 and scope 3) greenhouse gas emissions associated with the operation of Arrow LNG Plant have been estimated to be approximately 67.5 Mt CO2-e/annum (excuding start-up flaring) for the “all mechanical” option (refer to Table 10) versus 70.3 Mt CO2-e/annum (excuding start-up flaring) for the “all electrical” option (refer to Table 11). As expected, the “all electrical” option is the most greenhouse gas intensive option and produces approximately 4.1% more greenhouse gas emissions than the “all mechanical” option.
When comparing the emissions associated with power consumption during operations for each scenario, the “all electrical” scenario is expected to generate 6.7 Mt CO2-e/annum (as scope 2 emissions) while the “all mechanical” scenario is expected to generate 4.9 Mt CO2-e/annum (as scope 1 emissions). The “all electrical” option will thus involve 36% more emissions to meet the power consumption requirement during the operation of Arrow LNG Plant. This is because the default Queensland emission factor for electricity supply is heavily weighted with coal-fired power generation, which is more greenhouse gas emissions intensive than the operation of gas turbine generators considered for the “all mechanical” project scenario.
Scope 1 operational emissions are associated with the power generation (for utilities and LNG trains) for the “all mechanical” option, and fuel combusted for transport and fugitives for both options. The total annual scope 1 emissions were estimated to be approximately 6.4 Mt CO2-e/annum (i.e., 9.5% of the total emissions) for the “all mechanical” option (refer to Table 10), with the majority of scope 1 emissions from CSG combustion in generators (i.e., 4.9 Mt CO2-e/annum). The total annual scope 1 emissions were estimated to be approximately 1.5 Mt CO2-e/annum (i.e., 2.1% of the total emissions) for the “all electrical” option (refer to Table 11), with the majority of scope 1 emissions from facility fugitive emissions (i.e., 703 kt CO2-e/annum).
Scope 2 operational emissions are associated with electricity consumed at the Arrow LNG Plant and Curtis Island accommodation for the “all electrical” option. The “all mechanical” operational scenario does not involve any scope 2 emissions associated with electricity consumption as the main power requirement is met through the combustion of CSG in gas turbines. The TWAF will only be in use during construction. The total annual scope 2 emissions were estimated to be approximately 6.7 Mt CO2-e/annum (i.e., 9.6% of the total emissions) for the “all electrical” option (refer to Table 11).
Scope 3 operational emissions include the end-use of LNG, which is assumed to be combusted for power or heating, electricity consumption from the grid, and the full fuel cycle of CSG (upstream emissions associated with extraction and transport of CSG), diesel and fuel oil. The total annual scope 3 emissions were estimated to be approximately 61.1 Mt CO2-e/annum (i.e., 90.5% of the total emissions) for the “all mechanical” option (refer to Table 10), with the majority of scope 3 emissions from LNG combustion by end-users (i.e., 52.8 Mt CO2-e/annum). The total annual scope 3 emissions were estimated to be approximately 62.1 Mt CO2-e/annum (i.e., 88.4% of the total emissions) for the “all electrical” option (refer to Table 11), with the majority of scope 3 emissions from LNG combustion by end-users.

3678 C1-04 Coffey Arrow LNG - FINAL Greenhouse Gas Assessment_v6.docx 42 Arrow LNG Plant Project – Greenhouse Assessment Coffey Environments on behalf of Arrow Energy | PAEHolmes Job 3678C
Table 10: Annual Forecast Greenhouse Gas Emissions Associated with Operational Activities – “All Mechanical” Scenario (4 LNG Trains)
Category Activity GHG Emissions [tonnes CO2-e/annum]
CO2 a CH4 N2O Total (CO2-e)
OPERATION - SCOPE 1 EMISSIONS
Fuel Combustion
Stationary engines - power generation for utilities and LNG trains (CSG) a
4,903,155 20,297 3,045 4,926,496
Marine vessels – tug boats for LNG movement (diesel)
1,164 3 8 1,176
Marine vessels – tug boats for bulk material movement (diesel)
746 2 5 753
Personnel transport - vehicles (diesel) 160 0 1 162
Passenger marine vessels –fast cats (fuel oil) 1,523 1 13 1,537
Passenger/vehicles marine vessels – Ro-Pax (fuel oil)
6,397 5 53 6,455
Fugitive Emissions
Venting from AGRU 537,487 27,123 - 564,610
Start-up flaring (only included in Year 1 and Year 9) 92,863 3,439 1,032 97,334
Pilot flaring & maintenance flaring 168,550 6,243 1,873 176,666
Facility-level fugitives - 702,500 - 702,500
Transmission 0 75 - 75
OPERATION - SCOPE 3 EMISSIONS
Energy Consumption/ Production
End-use - LNG 52,639,154 107,153 32,146 52,778,452
Full fuel cycle - CSG processed (upstream emissions associated with extraction and transport of CSG)
8,338,679 - - 8,338,679
Full fuel cycle – diesel (marine vessels & vehicles) 159 - - 159
Full fuel cycle - fuel oil (marine vessels) 576 - - 576
TOTAL SCOPE 1 EMISSIONS (excluding start-up flaring) 5,619,184 756,250 4,997 6,380,431
TOTAL SCOPE 2 EMISSIONS 0 0 0 0
TOTAL SCOPE 3 EMISSIONS 60,978,567 107,153 32,146 61,117,866
OVERALL 66,597,750 863,403 37,143 67,498,296
Note: Calculated with activity data estimates and emission estimation techniques detailed in Appendix A.
a. Scope 2 and scope 3 emissions are presented as CO2 emissions while they are in fact a combination of CO2, CH4 and N2O emissions.

3678 C1-04 Coffey Arrow LNG - FINAL Greenhouse Gas Assessment_v6.docx 43 Arrow LNG Plant Project – Greenhouse Assessment Coffey Environments on behalf of Arrow Energy | PAEHolmes Job 3678C
Table 11: Annual Forecast Greenhouse Gas Emissions Associated with Operational Activities - “All Electrical” Scenario (4 LNG Trains)
Category Activity GHG Emissions [tonnes CO2-e/annum]
CO2 a CH4 N2O Total (CO2-e)
OPERATION - SCOPE 1 EMISSIONS
Fuel Combustion
Marine vessels – tug boats for LNG movement (diesel) 1,164 3 8 1,176
Marine vessels – tug boats for bulk material movement (diesel) 746 2 5 753
Personnel transport - vehicles (diesel) 160 0 1 162
Passenger marine vessels –fast cats (fuel oil) 1,523 1 13 1,537
Passenger/vehicles marine vessels – Ro-Pax (fuel oil) 6,397 5 53 6,455
Fugitive Emissions
Venting from AGRU 537,487 27,123 - 564,610
Start-up flaring (only included in Year 1 and Year 9) 92,863 3,439 1,032 97,334
Pilot flaring & maintenance flaring 168,550 6,243 1,873 176,666
Facility-level fugitives - 702,500 - 702,500
Transmission 0 75 - 75
OPERATION - SCOPE 2 EMISSIONS
Energy Consumption Electricity consumption for power generation and LNG trains 6,726,247 - - 6,726,247
OPERATION - SCOPE 3 EMISSIONS
Energy Consumption/ Production
End-use - LNG 52,639,154 107,153 32,146 52,778,452
Full fuel cycle - CSG processed (upstream emissions associated with extraction and transport of CSG)
8,338,679 - - 8,338,679
Full fuel cycle – diesel (marine vessels & vehicles) 159 - - 159
Full fuel cycle - fuel oil (marine vessels) 576 - - 576
Full fuel cycle – electricity (operation power and accommodations) 982,486 - - 982,486
TOTAL SCOPE 1 EMISSIONS (excluding start-up flaring) 716,029 735,953 1,953 1,453,934
TOTAL SCOPE 2 EMISSIONS 6,726,247 0 0 6,726,247
TOTAL SCOPE 3 EMISSIONS 61,961,052 107,153 32,146 62,100,351
OVERALL 69,403,328 843,106 34,099 70,280,533
Note: Calculated with activity data estimates and emission estimation techniques detailed in Appendix A.
a. Scope 2 and scope 3 emissions are presented as CO2 emissions while they are in fact a combination of CO2, CH4 and N2O emissions.

3678 C1-04 Coffey Arrow LNG - FINAL Greenhouse Gas Assessment_v6.docx 44 Arrow LNG Plant Project – Greenhouse Assessment Coffey Environments on behalf of Arrow Energy | PAEHolmes Job 3678C
5.4 Annual Summary of Emissions
Table 12 presents the annual greenhouse gas emission estimates that will be generated from the construction and operational activities of the Arrow LNG Plant. The emission estimates are provided based on the project’s timeline described in the introduction of section 5. Vegetation clearing occurs in the first year of Construction Phase 1, and start-up flaring emissions were only included for Year 1 and Year 9, when the LNG trains are brought on-line. Operational emissions were estimated based on the number of trains in operation. The greenhouse emissions associated with construction activities are expected to be similar for the two construction phases. Scope 3 emissions associated with upstreams activities (i.e., extraction and processing of CSG) were estimated using scope 1 emission intensities in kg CO2-e/GJ (based on the average scope 1 emissions and the average CSG throughput), sourced from the Surat Gas Greenhouse Assessment (PAEHolmes, 2011).

3678 C1-04 Coffey Arrow LNG - FINAL Greenhouse Gas Assessment_v6.docx 45 Arrow LNG Plant Project – Greenhouse Assessment Coffey Environments on behalf of Arrow Energy | PAEHolmes Job 3678C
Table 12: Greenhouse Emissions by Scope Associated with Arrow LNG Plant
Phase Operational Year Scope 1 and Scope 2 Scope 3 (Including End-Use of LNG) a
“All Electrical” “All Mechanical” “All Electrical” “All Mechanical” Emissions [t CO2-e/annum]
Construction Phase 1 b
C1 c 2014 145,046 102,311 10,185 3,511
C2 2014-2015 162,027 76,557 20,371 7,022
C3 2015-2016 162,027 76,557 20,371 7,022
C4 2016-2017 162,027 76,557 20,371 7,022 Construction/operations period 1 (includes start-up flaring of LNG Trains 1 and 2) d
1 2017-2018 4,300,785 3,315,440 33,511,170 a 33,006,578 a
Full operation of LNG trains 1 and 2
2 2018-2019 4,090,091 3,190,215 31,050,176 30,558,933
3 2019-2020 4,090,091 3,190,215 31,050,176 30,558,933
4 2020-2021 4,090,091 3,190,215 31,050,176 30,558,933
5 2021-2022 4,090,091 3,190,215 31,050,176 30,558,933
TOTAL – Construction Phase 1 C1 -1 2014-2022 793,156 408,540 91,669 31,601
TOTAL – Operation Phase 1 1 - 5 2017-2022 20,499,120 15,999,744 157,691,501 155,235,287
Construction Phase 2 e
6 2022-2023 4,252,118 3,266,773 31,070,547 30,565,955
7 2023-2024 4,252,118 3,266,773 31,070,547 30,565,955
8 2024-2025 4,252,118 3,266,773 31,070,547 30,565,955 Construction/operations period 2 (includes start-up flaring of LNG Trains 3 and 4) f
9 2025-2026 8,390,876 6,505,655 62,120,722 61,124,888
Full operation of LNG trains 3 and 4 g 10 - 25 2026-2042 8,180,181 6,380,431 62,100,351 61,117,866
TOTAL – Construction Phase 2 6 - 9 2022-2026 648,110 306,229 81,484 28,090
TOTAL – Operation Phase 2 6 - 25 2022-2042 151,382,022 118,086,635 1,148,856,498 1,130,680,516 a. Based on averaged scope 1 emission intensity for upstream activities (i.e., 7.70 kg CO2-e/GJ) for time period 2017-2042 (PAEHolmes, 2011), except for Year 1 for which the annual emission intensity was used (i.e., 12.21 kg CO2-e/GJ) . b. Construction Phase 1 involves the construction of LNG trains 1 and 2. Phase 1 is expected to commence in 2014 and occur for three and a half years. c. All the emissions associated with vegetation clearing were included in Year C1, which corresponds to a six-month period. d. Construction/operations period of a year where the construction of LNG train 2 and the operation of LNG train 1 will occur simultaneously. Based on emissions from: the operation of LNG trains 1 and 2, start-up flaring (LNG Trains 1 and 2) and construction. e. Construction Phase 2 involves the construction of LNG trains 3 and 4. Phase 2 is expected to commence in Year 6 and end in Year 9 (included). During this stage, construction of LNG trains 3 and 4, and operation of LNG trains 1 and 2 will occur simultaneously. Based on emissions from: the operation of LNG trains 1 and 2 and construction. f. Construction/operations period of a year where the construction of LNG train 4 and the operation of LNG train 3 will occur simultaneously. Start-up of LNG trains 3 & 4 in Year 9. Based on emissions from: the operation of LNG trains 1 to 4, start-up flaring (LNG Trains 3 and 4) and construction. g. The emissions from the operation of Arrow LNG are estimated to be similar for Year 10 to Year 25.

3678 C1-04 Coffey Arrow LNG - FINAL Greenhouse Gas Assessment_v6.docx 46 Arrow LNG Plant Project – Greenhouse Assessment Coffey Environments on behalf of Arrow Energy | PAEHolmes Job 3678C
6 IMPACT OF GREENHOUSE GAS EMISSIONS FROM ARROW LNG PLANT
6.1 Potential Impacts
The aggregate scope 1 and scope 2 operational emissions from the Arrow LNG Plant associated with the worst case scenario (i.e., “all electrical” power supply) are insignificant in comparison with Global 2007 fossil fuel consumption emissions (0.028%). However the project’s emissions are more significant in Australian terms, considering Australia’s 2007 emissions for the energy sector (i.e., 2%) or the Australian Government’s 2020 emissions target (i.e., 1.5%), as can be seen in Table 13. However, according to the Australian government, Australia’s total emission inventory in 2007 represents approximately 1.4% of global greenhouse emissions. Therefore the potential impacts associated with climate change directly attributable to the Arrow LNG Plant on a global scale can be expected to be negligible.
Table 13: Estimates of Greenhouse Emissions
Geographic Coverage
Source Coverage Timescale Emissions (Mt CO2-e)
Global a Consumption of fossil fuels 2007 29,335
Australia b Energy sector 2007 408.2
Australia c All sectors 2020 (Australian Government’s target)
530
Queensland d Total GHG emissions including Land Use, Land Use Change and Forestry (LULUCF) activities
2007 181.6
Arrow LNG Plant e
Scope 1 operational emissions (“All electrical”’)
Estimated annual 1.5
Scope 2 operational emissions (“All electrical”)
Estimated annual 6.7
Total operational emissions (“All electrical”)
Estimated annual 8.2
a. UNSD (2011) b. Section 2, DCC (2009a) - Energy sector includes stationary energy, transport and fugitive emissions. c. Based on 2000 Australian emissions levels for all sectors = 558 Mt CO2-e (DCCEE, 2010g). The Government has committed to reduce carbon pollution by 5 per cent from 2000 levels by 2020 (Australian Government, 2011a). d. DCC (2009c) - Emissions including land use change. e. Refer to Section 5. Additional start-up emissions in first and ninth operational years.

3678 C1-04 Coffey Arrow LNG - FINAL Greenhouse Gas Assessment_v6.docx 47 Arrow LNG Plant Project – Greenhouse Assessment Coffey Environments on behalf of Arrow Energy | PAEHolmes Job 3678C
6.2 Residual Impacts Implementing abatement measures (refer to Section 8) could reduce direct greenhouse gas emissions from Arrow LNG Plant. Given that the potential impacts of greenhouse gas emissions from Arrow LNG Plant’s current design would be negligible in a global context, the residual impact after implementing the abatement measures would also be negligible when considered globally.

3678 C1-04 Coffey Arrow LNG - FINAL Greenhouse Gas Assessment_v6.docx 48 Arrow LNG Plant Project – Greenhouse Assessment Coffey Environments on behalf of Arrow Energy | PAEHolmes Job 3678C
7 BENCHMARKING LIQUIEFIED NATURAL GAS
The product LNG from Arrow LNG Plant is likely to be combusted for heating purposes or to generate electricity. In comparison with other fossil fuels such as coal or diesel, combusting LNG for heating purposes emits less greenhouse gas emissions per unit of thermal energy produced. If LNG is combusted to produce electricity, the greenhouse gas reductions are even greater, the thermal energy from burning gas can be converted to electricity at higher efficiencies in comparison with other fossil fuels.
As such, LNG has been benchmarked against other fossil fuels with respect to:
emissions per GJ heat produced from combustion; and
emissions per MWh of electricity sent out.
Emissions associated with the upstream activities required to extract and transport fuels have not been benchmarked. This is because fuels are subject to differing transport requirements, and transported different distances before being combusted, making an equitable comparison difficult. For example, gas or coal can be shipped overseas, or combusted in close proximity to the gas field or coal mine.
7.1 Emissions per GJ Heat Produced from Combustion
Scope 1 emission factors published in NGA Factors (DCCEE, 2010f) provide average values for the quantity of greenhouse gas emissions (expressed as kg CO2-e) per GJ of fuel combusted. In comparison to traditional fossil fuels, natural gas and LNG produce significantly lower emissions per unit of energy released when combusted (on a HHV basis), as presented in Figure 1.
Source: National Greenhouse Accounts (NGA) Factors, Department of Climate Change, June 2009
Figure 1: Emissions per GJ of Fuel Combusted

3678 C1-04 Coffey Arrow LNG - FINAL Greenhouse Gas Assessment_v6.docx 49 Arrow LNG Plant Project – Greenhouse Assessment Coffey Environments on behalf of Arrow Energy | PAEHolmes Job 3678C
7.2 Emissions per MWh Electricity Sent Out
The generation of electricity from the combustion of LNG emits significantly less greenhouse gas emissions per MWh than electricity generated from other fossil fuels. In comparison with other fossil fuels, natural gas emits less greenhouse gas emissions per unit of thermal energy produced (refer to Section 7.1), and this thermal energy can be converted to electricity at a higher efficiency.
Table 14 compares the emissions per MWh of electricity sent out for gas-fired and coal-fired power stations. Thermal efficiencies have been based on Best Available Technology standards for power cycle efficiencies (AGO, 2006). The configuration that produces the least emissions per MWh sent out is the natural gas-fired combined cycle gas turbine, which emits:
65% less emissions than a brown coal-fired ultra super critical power station; and
53% less emissions than a black coal-fired ultra super critical power station.
Natural gas-fired open cycle gas turbines also produce significantly less emissions per MWh than coal-fired power cycle configurations.
Table 14: Emissions per MWh of Electricity Sent Out
Power Cycle Fuel ηthermal
a Scope 1 EF b Emissions per MWh of
Electricity c (%) (kg CO2-e/ GJ) (kg CO2-e /MWh)
USC - wet cooled Brown coal 32.3 93.11 1,038
USC - wet cooled Black coal 41.2 88.43 773
Open cycle GT Natural gas 33.1 51.33 558
Combined cycle GT - wet cooled d
Natural gas 51.6 51.33 358
Note: USC – Ultra Super Critical; GT – Gas Turbine; a. Thermal efficiencies based on Best Available Technology standards sourced from the Australian Greenhouse Office (AGO, 2006). b. Table 1 and Table 2, DCCEE (2010f). c. Based on 1MWh = 3.6GJ. d. The high greenhouse gas emissions from the “all electrical” option are a direct result of the 892 kg CO2/MWh CO2 penalty
for local power generation, predominantly from coal-fired generation. If a combined cycle gas-fired power plant was available at 352 kg CO2/MWh, the “all electrical” option would have half the greenhouse gas emissions indicated above.

3678 C1-04 Coffey Arrow LNG - FINAL Greenhouse Gas Assessment_v6.docx 50 Arrow LNG Plant Project – Greenhouse Assessment Coffey Environments on behalf of Arrow Energy | PAEHolmes Job 3678C
8 AVOIDANCE, MITIGATION AND MANAGEMENT MEASURES
The emissions presented in Section 5 are based on the current Arrow LNG Plant design, which incorporates measures to mitigate greenhouse gas emissions. In addition, measures to improve energy efficiency and increase LNG production help to decrease the emissions intensity (emissions per GJ fuel produced) of Arrow LNG Plant. A summary of the measures is presented in Table 15 which relate to the processing, power generation and compression processes described in Section 1.2.1.
Emission estimations have not been compared against a baseline case, as data has only been provided for the process design that incorporates greenhouse gas emissions intensity reduction measures.
Table 15: Measures to Reduce Greenhouse Gas Emissions Intensity
Process Section ”All Mechanical” Option “All Electrical” Option
Driver Type
Aero derivative gas turbines (GTs) have been chosen as process drivers. This type of turbines offers increased energy efficiency over industrial machines, and allows variable drive speeds to account for fluctuations in gas flow.
N/A
LNG Operating Pressure
The operating pressure of LNG has been maximised up to the limits of the piping class. Maximising operating pressure increases LNG production. Typically LNG production increases by 0.3–0.5% for every 1 bar increase in liquefaction pressure, as higher pressures enable impurity removal with less product loss.
Compressor Configuration
A configuration of parallel compressors has been chosen, leading to almost full use of GT capacity, allowing operation at higher GT efficiency.
N/A
Inlet Air Temperature Suppression
Inlet Air Chilling (IAC) has been proposed at the MR to maximise production. IAC uses its own propane to chill the inlet air to the MR gas turbines.
N/A
Regeneration Gas
The regeneration gas will be heated in a regeneration gas heater, which utilises heat from the hot exhaust of the process drivers. This increases energy efficiency as heating requirements are reduced.
N/A
Inter-cooling Compressor inter-cooling stages have been incorporating into the design. This reduces the power requirements associated with compression.
Cooling Method
Air cooling has been maximised to achieve tighter approach temperatures, and therefore the condensing pressure required in the refrigerant loops. This reduces the required refrigerant compressor discharge pressure and thus, reduces the driver fuel consumption.
N/A
AGRU Solvent Selection
The acid gas removal unit (AGRU) uses the Adip-X solvent, which has lower hydrocarbon co-adsorption, and hence lower hydrocarbon losses, in comparison with other solvents that can be used.
Propane Purity The process uses only high purity propane. This improves the efficiency of refrigeration processes.
Source: Shell SALNG Greenhouse Gas Emissions and Energy Efficiency Review, provided by Shell Australia (Coffey Environments, 2011n)

3678 C1-04 Coffey Arrow LNG - FINAL Greenhouse Gas Assessment_v6.docx 51 Arrow LNG Plant Project – Greenhouse Assessment Coffey Environments on behalf of Arrow Energy | PAEHolmes Job 3678C
8.1 Avoidance
Market based mechanisms for management of greenhouse gas emissions should be supported because they are best suited for the efficient allocation of greenhouse gas mitigation. In developing the design options for the LNG facility, assumed carbon costs have been included in the evaluation of project economics. Process features that could decrease emissions from the project are detailed in the following sections. It should be noted that the decision to implement emission reduction technologies is usually also weighted against economic viability and other aspects such as social acceptance.
8.1.1 Power Generation
The majority of emissions from the project are associated with onsite gas combustion for power generation. The process will use open cycle, aero derivative gas turbines. Emissions from power generators can be decreased if combined cycle gas turbines are used, where hot exhaust gas from the gas turbine is used to drive a steam cycle turbine. If combined cycle gas turbines are utilised to generate power, emissions could potentially be reduced by up to 35% (refer to Table 14).
8.1.2 Renewable Energy
Renewable energy is currently unable to cost-effectively and reliably supply the large energy requirements of the project. However, renewable sources of energy, such as solar and wind power, could be considered to supplement gas-fired power generation. Utilising renewable energy sources would decrease gas consumption, decreasing greenhouse gas emissions.
8.1.3 Carbon Capture and Storage
Carbon capture and storage (CCS) involves capturing carbon dioxide and storing it in such a way that it does not enter the atmosphere. Typically carbon dioxide is sequestered into geological formations.
Based on the current design, CCS would be most applicable to CO2 vented from the AGRU, as the stream vented from the AGRU is relatively pure CO2 (greater than 90 mol%). CCS of the CO2 emitted from the gas turbine exhausts is not considered to be viable at this stage, as no economic technology exists that is capable of removing CO2 from the turbine exhaust gases at the volume of operation required for Arrow LNG Plant.
8.1.4 Fugitive Losses
Fugitive emissions can be minimised through ongoing plant maintenance and monitoring programs. It is recommended that:
plant equipment be routinely maintained;
seals and gaskets be routinely inspected and replaced to reduce losses;
gas flow rates be monitored throughout the process, so that points of loss can be identified;
venting be reduced to as low as possible; and
where planned venting occurs, gas should be flared to convert CH4 to CO2.
Routine maintenance and venting procedures are outlined in Shell (Arrow)’s Health Security, Safety, the Environment & Social Performance Control Framework Commitment & Policy, February 2010.

3678 C1-04 Coffey Arrow LNG - FINAL Greenhouse Gas Assessment_v6.docx 52 Arrow LNG Plant Project – Greenhouse Assessment Coffey Environments on behalf of Arrow Energy | PAEHolmes Job 3678C
8.1.5 Gas Processing and Compression Emissions
The principles of “As Low As Reasonably Practical” (ALARP) have been applied to ensure energy usage efficiency and emission minimisation during the design of the Arrow LNG Plant, such as:
efficient use of energy sources, aimed at resource conservation and minimisation of emissions;
combined cycle generation and waste heat recovery to be applied where technically feasible;
waste recovery systems; and
vapour recovery on tanks, loading systems, etc.
The design includes adequate equipment to monitor and record fuel usage and energy efficiency; this monitoring and recording has been based on automatic on-line technology where technically feasible.
International Finance Corporation/World Bank Group (IFC/WBG) guidelines (e.g., draft Thermal Power Guidelines [ 5.54 5.54]) provide benchmarks for energy efficiency and CO2 emissions. The design of the Arrow LNG Plant has taken into account these benchmarks and demonstrates ALARP where there are any deviations from benchmarks.
Potential opportunities for further reducing greenhouse gas emissions and improving energy efficiency in the process are detailed in Table 16.
Table 16: Potential Avoidance Options
Process Section Comments
Refrigerant Pressure Levels
Adding additional refrigerant pressure levels could be considered to increase overall process efficiency (i.e., thereby requiring less electricity per unit of gas produced).
Internal Insulation
Internal insulation of the dehydration beds could reduce heating and cooling requirements during bed regeneration, reducing energy consumption (i.e., thereby requiring less electricity per unit of gas produced).
LMR/ HMR Expanders
Pressure expanders for heavy mixed refrigerant (HMR) and light mixed refrigerant (LMR) could be implemented for pressure let down, improving process efficiency and for partial energy recovery (i.e., thereby requiring less electricity per unit of gas produced).
LNG Expanders An LNG expander is currently part of the process design, but it is not assigned to any particular duty. As above, the expander could be used for partial energy recovery (i.e., thereby requiring less electricity per unit of gas produced).
Source: Shell SALNG Greenhouse Gas Emissions and Energy Efficiency Review, provided by Shell Australia (Coffey Environments, 2011n).
During plant operations, energy use and energy efficiency shall be actively monitored during operations and 5-year Energy Management Plans shall be in place that describes the continuous improvement process to maximise the efficiency of energy use and throughput.
8.1.6 Comparison with Best Available Technology
The greenhouse emission intensity of Arrow LNG Plant associated with scope 1 and scope 2 emissions for the “all electrical” scenario and scope 1 emissions for the ”all mechanical” scenario (in t CO2-e/t LNG produced) has been benchmarked against the emission intensity of other LNG production facilities in Australia and overseas. It should be noted that only the emissions relevant to the production at the facility are taken into account to estimate the greenhouse gas emission intensity.

3678 C1-04 Coffey Arrow LNG - FINAL Greenhouse Gas Assessment_v6.docx 53 Arrow LNG Plant Project – Greenhouse Assessment Coffey Environments on behalf of Arrow Energy | PAEHolmes Job 3678C
As shown in Figure 2, Arrow LNG Plant has an emission intensity of approximately 0.45 t CO2-e/ t LNG produced (based on 8.2 Mt CO2-e emissions/ 18 Mtpa LNG) associated with the “all electrical” scenario versus 0.35 t CO2-e/ t LNG produced for the “all mechanical” scenario (based on 6.4 Mt CO2-e emissions/ 18 Mtpa LNG) (refer to Table 10 and Table 11). According to Figure 2, Arrow LNG Plant has a relatively low emissions intensity when considering the “all mechanical” option whilst it has a relatively high emissions intensity when considering the “all electrical” option in comparison with facilities in Australia and abroad.
This indicates that while further opportunities exist for Arrow LNG Plant to reduce its greenhouse gas emissions when using an “all mechanical” configuration, the current design utilises Best Available Technology (BAT) for the industry. Details of BAT incorporated into the Arrow LNG Plant process design have been provided in Table 15. Conversely, an “all electrical” configuration is relatively greenhouse gas intensive.

3678 C1-04 Coffey Arrow LNG - FINAL Greenhouse Gas Assessment_v6.docx 54 Arrow LNG Plant Project – Greenhouse Assessment Coffey Environments on behalf of Arrow Energy | PAEHolmes Job 3678C
Notes:
The Queensland Curtis LNG, Gladstone LNG (GLNG) – Fisherman’s Landing, APLNG and PNG LNG are currently still in design phases
Sources of information and locations of the LNG facilities are provided in Appendix C.
Figure 2: Greenhouse Gas Emission Intensity of LNG Facilities
0.460.45
0.44
0.39 0.39
0.360.35 0.35 0.35
0.33
0.310.30
0.29
0.26
0.22
0
0.05
0.1
0.15
0.2
0.25
0.3
0.35
0.4
0.45
0.5
Emission
s Intensity
(t CO
2‐e/t LNG)
Australian Facilities International Facilities Arrow LNG

3678 C1-04 Coffey Arrow LNG - FINAL Greenhouse Gas Assessment_v6.docx 55 Arrow LNG Plant Project – Greenhouse Assessment Coffey Environments on behalf of Arrow Energy | PAEHolmes Job 3678C
8.2 Emissions Offsetting Opportunities
The greenhouse gas emissions produced by the Arrow LNG Plant can be offseted under the Carbon Farming Initiative by investing in third party projects that reduce emissions below a demonstrated baseline. Examples of projects that reduce emissions are:
forestry projects that reduce emissions by:
o sequestering carbon through reforestation or afforestation;
o prevent deforestation; or
o increase the carbon contained in soils through soil management.
renewable energy, such as wind farms, geothermal or solar; and
destruction of methane produced from landfills, wastewater treatment plants etc.
8.3 Emissions Trading
The Arrow LNG Plant will provide for the trading of emission permits under the Clean Energy Future Plan to meet permitting liabilities during the second phase (i.e., cap and trade emissions trading scheme) of the proposed carbon price mechanism if their internal costs of abatement are higher than the price of permits, and to directly reduce their emissions if their internal costs of abatement are lower than the price of permits.

3678 C1-04 Coffey Arrow LNG - FINAL Greenhouse Gas Assessment_v6.docx 56 Arrow LNG Plant Project – Greenhouse Assessment Coffey Environments on behalf of Arrow Energy | PAEHolmes Job 3678C
9 GREENHOUSE GAS AND ENERGY MANAGEMENT PLAN
9.1 Arrow Energy’s Policies
In addition to mandatory commitments, such as greenhouse gas and energy reporting under NGER, Arrow Energy is developing a greenhouse gas standard as part of its integrated Health, Safety and Environmental Management System (HSEMS).
The environmental component of the HSEMS focuses on environmental aspects and potential environmental impacts and then integrates the environmental risks into the overall management plans to reduce the risk of these impacts. The intent of the risk management process and the management plans is to reduce the assessed risk to acceptable level.
Arrow Energy has numerous performance criteria that enable auditing of their adherence to their HSEMS, such as reducing the “Environmental Footprint” of the project where practicable, and considering energy and waste generation in all activities. A key tool in meeting Arrow Energy’s performance criteria will be regular estimations of emissions that will help to keep track of emissions targets, and ensure that equipment is kept at acceptable standards.
9.1.1 Voluntary Initiatives
Arrow Energy recognises the challenges posed by climate change and intends to develop a greenhouse gas standard as part of its HSEMS. It is expected that the standard will cover items such as:
Arrow Energy’s commitment to reduce the greenhouse intensity of its operations;
compliance with relevant greenhouse legislation on emissions reporting, energy efficiency and greenhouse management;
targets, including their evaluation and reporting;
preparing for the changes relating to carbon constraints; and
venting and flaring commitments.
Arrow Energy supports the development of technologies and management practices that reduce greenhouse emissions and will maintain effective reporting and measurement systems. Furthermore, Arrow Energy will evaluate its greenhouse performance with respect to the design and selection of equipment for the project.
9.1.2 Mandatory Reporting
In addition to the voluntary initiatives detailed above, greenhouse gas emissions, energy usage and energy efficiency opportunities for Arrow LNG Plant operation must be estimated and publicly reported under:
NGER (refer to Section 2.2.2); and
the Energy Efficiency Opportunities Program (refer to Section 2.2.3).

3678 C1-04 Coffey Arrow LNG - FINAL Greenhouse Gas Assessment_v6.docx 57 Arrow LNG Plant Project – Greenhouse Assessment Coffey Environments on behalf of Arrow Energy | PAEHolmes Job 3678C
10 CONCLUSIONS
This assessment describes the greenhouse gas emissions from the construction and operation of Arrow LNG Plant, and predicts the impacts associated with these emissions.
Direct (scope 1) and indirect (scope 2) greenhouse gas emissions from the operation of Arrow LNG Plant have been estimated to be 8.2 Mt CO2-e/annum (excluding start-up flaring) for the “all electrical” option versus 6.4 Mt CO2-e/annum (excluding start-up flaring) for the “all mechanical” option (scope 1 only). The majority of emissions are associated with gas combustion for the facility’s power requirements and start-up flaring with the ”all mechanical” configuration and electricity consumption with the “all electrical” alternative. The worst-case scenario (i.e., “all electrical” operational option) represents approximately 1.5% of the Australian Government’s 2020 emissions target (i.e., 5% emissions reduction from 2000 levels).
For the “all electrical” scenario, Phase 1 (i.e., 2014-2022) will generate a total of 20.5 Mt CO2-e of scope 1 and scope 2 emissions from the operation of Arrow LNG, while Phase 2 (i.e., 2022-2042) will generate a total of 151.4 Mt CO2-e. In comparison, the associated scope 1 and scope 2 greenhouse gas emissions from plant construction were estimated to be 793 kt CO2-e (i.e., 3.9% of the operational emissions) for Phase 1, and 648 kt CO2-e (0.4% of the operational emissions) for Phase 2.
The aggregate (direct and indirect) greenhouse gas emissions associated with the worst case scenario from Arrow LNG Plant are minor (i.e., 15.5%) in comparison with greenhouse gas emissions associated with the end-use of the product fuel. These end-use emissions will occur from the combustion of LNG for heating and electricity purposes. In comparison with other fossil fuels, particularly coal, combusting LNG for heating purposes emits less greenhouse gas emissions per unit of thermal energy produced. If LNG is combusted to produce electricity, the greenhouse gas reductions, when compared to other fossil fuels, are even greater per MWh of electricity generated.
Arrow LNG Plant is a significant project in the Gladstone region for both options and as a result, its activities will contribute significantly to the total greenhouse gas emissions of the region. However, the impacts associated with Arrow LNG Plant’s greenhouse gas emissions, with respect to climate change, will be in proportion with Arrow LNG Plant’s contribution to global greenhouse gas emissions. As such, the impacts are expected to be negligible.
A number of greenhouse gas emission mitigation measures have been included in the Arrow LNG Plant design, including high efficiency gas turbines for power generation for the “all mechanical” option. When considering this option, the emissions intensity (t CO2-e/t LNG) is amongst the lowest emission intensities of existing and proposed LNG facilities in Australia and abroad, demonstrating that Arrow LNG Plant utilises Best Available Technology (BAT). In addition, Arrow Energy has committed to the ongoing measurement and monitoring of the LNG plant’s emissions and energy consumption, through a range of schemes, including:
the National Greenhouse and Energy Reporting (NGER) System; and
the Energy Efficiency Opportunities Program (EEO).
While Arrow LNG Plant utilises BAT and is producing a low emissions fossil fuel, it is recommended that Arrow continues to investigate greenhouse gas abatement measures. This includes both ongoing monitoring and maintenance programs at the site-level, to reduce fugitive emissions from equipment leaks, and high-level investigations into retrofitting Arrow LNG Plant with new technology, such as combined cycle power generation and carbon capture and storage.

3678 C1-04 Coffey Arrow LNG - FINAL Greenhouse Gas Assessment_v6.docx 58 Arrow LNG Plant Project – Greenhouse Assessment Coffey Environments on behalf of Arrow Energy | PAEHolmes Job 3678C
Arrow Energy is expected to be a direct participant in the carbon price mechanism as it is currently proposed. This will mean that Arrow Energy must report their emissions and hold emission permits at the end of each period. However, emissions thresholds at which the purchase of emissions permits will be required from entities (direct emitters) are not yet determined.

3678 C1-04 Coffey Arrow LNG - FINAL Greenhouse Gas Assessment_v6.docx 59 Arrow LNG Plant Project – Greenhouse Assessment Coffey Environments on behalf of Arrow Energy | PAEHolmes Job 3678C
11 REFERENCES
AGO (2006) Technical Guidelines: Generator Efficiency Standards, Australian Greenhouse Office Department of the Environment and Heritage, December 2006.
API (2009) Compendium of Greenhouse Gas Emissions Methodologies for the Oil and Natural Gas Industry, American Petroleum Institute, August 2009.
APLNG (2010) Australia Pacific LNG Project – Environmental Impact Statement, Australia Pacific LNG Pty Limited, Brisbane, Queensland, March 2010. http://www.aplng.com.au/eis/ (accessed 24 March 2010)
Arrow (2009) 2009 Financial Report, Arrow Energy Limited, June 2009. http://www.arrowenergy.com.au/page/Media_Centre/Publications/Annual_Reports/ (accessed 20 April 2011)
Arrow (2011) Electricity Sales, Arrow Energy, April 2011. http://www.arrowenergy.com.au/page/Projects/Electricity_Sales (accessed 20 April 2011)
Australian Government (2011a) Securing a clean energy future – The Australian Government’s climate change plan, Clean Energy Future, Commonwealth of Australia 2011. http://www.cleanenergyfuture.gov.au/wp-content/uploads/2011/07/Consolidated-Final.pdf (accessed 2 August 2011).
Australian Government (2011b) 500 biggest polluting companies, Clean Energy Future, Commonwealth of Australia 2011. http://www.cleanenergyfuture.gov.au/500-companies/ (accessed 4 August 2011)
Carbon Neutral (2011), Carbon Offsets, Perth 2011. http://www.carbonneutral.com.au/organisations/offsets.html (accessed 4 August 2011)
Coffey Environments (2011a) 7033_Project_Description_Update_Technical_Specialists_PAEHolmes_20110401_v1.pdf, Pers. Comm. via e-mail, Christopher Armour, 01/04/11.
Coffey Environments (2011b) 7033_RFI_cons_v4_3.xls, Pers. Comm. via e-mail, Melissa Ellis, 17/05/10.
Coffey Environments (2011c) EIS Input sheet #021-rev0 GHG - Response to RFI PAE Holmes.docx, Pers. Comm. via e-mail, Christopher Armour, 24/03/11.
Coffey Environments (2011d) EIS Input Sheet #020-rev1 Arrow LNG - Dredging Curtis Island.docx, Pers. Comm. via e-mail, Christopher Armour, 28/02/11.
Coffey Environments (2011e) EIS Input sheet #1005-rev0 Launch Site 1 Figure Dredge Volume.docx, Pers. Comm. via e-mail, Christopher Armour, 01/03/11.
Coffey Environments (2011f) 1254R_Leopard_Terminals.pdf, Pers. Comm. via e-mail, Rebecca Lumley, 23/02/11.
Coffey Environments (2011g) EIS Input sheet #100-rev0 Harbour Crossing Vessels.docx, Pers. Comm. via e-mail, Christopher Armour, 14/03/11.

3678 C1-04 Coffey Arrow LNG - FINAL Greenhouse Gas Assessment_v6.docx 60 Arrow LNG Plant Project – Greenhouse Assessment Coffey Environments on behalf of Arrow Energy | PAEHolmes Job 3678C
Coffey Environments (2011h) 7033_TechnicalSpecialists_Re-engagement Presentation_PAE_v1.pptx, Pers. Comm. via e-mail, Rebecca Lumley, 27/01/11.
Coffey Environments (2011i) EIS Input sheet #1018-rev0 Harbour Crossing Frequency - Shipping.docx, Pers. Comm. via e-mail, Christopher Armour, 06/04/11.
Coffey Environments (2011j) FW: Arrow LNG - GHG, Air Data - LNG Tug specifications, Pers. Comm. via e-mail, Rebecca Lumley, 24/02/11.
Coffey Environments (2011k) EIS Input sheet #008-rev1 Acid Gas Nitrogen Rejection.xls, Pers. Comm. via e-mail, Kristen Wicks, 25/02/11.
Coffey Environments (2011l) PAE RFI Coffey Response.pdf, Pers. Comm. via e-mail, Christopher Armour, 03/03/11.
Coffey Environments (2011m) 7033_ProjectDescription_Update_20110301_v1.pdf, Pers. Comm. via e-mail, Christopher Armour, 01/03/11.
Coffey Environments (2011n) Arrow LNG Plant - All Mechanical Option Arrow GHG Estimate, Pers. Comm. via e-mail Christopher Armour, 21/04/2011.
Coffey Environments (2011o) FW: LNG - All Mechanical Option Arrow GHG Estimates, Pers. Comm. via e-mail Christopher Armour, 21/04/2011.
Coffey Environments (2011p) EIS Input sheet #016-rev0 Flare data.xlsx, Pers. Comm. via e-mail, Kristen Wicks, 25/02/11.
Coffey Environments (2011q) EIS Input sheet #007-rev0 Diesel Consumption.doc, Pers. Comm. via e-mail, Christopher Armour, 18/03/11.
Coffey Environments (2011r) Pages from Concept Report GHD.pdf, Pers. Comm. via e-mail, Christopher Armour, 14/03/11.
Coffey Environments (2011s) “Greenhouse Gas Emissions and Energy Efficiency Review_summaryforCoffey.docx”.
Coffey Environments (2011t) Cumulative Impact Assessment – Arrow LNG Plant, CD, 02/11.
Coffey Environments (2011u) EIS Input sheet #021-rev1 GHG - Response to RFI PAE Holmes.docx, Pers. Comm. via e-mail, Christopher Armour, 27/05/2011.
Coffey Environments (2011v) EIS Input sheet #003-rev1 Construction Workforce Histogram-Updated.docx, Pers. Comm. via e-mail, Christopher Armour, 18/03/2011.
Coffey Environments (2011w) Arrow LNG Plant - GHG from land clearing, Pers. Comm. via e-mail Christopher Armour, 1/06/2011.
Coffey Environments (2011x) EIS Input Sheet #017 Emissions and Noise Data.xlsx, Pers. Comm. via e-mail Rebecca Lumley, 27/01/10.
Coffey Environments (2011y) 3678-C Coffey Arrow Gladstone LNG Project - Activity data used in the report_07-10-11.xlsx, Pers. Comm. via e-mail Michael Drowley, 11/10/11.

3678 C1-04 Coffey Arrow LNG - FINAL Greenhouse Gas Assessment_v6.docx 61 Arrow LNG Plant Project – Greenhouse Assessment Coffey Environments on behalf of Arrow Energy | PAEHolmes Job 3678C
Copenhagen Climate Council (2011) Climate Negotiations Updates, Copenhagen Climate Council. http://www.copenhagenclimatecouncil.com/get-informed/climate-negotiations-updates/what-is-the-ipcc.html (accessed 25/05/2011).
DCCEE (2007) National Greenhouse and Energy Reporting Act 2007 (the NGER Act), Department of Climate Change and Energy Efficiency, Commonwealth of Australia, 2007. http://www.climatechange.gov.au/government/initiatives/national-greenhouse-energy-reporting/nger-act.aspx (accessed 8 April 2011)
DCC (2008a) The Green Paper, Carbon Pollution Reduction Scheme Green Paper, Department of Climate Change, Commonwealth of Australia, July 2008. http://www.climatechange.gov.au/publications/cprs/green-paper/cprs-greenpaper.aspx (accessed 20 April 2011).
DCC (2008b) The White Paper, Carbon Pollution Reduction Scheme Australia’s Low Pollution Future, Department of Climate Change, Commonwealth of Australia, December 2008. http://www.climatechange.gov.au/publications/cprs/white-paper/cprs-whitepaper.aspx (accessed 20 April 2011).
DCC (2008c) National Greenhouse and Energy Reporting Regulations 2008 (Reporting Regulations), Department of Climate Change, Commonwealth of Australia, August 2008. http://www.climatechange.gov.au/government/initiatives/national-greenhouse-energy-reporting/reporting-legislation.aspx (accessed 8 April 2011).
DCC (2008d) National Greenhouse and Energy Reporting (Measurement) Determination 2008, Department of Climate Change, Commonwealth of Australia, June 2008. http://www.climatechange.gov.au/government/initiatives/national-greenhouse-energy-reporting/reporting-legislation/progress/determination.aspx (accessed 8 April 2011).
DCC (2009a) Australia’s National Greenhouse Accounts: National Greenhouse Gas Inventory Accounting for the Kyoto Target, Department of Climate Change, Commonwealth of Australia, May 2009. http://www.climatechange.gov.au/climate-change/~/media/publications/greenhouse-report/national-greenhouse-gas-inventory-pdf.ashx (accessed 8 April 2011).
DCC (2009c) Australia’s National Greenhouse Accounts: State and Territory Greenhouse Gas Inventories 2007, Department of Climate Change, Commonwealth of Australia, May 2009. http://www.climatechange.gov.au/~/media/publications/greenhouse-acctg/state_territory_inventory.ashx (accessed 8 April 2011).
DCC (2009d) National Greenhouse and Energy Reporting Amendment Regulations 2008 (Reporting Regulations), Department of Climate Change, Commonwealth of Australia, December 2009. http://www.climatechange.gov.au/government/initiatives/national-greenhouse-energy-reporting/reporting-legislation.aspx (accessed 8 April 2011).
DCCEE (2009e) National Greenhouse and Energy Reporting (Audit) Determination 2009, Department of Climate Change and Energy Efficiency, Commonwealth of Australia, June 2008. http://www.climatechange.gov.au/en/government/initiatives/national-greenhouse-energy-reporting/audit/framework.aspx (accessed 8 April 2011).

3678 C1-04 Coffey Arrow LNG - FINAL Greenhouse Gas Assessment_v6.docx 62 Arrow LNG Plant Project – Greenhouse Assessment Coffey Environments on behalf of Arrow Energy | PAEHolmes Job 3678C
DCCEE (2010d) National Greenhouse and Energy Reporting (Measurement) Determination 2008 as amended – Reporting Year 2010-11, Department of Climate Change and Energy Efficiency, Commonwealth of Australia, June 2010. http://www.climatechange.gov.au/government/initiatives/national-greenhouse-energy-reporting/reporting-legislation/progress/determination.aspx (accessed 8 April 2011).
DCCEE (2010e) National Greenhouse and Energy Reporting System Measurement Technical Guidelines 2010 (Technical Guidelines), Department of Climate Change and Energy Efficiency, Commonwealth of Australia, June 2010. http://www.climatechange.gov.au/publications/greenhouse-report/nger-technical-guidelines.aspx (accessed 8 April 2011).
DCCEE (2010f) National Greenhouse Accounts (NGA) Factors, Department of Climate Change and Energy Efficiency, Commonwealth of Australia, July 2010.
DCCEE (2010g), Fact sheet: Australia's emissions projections 2010, http://www.climatechange.gov.au/en/publications/projections/australias-emissions-projections/factsheet-emissions-projections.aspx (accessed 7 November 2011).
DRET (2010) Energy Efficiency Opportunities, Department of Energy, Resources and Tourism, June 2010. http://www.ret.gov.au/energy/efficiency/eeo/about/Pages/default.aspx (accessed 8 April 2011)
DRET (2010) Energy Efficiency Opportunities Act 2006, Department of Energy, Resources and Tourism, July 2006. http://www.ret.gov.au/energy/efficiency/eeo/eeolegislation/Pages/default.aspx (accessed 20 April 2011)
DiNapoli R & Yost C (2003) ”Benchmarking study compares LNG plant costs”, Oil & Gas Journal, vol. 101,pp 56-59.
DME (2008) Queensland Coal Seam Gas, Department of Mines and Energy, Queensland Government, September 2008. http://www.dme.qld.gov.au/zone_files/Petroleum_and_Gas_PDFs/dme_csg_factsheet_jul_08_v_10.pdf (accessed 20 April 2011).
Garnaut (2008) The Garnaut Climate Change Review, Commonwealth of Australia, Cambridge University Press. http://www.garnautreview.org.au (accessed 20 April 2011)
Garnaut (2011) The Garnaut Review 2011: Australia in the Global Response to Climate Change, Commonwealth of Australia, Cambridge University Press. http://www.garnautreview.org.au/update-2011/garnaut-review-2011.html (accessed 14 June 2011)
IEA (2011) R, D & D Projects Database – Gorgon Gas development, International Energy Agency. http://www.co2captureandstorage.info/project_specific.php?project_id=122 (accessed 12 May 2011)
IPPC (2004) 16 Years of Scientific Assessment in Support of the Climate Convention, IPPC Brochure, December 2004.

3678 C1-04 Coffey Arrow LNG - FINAL Greenhouse Gas Assessment_v6.docx 63 Arrow LNG Plant Project – Greenhouse Assessment Coffey Environments on behalf of Arrow Energy | PAEHolmes Job 3678C
http://www.ipcc.ch/pdf/10th-anniversary/anniversary-brochure.pdf.
IPCC (2007a) Summary for Policymakers. In: Climate Change 2007: The Physical Science Basis. Contribution of Working Group I to the Fourth Assessment Report of the Intergovernmental Panel on Climate Change Solomon, S., D. Qin, M. Manning, Z. Chen, M. Marquis, K.B. Averyt, M.Tignor and H.L. Miller (eds.). Cambridge University Press, Cambridge, United Kingdom and New York, NY, USA. http://www.ipcc.ch/pdf/assessment-report/ar4/wg1/ar4-wg1-spm.pdf (accessed 25 August 2010)
IPCC (2007b) Climate Change 2007: The Physical Science Basis. Contribution of Working Group I to the Fourth Assessment Report of the Intergovernmental Panel on Climate Change Solomon, S., D. Qin, M. Manning, Z. Chen, M. Marquis, K.B. Averyt, M.Tignor and H.L. Miller (eds.) Cambridge University Press, Cambridge, United Kingdom and New York, NY, USA. http://www.ipcc.ch/ipccreports/ar4-wg1.htm.
Kewan Bond (2008) Greenhouse Gas Assessment – PNG Liquefied Natural Gas Project, Kewan Bond Pty Ltd, Fremantle, Western Australia, December 2008. http://www.pnglng.com/media/pdfs/environment/eis_appendix25.pdf (accessed 31 March 2010)
KPMG (2011) The proposed carbon price mechanism, KPMG, March 2011. http://www.kpmg.com/AU/en/IssuesAndInsights/ArticlesPublications/Pages/Proposed-carbon-price-mechanism.aspx (accessed 25 May 2011)
LPA (2010) The Coalition’s Direct Action Plan Policy, Liberal Party Australia, 2010. http://www.liberal.org.au/~/media/Files/Policies%20and%20Media/Environment/The%20Coalitions%20Direct%20Action%20Plan%20Policy.ashx (accessed 20 April 2011)
LPA (2011) Tony Abbott's response to Labor's big new Carbon Tax, Liberal Party Australia, 2011.http://www.saliberal.org.au/Video/TabId/144/VideoId/27/Tony-Abbotts-Response-To-Labors-Big-New-Carbon-Tax.aspx (accessed 3 August 2011)
NOAA (2011a), Nitrous Oxide (N2O) – Combined Data Set, National Oceanic & Atmospheric Administration – Earth System Research Laboratory. http://www.esrl.noaa.gov/gmd/hats/combined/N2O.html (accessed 08/11/2011)
NOAA (2011b), Sulfur hexafluoride (SF6) – Combined Data Set, National Oceanic & Atmospheric Administration – Earth System Research Laboratory.
NOAA (2011c), Trends in Atmospheric Carbon Dioxide, National Oceanic & Atmospheric Administration – Earth System Research Laboratory. http://www.esrl.noaa.gov/gmd/ccgg/trends/global.html#global_data (accessed 08/11/2011)
MPCCC (2011) Carbon Price Mechanism, Multi-Party Climate Change Committee, February 2011. http://www.pm.gov.au/sites/default/files/MPCC_carbon_price_mechanism.pdf (accessed 25 May 2011)
Moura Link (2008) Environmental Impact Statement, Moura Link - Aldoga Rail Project, chapter 10 - Air environment, revision 3, Queensland Rail, June 2008.
PAEHolmes (2010a) "IMS Dredges 7012 HP Dredger.docx”.

3678 C1-04 Coffey Arrow LNG - FINAL Greenhouse Gas Assessment_v6.docx 64 Arrow LNG Plant Project – Greenhouse Assessment Coffey Environments on behalf of Arrow Energy | PAEHolmes Job 3678C
http://www.imsdredge.com/7012HP-About.htm, (accessed 18 March 2011).
PAEHolmes (2010b) "IMS Dredges 7012 HP Dredger-Spec-2008.pdf” http://www.imsdredge.com/7012HP-Specs.htm (accessed 18 March 2011).
PAEHolmes (2010c) Pers. Comm. via e-mail, Andrea Wilkinson (SMIT Marine Australia Pty Ltd), 02/03/11.
PAEHolmes (2010d) ''Fast Cat 250 pax Specification Sheet.docx” http://seaspeeddesign.com/boats/calypso.htm (accessed 7 April 2011).
PAEHolmes (2010e) ''Ro-Pax 300 pax Specification Sheet.docx”. http://www.workboatsinternational.com/ice-class-ropax-vessel-stls1188.html (accessed 7 April 2011).
PAEHolmes (2011) “3568-A4-05 Arrow Energy Surat Gas Project - DRAFT Greenhouse Gas Assessment.docx”, PAEHolmes Brisbane, 8 September 2011.
QGC (2009) Queensland Curtis LNG Project - Volume 7: Greenhouse Gas Management, QGC Ltd, Brisbane, Queensland, July 2009.http://qclng.com.au/uploads/docs/eis/vol07/Vol-7-Greenhouse-Gas-Management.pdf (accessed 15 March 2010)
Queensland Government (2009) ClimateQ: toward a greener Queensland, Department of Environment and Resource Management, 2009.
Shell (2009) Prelude Floating LNG Project - Draft Environmental Impact Statement, Shell Development Pty Ltd, Perth, Western Australia. October 2009. http://www.shell.com.au/home/content/aus/aboutshell/who_we_are/shell_au/operations/upstream/prelude/ (accessed 30 March 2010)
Shell Australia Environment - Climate change and Shell. http://www.shell.com.au/home/content/aus/environment_society/respecting_the_environment/ (accessed 11 May 2010)
Stern (2006) Stern Review The Economics of Climate Change, HM Treasury 2006. http://webarchive.nationalarchives.gov.uk/+/http://www.hm-treasury.gov.uk/stern_review_report.htm (accessed 10 April 2009)
UNFCCC (2009) Report of the Conference of the Parties on its fifteenth session, held in Copenhagen from 7 to 19 December 2009, United Nations Framework Convention on Climate Change, December 2009. http://unfccc.int/resource/docs/2009/cop15/eng/11a01.pdf (accessed 25/05/11).
UNSD (2011) Millennium Development Goals Indicators – Carbon dioxide emissions (CO2), thousand metric tons of CO2 (CDIAC), United Nations Statistics Division, 2011. http://mdgs.un.org/unsd/mdg/Search.aspx?q=Carbon%20dioxide%20emissions (accessed 15 October 2011).
URS (2002) Darwin 10 MTPA LNG Facility - Public Environmental Report, URS Australia Pty Ltd, East Perth, Western Australia, March 2002. http://www.conocophillips.com.au/EN/responsibilities/health/environment/dlng%20emp/Pages/index.aspx (accessed 15 March 2010)

3678 C1-04 Coffey Arrow LNG - FINAL Greenhouse Gas Assessment_v6.docx 65 Arrow LNG Plant Project – Greenhouse Assessment Coffey Environments on behalf of Arrow Energy | PAEHolmes Job 3678C
URS (2009) Final Report: GLNG Environmental Impact Statement – Greenhouse Gas, URS Australia Pty Ltd, Brisbane, March 2009. http://www.glng.com.au/library/EIS/Appendices/T_Greenhouse%20Gas%20Report%20%28Appendix%20T%29%20FINAL%20PUBLIC.pdf (accessed 31 March 2010)
US EPA (2011) IEMS Implementation Guide, United States Environmental Protection Agency, October 2000. http://www.epa.gov/dfe/pubs/iems/iems_guide/ (accessed 20 April 2011)
Woodside (2007) Pluto LNG Project - Greenhouse Gas Abatement Program. Woodside Petroleum Ltd, Perth, Western Australia, September 2007. http://www.woodside.com.au/NR/rdonlyres/6EDBF27F-1745-48E7-8483-409BBD7EA9D9/0/Pluto_LNG_Project__Greenhouse_Gas_Abatement_Program__September_2007.pdf (accessed 22 March 2010)
WRI & WBCSD (2004) The Greenhouse Gas Protocol, World Resource Industry & World Business Council for Sustainable Development, March 2004. http://pdf.wri.org/ghg_protocol_2004.pdf (accessed 11 April 2011)

3678 C1-04 Coffey Arrow LNG - FINAL Greenhouse Gas Assessment_v6.docx 66 Arrow LNG Plant Project – Greenhouse Assessment Coffey Environments on behalf of Arrow Energy | PAEHolmes Job 3678C

3678 C1-04 Coffey Arrow LNG - FINAL Greenhouse Gas Assessment_v6.docx A-1 Arrow LNG Plant Project – Greenhouse Assessment Coffey Environments on behalf of Arrow Energy | PAEHolmes Job 3678C
APPENDIX A
GHG Emission Estimation Methodology

3678 C1-04 Coffey Arrow LNG - FINAL Greenhouse Gas Assessment_v6.docx A-1 Arrow LNG Plant Project – Greenhouse Assessment Coffey Environments on behalf of Arrow Energy | PAEHolmes Job 3678C
A.1 SCOPE 1 EMISSIONS – CONSTRUCTION
A.1.1 Fuel Combustion – Diesel for Stationary Energy and Construction Vehicles
The power required to run the construction camp and the construction activities will be met through the use of on-site diesel generators for the “all mechanical” option. Diesel will also be consumed in industrial vehicles for pipeline construction; however it is assumed that this consumption will be minor and that diesel will mainly be combusted for stationary energy purpose. Based on information provided by Coffey Environments, the first construction stage for Trains 1 and 2 are planned for 2014 to 2018.
Emissions of CO2, CH4 and N2O were estimated using Method 1 (Division 2.4.2, Method 1- emissions of carbon dioxide, methane and nitrous oxide from liquid fuels other than petroleum based oils or greases, of the Technical Guidelines (DCCEE, 2010e)):
EQ EC EF
1000
where:
E = Estimated emissions of gas type (j) from diesel combustion (t CO2-e/a)
Q = Estimated quantity of diesel combusted in diesel generators in a year
(kL/a)
EC = Energy content factor of diesel (GJ/kL)
EF = Emission factor for each gas type (j) (kg CO2-e/GJ)
The composition of diesel oil is relatively consistent throughout Australia, and therefore the default emission factors are sufficient. The default energy content factor for diesel and the default emission factor for each gas were sourced from Table 2.4.2A, of the Technical Guidelines (DCCEE, 2010e) and are listed in Table 17. Given that it is assumed that the consumption of diesel for industrial vehicles will be minor and because the apportionment of diesel combusted during construction were not available, the default energy content factor and default emission factors associated with diesel combustion in stationary engines were used. The activity data and the resulting greenhouse gas emission estimates are presented in Table 18 and Table 19, respectively. All the estimates are presented to the nearest tonne, in accordance with Australian greenhouse reporting convention, but should only be considered reliable to two significant figures.
Table 17: Energy Content Factor and Emission Factors Associated with Diesel Combusted for Construction Activities
Method Used Constant Value Units
- Default energy content factor a 38.6 GJ/kL
Method 1 Scope 1 default CO2 emission factor a 69.2
kg CO2-e / GJ Method 1 Scope 1 default CH4 emission factor a 0.1
Method 1 Scope 1 default N2O emission factor a 0.2
Method 1 Scope 1 overall emission factor b 69.5 a. Table 2.4.2A, DCCEE (2010e). b. PAEHolmes’ estimation.

3678 C1-04 Coffey Arrow LNG - FINAL Greenhouse Gas Assessment_v6.docx A-2 Arrow LNG Plant Project – Greenhouse Assessment Coffey Environments on behalf of Arrow Energy | PAEHolmes Job 3678C
Table 18: Data Input Associated with Diesel Combusted for Construction Activities
Data Required Value Units
Volume of diesel combusted for construction activities a 50 kL/day
Total Volume of diesel combusted for construction activities b 18,250 kL/a a. Coffey Environments (2011q).
b. PAEHolmes’ estimation – Assuming 365 days per year.
Table 19: Greenhouse Gas Emissions Associated with Diesel Combusted for Construction Activities
Option Scope 1 Emissions (t CO2-e/annum)
CO2 CH4 N2O Total CO2-e
“all mechanical” 48,748 70 141 48,959

3678 C1-04 Coffey Arrow LNG - FINAL Greenhouse Gas Assessment_v6.docx A-3 Arrow LNG Plant Project – Greenhouse Assessment Coffey Environments on behalf of Arrow Energy | PAEHolmes Job 3678C
A.1.2 Fuel Combustion - Diesel for Transport Energy
A.1.2.1 Marine Vessels - Dredging Equipment
It was assumed that diesel oil will be used in dredging equipment to accommodate the construction and operation of the marine facility options during construction for both configuration options (i.e., “all mechanical” and “all electrical”). Five sites have been identified as requiring dredging, including:
Boatshed point (Curtis Island) – the base case for Materials Offloading Facility (MOF) and personnel transfer facilities;
Hamilton Point South (Curtis Island) – the backup MOF;
LNG Jetty (Curtis Island) – construction dredging;
Mainland Passenger Terminal Options:
o Launch Site 4N (Northern end of the proposed reclamation area for the Fishermans Landing Northern Expansion Project); and
o Launch Site 1 (north of Gladstone city near the mouth of the Calliope River).
Launch Site 1 option has been identified to be the worst case option for the dredging activity based on its more significant volume of material to be dredged (i.e., 900,000 m3 vs. 2,500 m3 for Launch Site 4N), which results in greater fuel consumption. Accordingly, emissions associated with dredging at Launch Site 4N were not assessed.
Emissions of CO2, CH4 and N2O were estimated using Method 1 (Division 2.4.2, Method 1- emissions of carbon dioxide, methane and nitrous oxide from liquid fuels other than petroleum based oils or greases, of the Technical Guidelines (DCCEE, 2010e)):
EQ EC EF
1000
where:
E = Estimated emissions of gas type (j) from diesel combustion (t CO2-e/a)
Q = Estimated quantity of diesel combusted in dredging equipments in a year
(kL/a)
EC = Energy content factor of diesel (GJ/kL)
EF = Emission factor for each gas type (j) (kg CO2-e/GJ)
The composition of diesel oil is relatively consistent throughout Australia, and therefore the default emission factors are sufficient. The default energy content factor for diesel and the default emission factor for each gas were sourced from Table 2.4.2B, of the Technical Guidelines (DCCEE, 2010e) and are listed in Table 20. The equation used to calculate the quantity of diesel combusted in dredging equipment is provided below and the associated activity data are presented in Table 21. The resulting greenhouse gas emission estimates are presented in Table 22.
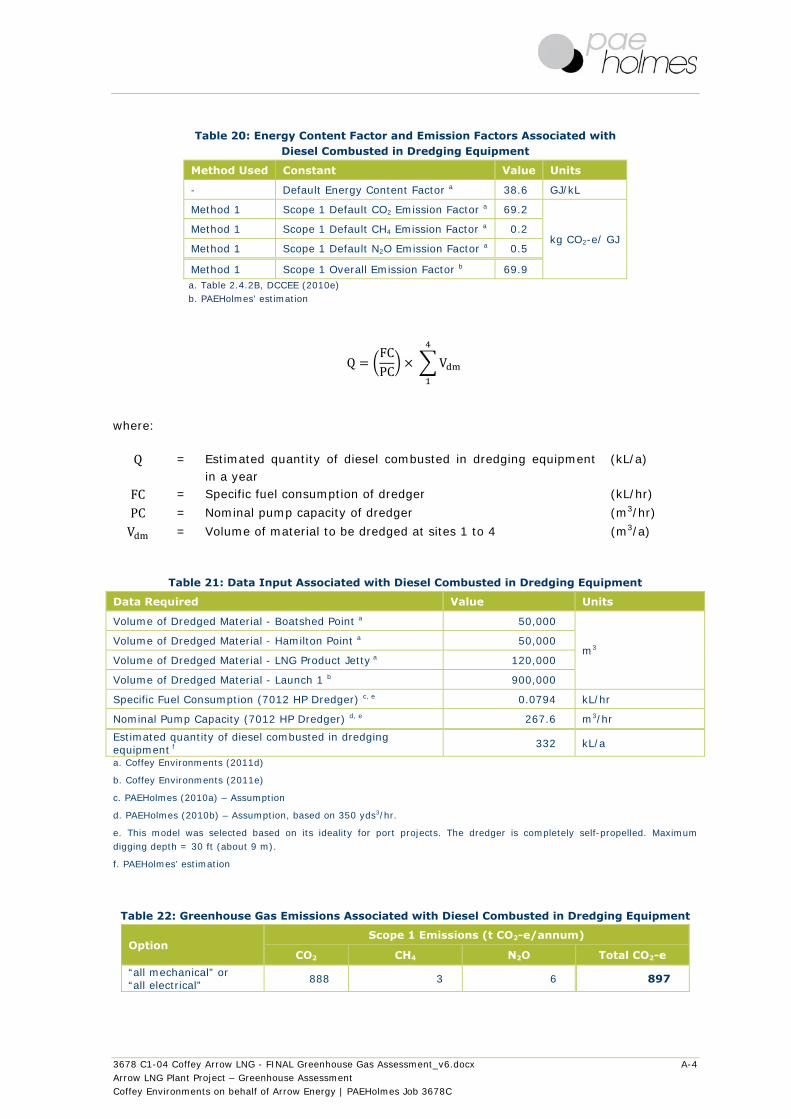
3678 C1-04 Coffey Arrow LNG - FINAL Greenhouse Gas Assessment_v6.docx A-4 Arrow LNG Plant Project – Greenhouse Assessment Coffey Environments on behalf of Arrow Energy | PAEHolmes Job 3678C
Table 20: Energy Content Factor and Emission Factors Associated with Diesel Combusted in Dredging Equipment
Method Used Constant Value Units
- Default Energy Content Factor a 38.6 GJ/kL
Method 1 Scope 1 Default CO2 Emission Factor a 69.2
kg CO2-e/ GJ Method 1 Scope 1 Default CH4 Emission Factor a 0.2
Method 1 Scope 1 Default N2O Emission Factor a 0.5
Method 1 Scope 1 Overall Emission Factor b 69.9 a. Table 2.4.2B, DCCEE (2010e) b. PAEHolmes’ estimation
QFCPC
V
where:
Q = Estimated quantity of diesel combusted in dredging equipment in a year
(kL/a)
FC = Specific fuel consumption of dredger (kL/hr)
PC = Nominal pump capacity of dredger (m3/hr)
V = Volume of material to be dredged at sites 1 to 4 (m3/a)
Table 21: Data Input Associated with Diesel Combusted in Dredging Equipment
Data Required Value Units
Volume of Dredged Material - Boatshed Point a 50,000
m3 Volume of Dredged Material - Hamilton Point a 50,000
Volume of Dredged Material - LNG Product Jetty a 120,000
Volume of Dredged Material - Launch 1 b 900,000
Specific Fuel Consumption (7012 HP Dredger) c, e 0.0794 kL/hr
Nominal Pump Capacity (7012 HP Dredger) d, e 267.6 m3/hr
Estimated quantity of diesel combusted in dredging equipment f
332 kL/a
a. Coffey Environments (2011d)
b. Coffey Environments (2011e)
c. PAEHolmes (2010a) – Assumption
d. PAEHolmes (2010b) – Assumption, based on 350 yds3/hr.
e. This model was selected based on its ideality for port projects. The dredger is completely self-propelled. Maximum digging depth = 30 ft (about 9 m).
f. PAEHolmes’ estimation
Table 22: Greenhouse Gas Emissions Associated with Diesel Combusted in Dredging Equipment
Option Scope 1 Emissions (t CO2-e/annum)
CO2 CH4 N2O Total CO2-e
“all mechanical” or “all electrical”
888 3 6 897

3678 C1-04 Coffey Arrow LNG - FINAL Greenhouse Gas Assessment_v6.docx A-5 Arrow LNG Plant Project – Greenhouse Assessment Coffey Environments on behalf of Arrow Energy | PAEHolmes Job 3678C
A.1.2.2 Marine Vessels - Tug Boats
Diesel oil will be used in tug boats to propel dumb barges for transport of bulk materials from the mainland to Curtis Island during construction for both configuration options (i.e., “all mechanical” and “all electrical”). Two launch sites are being investigated as Mainland Passenger Terminal options:
Launch Site 4N (Northern end of the proposed reclamation area for the Fishermans Landing Northern Expansion Project).
Launch Site 1 (north of Gladstone city near the mouth of the Calliope River).
Launch Site 4N option has been identified to be the worst case option based on its remoter location from both MOFs (i.e., Boatshed Point and Hamilton Point South) based on Curtis Island, which results in greater fuel consumption. Accordingly, emissions associated with transport of bulk materials from Launch Site 1 will not be assessed.
Emissions of CO2, CH4 and N2O were estimated using Method 1 (Division 2.4.2, Method 1- emissions of carbon dioxide, methane and nitrous oxide from liquid fuels other than petroleum based oils or greases, of the Technical Guidelines (DCCEE, 2010e)):
EQ EC EF
1000
where:
E = Estimated emissions of gas type (j) from diesel combustion (t CO2-e/a)
Q = Estimated quantity of diesel combusted in tug boats in a year
(kL/a)
EC = Energy content factor of diesel (GJ/kL)
EF = Emission factor for each gas type (j) (kg CO2-e/GJ)
The composition of diesel oil is relatively consistent throughout Australia, and therefore the default emission factors are sufficient. The default energy content factor for diesel and the default emission factor for each gas were sourced from Table 2.4.2B, of the Technical Guidelines (DCCEE, 2010e) and are listed in Table 23. The equation used to calculate the quantity of diesel combusted in tug boats is provided below and the associated activity data are presented in Table 24. The resulting greenhouse gas emission estimates are presented in Table 25.
Table 23: Energy Content Factor and Emission Factors Associated with Diesel Combusted in Tug Boats for Bulk Materials Movement
Method Used Constant Value Units
- Default Energy Content Factor a 38.6 GJ/kL
Method 1 Scope 1 Default CO2 Emission Factor a 69.2
kg CO2-e/ GJ Method 1 Scope 1 Default CH4 Emission Factor a 0.2
Method 1 Scope 1 Default N2O Emission Factor a 0.5
Method 1 Scope 1 Overall Emission Factor b 69.9 a. Table 2.4.2B, DCCEE (2010e) b. PAEHolmes’ estimation

3678 C1-04 Coffey Arrow LNG - FINAL Greenhouse Gas Assessment_v6.docx A-6 Arrow LNG Plant Project – Greenhouse Assessment Coffey Environments on behalf of Arrow Energy | PAEHolmes Job 3678C
QFCS
N T D
where:
Q = Estimated quantity of diesel combusted in tug boats in a year (kL/a)
FC = Specific fuel consumption of tug boat (kL/hr)
S = Service speed of tug boat (km/hr)
N = Number of tug boats per barge (-)
T = Total number of trips in a year (trips/a)
D = Trip distance (km/trip)
Table 24: Data Input Associated with Diesel Combusted in Tug Boats for Bulk Materials Movement
Data Required Value Units
Specific fuel consumption (Smit Leopard) a 0.227 kL/hr
Service speed (Smit Leopard) b 16.7 km/hr
Number of Smit Leopard tug boats per barge c 2 -
Total number of trips per tug boat (including return) d 730 trips/a
Distance between Launch 4N and Boatshed Point (including return) e
15 km/trip
Estimated quantity of diesel combusted in tug boats f 294 kL/a a. PAEHolmes (2010c) – Assuming working average fuel consumption
b. Coffey Environments (2011f) - Based on 9 knots at economic speed.
c. Coffey Environments (2011g)
d. PAEHolmes’ assumption – Based on 2 trips/day and 365 days a year.
e. 'Attachment B', Coffey Environments (2011a) – Assumption based on map provided by Coffey Environments.
f. PAEHolmes’ estimation
Table 25: Greenhouse Gas Emissions Associated with Diesel Combusted in Tug Boats for Bulk Materials Movement
Option Scope 1 Emissions (t CO2-e/annum)
CO2 CH4 N2O Total CO2-e
“all mechanical” or “all
electrical” 786 2 6 794

3678 C1-04 Coffey Arrow LNG - FINAL Greenhouse Gas Assessment_v6.docx A-7 Arrow LNG Plant Project – Greenhouse Assessment Coffey Environments on behalf of Arrow Energy | PAEHolmes Job 3678C
A.1.3 Fuel Combustion - Fuel Oil for Transport Energy
A.1.3.1 Passenger Marine Vessels – Fast Cats
It was assumed that fuel oil will be consumed in Fast Cats for transport of passengers from the mainland to Curtis Island during construction for both configuration options (i.e., “all mechanical” and “all electrical”). As explained in Section A.1.2.2, emissions associated with transport of passengers from Launch Site 1 will not be assessed.
Emissions of CO2, CH4 and N2O were estimated using Method 1 (Division 2.4.2, Method 1- emissions of carbon dioxide, methane and nitrous oxide from liquid fuels other than petroleum based oils or greases, of the Technical Guidelines (DCCEE, 2010e)):
EQ EC EF
1000
where:
E = Estimated emissions of gas type (j) from fuel oil combustion
(t CO2-e/a)
Q = Estimated quantity of fuel oil combusted in passenger marine vessels in a year
(kL/a)
EC = Energy content factor of fuel oil (GJ/kL)
EF = Emission factor for each gas type (j) (kg CO2-e/GJ)
The composition of fuel oil is relatively consistent throughout Australia, and therefore the default emission factors are sufficient. The default energy content factor for fuel oil and the default emission factor for each gas were sourced from Table 2.4.2B, of the Technical Guidelines (DCCEE, 2010e) and are listed in Table 26. The equation used to calculate the quantity of fuel oil combusted in Fast Cats is provided below and the associated activity data are presented in Table 27. The resulting greenhouse gas emission estimates are presented in Table 28.
Table 26: Energy Content Factor and Emission Factors Associated with Fuel Oil Combusted in Passenger Marine Vessels
Method Used Constant Value Units
- Default energy content factor a 39.7 GJ/kL
Method 1 Scope 1 default CO2 emission factor a 72.9
kg CO2-e/ GJ Method 1 Scope 1 default CH4 emission factor a 0.06
Method 1 Scope 1 default N2O emission factor a 0.6
Method 1 Scope 1 overall emission factor b 73.56 a. Table 2.4.2B, DCCEE (2010e) b. PAEHolmes’ estimation
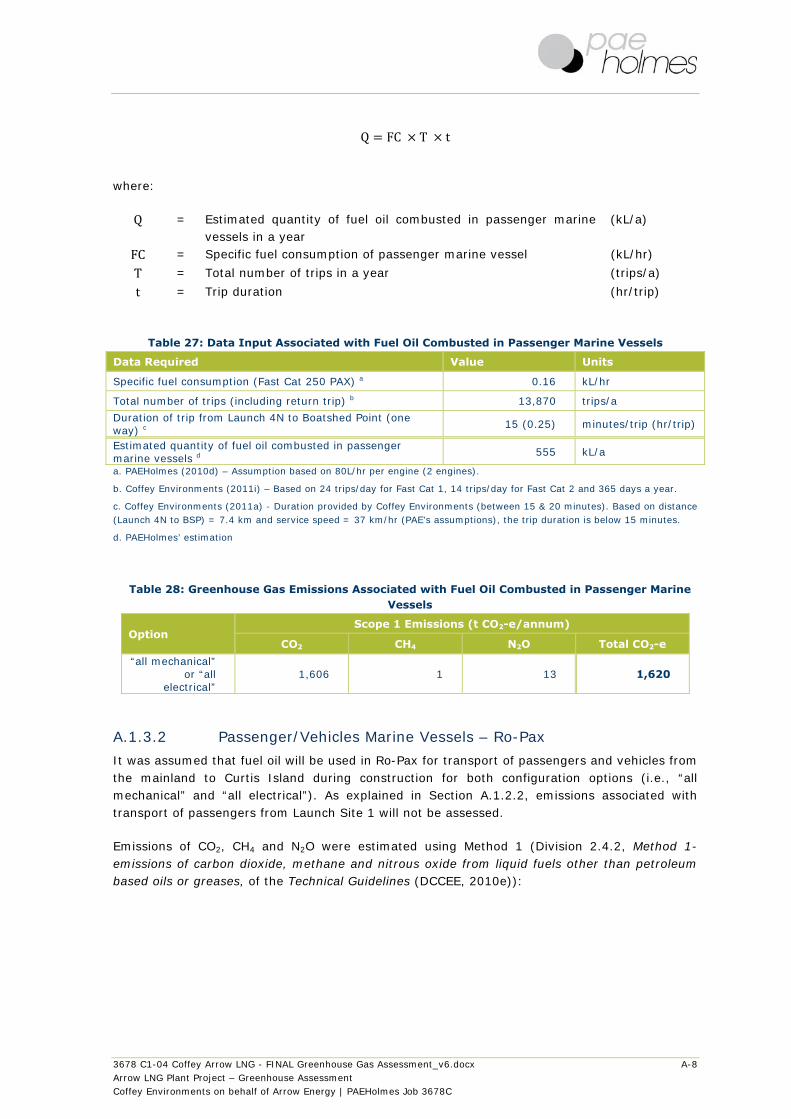
3678 C1-04 Coffey Arrow LNG - FINAL Greenhouse Gas Assessment_v6.docx A-8 Arrow LNG Plant Project – Greenhouse Assessment Coffey Environments on behalf of Arrow Energy | PAEHolmes Job 3678C
Q FC T t
where:
Q = Estimated quantity of fuel oil combusted in passenger marine vessels in a year
(kL/a)
FC = Specific fuel consumption of passenger marine vessel (kL/hr)
T = Total number of trips in a year (trips/a)
t = Trip duration (hr/trip)
Table 27: Data Input Associated with Fuel Oil Combusted in Passenger Marine Vessels
Data Required Value Units
Specific fuel consumption (Fast Cat 250 PAX) a 0.16 kL/hr
Total number of trips (including return trip) b 13,870 trips/a
Duration of trip from Launch 4N to Boatshed Point (one way) c
15 (0.25) minutes/trip (hr/trip)
Estimated quantity of fuel oil combusted in passenger marine vessels d
555 kL/a
a. PAEHolmes (2010d) – Assumption based on 80L/hr per engine (2 engines).
b. Coffey Environments (2011i) – Based on 24 trips/day for Fast Cat 1, 14 trips/day for Fast Cat 2 and 365 days a year.
c. Coffey Environments (2011a) - Duration provided by Coffey Environments (between 15 & 20 minutes). Based on distance (Launch 4N to BSP) = 7.4 km and service speed = 37 km/hr (PAE's assumptions), the trip duration is below 15 minutes.
d. PAEHolmes’ estimation
Table 28: Greenhouse Gas Emissions Associated with Fuel Oil Combusted in Passenger Marine Vessels
Option Scope 1 Emissions (t CO2-e/annum)
CO2 CH4 N2O Total CO2-e
“all mechanical” or “all
electrical” 1,606 1 13 1,620
A.1.3.2 Passenger/Vehicles Marine Vessels – Ro-Pax
It was assumed that fuel oil will be used in Ro-Pax for transport of passengers and vehicles from the mainland to Curtis Island during construction for both configuration options (i.e., “all mechanical” and “all electrical”). As explained in Section A.1.2.2, emissions associated with transport of passengers from Launch Site 1 will not be assessed.
Emissions of CO2, CH4 and N2O were estimated using Method 1 (Division 2.4.2, Method 1- emissions of carbon dioxide, methane and nitrous oxide from liquid fuels other than petroleum based oils or greases, of the Technical Guidelines (DCCEE, 2010e)):

3678 C1-04 Coffey Arrow LNG - FINAL Greenhouse Gas Assessment_v6.docx A-9 Arrow LNG Plant Project – Greenhouse Assessment Coffey Environments on behalf of Arrow Energy | PAEHolmes Job 3678C
EQ EC EF
1000
where:
E = Estimated emissions of gas type (j) from fuel oil combustion
(t CO2-e/a)
Q = Estimated quantity of fuel oil combusted in passenger/vehicle marine vessels in a year
(kL/a)
EC = Energy content factor of fuel oil (GJ/kL)
EF = Emission factor for each gas type (j) (kg CO2-e/GJ)
The composition of fuel oil is relatively consistent throughout Australia, and therefore the default emission factors are sufficient. The default energy content factor for fuel oil and the default emission factor for each gas were sourced from Table 2.4.2B, of the Technical Guidelines (DCCEE, 2010e) and are listed in Table 29. The equation used to calculate the quantity of fuel oil combusted in Ro-Pax is provided below and the associated activity data are presented in Table 30. The resulting greenhouse gas emission estimates are presented in Table 31.
Table 29: Energy Content Factor and Emission Factors Associated with Fuel Oil Combusted in Passenger/Vehicle Marine Vessels
Method Used Constant Value Units
- Default energy content factor a 39.7 GJ/kL
Method 1 Scope 1 default CO2 emission factor a 72.9
kg CO2-e/ GJ Method 1 Scope 1 default CH4 emission factor a 0.06
Method 1 Scope 1 default N2O emission factor a 0.6
Method 1 Scope 1 overall emission factor b 73.56 a. Table 2.4.2B, DCCEE (2010e) b. PAEHolmes’ estimation
Table 30: Data Input Associated with Fuel Oil Combusted in Passenger/Vehicle Marine Vessels
Data Required Value Units
Specific fuel consumption (Ro-Pax 300 PAX) a 1.064 kL/hr
Total number of trips (including return trip) b 6,570 trips/a
Duration of trip from Launch 4N to Boatshed Point (one way) c
20 (0.33) minutes/trip (hr/trip)
Estimated quantity of fuel oil combusted in passenger/vehicle marine vessels d
2,330 kL/a
a. PAEHolmes (2010e) – Assumption based on 80L/hr per engine (2 engines).
b. Coffey Environments (2011i) – Based on 18 trips/day and 365 days a year.
c. Coffey Environments (2011a) - Duration provided by Coffey Environments (between 15 & 20 minutes). Based on distance (Launch 4N to BSP) = 7.4 km and service speed = 24.1 km/hr (PAE's assumptions), the trip duration is closer to 20 minutes.
d. PAEHolmes’ estimation

3678 C1-04 Coffey Arrow LNG - FINAL Greenhouse Gas Assessment_v6.docx A-10 Arrow LNG Plant Project – Greenhouse Assessment Coffey Environments on behalf of Arrow Energy | PAEHolmes Job 3678C
Table 31: Greenhouse Gas Emissions Associated with Fuel Oil Combusted in Passenger/Vehicle Marine Vessels
Option Scope 1 Emissions (t CO2-e/annum)
CO2 CH4 N2O Total CO2-e
“all mechanical” or “all
electrical” 6,743 6 55 6,804

3678 C1-04 Coffey Arrow LNG - FINAL Greenhouse Gas Assessment_v6.docx A-11 Arrow LNG Plant Project – Greenhouse Assessment Coffey Environments on behalf of Arrow Energy | PAEHolmes Job 3678C
A.1.3.3 Vegetation Clearing
Clearing existing vegetation for the purposes of constructing project infrastructure will release an amount of stored carbon within the vegetation’s biomass.
The FullCAM model from the National Carbon Accounting Toolbox can be used to determine vegetation clearing emission factors. This method was used for the GLNG project, yielding an emission factor of 201 t CO2-e/ha (URS, 2009). This resulting emission factor is larger than the estimate PAEHolmes derived using FullCAM. As the projects are very close together, the emission factor determined by URS will be used as a conservative estimate of the vegetation clearing emissions.
Table 32 summarises the estimated emissions from land clearing associated with different project activities.
Table 32: Vegetation Clearance Emission Factors and Areas Cleared
Project Activity Total Area Cleared
per Activity a
(ha)
Emission Factor b Total Emission per Activity
(t CO2-e/ha) (t CO2-e)
Remnant vegetation 310 201
62,392
High value regrowth 8 1,640
Total 64,032 a. Coffey Environments (2011w). b. URS (2009).
The estimated emissions of greenhouse gases over the life of the Arrow LNG Plant for vegetation clearing are approximately 64,032 t CO2-e. These values do not take into account the planned rehabilitation of all areas cleared for project purposes and have been estimated conservatively.

3678 C1-04 Coffey Arrow LNG - FINAL Greenhouse Gas Assessment_v6.docx A-12 Arrow LNG Plant Project – Greenhouse Assessment Coffey Environments on behalf of Arrow Energy | PAEHolmes Job 3678C
A.2 SCOPE 1 EMISSIONS – OPERATION
A.2.1 Fuel Combustion – CSG for Stationary Energy
CSG is combusted in gas turbines to provide power during operation for the “all mechanical” option. LMS100 will be used to drive LNG trains refrigerant compressors while LM2500 will be used to generate power for utilities.
Emissions of CH4 and N2O were estimated using Method 1 (Division 2.3.2, Method 1- emissions of carbon dioxide, methane and nitrous oxide, of the Technical Guidelines (DCCEE, 2010e)):
EQ EC EF
1000
where:
E = Estimated emissions of gas type (j) from CSG combustion (t CO2-e/a)
Q = CSG combusted in stationary engines in a year at standard conditions
(Sm3/a)
EC = Energy content factor of CSG at standard conditions (GJ/Sm3)
EF = Emission factor for each gas type (j) (kg CO2-e/GJ)
The default energy content factor for CSG that is captured for combustion for stationary energy purposes and the default emission factor for each gas were sourced from Table 2.3.2A, of the Technical Guidelines (DCCEE, 2010e) and are listed in Table 34.
Emissions of CO2 were estimated using Method 2 presented below (Division 2.3.3, Method 2- emissions of carbon dioxide from the combustion of gaseous fuels, of the Technical Guidelines (DCCEE, 2010e)), which requires the composition of the CSG extracted (refer to Table 33).
[1] ECOQ EC EFCO , ,
1000
[2] EF CO , ,
mol %mw
V 100
d ,
44.010 f OF
mw 100
[3] d , mol %mw
V
[4] EFCO , , EFCO , ,ECC
[5] Cd ,
100

3678 C1-04 Coffey Arrow LNG - FINAL Greenhouse Gas Assessment_v6.docx A-13 Arrow LNG Plant Project – Greenhouse Assessment Coffey Environments on behalf of Arrow Energy | PAEHolmes Job 3678C
where:
ECO = Estimated emissions of carbon dioxide from CSG combustion
(t CO2-e/a)
Q = CSG combusted in stationary engines in a year at standard conditions
(Sm3/a)
EC = Energy content factor of CSG at standard conditions (GJ/Sm3)
EFCO , , = Site-specific carbon dioxide emission factor for CSG combustion
(kg CO2-e/GJ)
EF CO , , = Site-specific carbon dioxide emission factor for CSG combustion incorporating the effects of a default oxidation factor
(kg CO2/kg CSG)
mol % = Gas type y’s share of 1 mole of CSG; or gas type y’s share of the total volume of the CSG
(mol%)
mw = Molecular weight of gas type y (kg/kmole)
V = Volume of 1 kilomole of the gas at standard conditions (Sm3/kmole)
d , = Factor (mol%.kg/kmole.Sm3)
f = Number of carbon atoms in a molecule of gas type y (-)
OF = Oxidation factor applicable to gaseous fuels (-)
C = Density of CSG at standard conditions (kg/Sm3)
The additional constants required to estimate the emissions of carbon dioxide using equations [1-5] were sourced from the Technical Guidelines (DCCEE, 2010e) and are listed in Table 33. The equation used to calculate the amount of gas combusted for power generation during operation is provided below and the associated activity data are presented in Table 35. The resulting greenhouse gas emission estimates are presented in Table 36.
Table 33: Additional Constants Required for CO2 Site-Specific Emissions Factor Estimation
Constant Value Units
mol%CH4 98.01 mol%
mol%CO2 0.34 mol%
mwCH4 a 16.043 kg/kmole
mwCO2 a 44.01 kg/kmole
fCH4 a 1 Number of C atoms in CH4
fCO2 a 1 Number of C atoms in CO2
V b 23.6444 Sm3/kmole
OFg b 0.995 -
a. Section 2.22 (3), DCCEE (2010e) b. Section 2.22 (1), DCCEE (2010e)

3678 C1-04 Coffey Arrow LNG - FINAL Greenhouse Gas Assessment_v6.docx A-14 Arrow LNG Plant Project – Greenhouse Assessment Coffey Environments on behalf of Arrow Energy | PAEHolmes Job 3678C
Table 34: Energy Content Factor and Emission Factors Associated with Gas Combusted in Stationary Engines
Method Used Constant Value Units
- Energy Content Factor a 0.0377 GJ/m3
Method 2 Scope 1 Site-Specific CO2 Emission Factor b 48.3
kg CO2-e / GJ Method 1 Scope 1 Default CH4 Emission Factor a 0.2
Method 1 Scope 1 Default N2O Emission Factor a 0.03
- Scope 1 Overall Emission Factor b 48.54 a. Table 2.3.2A, DCCEE (2010e). b. PAEHolmes’ estimation.
QNGT FCSG AGT
ρCSG
where:
Q = Estimated quantity of gas combusted in stationary engines the year
(Sm3/a)
NGT = Number of gas turbines generators (-)
FCSG = Coal seam gas flowrate per gas turbines (kg/hr)
AGT = Gas turbines availability (hrs/a)
ρCSG = Density of coal seam gas at standard conditions (kg/Sm3)
Table 35: Activity Data Used to Estimate the Amount of Gas Combusted in Stationary Engines
Variable Value Units
Density of coal seam gas at standard conditions a 0.691 kg/Sm3
Number of gas turbine generators to power LNG trains (LMS100) b 8 -
LMS100 coal seam gas flowrate per gas turbine c 21,741.7 kg/hr
LMS100 availability d 831,324 hrs/a
Total amount of CSG combusted in gas turbine generators to power LNG trains (LMS100) e
2,091,085,041 Sm3/yr
Number of gas turbine generators to power utilities (LM2500) b 7 -
LM2500 coal seam gas flowrate per gas turbine c 7,139.0 kg/hr
LM2500 availability d 831,324 hrs/a
Total Amount of CSG combusted in gas turbine generators to power utilities (LM2500) e
600,791,295 Sm3/yr
a. (Coffey Environments, 2011u) - based on a feed gas rate of 50,988 t CSG/day or 2,604 mmscfd. b. (Coffey Environments, 2011a) – four trains scenario. c. (Coffey Environments, 2011x) – at 100% capacity (worst case scenario). d. (Coffey Environments, 2011y) – based on 346.3 days/annum. e. PAEHolmes’ estimation.
Table 36: Greenhouse Gas Emissions Associated with Gas Combusted in Stationary Engines
Scenario Description Scope 1 Emissions (t CO2-e/annum)
CO2 CH4 N2O Total CO2-e
All mechanical
LMS100 3,808,835 15,767 2,365 3,826,967
LM2500 1,094,320 4,530 679 1,099,529
Total 4,903,155 20,297 3,045 4,926,496
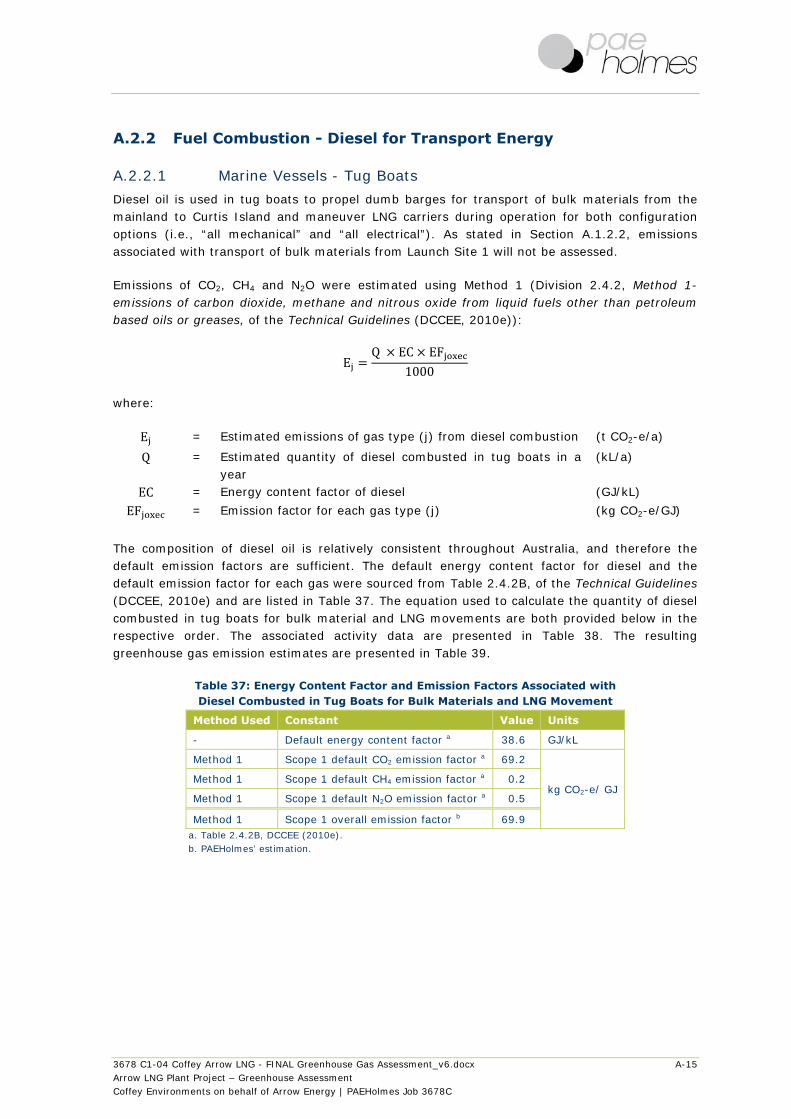
3678 C1-04 Coffey Arrow LNG - FINAL Greenhouse Gas Assessment_v6.docx A-15 Arrow LNG Plant Project – Greenhouse Assessment Coffey Environments on behalf of Arrow Energy | PAEHolmes Job 3678C
A.2.2 Fuel Combustion - Diesel for Transport Energy
A.2.2.1 Marine Vessels - Tug Boats
Diesel oil is used in tug boats to propel dumb barges for transport of bulk materials from the mainland to Curtis Island and maneuver LNG carriers during operation for both configuration options (i.e., “all mechanical” and “all electrical”). As stated in Section A.1.2.2, emissions associated with transport of bulk materials from Launch Site 1 will not be assessed.
Emissions of CO2, CH4 and N2O were estimated using Method 1 (Division 2.4.2, Method 1- emissions of carbon dioxide, methane and nitrous oxide from liquid fuels other than petroleum based oils or greases, of the Technical Guidelines (DCCEE, 2010e)):
EQ EC EF
1000
where:
E = Estimated emissions of gas type (j) from diesel combustion (t CO2-e/a)
Q = Estimated quantity of diesel combusted in tug boats in a year
(kL/a)
EC = Energy content factor of diesel (GJ/kL)
EF = Emission factor for each gas type (j) (kg CO2-e/GJ)
The composition of diesel oil is relatively consistent throughout Australia, and therefore the default emission factors are sufficient. The default energy content factor for diesel and the default emission factor for each gas were sourced from Table 2.4.2B, of the Technical Guidelines (DCCEE, 2010e) and are listed in Table 37. The equation used to calculate the quantity of diesel combusted in tug boats for bulk material and LNG movements are both provided below in the respective order. The associated activity data are presented in Table 38. The resulting greenhouse gas emission estimates are presented in Table 39.
Table 37: Energy Content Factor and Emission Factors Associated with Diesel Combusted in Tug Boats for Bulk Materials and LNG Movement
Method Used Constant Value Units
- Default energy content factor a 38.6 GJ/kL
Method 1 Scope 1 default CO2 emission factor a 69.2
kg CO2-e/ GJ Method 1 Scope 1 default CH4 emission factor a 0.2
Method 1 Scope 1 default N2O emission factor a 0.5
Method 1 Scope 1 overall emission factor b 69.9 a. Table 2.4.2B, DCCEE (2010e). b. PAEHolmes’ estimation.

3678 C1-04 Coffey Arrow LNG - FINAL Greenhouse Gas Assessment_v6.docx A-16 Arrow LNG Plant Project – Greenhouse Assessment Coffey Environments on behalf of Arrow Energy | PAEHolmes Job 3678C
QFCS
N T D
where:
Q = Estimated quantity of diesel combusted in tug boats associated with bulk materials movement in a year
(kL/a)
FC = Specific fuel consumption of tug boat (kL/hr)
S = Service speed of tug boat (km/hr)
N = Number of tug boats per barge (-)
T = Total number of trips in a year (trips/a)
D = Trip distance (km/trip)
Q FC N N D
where:
Q = Estimated quantity of diesel combusted in tug boats associated with LNG movement in a year
(kL/a)
FC = Specific fuel consumption of tug boat (kL/hr)
N = Number of tug boats per LNG carrier (-)
N = Total number of LNG carriers in a year (trips/a)
D = Trip duration (in and out of the harbour) (hrs/trip)

3678 C1-04 Coffey Arrow LNG - FINAL Greenhouse Gas Assessment_v6.docx A-17 Arrow LNG Plant Project – Greenhouse Assessment Coffey Environments on behalf of Arrow Energy | PAEHolmes Job 3678C
Table 38: Data Inputs Associated with Diesel Combusted in Tug Boats for Bulk Materials and LNG Movements
Emission Source Description
Data Required Value Units
Bulk Materials and LNG Movements
Specific fuel consumption (Smit Leopard) a 0.227 kL/hr
Service speed (Smit Leopard) b 16.7 km/hr
Bulk Materials Movement
Number of Smit Leopard tug boats per barge c 2 -
Number of trips (including return) d 2 trips/day
Number of operating days e 346.3 days/a
Total number of trips (including return) f 693 trips/a
Distance between Launch 4N and Boatshed Point (including return) g
14.8 km/trip
Estimated quantity of diesel combusted in tug boats associated with bulk materials movement f
279 kL/a
LNG Movement
Number of tug boats per carrier h 2 -
Total number of carriers i 240 trips/a
Trip duration (in and out of the harbour) h 4 hrs/trip
Estimated quantity of diesel combusted in tug boats associated with LNG movement f
436 kL/a
a. PAEHolmes (2010c) – Working average fuel consumption used.
b. Coffey Environments (2011f) - Based on 9 knots at economic speed.
c. Coffey Environments (2011g).
d. PAEHolmes’ assumption.
e. Coffey Environments (2011u).
f. PAEHolmes’ estimation.
g. 'Attachment B', Coffey Environments (2011a) – Assumption based on map provided by Coffey Environments.
h. Coffey Environments (2011j).
i. Coffey Environments (2011a) – Based on worst case: Option 1 - 15 ships per 1Mtpa based on 145,000 m3ship capacity.
Table 39: Greenhouse Gas Emissions Associated with Diesel Combusted in Tug Boats for Bulk Materials and LNG Movements
Option Emission Source Description Scope 1 Emissions (t CO2-e/annum)
CO2 CH4 N2O Total CO2-e
“all mechanical” or “all electrical”
Bulk Materials Movement 746 2 5 753
LNG Movement 1,164 3 8 1,176
Bulk Materials & LNG Movements 1,910 6 14 1,929

3678 C1-04 Coffey Arrow LNG - FINAL Greenhouse Gas Assessment_v6.docx A-18 Arrow LNG Plant Project – Greenhouse Assessment Coffey Environments on behalf of Arrow Energy | PAEHolmes Job 3678C
A.2.2.2 Vehicles
Diesel oil will be used in vehicles for personnel transport from the overflow camp - Temporary Worker Accommodation Facility (TWAF) - to the launch site based on the mainland during operation for both configuration options (i.e., “all mechanical” and “all electrical”). Two options are being considered for the TWAF options and the launch site options respectively:
TWAF7 (in the vicinity of Gladstone city on the former Gladstone Power Station ash pond No.7).
TWAF8 (in the vicinity of Targinie on a primarily cleared pastoral grazing lot).
Launch Site 4N (Northern end of the proposed reclamation area for the Fishermans Landing Northern Expansion Project).
Launch Site 1 (north of Gladstone city near the mouth of the Calliope River).
According to Coffey Environments, TWAF8 to Launch Site 1 option has been identified to be the worst case option in regards to combustion in vehicles activities during operation, which results in greater fuel consumption. As a result, emissions associated with combustion in vehicles activities for the remaining options were not assessed.
Emissions of CO2, CH4 and N2O were estimated using Method 1 (Division 2.4.2, Method 1- emissions of carbon dioxide, methane and nitrous oxide from liquid fuels other than petroleum based oils or greases, of the Technical Guidelines (DCCEE, 2010e)):
EQ EC EF
1000
where:
E = Estimated emissions of gas type (j) from diesel combustion (t CO2-e/a)
Q = Estimated quantity of diesel combusted in vehicles in a year
(kL/a)
EC = Energy content factor of diesel (GJ/kL)
EF = Emission factor for each gas type (j) (kg CO2-e/GJ)
The composition of diesel oil is relatively consistent throughout Australia, and therefore the default emission factors are sufficient. The default energy content factor for diesel and the default emission factor for each gas were sourced from Table 2.4.2B, of the Technical Guidelines (DCCEE, 2010e) and are listed in Table 40. The activity data associated with diesel combustion in vehicles and the resulting greenhouse gas emission estimates are presented in Table 41 and Table 42 respectively.

3678 C1-04 Coffey Arrow LNG - FINAL Greenhouse Gas Assessment_v6.docx A-19 Arrow LNG Plant Project – Greenhouse Assessment Coffey Environments on behalf of Arrow Energy | PAEHolmes Job 3678C
Table 40: Energy Content Factor and Emission Factors Associated with Diesel Combusted in Vehicles for Personnel Transport
Method Used Constant Value Units
- Default energy content factor a 38.6 GJ/kL
Method 1 Scope 1 default CO2 emission factor a 69.2
kg CO2-e/ GJ Method 1 Scope 1 default CH4 emission factor a 0.2
Method 1 Scope 1 default N2O emission factor a 0.5
Method 1 Scope 1 overall emission factor b 69.9 a. Table 2.4.2B, DCCEE (2010e). b. PAEHolmes’ estimation.
Table 41: Data Input Associated with Diesel Combusted in Vehicles for Personnel Transport
Data Required Value Units
Estimated quantity of diesel combusted in vehicles a 60 kL/a a. Coffey Environments (2011c) – Based on 8-10 trips/day and a distance of 5 km from TWAF8 to Launch Site 1.
Table 42: Greenhouse Gas Emissions Associated with Diesel Combusted in Vehicles for Personnel Transport
Option Scope 1 Emissions (t CO2-e/annum)
CO2 CH4 N2O Total CO2-e
“all mechanical” or “all
electrical” 160 0 1 162

3678 C1-04 Coffey Arrow LNG - FINAL Greenhouse Gas Assessment_v6.docx A-20 Arrow LNG Plant Project – Greenhouse Assessment Coffey Environments on behalf of Arrow Energy | PAEHolmes Job 3678C
A.2.3 Fuel Combustion - Fuel Oil for Transport Energy
A.2.3.1 Passenger Marine Vessels – Fast Cats
It was assumed that fuel oil will be used in Fast Cats for transport of passengers from the mainland to Curtis Island during operation for both configuration options (i.e., “all mechanical” and “all electrical”). As explained in Section A.1.2.2, emissions associated with transport of passengers from Launch Site 1 were not assessed.
Emissions of CO2, CH4 and N2O were estimated using Method 1 (Division 2.4.2, Method 1- emissions of carbon dioxide, methane and nitrous oxide from liquid fuels other than petroleum based oils or greases, of the Technical Guidelines (DCCEE, 2010e)):
EQ EC EF
1000
where:
E = Estimated emissions of gas type (j) from fuel oil combustion
(t CO2-e/a)
Q = Estimated quantity of fuel oil combusted in passenger marine vessels in a year
(kL/a)
EC = Energy content factor of fuel oil (GJ/kL)
EF = Emission factor for each gas type (j) (kg CO2-e/GJ)
The composition of fuel oil is relatively consistent throughout Australia, and therefore the default emission factors are sufficient. The default energy content factor for fuel oil and the default emission factor for each gas were sourced from Table 2.4.2B, of the Technical Guidelines (DCCEE, 2010e) and are listed in Table 43. The equation used to calculate the quantity of fuel oil combusted in Fast Cats is provided below and the associated activity data are presented in Table 44. The resulting greenhouse gas emission estimates are presented in Table 45.
Table 43: Energy Content Factor and Emission Factors Associated with Fuel Oil Combusted in Passenger Marine Vessels
Method Used Constant Value Units
- Default energy content factor a 39.7 GJ/kL
Method 1 Scope 1 default CO2 emission factor a 72.9
kg CO2-e/GJ Method 1 Scope 1 default CH4 emission factor a 0.06
Method 1 Scope 1 default N2O emission factor a 0.6
Method 1 Scope 1 overall emission factor b 73.56 a. Table 2.4.2B, DCCEE (2010e). b. PAEHolmes’ estimation.
Q FC T t
where:
Q = Estimated quantity of fuel oil combusted in passenger marine vessels in a year
(kL/a)
FC = Specific fuel consumption of passenger marine vessel (kL/hr)
T = Total number of trips in a year (trips/a)
t = Trip duration (hr/trip)

3678 C1-04 Coffey Arrow LNG - FINAL Greenhouse Gas Assessment_v6.docx A-21 Arrow LNG Plant Project – Greenhouse Assessment Coffey Environments on behalf of Arrow Energy | PAEHolmes Job 3678C
Table 44: Data Input Associated with Fuel Oil Combusted in Passenger Marine Vessels
Data Required Value Units
Specific fuel consumption (Fast Cat 250 PAX) a 0.16 kL/hr
Service speed b 37 km/hr
Number of trips (including return) c 38 trips/day
Number of operating days d 346.3 days/a
Total number of trips (including return trips) e 13,159 trips/a
Duration of trip from Launch 4N to Boatshed Point (one way) f
15 (0.25) minutes/trip (hr/trip)
Estimated quantity of fuel oil e 526 kL/a a. PAEHolmes (2010d) – Assumption based on 80L/hr per engine (2 engines).
b. PAEHolmes (2010d) – Based on 20 knots.
c. Coffey Environments (2011i) – Based on 24 trips/day for Fast Cat 1, 14 trips/day for Fast Cat 2.
d. Coffey Environments (2011u).
e. PAEHolmes’ estimation.
f. Coffey Environments (2011a) - Duration provided by Coffey Environments (between 15 & 20 minutes). Based on distance (Launch 4N to BSP) = 7.4 km and service speed = 37 km/hr, the trip duration is closer to 15 minutes.
Table 45: Greenhouse Gas Emissions Associated with Fuel Oil Combusted in Passenger Marine Vessels
Option Scope 1 Emissions (t CO2-e/annum)
CO2 CH4 N2O Total CO2-e
“all mechanical” or “all
electrical” 1,523 1 13 1,537

3678 C1-04 Coffey Arrow LNG - FINAL Greenhouse Gas Assessment_v6.docx A-22 Arrow LNG Plant Project – Greenhouse Assessment Coffey Environments on behalf of Arrow Energy | PAEHolmes Job 3678C
A.2.3.2 Passenger/Vehicles Marine Vessels – Ro-Pax
It was assumed that fuel oil will be used in Ro-Pax for transport of passengers and vehicles from the mainland to Curtis Island during operation for both configuration options (i.e., “all mechanical” and “all electrical”). As explained in Section A.1.2.2, emissions associated with transport of passengers from Launch Site 1 will not be assessed.
Emissions of CO2, CH4 and N2O were estimated using Method 1 (Division 2.4.2, Method 1- emissions of carbon dioxide, methane and nitrous oxide from liquid fuels other than petroleum based oils or greases, of the Technical Guidelines (DCCEE, 2010e)):
EQ EC EF
1000
where:
E = Estimated emissions of gas type (j) from fuel oil combustion
(t CO2-e/a)
Q = Estimated quantity of fuel oil combusted in passenger/vehicle marine vessels in a year
(kL/a)
EC = Energy content factor of fuel oil (GJ/kL)
EF = Emission factor for each gas type (j) (kg CO2-e/GJ)
The composition of fuel oil is relatively consistent throughout Australia, and therefore the default emission factors are sufficient. The default energy content factor for fuel oil and the default emission factor for each gas were sourced from Table 2.4.2B, of the Technical Guidelines (DCCEE, 2010e) and are listed in Table 46. The equation used to calculate the quantity of fuel oil combusted in Ro-Pax is provided below and the associated activity data are presented in Table 47. The resulting greenhouse gas emission estimates are presented in Table 48.
Table 46: Energy Content Factor and Emission Factors Associated with Fuel Oil Combusted in Passenger/Vehicle Marine Vessels
Method Used Constant Value Units
- Default energy content factor a 39.7 GJ/kL
Method 1 Scope 1 default CO2 emission factor a 72.9
kg CO2-e/GJ Method 1 Scope 1 default CH4 emission factor a 0.06
Method 1 Scope 1 default N2O emission factor a 0.6
Method 1 Scope 1 overall emission factor b 73.56 a. Table 2.4.2B, DCCEE (2010e) b. PAEHolmes’ estimation

3678 C1-04 Coffey Arrow LNG - FINAL Greenhouse Gas Assessment_v6.docx A-23 Arrow LNG Plant Project – Greenhouse Assessment Coffey Environments on behalf of Arrow Energy | PAEHolmes Job 3678C
Table 47: Data Input Associated with Fuel Oil Combusted in Passenger/Vehicle Marine Vessels
Data Required Value Units
Specific fuel consumption (Ro-Pax 300 PAX) a 1.064 kL/hr
Service Speed b 24 km/hr
Number of trips (including return trips) c 18 trips/day
Number of operating days d 346.3 days/a
Total number of trips (including return trips) e 6,210 trips/a
Duration of trip from Launch 4N to Boatshed Point (one way) f
20 (0.33) minutes/trip (hr/trip)
Estimated quantity of fuel oil d 2,210 kL/a a. PAEHolmes (2010e) – Assumption based on 80L/hr per engine (2 engines).
b. PAEHolmes (2010e) – Based on 13 knots at economic speed.
c. Coffey Environments (2011i).
d. Coffey Environments (2011u).
e. PAEHolmes’ estimation.
f. Coffey Environments (2011a) - Duration provided by Coffey Environments (between 15 & 20 minutes). Based on distance (Launch 4N to BSP) = 7.4 km and service speed = 24.1 km/hr, the trip duration is closer to 20 minutes.
Table 48: Greenhouse Gas Emissions Associated with Fuel Oil Combusted in Passenger/Vehicle Marine Vessels
Option Scope 1 Emissions (t CO2-e/annum)
CO2 CH4 N2O Total CO2-e
“all mechanical” or “all
electrical” 6,397 5 53 6,455

3678 C1-04 Coffey Arrow LNG - FINAL Greenhouse Gas Assessment_v6.docx A-24 Arrow LNG Plant Project – Greenhouse Assessment Coffey Environments on behalf of Arrow Energy | PAEHolmes Job 3678C
A.2.4 Fugitive Emissions - Venting from the Acid Gas Removal Unit
CO2 removed from the feed gas in the Acid Gas Removal Unit (AGRU) is vented to the atmosphere (based on process design information provided by Coffey Environments) during operation. Emissions of CO2 and CH4 for both configuration options (i.e., “all mechanical” and “all electrical”) were estimated as follows:
ECO CO
N VR
MW yCO MWCO 3600 24 N
1000
where: ECO CO = Estimated emissions of CO2-e from venting stream from
the AGRU (t CO2-e/a)
N = Number of LNG trains (trains)
VR = Vent rate of gas from the AGRU per LNG train (kg/s/train)
MW = Molecular weight of the vent stream (kg/kmole)
yCO = Mol fraction of CO2 in the vent stream (-)
MWCO = Molecular weight of CO2 (kg/kmole)
N = Number of operating days (days/a)
ECO CH
N VR
MW yCO MWCH 3600 24 N GWPCH
1000
where:
ECO CH = Estimated emissions of CO2-e from venting stream from the AGRU
(t CO2-e/a)
N = Number of LNG trains (trains)
VR = Vent rate of gas from the AGRU per LNG train (kg/s/train)
MW = Molecular weight of the vent stream (kg/kmole)
yCH = Mol fraction of CH4 in the vent stream (-)
MWCH = Molecular weight of CH4 (kg/kmole)
GWPCH = Global warming potential of CH4 (t CO2-e/ t CH4)
N = Number of operating days (days/a)
The activity data for venting are presented in Table 49 and the resulting greenhouse gas emission estimates are presented in Table 50.

3678 C1-04 Coffey Arrow LNG - FINAL Greenhouse Gas Assessment_v6.docx A-25 Arrow LNG Plant Project – Greenhouse Assessment Coffey Environments on behalf of Arrow Energy | PAEHolmes Job 3678C
Table 49: Data Input Associated with Venting from the AGRU
Data Required Value Units
Number of LNG trains a 4 trains
Vent rate per LNG train b 4.608 kg/s
Molecular weight of the vent stream b 42.43 kg/kmole
Mol fraction of CO2 in vent stream b 0.940 -
Mol fraction of CH4 in vent stream b 0.006 -
Molecular weight of CO2 c 44.01 kg/kmole
Molecular weight of CH4 c 16.043 kg/kmole
Global warming potential of CH4 d 21 t CO2-e/ t CH4
Number of operating days e 346.3 days/a a. Coffey Environments (2011h).
b. Coffey Environments (2011k).
c. Section 2.22 (3), DCCEE (2010e).
d. Appendix C, DCCEE (2010e).
e. Coffey Environments (2011u).
Table 50: Greenhouse Gas Emissions Associated with Venting from the AGRU
Option Scope 1 Emissions (t CO2-e/annum)
CO2 CH4 N2O Total CO2-e
“all mechanical” or “all
electrical” 537,487 27,123 Not applicable 564,610

3678 C1-04 Coffey Arrow LNG - FINAL Greenhouse Gas Assessment_v6.docx A-26 Arrow LNG Plant Project – Greenhouse Assessment Coffey Environments on behalf of Arrow Energy | PAEHolmes Job 3678C
A.2.5 Fugitive Emissions – Process Flaring
A.2.5.1 Fugitive Emissions - Start-Up Flaring
During the start-up of the plant, untreated gas must be flared for safety reasons. Using the estimated amount of gas flared during this period for both configuration options (i.e., “all mechanical” and “all electrical”), emissions of CO2, CH4 and N2O were estimated using Method 1 (Division 3.85, Method 1- gas flared from natural gas production and processing, of the Technical Guidelines (DCCEE, 2010e)):
E Q EF
where:
E = Emissions of gas type (j) from CSG flared in the CSG production and processing during the year
(t CO2-e/a)
Q = Quantity of CSG flared during the year (t CSG flared/a)
EF = Scope 1 default emission factor for gas type (j) (t CO2-e/t CSG flared)
The default energy content factor for processed gas flared and the default emission factor for each gas were sourced from Table 2.3.2A and Section 3.85 (2) respectively (Technical Guidelines (DCCEE, 2010e)) and are listed in Table 51. The equation used to calculate the quantity of CSG flared is provided below and the associated activity data are presented in Table 52. The resulting greenhouse gas emission estimates are presented in Table 53.
Table 51: Energy Content Factor and Emission Factors Associated with Start-Up Flaring
Method Used Constant Value Units
- Energy content factor a 0.0377 GJ/m3
Method 1 Scope 1 default CO2 emission factor b 2.7
t CO2-e/t CSG flared Method 1 Scope 1 default CH4 emission factor b 0.1
Method 1 Scope 1 default N2O emission factor b 0.03
Method 1 Scope 1 overall emission factor c 2.83 a. Table 2.3.2A, DCCEE (2010e). b. Section 3.85 (2), DCCEE (2010e). c. PAEHolmes’ estimation.
Q %F QT D
where:
Q = Quantity of CSG flared in the reporting year (t CSG flared/a)
%F = Maximum percentage of total quantity of CSG produced for all trains being flared
(%CSG flared)
QT = Total quantity of CSG produced from all trains (t CSG/hr)
D = Duration of flaring event under start-up conditions (hours)

3678 C1-04 Coffey Arrow LNG - FINAL Greenhouse Gas Assessment_v6.docx A-27 Arrow LNG Plant Project – Greenhouse Assessment Coffey Environments on behalf of Arrow Energy | PAEHolmes Job 3678C
Table 52: Data Input Associated with CSG Start-Up Flaring
Data Required Value Units
Maximum percentage of total quantity of CSG produced for all trains being flared a
30 %CSG flared
Number of operating days b 346.3 days/a
Total quantity of CSG produced from all trains c 2,388 t CSG/hr
Duration of flaring event under start-up conditions d 48 hours
Quantity of CSG flared e 34,394 t/a a. Coffey Environments (2011b). b. Coffey Environments (2011u). c. Coffey Environments (2011y) – Based on 82,898,079 Sm3/d. This value was scaled from input sheet #21 (Coffey Environments, 2011u) from 46,234 tpd of LNG and 2604 mmsfcd feed gas for a total of 16 Mtpa scaled to 18Mtpa. d. Coffey Environments (2011y) - start-up should take about 12 hours (per train). e. PAEHolmes’ estimation.
Table 53: Greenhouse Gas Emissions Associated with CSG Start-Up Flaring
Option Scope 1 Emissions (t CO2-e/annum)
CO2 CH4 N2O Total CO2-e
“All mechanical” or “All electrical”
92,863 3,439 1,032 97,334

3678 C1-04 Coffey Arrow LNG - FINAL Greenhouse Gas Assessment_v6.docx A-28 Arrow LNG Plant Project – Greenhouse Assessment Coffey Environments on behalf of Arrow Energy | PAEHolmes Job 3678C
A.2.5.2 Fugitive Emissions - Pilot Lights Flaring & Maintenance Flaring
Flaring will not be used at Arrow LNG Plant for continuous disposal of process gas; however it will be required for the following events:
pilot lights flaring - under normal operating conditions the pilot flares will be continuously lit to ensure its readiness state should there be an emergency event;
unscheduled trips associated with equipment malfunction and/or process upsets and/or emergency; and
scheduled trips associated with maintenance.
Emissions of CO2, CH4 and N2O were estimated using Method 1 (Division 3.3.9, Method 1- gas flared from natural gas production and processing, of the Technical Guidelines (DCCEE, 2010e)) for both configuration options (i.e., “all mechanical” and “all electrical”):
E Q EF
where:
E = Emissions of gas type (j) from process CSG flared during the year
(t CO2-e/a)
Q = Quantity of CSG flared in the reporting year (t CSG flared/a)
EF = Scope 1 emission factor for gas type (j) (t CO2-e/ t CSG flared)
The default energy content factor for CSG and the default emission factor for each gas were sourced from Table 2.3.2A and Section 3.85 (2) respectively, of the Technical Guidelines (DCCEE, 2010e) and are listed in Table 54. The equations used to calculate the quantity of CSG flared for pilot lights flaring and maintenance, and emergency flaring are provided below. The associated activity data and the resulting greenhouse gas emission estimates are presented Table 55 and Table 56, respectively.
Table 54: Energy Content Factor and Emission Factors Associated with Process CSG Flaring
Method Used Variable Value Units
- Default energy content factor a 0.0377 GJ/m3
Method 1 Scope 1 default CO2 emission factor b 2.7
t CO2-e/ t CSG flared Method 1 Scope 1 default CH4 emission factor b 0.1
Method 1 Scope 1 default N2O emission factor b 0.03
Method 1 Scope 1 overall emission factor c 2.83 a. Table 2.3.2A, DCCEE (2010e). b. Division 3.85 (2), DCCEE (2010e). c. PAEHolmes’ estimation.

3678 C1-04 Coffey Arrow LNG - FINAL Greenhouse Gas Assessment_v6.docx A-29 Arrow LNG Plant Project – Greenhouse Assessment Coffey Environments on behalf of Arrow Energy | PAEHolmes Job 3678C
QR N D 24 ρCSG
1000
where:
Q = Quantity of CSG flared (associated with pilot lights flaring) in the reporting year
(t CSG flared/a)
R = Pilot gas burner release rate at standard conditions (Sm³ CSG/hr/stack)
N = Number of flare stacks with pilot gas burner (stacks)
D = Duration of pilot lights flaring (days/a)
ρCSG = CSG density at standard conditions (kg CSG/Sm3 CSG)
Q %F QT
where:
Q = Quantity of CSG flared (associated with maintenance and emergency flaring) in the reporting year
(t CSG flared/a)
%F = Percentage of total quantity of CSG produced for all trains being flared from maintenance and emergency trips
(%CSG flared)
QT = Total quantity of CSG produced from all trains (t CSG/day)
Table 55: Data Input Associated with Process CSG Flaring
Data Required Value Units
Pilot gas burner release rate at standard conditions a 100 Sm³ CSG/hr/stack
Number of flare stacks with pilot gas burner (4 trains development) a
5 stacks
Duration of pilot flaring b 346.3 days/a
CSG density at standard conditions c 0.691 kg CSG/Sm3 CSG
Total quantity of CSG flared (associated with pilot flaring) d 2,874 t CSG flared/a
Percentage of total quantity of CSG produced for all trains being flared from maintenance and emergency trips e
0.3 %CSG flared
Total quantity of CSG produced from all trains f 57,323 t CSG/day
Total quantity of CSG flared (associated with maintenance and emergency flaring) d 59,553 t CSG flared/a
a. Coffey Environments (2011p) – assuming continuous release at maximum rate. b. Coffey Environments (2011p) – under normal operating conditions the flare will be continuously lit to ensure its readiness state should there be an emergency event. Based on 346.3 operating days (Coffey Environments, 2011u). c. (Coffey Environments, 2011u) - based on a feed gas rate of 50,988 t CSG/day or 2,604 mmscfd. d. PAEHolmes’ estimation. e. (Coffey Environments, 2011c), ‘CO2 emissions MD’ tab - assuming 0.3% of feed gas intake is being flared. PAEHolmes: assuming that this percentage (provided by Coffey Environments) applies to maintenance and emergency flaring only; start-up flaring and pilot flaring were calculated separately. f. Coffey Environments (2011y) – Based on 82,898,079 Sm3/d. This value was scaled from input sheet #21 (Coffey Environments, 2011u) from 46,234 tpd of LNG and 2604 mmsfcd feed gas for a total of 16 Mtpa scaled to 18Mtpa.
Table 56: Greenhouse Gas Emissions Associated with Process CSG Flaring
Option Activity Description Scope 1 Emissions (t CO2-e/annum)
CO2 CH4 N2O Total CO2-e
“all mechanical” or “all electrical”
Pilot flaring 7,759 287 86 8,132
Emergency and maintenance flaring
160,792 5,955 1,787 168,534
Total 168,550 6,243 1,873 176,666

3678 C1-04 Coffey Arrow LNG - FINAL Greenhouse Gas Assessment_v6.docx A-30 Arrow LNG Plant Project – Greenhouse Assessment Coffey Environments on behalf of Arrow Energy | PAEHolmes Job 3678C
A.2.6 Fugitive Emissions – Facility-Level Fugitives & Transmission
A.2.6.1 Facility-Level Fugitives
Methane is the primary GHG in fugitive leak emissions from processing and compression. Two methods are available to estimate fugitive leaks (other than venting and flaring) from natural gas production or processing:
the emission factor (in tonnes CO2-e/ tonne CSG processed) for methane from general leaks in the natural gas production and processing sourced from the Technical Guidelines (DCCEE, 2010e); and
the facility-level average fugitive emission factor (in tonnes CH4/ Sm3 gas processed) associated with gas processing plants sourced from the American Petroleum Institute (API) of Greenhouse Gas Emissions Methodologies for the Oil and Natural Gas Industry Compendium (API, 2009) – this default emission factor was derived by combining component emission measurements and activity factors for a “typical” facility.
The equation to convert the default facility-level average fugitive emission factor to a site-specific emission factor is provided below. The associated input data are presented in Table 57. The comparison of the two available emission factors associated with general leaks is presented in Table 58.
EF CH
EF CH
mol% CH
mol% CHGWPCH
ρCSG 1000
where: EF CH = Site-Specific CH4 emission factor for general leaks (t CO2-e /t CSG
processed) EF CH = Default CH4 emission factor for general leaks (t CH4/Sm3 CSG
processed) mol% CH = Site-specific CH4 mole percentage of CSG processed (mol%)
mol% CH = Default CH4 mole percentage of CSG processed (mol%)
GWPCH = Global warming potential of CH4 (t CO2-e/ t CH4)
ρCSG = CSG density at standard conditions (kg CSG/ Sm3 CSG)
Table 57: Data Inputs for General Leaks Site-Specific Emission Factor Estimation (API, 2009)
Data Description Value Units
Default CH4 emission factor for general leaks associated with gas processing plants (at standard conditions) a
1.03 × 10⁻⁶ t CH4/ Sm3 CSG processed
Default CH4 mole percentage of CSG processed a 98.01 mol%
Site-specific CH4 mole percentage of CSG processed b 75 mol%
Global warming potential of CH4 c 21 t CO2-e/ t CH4
CSG density at standard conditions d 0.691 kg/ Sm3 CSG a. Table 6-2, API (2009). b. Coffey Environments (2011a). c. Appendix C, DCCEE (2010e). d. Coffey Environments (2011u) – based on a feed gas rate of 50,988 t CSG/day or 2,604 mmscfd.

3678 C1-04 Coffey Arrow LNG - FINAL Greenhouse Gas Assessment_v6.docx A-31 Arrow LNG Plant Project – Greenhouse Assessment Coffey Environments on behalf of Arrow Energy | PAEHolmes Job 3678C
Table 58: General Leaks Estimation Methods Comparison
Data Description Value Units
Default CH4 emission factor for general leaks a 0.0012 t CO2-e/ t CSG processed Site-specific CH4 facility-level average fugitive emission factor associated
with gas processing plants (at standard conditions) b 0.0354
a. Section 3.72 (1) of the Technical Guidelines, DCCEE (2010e). b. PAEHolmes’ estimation based on the emission factor sourced from the API Compendium (2009).
According to the API, applying average facility-level emission factors is the simplest method for estimating CH4 emissions from oil and natural gas operation (API, 2009). While this emission factor is not directly related to the coal seam gas or LNG industries, it is the best available method for forecasting emissions for this project. It is assumed that this selected emission factor covers all fugitive emissions from gas processing and compression. Table 58 shows that the site-specific emission factor sourced from the API Compendium is also more conservative as it will result in higher emissions and will thus be used to estimate emissions associated with facility-level leaks. Emissions of CH4 were estimated using the equation provided below for both configuration options (i.e., “all mechanical” and “all electrical”). The associated activity data are presented in Table 59 and the resulting greenhouse gas emission estimates are presented in Table 60
ECO CH Q EF CH
where: ECO CH = Emissions of CO2-e from facility-level leaks of CH4 (t CO2-e/a)
Q = Quantity of uncompressed CSG processed at standard conditions
(t CSG/a)
EF CH = Site-specific facility-level average emission factor for CH4 (t CH4/ t CSG)
Table 59: Data Input Associated with Facility-Level Leaks from Gas Processing Plants
Data Required Value Units
Quantity of uncompressed CSG processed at standard conditions a 19,850848 t CSG/ a a. PAEHolmes’ estimation based on a mass balance over CSG and a maximum LNG production rate of 18 Mtpa (Coffey Environments, 2011o).
Table 60: Greenhouse Gas Emissions Associated with Facility-Level Leaks from Gas Processing Plants
Option Scope 1 Emissions (t CO2-e/annum)
CO2 CH4 N2O Total CO2-e
“All mechanical” or “All electrical”
Not occurring 702,500 Not occurring 702,500

3678 C1-04 Coffey Arrow LNG - FINAL Greenhouse Gas Assessment_v6.docx A-32 Arrow LNG Plant Project – Greenhouse Assessment Coffey Environments on behalf of Arrow Energy | PAEHolmes Job 3678C
A.2.6.2 Transmission
According to the Technical Guidelines (DCCEE, 2010e), additional potential emissions of methane can be a result of:
compressor blow downs for maintenance at compressor stations;
maintenance on pipelines;
leakage; and
accidents. Emissions of CO2 and CH4 were estimated using Method 1 for both configuration options (i.e., “all mechanical” and “all electrical”) (Division 3.3.7, Method 1- natural gas transmission, of the Technical Guidelines (DCCEE, 2010e)):
E Q EF
where:
E = Emissions of gas type (j) from natural gas transmission
(t CO2-e/a)
Q = Total length of pipeline system relevant to the study (km)
EF = Emission factor for gas type (j) (t CO2-e/km)
The default emission factor for each gas were sourced from Section 3.76, of the Technical Guidelines (DCCEE, 2010e) and are listed in Table 61. The associated activity data and the resulting greenhouse gas emission estimates are presented in Table 62 and Table 63, respectively.
Table 61: Emission Factors Associated with CSG Transmission
Method Used Variable Value Units
Method 1 Scope 1 default CO2 emission factor a 0.02
t CO2-e/ km Method 1 Scope 1 default CH4 emission factor a 8.7
Method 1 Scope 1 overall emission factor b 8.72 a. Section 3.76, DCCEE (2010e). b. PAEHolmes’ estimation.
Table 62: Data Input Associated with CSG Transmission
Data Required Value Units
Total length of pipeline system relevant to the study a 8.6 km a. Coffey Environments (2011l).
Table 63: Greenhouse Gas Emissions Associated with CSG Transmission
Option Scope 1 Emissions (t CO2-e/annum)
CO2 CH4 N2O Total CO2-e
“All mechanical” or “All electrical”
0 75 Not occurring 75

3678 C1-04 Coffey Arrow LNG - FINAL Greenhouse Gas Assessment_v6.docx A-33 Arrow LNG Plant Project – Greenhouse Assessment Coffey Environments on behalf of Arrow Energy | PAEHolmes Job 3678C
A.3 SCOPE 2 EMISSIONS
The power required to run the construction camp and the construction activities for the whole duration of the construction phase will be met through the use of electricity supplied from the grid to Curtis Island for the “all electrical” option. Electricity from the grid will also be supplied to the overflow camp (TWAF7 or TWAF8) located on the mainland for both “all mechanical” and “all electrical” options.
The method to estimate Scope 2 emissions can be found in Chapter 7 of the Technical Guidelines (DCCEE, 2010e). Only one method is currently available for the estimation of emissions from electricity purchased from the grid. This method uses indirect emission factors based on the state, territory or electricity grid corresponding to the facility of interest. It should be noted that these indirect emission factors are intended to be updated each year.
Scope 2 emissions of CO2 associated with purchased electricity were estimated using Method 1 (Division 7.2, Method 1 – purchase of electricity from main electricity grid in a State or Territory, of the Technical Guidelines (DCCEE, 2010e)):
Y QEFS
1000
where:
Y = Scope 2 GHG emissions (t CO2-e/a)
Q = Quantity of electricity purchased from the grid (kWh/a)
EFS = Default Scope 2 emission factor specific to State or Territory in which the consumption occurs
(kg CO2-e/kWh)
The default energy content factor for electricity and the emission factor for CO2 were sourced from Part 7.2 (3) and Table 7.2 respectively (DCCEE, 2010e) and are listed in Table 64.
Table 64: Energy Content Factor and CO2 Emission Factor of Electricity Purchased from the Grid in Queensland
Variable Value Units
Energy content factor a 0.0036 GJ/kWh
CO2 emission factor b 0.89 kg CO2–e/kWh a. Section 6.3 (c), DCCEE (2010e) b. Table 7.2, DCCEE (2010e)

3678 C1-04 Coffey Arrow LNG - FINAL Greenhouse Gas Assessment_v6.docx A-34 Arrow LNG Plant Project – Greenhouse Assessment Coffey Environments on behalf of Arrow Energy | PAEHolmes Job 3678C
A.3.1.1 Construction
The associated activity data and the resulting greenhouse gas emission estimates are presented in Table 65 and Table 66, respectively.
Table 65: Data Input Associated with Electricity Purchased from the Grid during Construction
Option Data Required Value Unit
“All electrical”
Rate of power purchased from the grid for construction power a
15,000 kW
Number of hours associated with electricity usage during construction b
8,760 hrs/a
Total quantity of electricity purchased from the grid c 1.314 × 10⁸ kWh/a
“All mechanical” or “All electrical”
Rate of power purchased from the grid to supply TWAF7 or TWAF8 d
2,243 kW
Number of hours associated with electricity usage at the TWAF b
8,760 hrs/a
Total quantity of electricity purchased from the grid c 1.964 × 10⁷ kWh/a
a. Coffey Environments (2011u) – The power required is expected to be between 12 and 15 MW. The highest power requirement was selected. b. PAEHolmes’ assumption – based on 365 days/year during construction. c. PAEHolmes’ estimation. d. Coffey Environments (2011r) - Based on total consumption of 1,794 kVA and assuming a power factor equals to 0.8 so that power (W) = Voltage (V) * Current (A)/0.8.
Table 66: Emissions of Scope 2 CO2 and Energy Consumed from Electricity Purchased from the Grid in Queensland during Construction
Option Scope 2 CO2 Emissions (t CO2-e/annum)
“All electrical” 134,429
“All mechanical” 17,483
A.3.1.2 Operations
Under the all electrical configuration, the power required for the operation of the LNG Facility and the ancillary buildings (including the permanent workers accommodation facility) will come from the power grid. The associated activity data and the resulting greenhouse gas emission estimates are presented in Table 67 and Table 68, respectively.
Table 67: Data Input Associated with Electricity Purchased from the Grid and Energy Consumed during Operation
Data Required Value Unit
Rate of power purchased from the mains power grid for four LNG trains a 894,600 kW
Number of hours associated with electricity usage on Curtis Island b 8,448 hrs/a
Total quantity of electricity purchased from the grid c 7.558 × 10⁹ kWh/a
Total quantity of energy consumed c 27.2 PJ/a a. Coffey Environments (2011u). b. Coffey Environments (2011y) – based on 352 operating days. c. PAEHolmes’ estimation.
Table 68: Scope 2 Emissions Associated with Electricity Purchased from the Grid in Queensland during Operation
Option Scope 2 Emissions (t CO2-e/annum)
“all electrical” 6,726,247

3678 C1-04 Coffey Arrow LNG - FINAL Greenhouse Gas Assessment_v6.docx A-35 Arrow LNG Plant Project – Greenhouse Assessment Coffey Environments on behalf of Arrow Energy | PAEHolmes Job 3678C
A.4 SCOPE 3 EMISSIONS – CONSTRUCTION & OPERATION
A.4.1 Full Fuel Cycles
Fuels used by Arrow LNG Plant, such as CSG, diesel and fuel oil, which are not produced directly by Arrow LNG Plant, have associated indirect emissions due to exploration, processing and transport of these fuels. The consumption of purchased electricity also have associated scope 3 emissions from the extraction, production and transport of fuel combusted at generation and the indirect emissions attributable to the electricity lost in delivery in the T&D network.
In order to estimate the greenhouse gas emissions from full fuel cycles, the total amount of fuel combusted or processed is required. The equations used to calculate the scope 3 emissions from fuel combustion or processing, and electricity consumption by end-users for both configuration options (i.e., “all mechanical” and “all electrical”) are as follows:
ECOQ EC EFS
1000
where:
ECO = Scope 3 emissions of GHGs from fuel combustion or processing (t CO2-e/a)
Q = Quantity of fuel combusted or processed (kL/a or Sm3/a)
EC = Energy content of fuel type (i) (GJ/kL or GJ/ Sm3)
EFS = Scope 3 emission factor (kg CO2-e/GJ)
ECOQ EFS
1000
where:
ECO = Scope 3 emissions of GHGs from electricity consumption (t CO2-e/a)
Q = Quantity of electricity purchased from the grid (kWh/a)
EFS = Default Scope 3 emission factor specific to State or Territory in which the consumption occurs
(kg CO2-e/ kWh)
The default energy content factors of diesel, fuel oil and CSG were sourced from Table 2.4.2B and Table 2.3.2A, of the Technical Guidelines (DCCEE, 2010e) and are listed in Table 69. The default scope 3 emission factors of diesel, fuel oil and electricity were sourced from Table 39and Table 40, of the National Greenhouse Account Factors (2011f), respectively. The associated activity data and the resulting greenhouse gas emission estimates are presented in Table 70 and Table 71, respectively.
The site-specific scope 3 emission factor associated with the extraction and processing of CSG was sourced from the Surat Gas Greenhouse Assessment (PAEHolmes, 2011), and correspond to the average scope 1 emission intensities (in kg CO2-e/GJ of CSG produced) associated with the time period 2017-2042 of the Surat Gas project’s life. The site-specific scope 3 emission factor of CSG are presented in Table 69.

3678 C1-04 Coffey Arrow LNG - FINAL Greenhouse Gas Assessment_v6.docx A-36 Arrow LNG Plant Project – Greenhouse Assessment Coffey Environments on behalf of Arrow Energy | PAEHolmes Job 3678C
Table 69: Energy Content Factor and Scope 3 Emission Factors Associated with Full Fuel Cycles
Variable Value Units
Energy content factor of diesel a 38.6 GJ/kL
Energy content factor of fuel oil a 39.7
Energy content factor of CSG b 0.0377 GJ/m3
Scope 3 emission factor of diesel c 5.3
kg CO2–e/GJ Scope 3 emission factor of fuel oil c 5.3
Average scope 3 emission factor of CSG (upstream emissions associated with extraction and transport of CSG) d
7.70
Scope 3 emission factor of electricity (QLD) e 0.13 kg CO2–e/kWh a. Table 2.4.2B, DCCEE (2010e). b. Table 2.3.2A, DCCEE (2010e). c. Table 39, NGA Factors DCCEE (2011f). d. Based on Surat Gas Project average scope 1 emission intensities for upstream activies for the time period 2017-2042 (PAEHolmes, 2011). The average scope 1 emission intencity was estimated based on the average scope 1 emissions (associated with the base case; i.e. integrated power generation) and average CGS production (Table 19, (PAEHolmes, 2011) for year 2017–2042. e. Table 40, NGA Factors DCCEE (2010f) – latest estimate for Queensland.
Table 70: Data Input Associated with Full Fuel Cycles
Phase Data Required “All mechanical” “All electrical” Unit
Construction
Total amount of diesel consumed in marine vessels a
627 627 kL/a
Total amount of fuel oil consumed in passenger marine vessels b
2,885 2,885 kL/a
Total amount of electricity purchased from the grid for TWAF c
19,644,300 19,644,300 kWh/a
Total amount of diesel consumed for construction activities d
18,250 N/A kL/a
Total amount of electricity purchased from the grid for construction power e
N/A 131,400,000 kWh/a
Operation
Total amount of diesel consumed in marine vessels and vehicles f
775 775 kL/a
Total amount of fuel oil consumed in passenger marine vessels g
2,737 2,737 kL/a
Total amount of CSG processed h 28,707,604,758 28,707,604,758 Sm3/a
Total amount of electricity purchased from the grid for operation power and accommodations i
N/A 7,557,580,800 kWh/a
a. Refer to Table 21 and Table 24 b. Refer to Table 27 and Table 30 c. Refer to Table 65 d. Refer to Table 18 e. Refer to Table 65 f. Refer to Table 38 and Table 41 g. Refer to Table 44 and Table 47 h. Refer to Table 59 –based on a CSG density of 0.691 kg/Sm3 (refer to Table 57) i. Refer to Table 67

3678 C1-04 Coffey Arrow LNG - FINAL Greenhouse Gas Assessment_v6.docx A-37 Arrow LNG Plant Project – Greenhouse Assessment Coffey Environments on behalf of Arrow Energy | PAEHolmes Job 3678C
Table 71: Scope 3 Emissions Associated with Upstream Activities - Full Fuel Cycles of Diesel, Fuel Oil and Electricity (Excluding CSG)
Phase Activity Description
Scope 3 Emissions (t CO2-e/annum)
“all mechanical” “all electrical”
Construction
Diesel combusted in marine vessels 128 128
Fuel oil combusted in marine vessels 607 607
Electricity purchased from the grid for TWAF 2,554 2,554
Diesel combusted for construction power 3,734 N/A
Electricity purchased from the grid for construction power
N/A 17,082
Total scope 3 emissions 7,022 20,371
Operation
Diesel combusted in marine vessels and vehicles
159 159
Fuel oil combusted in passenger marine vessels 576 576
CSG processed 8,338,679 8,338,679
Electricity purchased from the grid for operation power and accommodations
N/A 982,486
Total scope 3 emissions 8,339,413 9,321,899
A.4.2 End Use of LNG
Scope 3 emissions associated with the end use of LNG refer to the combustion of product LNG. End use of the product LNG will be the most significant scope 3 emission associated with Arrow LNG Plant.
In order to estimate the greenhouse gas emissions from the end use of LNG, it has been assumed that no fugitive losses will occur after the product LNG leaves the Arrow LNG Plant. The emissions will therefore be based on the combustion of the LNG delivered to end-users. The equation used to calculate the Scope 3 emissions associated with the end use of LNG is as follows:
ECOQ EFS
1000
where: ECO = Emissions of GHGs from end use of LNG (t CO2-e/a)
Q = Quantity of LNG combusted (GJ/a)
EFS = GHG scope 1 emission factor for LNG combustion (kg CO2-e/GJ)
The default energy content factor and the scope 3 emission factors of LNG were sourced from
Table 2.3.2A, of the Technical Guidelines (DCCEE, 2010e) and are listed in Table 72. The associated activity data are presented in Table 73. The resulting greenhouse gas emission estimates are presented in Table 74.

3678 C1-04 Coffey Arrow LNG - FINAL Greenhouse Gas Assessment_v6.docx A-38 Arrow LNG Plant Project – Greenhouse Assessment Coffey Environments on behalf of Arrow Energy | PAEHolmes Job 3678C
Table 72: Energy Content Factor and Scope 3 Emission Factors Associated with End-Use of LNG
Method Used Variable Value Units
- Default energy content factor of LNG a 25.3 GJ/m3
Method 1 Scope 1 default CO2 emission factor a 51.2
kg CO2–e/GJ Method 1 Scope 1 default CH4 emission factor a 0.1
Method 1 Scope 1 default N2O emission factor a 0.03
Method 1 Scope 1 overall emission factor b 51.33 a. Table 2.3.2A, DCCEE (2010e) b. PAEHolmes’ estimation
Table 73: Data Input Associated with End-Use of LNG
Phase Data Required Value Unit
Operation Total amount of LNG produced a 18,000,000 t/a a. Coffey Environments (2011o) – Assuming total plant capacity as the worst case scenario
Table 74: Scope 3 Greenhouse Gas Emissions Associated with End-Use of LNG
Phase Option CO2 CH4 N2O
Total Scope 3 CO2-e
(t CO2-e/annum)
Operation “all mechanical” or “all electrical”
52,639,154 107,153 32,146 52,778,452

3678 C1-04 Coffey Arrow LNG - FINAL Greenhouse Gas Assessment_v6.docx A-39 Arrow LNG Plant Project – Greenhouse Assessment Coffey Environments on behalf of Arrow Energy | PAEHolmes Job 3678C

3678 C1-04 Coffey Arrow LNG - FINAL Greenhouse Gas Assessment_v6.docx B-1 Arrow LNG Plant Project – Greenhouse Assessment Coffey Environments on behalf of Arrow Energy | PAEHolmes Job 3678C
APPENDIX B
Climate Change Impacts Predicted by the Garnaut Review

3678 C1-04 Coffey Arrow LNG - FINAL Greenhouse Gas Assessment_v6.docx B-2 Arrow LNG Plant Project – Greenhouse Assessment Coffey Environments on behalf of Arrow Energy | PAEHolmes Job 3678C
Predicted climate change impacts and emission trajectories identified by the Garnaut Review are divided into three global emission scenarios, no mitigation, 550 ppm stabilisation and 450 ppm stabilisation with overshoot.
No mitigation
No action to mitigate climate change. Emissions continue to increase throughout the 21st century, leading to an accelerating rate of increase in atmospheric concentrations of greenhouse gases. Greenhouse gas concentrations reach 1,565 ppm CO2-e, more than 3.5 times higher than pre-industrial concentrations by 2100.
550 ppm stabilisation
Emissions peak and decline steadily, so that atmospheric concentrations stop rising in 2060 and stabilise around 550 ppm CO2-e (one third the concentration reached in the no mitigation scenario).
450 ppm stabilisation with overshoot
Emissions are reduced immediately and decline more sharply than in the 550 ppm case. Atmospheric concentrations overshoot to 530 ppm CO2-e mid-century and decline toward stabilisation at 450 ppm CO2-e early in the 22nd century.
The Garnaut review details Australian emission trajectories for each of the three global emission scenarios, in the context of Australia playing a fair and proportionate part in an effective global agreement to constrain greenhouse emissions. The trajectories give an indication of the greenhouse emission cuts required in Australia to achieve the 550 ppm and 450 ppm CO2-e stabilisation goals.
Annual GHG emissions associated with Arrow LNG Plant, as a proportion of emissions trajectories detailed by the Garnaut Review are shown in Appendix Table A-1. Predicted climate change impacts presented in the Garnaut Review are shown in Appendix Table A-2. The climate change predictions and impacts presented in Appendix Table A-2 have been made as specific to the Arrow LNG Plant’s location as possible, based on the information provided in the Garnaut Review.
Table 75: Garnaut Target Emissions for 2020 and 2050 for Australia
Global agreement Australian Target
2020 2050
450 ppm stabilisation with overshoot
405.8 Mt CO2-e/a
32% reduction from current Kyoto commitment target 2008-
2012
59.7 Mt CO2-e/a
90% reduction from current Kyoto commitment target 2008-2012
550 ppm stabilisation
495.3 Mt CO2-e/a
17% reduction from current Kyoto commitment target 2008-
2012
107.4 Mt CO2-e/a
82% reduction from current Kyoto commitment target 2008-2012
No global agreement
519.2 Mt CO2-e/a
13% reduction from current Kyoto commitment target 2008-
2012
220.8 Mt CO2-e/a
63% reduction from current Kyoto commitment target 2008-2012
Source: Garnaut (2008)

3678 C1-04 Coffey Arrow LNG - FINAL Greenhouse Gas Assessment_v6.docx B-3 Arrow LNG Plant Project – Greenhouse Assessment Coffey Environments on behalf of Arrow Energy | PAEHolmes Job 3678C
Table 76: Climate Change Impacts Predicted by the Garnaut Review
Aspect Location Year Predicted impact
Notes Reference No mitigation 450 ppm 550 ppm
Temperature Global
2030 Predicted increase in average temperature 1.3°C
Predicted increase in average temperature 1.2°C
Predicted increase in average temperature 1.2°C
Approximates estimated from Figure 4.5 Garnaut Climate Change review, best estimate median probability, increases over 1990 levels
Chapter 4 Figure 4 p88
2070 Predicted increase in average temperature 3.5°C
Predicted increase in average temperature 2°C
Predicted increase in average temperature 2°C
2100 Predicted increase in average temperature 4.5°C
Predicted increase in average temperature 1.5 °C
Predicted increase in average temperature 2°C
Sea level rise Global 2100
29 to 59 cm rapid changes in ice flow could add another 10 to 20cm to the upper range
Not specifically determined Not specifically determined Based on IPCC estimations for SRES scenario A1F1 similar to no mitigation case
Chapter 4 p93
Ocean acidity Global NA Increasing ocean acidity proportionate to increased atmospheric carbon dioxide concentrations, consequences for aquatic life, increased impact in colder waters
This is directly related to CO2 concentration in atmosphere
Chapter 4 p80
Precipitation Queensland
2030 Decrease from 1990 level -2.4%
Not specifically determined Not specifically determined Based on median annual average Chapter 5 Table 5.1 p115
2070 Decrease from 1990 level -8.6%
Not specifically determined Not specifically determined Based on median annual average
2100 Decrease from 1990 level -12.7%
Not specifically determined Not specifically determined Based on median annual average
Cyclones and storms
Global NA Increased intensity Not based on a specific scenario Chapter 5
p117 NA Frequency same or decreased Not based on a specific scenario
Bushfires Australia
2013 5 to 25% increase in number of days with extreme fire weather
Not specifically determined Not specifically determined Based on 0.4°C increase
Chapter 5 Table 5.4 p118
2034 15 to 65% increase in number of days with extreme fire weather
Not specifically determined Not specifically determined Based on 1°C increase
2067 100 to 300% increase in number of days with extreme fire weather
Not specifically determined Not specifically determined Based on 2.9°C increase
Heatwaves Brisbane
2008 0.9 days over 35°C Not specifically determined Not specifically determined
Increase over 1990 baseline Chapter 5 Table 5.3 p117
2030 1.7 days over 35°C Not specifically determined Not specifically determined
2070 8 days over 35°C Not specifically determined Not specifically determined

3678 C1-04 Coffey Arrow LNG - FINAL Greenhouse Gas Assessment_v6.docx B-4 Arrow LNG Plant Project – Greenhouse Assessment Coffey Environments on behalf of Arrow Energy | PAEHolmes Job 3678C
Aspect Location Year Predicted impact
Notes Reference No mitigation 450 ppm 550 ppm
2100 21 days over 35°C Not specifically determined Not specifically determined
Agriculture Australia NA
Crop production affected by changes in average rainfall and temperature. Livestock affected by quantity and quality of pastures. Severe weather events (bushfire, flooding) reduce production. Increased temperature alters occurrence of pests and disease. Potential for carbon fertilisation if not crop growth is not restricted by temperature and rainfall.
Not based on specific scenario Chapter 6 p129
Dryland cropping - wheat
Dalby, Queensland
2030 8.2% cumulative yield change
1.6% cumulative yield change 4.8% cumulative yield change
Percentage cumulative yield change from 1990 Based on median probability of rainfall, relative humidity, temperature
Chapter 6 Table 6.5 p132 2100
-18.5% cumulative yield change
-3.7% cumulative yield change
-1.0% cumulative yield change
Dryland cropping - wheat
Emerald, Queensland
2030 7.2% cumulative yield change
1.8% cumulative yield change 4.4% cumulative yield change
Percentage cumulative yield change from 1990 Based on median probability of rainfall, relative humidity, temperature
Chapter 6 Table 6.5 p132 2100
-10.1% cumulative yield change
-2.5% cumulative yield change
0% cumulative yield change
Irrigated agriculture
Murray Darling
2030 12% decline in economic value of production
3% decline in economic value of production
3% decline in economic value of production
Based on median probability of rainfall, relative humidity, temperature
Chapter 6 Table 6.4 p130
2050 49% decline in economic value of production
6% decline in economic value of production
6% decline in economic value of production
Based on median probability of rainfall, relative humidity, temperature
2100 92% decline in economic value of production
6% decline in economic value of production
20% decline in economic value of production
Based on median probability of rainfall, relative humidity, temperature
Water supply infrastructure
Australia 2100 34% increase in cost of supplying water
4% increase in cost of supplying water
5% increase in cost of supplying water
Based on median probability Chapter 6 Table 6.3
Coastal buildings
Queensland 2030 Medium magnitude of net impact
Medium magnitude of net impact
Medium magnitude of net impact Based on median probability of
rainfall, relative humidity, temperature
Chapter 6 Table 6.8
Queensland 2100 Extreme magnitude of net impact
Medium magnitude of net impact
Medium magnitude of net impact
Temperature related deaths
Queensland 2100 Over 4000 additional heat-related deaths relative to no climate change
Fewer deaths relative to no climate change
Fewer than 80 additional heat-related deaths relative to no climate change
Based on median probability Chapter 6 Table 6.3 p128
Geopolitical stability in Asia-Pacific
Asia Pacific 2100 Displacement of people from South East Asian cities (sea rise)
Less displacement (lower sea rise)
Less displacement (lower sea rise)
Based on median probability Chapter 6 Table 6.3 p128
Ecosystems Global NA Loss of biodiversity in high altitudes, wet tropics, coastal freshwater wetlands, coral reefs Impact is specific to each Chapter 6

3678 C1-04 Coffey Arrow LNG - FINAL Greenhouse Gas Assessment_v6.docx B-5 Arrow LNG Plant Project – Greenhouse Assessment Coffey Environments on behalf of Arrow Energy | PAEHolmes Job 3678C
Aspect Location Year Predicted impact
Notes Reference No mitigation 450 ppm 550 ppm
increasing with higher impact scenarios ecosystem p142
International trade
Global NA Affected economies (China, India, Indonesia) reducing demand for Australian goods not based on a specific scenario Chapter 6 p145
Source: Garnaut, 2008

3678 C1-04 Coffey Arrow LNG - FINAL Greenhouse Gas Assessment_v6.docx B-6 Arrow LNG Plant Project – Greenhouse Assessment Coffey Environments on behalf of Arrow Energy | PAEHolmes Job 3678C

3678 C1-04 Coffey Arrow LNG - FINAL Greenhouse Gas Assessment_v6.docx C-1 Arrow LNG Plant Project – Greenhouse Assessment Coffey Environments on behalf of Arrow Energy | PAEHolmes Job 3678C
APPENDIX C Benchmarked LNG Facilities

3678 C1-04 Coffey Arrow LNG - FINAL Greenhouse Gas Assessment_v6.docx C-2 Arrow LNG Plant Project – Greenhouse Assessment Coffey Environments on behalf of Arrow Energy | PAEHolmes Job 3678C
The following LNG facilities were used in the benchmarking study (refer to Section 8.1.6):
Australian Developments:
o North West Shelf Project – Karratha, Western Australia (APLNG, 2010);
o Darwin 10 MTPA LNG Facility - Wickham Point, Darwin Harbour (URS, 2002);
o Gorgon Development – Barrow Island, Western Australia (IEA, 20);
o Pluto LNG Project – near Karratha, Western Australia (Woodside, 2007);
o Gladstone LNG (GLNG) Project – Curtis Island, Queensland (URS, 2009);
o Gladstone LNG Project– Fisherman’s Landing, Queensland (APLNG, 2010);
o Queensland Curtis LNG (QCLNG) Project – Curtis Island, Queensland (QGC, 2009);
o Prelude Floating LNG (FLNG) Project – Northern Browse Basin, 200 km off shore northwest Western Australia (Shell 2009); and
o Australia Pacific LNG (APLNG) Project - Curtis Island, Queensland (APLNG, 2010).
International Developments:
o Oman LNG – Qalhat, Oman (DiNapoli & Yost, 2003);
o Nigeria LNG – Bonny Island, Nigeria (DiNapoli & Yost, 2003);
o RasGas – Ras Laffan, Qatar (DiNapoli & Yost, 2003);
o Qatargas – Ras Laffan, Qatar (DiNapoli & Yost, 2003);
o Atlantic LNG – Point Fortin, Trinidad (DiNapoli & Yost, 2003);
o Snøhvit – Hammerfest, Norway (APLNG, 2010);
o PNG LNG Project – 20km north west of Port Moresby, Papua New Guinea (Kewan Bond, 2008); and
o Egyptian LNG (ELNG) Project - East of Bay of Abu Qir, Egypt (APLNG 2010).

3678 C1-04 Coffey Arrow LNG - FINAL Greenhouse Gas Assessment_v6.docx D-1 Arrow LNG Plant Project – Greenhouse Assessment Coffey Environments on behalf of Arrow Energy | PAEHolmes Job 3678C
APPENDIX D
ToR Cross-Reference Table

3678 C1-04 Coffey Arrow LNG - FINAL Greenhouse Gas Assessment_v6.docx D-2 Arrow LNG Plant Project – Greenhouse Assessment Coffey Environments on behalf of Arrow Energy | PAEHolmes Job 3678C
Table 77: Terms of Reference Cross Reference Table for the Greenhouse Gas Assessment Technical Study
Terms of Reference PAEHolmes
Section EIS Requirement Technical Study
Name
Technical Specialist Report Section
3.6.3 Greenhouse Gas Emissions and Abatement
This sub-section of the EIS should: Provide an inventory of projected annual emissions for each relevant greenhouse gas, with total emissions expressed in ‘CO2 equivalent’ terms
ARROW LNG PLANT – Greenhouse Gas Emissions Assessment
Section 5
Estimate emissions from upstream activities associated with the proposed project, including fossil fuel based electricity consumed
Section 5
Briefly describe the method(s) by which estimates were made. The emissions may be estimated using the methodology contained in the National Greenhouse Accounts Factors, Department of Climate Change (January 2008)
Section 4, Appendix A
Identify the contribution of the range of GHG mitigation measures incorporated in the plant design. These measures could include the addition of waste heat recovery, additional vapour recovery from ship loading, the use of high efficiency gas turbines and/or compressors, and the use of low BTU fuel
Section 8, 8.1
Greenhouse gas abatement issues should be described and discussed and include: Measures (alternatives and preferred) to avoid and/or minimise greenhouse gas emissions directly resulting from activities of the project, including such activities as transportation of products and consumables, and energy use by the project
Section 8, 8.1
An assessment of how the preferred measures minimise emissions and achieve energy efficiency
Section 8, 8.1
A comparison between preferred measures for emission controls and energy consumption with best practice environmental management in the relevant sector of industry
Section 8.1.6
A description of any opportunities for further offsetting greenhouse gas emissions through indirect means
Section 9.1.1
The environmental management plan in the EIS should include a specific module to address greenouse gas abatement. This modlue should include consideration of the following:Project commitments to the abatement of greenhouse gas emissions with details of the intended objectives, measures and performance standards to avoid, minimise and control emissions
Section 8.1
Project commitments to energy management, including undertaking periodic energy audits with a view to progressively improving energy efficiency, in accordance with legislation
Section 9.1.2

3678 C1-04 Coffey Arrow LNG - FINAL Greenhouse Gas Assessment_v6.docx D-3 Arrow LNG Plant Project – Greenhouse Assessment Coffey Environments on behalf of Arrow Energy | PAEHolmes Job 3678C
Terms of Reference PAEHolmes
Section EIS Requirement Technical Study
Name
Technical Specialist Report Section
A process for regular review of new technologies to identify opportunities to reduce emissions and use energy efficiently, consistent with best practice environmental management
Section 8.1.6
Voluntary initiatives such as projects undertaken as a component of the national Greenhouse Challenge Plus program, or research into reducing the lifecycle and embodied energy carbon intensity of the project’s processes or products
Section 9.1.1
Opportunities for offsetting greenhouse emissions, including, if appropriate, carbon sequestration and renewable energy uses
Section 9.1
Project commitments to monitor, audit and report on greenouse gas emissions from all relevant activities and the success of offset measures.
Section 9.1

3678 C1-04 Coffey Arrow LNG - FINAL Greenhouse Gas Assessment_v6.docx Arrow LNG Plant Project – Greenhouse Assessment Coffey Environments on behalf of Arrow Energy | PAEHolmes Job 3678C