Embed Size (px)
Citation preview
R. & M. No. 3602
4¢3~o
, % j , !
MINISTRY OF TECHNOLOGY
AERONAUTICAL RESEARCH COUNCIL
REPORTS AND MEMO RA N D A
The Landing Flare of Large Transport by W. J. G. PINSKER
Aerodyflamics Dept., R.A.E., Bedford.
Aircraft
LONDON" HER MAJESTY'S STATIONERY OFFICE
1969
PRICE •1 8S 0d NET
The Landing Flare of Large Transport by W. J. G. PINSKER
Aerodynamics Dept., R.A.E., Bedford.
Aircraft
Reports and Memoranda No. 3602* November, 1967
Summary. The factors are considered which influence the landing flare, especially of large aircraft. The height
required for the flare is a function of the performance and the dynamic response characteristics of an aircraft but, in practice, limitations of pilots' judgement may make it more difficult, especially on large aircraft, to realise fully the theoretically available flare capability and, also, the desired precision in control over touchdown. These limitations may increase the required weather minima and also the margins in runway-length to accommodate the increased scatter of touchdown, unless aids are provided to assist the pilot in more positive touchdown control.
Recovery from disturbances due to gusts during the landing flare is also shown to become marginal for the larger aircraft with more sluggish elevator response. Manoeuvre boost offers scope for significant improvement but for the very large aircraft direct lift control appears the most promising technique capable of overcoming this and other problems raised in this Report.
Section 1.
LIST OF CONTENTS
Introduction
2. Final Approach, Flare and Touchdown
2.1. Final approach
2.2. Flare
2.3. Touchdown
3. Physical Flare Limitations due to Aircraft Performance and Response
3.1. The effect of speed and normal acceleration on the flare
3.2. The effect of aircraft pitch response
3.3. The effect of adverse elevator lift
4. Pilot's Position in Relation to Main Wheels
*Replaces RAE Technical Report 67 297 (A.R.C. 30 353).
.
6.
7.
8.
Numerical Examples
Aerodynamic Ground Effect
The Effect of Atmosphere Disturbances During Final Approach and Flare
Possible Improvements to Aircraft Longitudinal Control Response
8.1. Stability augmentation and control response augmentation
8.2. Novel forms of aerodynamic control
8.3. Numerical examples
Simulation of Landings
Flare Performance and Weather Minima
.
10.
11. Discussion and Conclusions
List of Symbols
References
Appendix A
Appendix B
Appendix C
Tables 1 to 3
Illustrations--Figs. 1 to 37
Detachable Abstract Cards
Computation of flare height and distance
Determination of pitch response lag t R
Response delay due to elevator lift
1. I n t r o d u c t i o n .
For the pilot, approach and landing has always been the most demanding part of his job. Landing is the only phase where he is denied the relative freedom of manoeuvre so characteristic of general flight, and is restrained instead to a narrowly defined path. Moreover in this task the aircraft must be flown close to the lower boundary of its safe flight envelope. It is not surprising therefore to find 1 that over a long period close to 50 per cent of all accidents to civil aircraft occur during approach and landing. In the military field, where additional operational hazards are met, the proportion is somewhat lower, but not sub- stantially so. Although many of these accidents are caused by factors not considered in this study, a considerable proportion is attributable to what is rather unkindly, perhaps, described as pilot error. For instance it was found that with the introduction of the large jets into airline service the proportion of undershoots increased from 3 to 11 per cent of the total accident rate. This observation could indicate that the flying characteristics of these new aircraft made undue demands on pilots' skill and that as a con- sequence 'errors' were made more frequently.
Trends, such as the one just quoted, can only teach a useful lesson if they can be unambiguously related to some particular design fe~ture. Speed has been the traditional scapegoat, although a dispassionate
observer may well come to the conclusion that most of its threat appears to have been absorbed by simultaneous developments in landing aids, such as the laying of more concrete, and advances in terminal guidance. It can even be argued with some conviction that speed makes an aircraft less sensitive to atmospheric disturbances and therefore must reduce the risk of gust-induced disturbances.
Aircraft size is another factor which one feels may affect manoeuvrability, and, as a consequence make tight control, as required in the approach, increasingly more difficult. Again, as with speed, pilots appear to be able to accommodate to this feature without undue difficulty, if the lack of persistent complaint is accepted as a criterion.
Such generalized observations are clearly of little value unless backed by more tangible evidence. The systematic study of the aircraft parameters which can be expected to influence landing performance is, however, fraught with difficulty. If one attempts to do this by observation of the behaviour of different aircraft in service, as was tried in Ref. 2, one finds it impossible to obtain unique correlation with any one parameter, say size, weight, approach speed, etc. In practice, two aircraft differ usually from one another by most of the relevant characteristics simultaneously, unles~ they are members of the same generation, in which case they may differ so little, as to make separation practically impossible.
A theoretical attack is equally difficult to formulate, as this must consider piloting as an essential element. Control during landing relies ultimately on pilots' judgement. The analysis of the basic aircraft characteristics as such, although obviously relevant, can at best give only a partial picture. It certainly will not normally explain incidents precipitated by 'pilot error'. The study of the landing manoeuvre as a piloting task requires not only a knowledge of the reaction of the pilot to a given stimulus, his transfer function as the servo engineer would call it, but moreover the understanding of the stimuli themselves, i.e. of the way in which the human pilot judges the aircraft motion in relation to the runway. A great amount of effort has been devoted in recent years to the study of the human operator as a servo system, but all this work assumes a uniquely defined single quantity as the control stimulus. This situation in no way resembles aircraft control in the approach. There is no single quantity which the pilot can be assumed to perceive directly as the control quantity. Even if such guidance is provided in the steady part of the approach, as an ILS indication showing the displacement from the nominal glide path or as a high-low signal from a visual glide path indicator, no such simple guidance assists the pilot in the flare. In fact it seems plausible to assume that the pilot controls the flare not at all in the manner of closed loop con- tinuous control but rather by a series of programmed operations, i.e. essentially in open loop control. This form of operation which the psychologist recognises as pre-cognitive control (sometimes as 'ballistic' control) is often adopted by a human in a frequently repeated task. Seen in this light the only stimulus required for the pilot to initiate the flare, would be a certain height above the runway. Unfortunately the process by which a pilot judges height is little understood. We do not know how it is done, much less how accurately.
Considering these difficulties it is perhaps not surprising to find that--al though amongst the most critical flight manoeuvres--landing control has been practically ignored as a subject for systematic study. A notable exception is Ref. 3, an early attempt inspired by the Brabazon project. The present enquiry cannot offer more than a tentative approach to the problem. Lateral control is entirely ignored and so largely is control of speed, both of which can, of course, contribute substantially to the overall piloting task. Also it is restricted to the terminal phase of the landing approach, the manoeuvre broadly defined as the flare. It will attempt first to show the influence of speed, size, weight etc. on the basic flare cap- ability of aircraft, and go on to speculate how these characteristics may then effect the pilot's task.
2. Final Approach, Flare and Touchdown.
First we have to define the manoeuvre involved in landing the aircraft. For the purpose of the present study it is convenient to distinguish three distinct phases of the landing process, as illustrated in Fig. 1, namely the final approach, the flare, and the touchdown. Not every landing will conform to this pattern. One form of landing is, for instance, the extreme case, where no flare is made at all, the aircraft being driven towards the ground along a straight glide path. Clearly in this case, phases 2 and 3 of Fig. 1, i.e. manoeuvres defined as flare and touchdown control, do not occur. On the other hand, the ideal landing is one in which the aircraft arrives at the completion of the flare on the ground with only a small residual
3
vertical velocity (ideally zero) and here the final phase is not distinguishable as a separate stage. In other words touchdown is completely controlled by the execution of the flare. However, this is not in general the case. In fact the final manoeuvre, touchdown control, we define here as that manoeuvre required to affect touchdown if at the end of the flare the aircraft is still afloat at a height of usually only a few feet or so above the ground.
We shall now define these three phases of the landing in more detail and consider some operational evidence which might throw light on the kind of difficulty pilots have in closely controlling aircraft through the three phases of a landing.
2.1. Final Approach. This Report does not strictly concern itself with the approach, but rather with the pilot's action required
to affect transition from approach to touchdown. The approach is of interest then only in so far as it defines the initial conditions from which the flare has to be initiated. In the approach the pilot attempts to establish the aircraft in a well stabilized flight condition and configuration, i.e. essentially at a speed V a and a vertical velocity as defined by the glide slope ~, normally set at a value between 2½ ° and 3 °.
Interference by atmospheric turbulence, guidance errors and inaccurate control by the pilot will result in deviations from the nominal glide path, which the pilot attempts to correct before commencing the final flare or, indeed, in the flare itself. In azimuth such errors require correction by a sidestep manoeuvre, which has been studied quite extensively both in flight 4 and analytically 5. The purpose of this manoeuvre is to bring the aircraft on to a course aligned with the centre of the runway. In the vertical plane the pilot may not feel equally compelled to correct displacement from the nominal glidepath, as he may have enough runway in hand to absorb such errors. Nevertheless occasionally aircraft can be observed to 'dive' for the ground from a high approach or to flatten the path to stretch a low approach. (See the examples to be discussed in more detail later in Fig. 4). To provide a margin for such contingencies the glidepath origin is usually located at a considerable distance from the runway threshold.
2.2. Flare. In the final approach the aircraft has a vertical velocity (V a sin 7) if 7 is the glide angle, which must
be substantially reduced to achieve a touchdown rate of descent which the undercarriage can absorb. This the pilot attempts during the flare. Indeed, the ideal flare would be a smooth round-out at the end of which the aircraft arrives tangentially on the ground. In the execution of the flare the pilot relies entirely on his judgement and experience. He decides on the moment to initiate the flare and on the amount and on the timing of elevator control thereafter.
Figs. 2a-c show some recordings of manual landings made during systematic tests carried out by the Blind Landing Experimental Unit of the R.A.E. at Bedford. Such detailed records are unfortunately not available in great numbers and l he samples shown, although perhaps representative of the 'average landing,' do not demonstrate what happens in the more extreme cases. Nevertheless a few interesting observations can be made.
Four of the six (Aa, A2, B1 and C2) are near text-book landings, the flare is reasonably smooth and progressive and the touchdown is well controlled at a very small rate of descent, although in C2 there is evidence of a period of float afler the flare proper is completed.
In the examples B 2 and C1 things are apparently less controlled, both show evidence of pilots' mis- judgement. In B2 the flare was initially overdone and the pilot had to ease off half way through, in Ca the pilot failed to flare properly and a hard touchdown resulted. It is interesting to note that this is so, although his elevator application is very similar to that in case C 2 where a good flare was obtained.
Another feature, common to all the recorded landings, brings itself to one's attention. As the ground is approached the pilots appear to 'pump' the stick with a fairly high frequency, as if to feel for the ground. This phenomenon is a common observation, but a logical explanation is difficult to find. It is conceivable that the pilot uses this as a test function, to reassure himself continuously of the control over pitching acceleration available; this he may be able to sense. As the recorded pitch angles show and indeed, as can be demonstrated from first principles, at these frequencies the aircraft is practically incapable of respond- ing and the pilots' pumping action cannot help directly in the control of the flight path.
Although the size of this random sample of records does clearly not permit any generalisation, it is nevertheless tempting to note l hat the two landings on the large jet aircraft are noticeably the least well controlled. In one, the aircraft is slightly overflared and touchdox~ n only occurs after a float of about 3 sec, in the other case t he flare was incomplete when the ground was touched and a hard landing resulted.
This observation is made mainly because it tends to be consistent with statistical evidence, which in fact shows that, when a large sample is consulted, there is a marked deterioration in both control of touchdown point and in the vertical velocity of large jets when compared with earlier propeller driven transport aircraft. This is clearly evident in Fig. 3 which gives the results of a large sample of touchdown data obtained in routine commercial operation during the early sixties.
2.3. Touchdown. Touchdown should ideally follow immediately upon the completion of the flare. However, frequently
at the end of the flare proper the aircraft may still be a few feet above the runway and travel a considerable distance---float over the runway--before it eventually touches down. In these cases it is then possible to distinguish a distinct third phase of the l~mding manoeuvre, touchdown.
The probability and the possible extent of this post flare state will depend primarily on the accuracy of control during the flare. If the flare can be adequately controlled, it should not occur, although in some cases, a float may be necessary to bleed off speed, e.g. to avoid nose wheel touchdown. The relative frequency of touchdown, say more than 2000 ft from the threshold, shown in Fig. 3 may be interpreted to indicate that with present day aircraft, a good many landings are not completed at the end of the flare proper, although the evidence is rather indirect. A better picture of the type of landing occuring in normal service may be obtained from Fig. 4. This has been rather freely reconstructed from data given in Ref. 10. Shown are the flight paths during the 'average landing' and some examples of the most extreme touch- downs recorded in this sample. Flight C gives a good example of a long float from an initially well placed approach. Landing E is perhaps the most striking record, although in the absence of further detail, attempts at explanations may be ill advised.
If for some reason the pilot finds it difficult to control the instant of touchdown positively this must have repercussions on lateral control in crosswinds. Generally pilots prefer the crabbed approach to the sideslipping approach, as it relieves them of a long spell of flight with crossed controls, a technique which is tiring and essentially less safe. However, the crabbed approach must be terminated by the manoeuvre described as kicking-off drift, and to be successful this must be co-ordinated with the touchdown so that the aircraft heading is just lined up with the runway when the wheels make contact. Clearly if the pilot cannot predict when touchdown will occur, kicking-off drift as a co-ordinated dynamic manoeuvre is impracticable and instead the aircraft must be flown for a period in a sideslipping condition until contact is made. This appears to be in fact what pilots are doing on the large jets where the aircraft is 'decrabbed' well before it reaches the threshold.
What is important for the designer is that he recognises the possible need for such a change in technique. As requirements for gust control are additive to those arising from the steady crosswind component in sideslipping flight, this technique will require increased lateral control power.
3. Physical Flare Limitations due to Aircraft Performance and Response. Before one considers the role of the pilot it is useful first to establish the basic limitations which the
aircraft characteristics impose on the flare manoeuvre. One can distinguish perhaps three main factors. There is first the kinematic relationship between speed, normal acceleration and flight path curvature, which sets the most fundamental limit for any given aircraft. Then we have to consider the delay caused by limitations in pitch response in establishing a steady pull up, and thirdly, if the aerodynamic pitch control of the aircraft acts aft of the cg, a further delay will be experienced due to the adverse nature of the elevator lift.
Finally ground effect ought to be considered as a major contributor. It is, however, difficult to generalize its treatment, as the nature of the ground effect depends critically on the detailed layout of a configuration.
3.1. The Effect of Speed and Normal Acceleration on the Flare.
If the aircraft is assumed to be initially in steady descending flight with a vertical velocity (V, sin 70) and flared by an instantaneous application of a normal acceleration An o and if this is maintained until the vertical velocity is zero, the loss of height in this manoeuvre is determined by
AH - (V,, ?0) 2 2Ang (1)
This function has been plotted in Fig. 5 for the practical range of the relevant parameters. It is one of the principal arguments in this Report that increased flare height indicates the degree of
anticipation required by the pilot to affect a smooth landing and that it is an unfavourable factor. Flare height can be reduced if a finite rate of descent is accepted at touchdown, i.e. if touchdown is allowed to occur before the flare is completed. The flare heights for the cases where ground contact occurs with 2 ft/sec and 4 ft/sec respectively have been computed and plotted in Fig. 6 for two values of An. At low approach speeds this technique allows the pilot to delay the flare substantially, so that at 100 knots for instance, flare height can be halved, if 4 ft/sec impact velocity is accepted. At 180 knots, however, the same touchdown condition only permits the flare height to be reduced by approximately 25 per cent.
Whereas approach speed and glide slope are factors largely outside the pilot's choice, he has an appar- ently free choice of normal acceleration An, provided he avoids encroachment into the stall. Current airworthiness regulations ensure that at V a this allows him at least An = 0.69 g. What pilots actually use is considerably less. Fig. 7 shows maximum values of flare g's recorded during routine commercial operations of Boeing 707 and Comet 4 respectively, plotted against landing weight. For the 707 the mean value taken from this sample would be approximately 0.09 g, for the Comet it is significantly higher at 0.135 9. These values are peaks held only during a short portion of the flare. Mean values appropriate to the type of simplified estimates implied in Figs. 5 and 6 are not available but obviously they must be lower than the peak values presented in Fig. 7. The statistical data shown in this Figure also confirms the general observation that in the larger and faster aircraft (707 in this case) pilots use noticeably less 9 in the landing
Although no rational process is known by which pilots' choice of flare g can be explained, it is plausible to assume that during the period immediately prior to touchdown a pilot will avoid any action which could conceivably lead to a situation in which he is not in complete control of the aircraft. In other words he may wish to use quasi-steady control without involving the dynamic modes of the vehicle. In the larger vehicle with its larger pitch inertia, he may become increasingly concerned with the development of angular momentum and use a more constrained flare technique.
The analysis presented in this Section suggests that increasing approach speeds require the pilot to initiate the flare at increasing heights. There are also indications that aircraft size may further restrict him to a more gentle flare, using less g, to maintain close control over the aircraft's pitching motion. One aspect of this phenomenon will be examined in more detail below.
3.2. The Effect of Aircraft Pitch Response.
In the analysis so far, it was assumed that the aircraft can be flared by applying and removing 9 instant- aneously. This is, of course, a crude simplification and we shall attempt now to consider a more realistic manoeuvre when the aircraft must be pitched through the appropriate angle before the flare 9 is developed. Again no attempt will be made to consider the pilot as an active element in the control loop. Rather we shall establish the physical limitations imposed by the response characteristics of the aircraft, realizing, of course, that a pilot is not very likely to so use the limits of manoeuvrability of the vehicle.
Instead of assuming constant An throughout the flare, a manoeuvre with a smooth build-up and bleed off of 'g' is considered as defined in Fig. 8. By integrating this function from the start of the flare until vertical velocity is zero, the flare height is determined in Appendix A by the expression
AH - (V.~o) 2 kV~yo tR
2Anmaxg 2 (2)
where tR is the pitch response delay time. Comparison with equation (1) shows that the pitch response delay t R simply adds to the basic flare height.
For four values of Anmax this function has been plotted in Fig. 9. It can be seen that the pitch response delay--unless greater than a few seconds--will not greatly affect the flare height as long as the pilot only uses low g's. For a more rapid flare, on the other hand, t R becomes dominant.
The diagrams shown in Fig. 9 show an upper boundary of values of tR beyond which equation (2) does not apply, as in this regime the slow pitch response does not permit the originally assumed An . . . . to be attained. As an alternative the manoeuvre sketched in Fig. 10 must be considered. In Appendix A the flare height in this case is determined by
H = V avotR. (3)
This function has been plotted in Fig. 11. The maximum normal acceleration is now determined by tR as
V. Vo Anmax = - - (4)
tR9
and this value has also been plotted in Fig. 11. Fig. 11 applies therefore either outside the boundaries presented in Fig. 9 or alternatively for a manoeuvre in which tR rather than Anmax is specified.
t R is shown in Appendix B to be limited by the available elevator power, which is expressed by the equivalent pitching acceleration 0. tR can be computed approximately from the equation
7~g f ( A~ma x 7gg ) 41 ..~ ( A/~max - - V , Om,x)--+~/\ 2 ga0ma x 2
nO ) 2 ( W/S n VaTmax ~C L P vog
(5)
This expression has been solved for a representative range of the relevant parameters and, in Fig. 12, tn is plotted as a function of these aircraft response parameters. For the case where
Va 70 - - < AnSPECIFIED, tg 9
equation (3) applies. As t R and Anma x are now interrelated a new expression for t R has been formulated in Appendix B :
~o-2 t~ 8CL p t~ (6)
tg as defined by this equation has been computed and plotted in Fig. 13. The analysis given so far permits the height required for an ideal flare and the distance travelled by the
aircraft during this manoeuvre to be estimated. However, in the assessment of the effect of the delay due to pitch response the elevator was assumed to produce a pure pitching moment. A real control will produce the moment by generating lift at a finite moment arm and this lift can have considerable further delaying action as considered in the following Section.
3.3. The Effect of Adverse Elevator Lift. If the elevator acts aft of the aircraft cg, i.e. in the conventional case excluding foreplanes, the lift gener-
ated by it will be in opposition to that aimed at by the pilot in applymg elevator. As the elevator lift acts instantaneously with the control deflection, whereas the development of lift due to change in incidence is delayed by the pitch response, the initial response of the aircraft to elevator will be in the wrong direction. Although pitch will increase progressively all the time in response to nose up elevator, the aircraft cg will be first accelerated downwards and height will be lost before the wing lift eventually gains the upper hand. This effect is well known, but so far has been of little more than academic interest. With large aircraft, however, especially if they have elevons operating on a relatively short moment arm, the effect can be quite significant, as can be seen from Fig. 14, where initial responses in normal acceleration (An), rate of change of height (dH/dt) and height (H) are compared for 3 different types of transport aircraft. For the propeller transport, and even for the present day large subsonic jets, the delay is most probably hardly noticeable to the pilot, but for the supersonic transport aircraft or for the proposed jumbo jets, on the other hand, the aircraft response may well be markedly affected; 2/3 of a second may pass before positive normal acceleration begins to develop, vertical velocity may be adverse for more than 1¼ seconds and it may take nearly 2 seconds before the original height is regained.
In Appendix C, simplifying assumptions have been used to estimate the relevant delay times very crudely as,
(a) time delay before the desired O is developing
W/S i n ~2 tA,=0 = 52.3 V 2 ~ 1 (7)
(b) time delay before vertical velocity becomes positive
t/1=o = ta.x/3
(c) time delay before initial height loss is recovered
(8)
tn : o = t~,~/6. (9)
A better approximation is presented in Appendix C, which requires the solution of the response time history up to the instant where positive response is obtained. The case is also considered where control is applied progressively i.e. ~/oc t, instead of as a step function. Fig. 15 shows results for this case compared with step input responses for two of the aircraft considered above in Fig. 14. It is evident that this form of elevator usage amplifies the delaying effect of elevator lift quite noticeably.
Conversely if elevator is progressively reduced after a rapid initial application, the initial delay in height response is reduced. This is illustrated by a few examples in Fig. 16. Although the pilot is at liberty to apply control in this manner, it does not represent a 'natural' action and can not be relied upon as a cure to our problems. However, it may be possible to devise control augmentation systems which generate the desired control response without requiring the pilot to resort to stick pumping and these possibilities will be examined in Section 8.
It should be noted that the calculation presented here ignores rn w and mq and other minor aerodynamic terms, but these will have relatively little effect on the initial aircraft response. Their effect can be shown to be generally adverse, resisting pitching without affecting the adverse response to elevator lift and the results given by the above approximations will therefore be somewhat optimistic.
4. Pilot's Position in Relation to Main Wheels.
Although of no direct consequence to the manoeuvrability of an aircraft as such the pilots position in relation to the other parts of the aircraft must have some influence on his ability to judge the motion of the aircraft as a whole and this may be particularly relavent during landing. The part of the aircraft which
has to be controlled to achieve a desired touchdown is the main undercarriage. The further away the pilot is from the undercarriage the more difficult he must find it to judge the path of the main wheels in relation to the ground and the less accurate therefore one must expect control over touchdown to become. Al- though this observation is no more than a statement of the obvious it is practically impossible to make any reliable prediction of the practical consequences of this problem.
In the first place there are no data on pilots' ability to judge height and equally important none of the precise mechanism by which he translates height appreciation into control action. The most useful test one could devise to obtain some practical experience of this effect is to compare landings on two aircraft with identical aerodynamic and dynamic characteristics but in which pilots position above and ahead of the main wheels differs by a significant amount. This might be realized by the use of two aircraft of different size one of which is a variable stability aircraft, or more easily on a simulator.
Such tests have not been made and we are again driven to speculation. One might assume that pilots can judge height with a fixed percentage error. This is in fact the most optimistic assumption one can make, because pilots interrogated about this problem generally state that there is a height of roughly between 50 to 100 ft over the runway above which height judgement suddenly becomes uncertain, or words to that effect. As there is no quantitative confirmation of this observation we shall confine our analysis, however, to the hypothesis of constant percentage error.
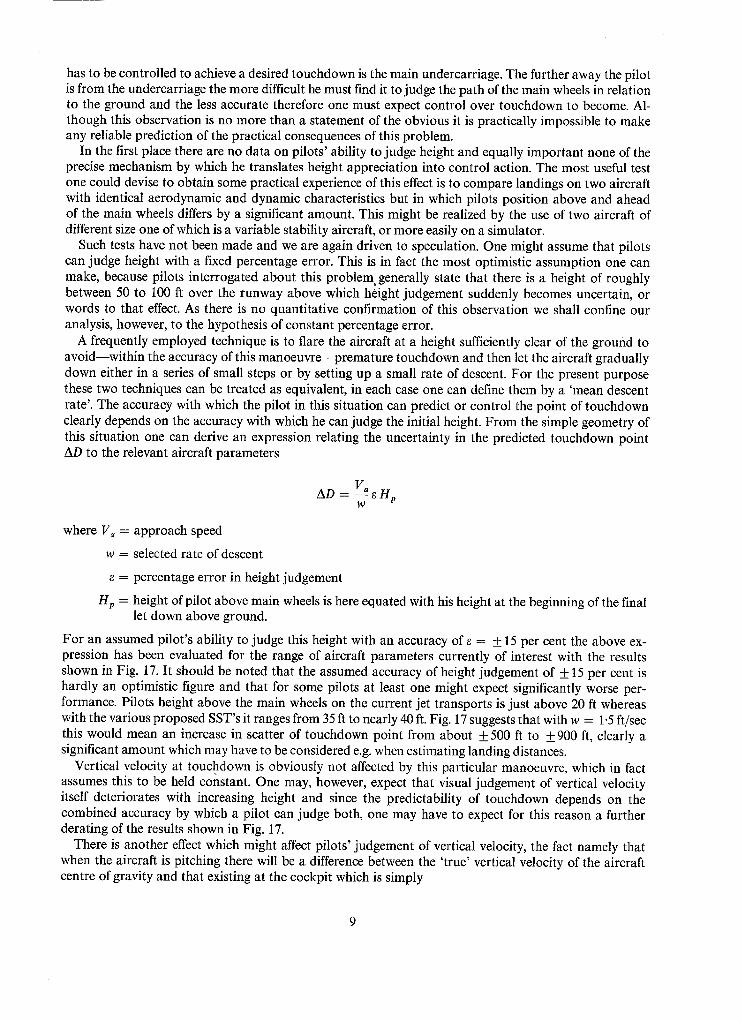
A frequently employed technique is to flare the aircraft at a height sufficiently clear of the ground to avoid--within the accuracy of this manoeuvre--premature touchdown and then let the aircraft gradually down either in a series of small steps or by setting up a small rate of descent. For the present purpose these two techniques can be treated as equivalent, in each case one can define them by a 'mean descent rate'. The accuracy with which the pilot in this situation can predict or control the point of touchdown clearly depends on the accuracy with which he can judge the initial height. From the simple geometry of this situation one can derive an expression relating the uncertainty in the predicted touchdown point AD to the relevant aircraft parameters
A D = V'~ e H p W
where V, = approach speed
w = selected rate of descent
= percentage error in height judgement
Hp = height of pilot above main wheels is here equated with his height at the beginning of the final let down above ground.
For an assumed pilot's ability to judge this height with an accuracy of e = + 15 per cent the above ex- pression has been evaluated for the range of aircraft parameters currently of interest with the results shown in Fig. 17. It should be noted that the assumed accuracy of height judgement of + 15 per cent is hardly an optimistic figure and that for some pilots at least one might expect significantly worse per- formance. Pilots height above the main wheels on the current jet transports is just above 20 ft whereas with the various proposed SST's it ranges from 35 ft to nearly 40 ft. Fig. 17 suggests that with w = 1.5 ft/sec this would mean an increase in scatter of touchdown point from about + 500 ft to _ 900 ft, clearly a significant amount which may have to be considered e.g. when estimating landing distances.
Vertical velocity at touchdown is obviously not affected by this particular manoeuvre, which in fact assumes this to be held constant. One may, however, expect that visual judgement of vertical velocity itself deteriorates with increasing height and since the predictability of touchdown depends on the combined accuracy by which a pilot can judge both, one may have to expect for this reason a further derating of the results shown in Fig. 17.
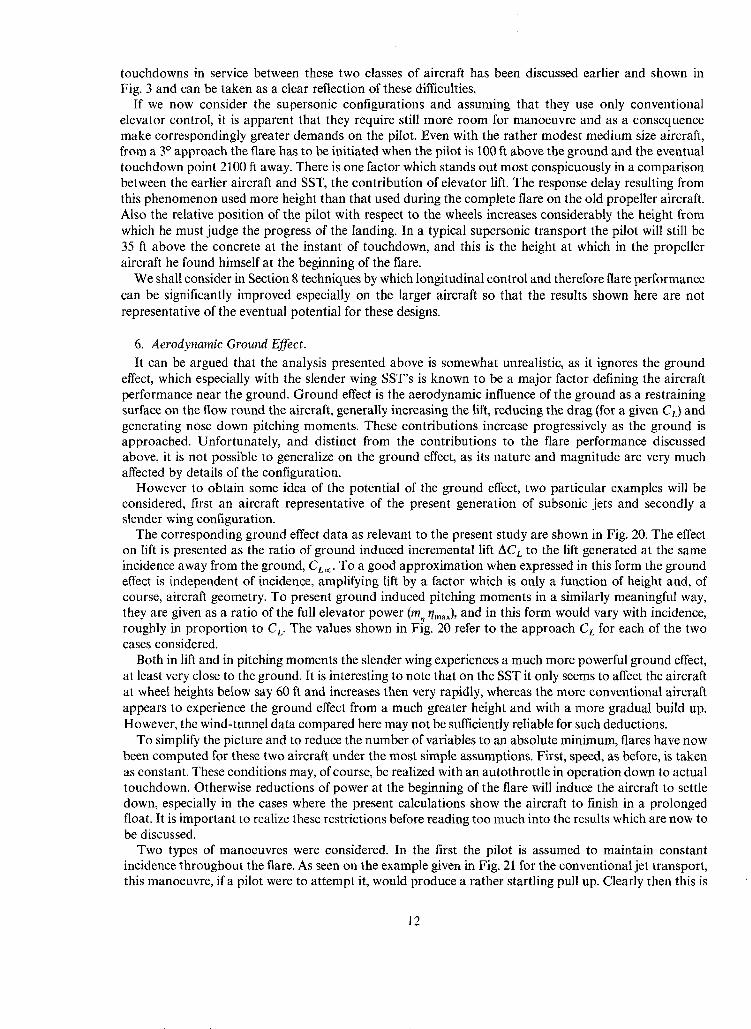
There is another effect which might affect pilots' judgement of vertical velocity, the fact namely that when the aircraft is pitching there will be a difference between the 'true' vertical velocity of the aircraft centre of gravity and that existing at the cockpit which is simply
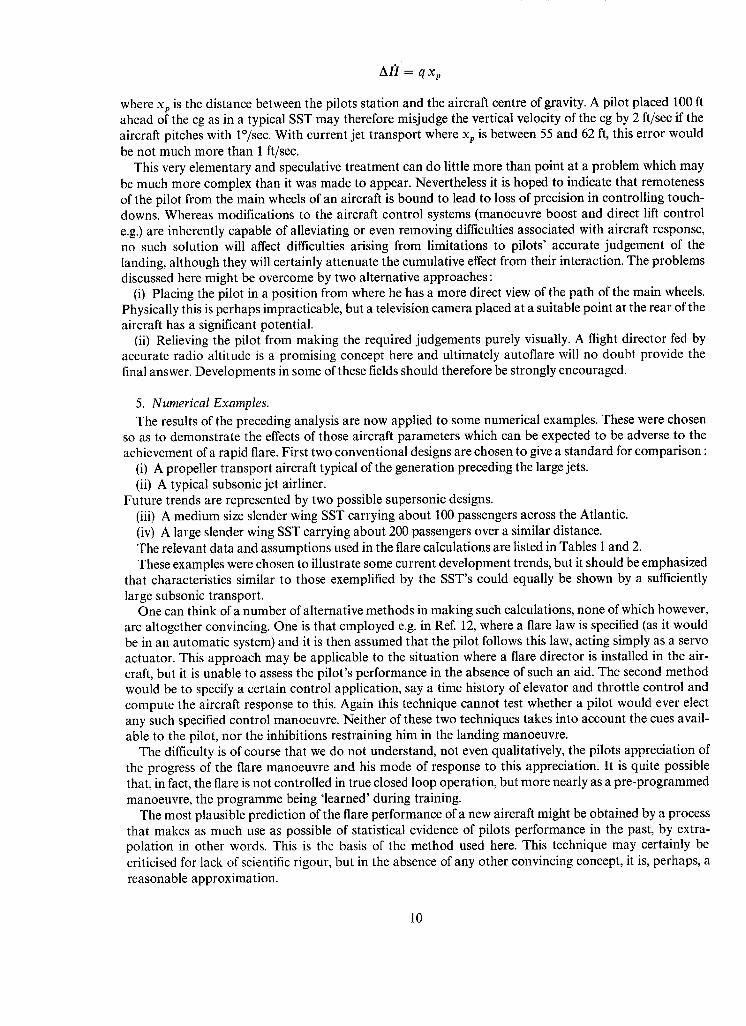
A/: /= q xp
where xp is the distance between the pilots station and the aircraft centre of gravity. A pilot placed 100 ft ahead of the cg as in a typical SST may therefore misjudge the vertical velocity of the cg by 2 ft/sec if the aircraft pitches with l°/sec. With current jet transport where xp is between 55 and 62 ft, this error would be not much more than 1 ft/sec.
This very elementary and speculative treatment can do little more than point at a problem which may be much more complex than it was made to appear. Nevertheless it is hoped to indicate that remoteness of the pilot from the main wheels of an aircraft is bound to lead to loss of precision in controlling touch- downs. Whereas modifications to the aircraft control systems (manoeuvre boost and direct lift control e.g.) are inherently capable of alleviating or even removing difficulties associated with aircraft response, no such solution will affect difficulties arising from limitations to pilots' accurate judgement of the landing, although they will certainly attenuate the cumulative effect from their interaction. The problems discussed here might be overcome by two alternative approaches:
(i) Placing the pilot in a position from where he has a more direct view of the path of the main wheels. Physically this is perhaps impracticable, but a television camera placed at a suitable point at the rear of the aircraft has a significant potential.
(ii) Relieving the pilot from making the required judgements purely visually. A flight director fed by accurate radio altitude is a promising concept here and ultimately autoflare will no doubt provide the final answer. Developments in some of these fields should therefore be strongly encouraged.
5. Numerical Examples. The results of the preceding analysis are now applied to some numerical examples. These were chosen
so as to demonstrate the effects of those aircraft parameters which can be expected to be adverse to the achievement of a rapid flare. First two conventional designs are chosen to give a standard for comparison :
(i) A propeller transport aircraft typical of the generation preceding the large jets. (ii) A typical subsonic jet airliner.
Future trends are represented by two possible supersonic designs. (iii) A medium size slender wing SST carrying about 100 passengers across the Atlantic. (iv) A large slender wing SST carrying about 200 passengers over a similar distance. The relevant data and assumptions used in the flare calculations are listed in Tables 1 and 2. These examples were chosen to illustrate some current development trends, but it should be emphasized
that characteristics similar to those exemplified by the SST's could equally be shown by a sufficiently large subsonic transport.
One can think of a number of alternative methods in making such calculations, none of which however, are altogether convincing. One is that employed e.g. in Ref. 12, where a flare law is specified (as it would be in an automatic system) and it is then assumed that the pilot follows this law, acting simply as a servo actuator. This approach may be applicable to the situation where a flare director is installed in the air- craft, but it is unable to assess the pilot's performance in the absence of such an aid. The second method would be to specify a certain control application, say a time history of elevator and throttle control and compute the aircraft response to this. Again this technique cannot test whether a pilot would ever elect any such specified control manoeuvre. Neither of these two techniques takes into account the cues avail- able to the pilot, nor the inhibitions restraining him in the landing manoeuvre.
The difficulty is of course that we do not understand, not even qualitatively, the pilots appreciation of the progress of the flare manoeuvre and his mode of response to this appreciation. It is quite possible that, in fact, the flare is not controlled in true closed loop operation, but more nearly as a pre-programmed manoeuvre, the programme being 'learned' during training.
The most plausible prediction of the flare performance of a new aircraft might be obtained by a process that makes as much use as possible of statistical evidence of pilots performance in the past, by extra- polation in other words. This is the basis of the method used here. This technique may certainly be criticised for lack of scientific rigour, but in the absence of any other convincing concept, it is, perhaps, a reasonable approximation.
10
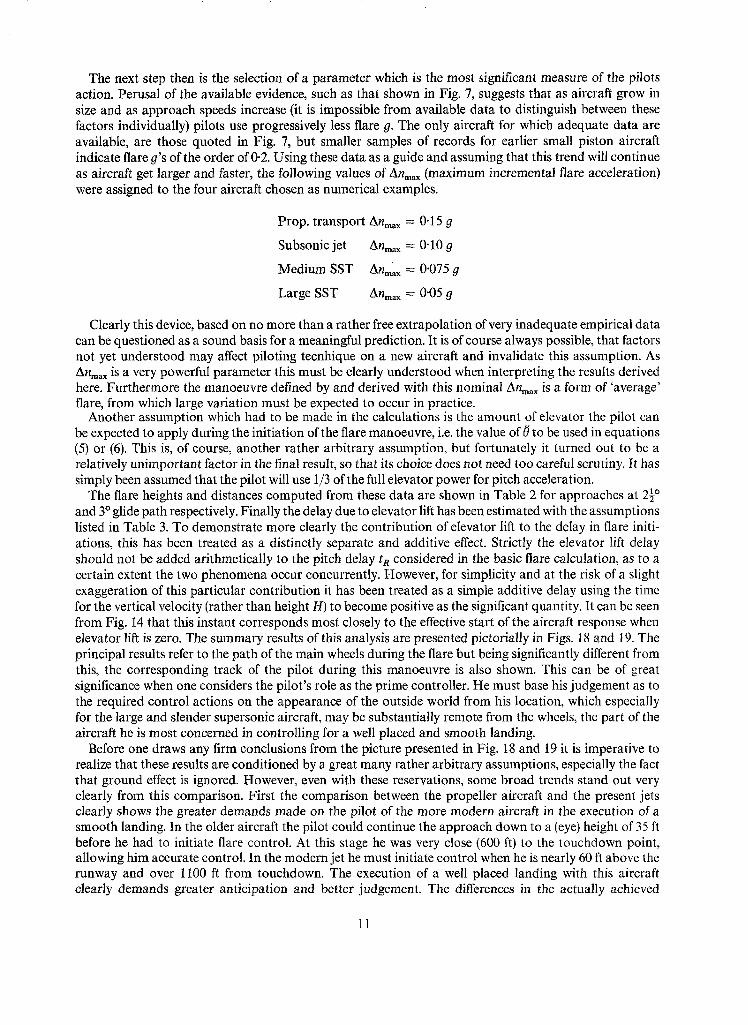
The next step then is the selection of a parameter which is the most significant measure of the pilots action. Perusal of the available evidence, such as that shown in Fig. 7, suggests that as aircraft grow in size and as approach speeds increase (it is impossible from available data to distinguish between these factors individually) pilots use progressively less flare 9. The only aircraft for which adequate data are available, are those quoted in Fig. 7, but smaller samples of records for earlier small piston aircraft indicate flare 9's of the order of 0.2. Using these data as a guide and assuming that this trend will continue as aircraft get larger and faster, the following values of Anma x (maximum incremental flare acceleration) were assigned to the four aircraft chosen as numerical examples.
Prop. transport Anma x = 0"15 g
Subsonic jet Anma~ = 0.10 g
Medium SST Anmax = 0"075 9
Large SST mnma x = 0"05 ~]
Clearly this device, based on no more than a rather free extrapolation of very inadequate empirical data can be questioned as a sound basis for a meaningful prediction. It is of course always possible, that factors not yet understood may affect piloting tecnhique on a new aircraft and invalidate this assumption. As Anmax is a very powerful parameter this must be clearly understood when interpreting the results derived here. Furthermore the manoeuvre defined by and derived with this nominal ~,nma x is a form of 'average' flare, from which large variation must be expected to occur in practice.
Another assumption which had to be made in the calculations is the amount of elevator the pilot can be expected to apply during the initiation of the flare manoeuvre, i.e. the value of 0 to be used in equations (5) or (6). This is, of course, another rather arbitrary assumption, but fortunately it turned out to be a relatively unimportant factor in the final result, so that its choice does not need too careful scrutiny. It has simply been assumed that the pilot will use 1/3 of the full elevator power for pitch acceleration.
The flare heights and distances computed from these data are shown in Table 2 for approaches at 2½ ° and 3 ° glide path respectively. Finally the delay due to elevator lift has been estimated with the assumptions listed in Table 3. To demonstrate more clearly the contribution of elevator lift to the delay in flare initi- ations, this has been treated as a distinctly separate and additive effect. Strictly the elevator lift delay should not be added arithmetically to the pitch delay t R considered in the basic flare calculation, as to a certain extent the two phenomena occur concurrently. However, for simplicity and at the risk of a slight exaggeration of this particular contribution it has been treated as a simple additive delay using the time for the vertical velocity (rather than height H) to become positive as the significant quantity. It can be seen from Fig. 14 that this instant corresponds most closely to the effective start of the aircraft response when elevator lift is zero. The summary results of this analysis are presented pictorially in Figs. 18 and 19. The principal results refer to the path of the main wheels during the flare but being significantly different from this, the corresponding track of the pilot during this manoeuvre is also shown. This can be of great significance when one considers the pilot's role as the prime controller. He must base his judgement as to the required control actions on the appearance of the outside world from his location, which especially for the large and slender supersonic aircraft, may be substantially remote from the wheels, the part of the aircraft he is most concerned in controlling for a well placed and smooth landing.
Before one draws any firm conclusions from the picture presented in Fig. 18 and 19 it is imperative to realize that these results are conditioned by a great many rather arbitrary assumptions, especially the fact that ground effect is ignored. However, even with these reservations, some broad trends stand out very clearly from this comparison. First the comparison between the propeller aircraft and the present jets clearly shows the greater demands made on the pilot of the more modern aircraft in the execution of a smooth landing. In the older aircraft the pilot could continue the approach down to a (eye) height of 35 ft before he had to initiate flare control. At this stage he was very close (600 ft) to the touchdown point, allowing him accurate control. In the modern jet he must initiate control when he is nearly 60 ft above the runway and over 1100 ft from touchdown. The execution of a well placed landing with this aircraft clearly demands greater anticipation and better judgement. The differences in the actually achieved
11
touchdowns in service between these two classes of aircraft has been discussed earlier and shown in Fig. 3 and can be taken as a clear reflection of these difficulties.
If we now consider the supersonic configurations and assuming that they use only conventional elevator control, it is apparent that they require still more room for manoeuvre and as a consequence make correspondingly greater demands on the pilot. Even with the rather modest medium size aircraft, from a 3 ° approach the flare has to be initiated when the pilot is 100 ft above the ground and the eventual touchdown point 2100 ft away. There is one factor which stands out most conspicuously in a comparison between the earlier aircraft and SST, the contribution of elevator lift. The response delay resulting from this phenomenon used more height than that used during the complete flare on the old propeller aircraft. Also the relative position of the pilot with respect to the wheels increases considerably the height from which he must judge the progress of the landing. In a typical supersonic transport the pilot will still be 35 ft above the concrete at the instant of touchdown, and this is the height at which in the propeller aircraft he found himself at the beginning of the flare.
We shall consider in Section 8 techniques by which longitudinal control and therefore flare performance can be significantly improved especially on the larger aircraft so that the results shown here are not representative of the eventual potential for these designs.
6. Aerodynamic Ground Effect. It can be argued that the analysis presented above is somewhat unrealistic, as it ignores the ground
effect, which especially with the slender wing SST's is known to be a major factor defining the aircraft performance near the ground. Ground effect is the aerodynamic influence of the ground as a restraining surface on the flow round the aircraft, generally increasing the lift, reducing the drag (for a given CL) and generating nose down pitching moments. These contributions increase progressively as the ground is approached. Unfortunately, and distinct from the contributions to the flare performance discussed above, it is not possible to generalize on the ground effect, as its nature and magnitude are very much affected by details of the configuration.
However to obtain some idea of the potential of the ground effect, two particular examples will be considered, first an aircraft representative of the present generation of subsonic jets and secondly a slender wing configuration.
The corresponding ground effect data as relevant to the present study are shown in Fig. 20. The effect on lift is presented as the ratio of ground induced incremental lift AC L to the lift generated at the same incidence away from the ground, CLo~. To a good approximation when expressed in this form the ground effect is independent of incidence, amplifying lift by a factor which is only a function of height and, of course, aircraft geometry. To present ground induced pitching moments in a similarly meaningful way, they are given as a ratio of the full elevator power (mr q .... ), and in this form would vary with incidence, roughly in proportion to C L. The values shown in Fig. 20 refer to the approach CL for each of the two cases considered.
Both in lift and in pitching moments the slender wing experiences a much more powerful ground effect, at least very close to the ground. It is interesting to note that on the SST it only seems to affect the aircraft at wheel heights below say 60 ft and increases then very rapidly, whereas the more conventional aircraft appears to experience the ground effect from a much greater height and with a more gradual build up. However, the wind-tunnel data compared here may not be sufficiently reliable for such deductions.
To simplify the picture and to reduce the number of variables to an absolute minimum, flares have now been computed for these two aircraft under the most simple assumptions. First, speed, as before, is taken as constant. These conditions may, of course, be realized with an autothrottle in operation down to actual touchdown. Otherwise reductions of power at the beginning of the flare will induce the aircraft to settle down, especially in the cases where the present calculations show the aircraft to finish in a prolonged float. It is important to realize these restrictions before reading too much into the results which are now to be discussed.
Two types of manoeuvres were considered. In the first the pilot is assumed to maintain constant incidence throughout the flare. As seen on the example given in Fig. 21 for the conventional jet transport, this manoeuvre, if a pilot were to attempt it, would produce a rather startling pull up. Clearly then this is
12
not a convincing approximation to a real flare and consequently the technique was abandoned as a basis for computations. Instead a manoeuvre was chosen in which attitude is held constant during the flare and this in fact gave more plausible results and may well be a good approximation to the real life case. It must be emphasised, nevertheless, that this manoeuvre is not put forward here as representative of a realistic piloting 'law' but simply as a synthetic device which permits the effects of the ground effect on the landing aircraft to be conveniently isolated. As has been argued at length earlier in this Report, no pilot's 'law' can be postulated with any confidence, so that the computation of a 'real' flare is not practicable anyway.
The calculations were made for both aircraft for approaches from 3 ° and 2½ ° in each case. The results are shown in Figs. 21 and 22, where the flare path, the incremental normal acceleration and the elevator angle requ.ired to satisfy the condition of constant attitude are plotted. In these computations the trim lift appropriate to this condition was taken into account so that the effective ground effect acting on the aircraft was substantially less than the data given on the left hand side of Fig. 20 would suggest.
It can be seen that approaches with constant speed and attitude do in fact result in each case in a flare- like manoeuvre. In one case (SST on a 3 ° glide path) ground contact is made with a rather severe impact velocity (6.5 ft/sec) in all other cases the manoeuvre would result in a float from which no doubt a pilot could easily complete a landing. These floats could be shortened or avoided if speed is allowed to decrease as it would in real life, at least with the conventional jets, which are known to lose approximately 10 knots in the flare. For the SST the assumption of constant speed is much closer to reality, as current estimates suggest that this aircraft will only lose about 2 knots in this manoeuvre.
For the subsonic transport aircraft the ground effect can be seen to make a powerful and smooth contribution to the flare, providing in fact the proverbial ground cushion. Rather surprisingly, perhaps, the sums would suggest that the rather artificial manoeuvre stipulated does in fact turn out to be a promis- ing technique. This is emphasised by the fact that the demands made on the pilot for pitch control, as indicated by the elevator time history t/(t), are quite modest and would appear to be comfortably within his capability.
The picture presented by the SST, on the other hand, is less reassuring. What stands out from Figs. 21 and 22 is the amount of elevator, the pilot has to apply to prevent thc nose from dropping and it appears that elevator co-ordination becomes much more demanding. If one remembers that full elevator com- mands approximately 40 per cent of the approach lift for this aircraft, it is obvious that departures of stick control from that specified will powerfully influence the progress of the flare and make the whole manoeuvre very sensitive to piloting variations.
To illustrate this point Figs. 23 and 24 were prepared. In these the pilot is assumed during the last 3 sec of the approach to fail to apply the correct amount of elevator for full compensation of the ground induced pitching moment. The errors considered were either 20 per cent over or under compensation. The effect of this in the final progress of the flare and on the resulting touchdown is clearly substantial. The point at which the pilot starts to depart from correct control is marked by the symbol ~ . It can be seen that the response of the aircraft to this is very sluggish. One can readily predict that the application of counter control when the consequences become apparent, perhaps 2½ sec later, would clearly have no significant effect, at least not in the cases where initially insufficient elevator was applied leading to an early and more severe ground impact.
Even if perfect trim is maintained as in the cases presented in Figs. 21 and 22 the flares resulting from the ground effect itself appear to be equally sensitive to the initial approach conditions. A change of only ½ deg. in the approach angle makes the difference between a heavy landing on the one hand and a near perfect landing on the other.
This somewhat unexpected result may be more readily comprehended if one forgets for a moment the usual interpretation of ground effect simply as a landing cushion. By analogy the ground effect could be likened to an updraught building up as the ground is approached to a peak value at touchdown of approxi- mately 10 ft/sec for the subsonic jets and to about 17.5 ft/sec for the SST. The rate of growth of this 'gust' varies from approach to approach as a function of the detailed progress of the flare. Unless this 'updraught ' can be shown to be such that it always produces an acceptable touchdown irrespective of normal vari- ations in pilot's control, the ground effect may have to be considered as a 'disturbance' to well-controlled flight and not just as a landing shock absorber. The most effective way to soften the severity of the rate of
13
development of this 'disturbance' is to select a very low final rate of descent, i.e. by executing an early flare. This will then give the pilot time to deal at leisure with the changes of trim and lift generated by the approach to the ground. However, this is a major change in approach technique and, unless the glide slope origin is appropriately adjusted, will lead to touchdown further down the runway and shorten the available landing run.
At the same time the calculations certainly show that attitude 0 is a useful term in the control of the flare of aircraft subject to a powerful ground effect, which ought to be considered in the design of flare directors and autoland systems.
7. The Effect of Atmospheric Disturbances during Final Approach and Flare. The discussion so far has considered the performance of the aircraft and pilot in an idealized atmosphere.
In real life the aircraft will be also subjected to gusts and wind shear, the effects of which must be countered by appropriate control action. As only the longitudinal motion is considered here, only two components of the atmospheric turbulence need to be taken into account, vertical and fore and aft variations. Due to the restraining influence of the ground, assuming it to be sensibly flat over the final approach, the vertical component is progressively reduced as the ground is approached, leaving as the predominant factor fore and aft gusts. A comprehensive trcatmenl of lhis essentially randonl phenomenon requires statistical methods, a process which is not attempted here. However some interesting observations can be made by considering what is potentially the most damaging example, the individual tail gust, leading to loss of lift and therefore to increased vertical velocity prior to touchdown or in extreme cases to undershoots. In the present context a reduction in headwind is regarded as a tail gust.
For the two aircraft considered above, calculations have been made in which as before the pilot is assumed to maintain constant attitude during the flare, whilst the aircraft is subjected at different heights to a 10 knot tail gust building up as a ramp function as illustrated in Fig. 25. In these calculations speed has been treated as variable. It was found by exploratory estimates, that the most critical height-band for the onset of such a gust is when the aircraft is between approximately 80 and 30 ft from the ground. If struck by the gust at a greater height, the aircraft has time to recover, if met at too low an altitude, the gust will not have sufficient time to increase substantially the vertical velocity of the aircraft.
The results of the calculation are plotted in Figs. 25 to 27. In eight out of ten cases considered the 10 knot gust will cause the aircraft to strike the ground with a vertical velocity of more than 10 ft/sec, which one can assume as the design limit. Quite clearly, this gust is potentially dangerous to any of the aircraft considered unless it can be shown that the pilot is capable of effecting recovery before the ground is contacted. There are two principal factors limiting the effectiveness of pilot's control of a gust upset, pilot's recognition and reaction time and secondly aircraft response. Pilots reaction time can be taken as ¼ second, recognition time on the other hand is a much more difficult quantity to postulate. It will depend amongst other things on the general turbulence background ; in rough conditions it will obviously be less feasible to rely on normal acceleration as the essential clue, and waiting until vertical velocity has altered significantly will cost valuable time. It must be assumed that airspeed itself may be unnoticed as at this late stage of the landing the pilot will no longer monitor instruments. To arrive at some comparative assessment, a value of ¼ second has been assumed, counting from the onset of the ramp, surely a very optimistic value. Added to the reaction time proper, this gives a total delay in pilot action from the onset of the gust of 1 second. The pilot is then assumed to pull the stick back progressively until the loss of height is checked. The delay in the aircraft response due to adverse elevator lift is then governed by the expression given at the end of Appendix C.
With these assumptions the results in Figs. 28 and 29 are obtained. In these Figs. gusts met at 60 and 40 ft above the ground have been considered for a typical current subsonic jet and for a slender wing transport. In each case the uncontrolled {other than holding constant attitude) response is shown by a solid line. It was not considered feasible to postulate how much control a pilot will use in response to a given upset, i.e. to define a pilots 'control gain'. Instead the response of the aircraft to a variety of physically possible control applications was calculated, as indicated by the dashed lines in Figs. 28 and 29. In these Figs. a number of significant events are marked,
(1} the instant of the onset of the ramp gust;
14"
(2) the assumed instant (one second later) at which the pilot applies control to check the disturbance. In Section 3.3 it was shown that elevator lift, if the control acts aft of the centre of gravity of the aircraft,
significantly delays the response of the aircraft and that in fact initially this response will be in opposition to that intended by the pilot. Furthermore it was shown that the delay in response to control is character- ised by fixed time constants which are invariant to the amount of control applied. Consequently it was possible to define two further events in the present case which again will be insensitive to the amount of control used by the pilot to check the tail gust.
These are : (3) The instant before which the incremental vertical velocity in response to pilots control will be
adverse. (4) The instant before which the changes in height following pilots control will be more adverse than
in uncontrolled response. Finally,
(5) The instant of touchdown. Unless this coincides with (4), the point will vary according to the amount of control applied.
Fig. 28 shows that in each of the cases considered for the conventional aircraft, pilot's control is effective in reducing rate of descent well before ground impact, assuming of course the pilot will react as quickly as assumed in these calculations.
For the slender aircraft (Fig. 29) the increased response delay has the effect of reducing considerably the pilot's chances of moderating the landing impact. After meeting the gust at a height of 60 ft, there is just time for elevator to reduce the rate of descent, but not enough to allow full recovery. When the gust occurs still later in the flare, at 40 ft, ground impact happens virtually at the same time as instant 3. i.e. there is no time for the beneficial effect of pilots control to materialise. In fact in this situation pilots' attempts to check the sink rate generated by the gust appears more likely than not to result inan even harder impact than that occurring in the absence of any pilot reaction.
These sums are subject to a number of assumptions and so the actual numerical results must be inter- preted with some caution. Two points do, however, stand out:
(a) The tail gust is a potential danger to the modern large aircraft during the approach. (b) The chances of the pilot being able to recover the aircraft from this type of gust upset are diminished
by the effects of adverse elevator lift and therefore the problem will be more severe for the very large and the tailless slender aircraft, although their fundamental response to the gust itself differs little from that of a more conventional aircraft.
Although the gust of 10 knots assumed here d6es not by any means appear excessive (the same gust in the lateral direction is e.g. generally accepted as a design case) the actual risk to an aircraft by this or even stronger gusts depends on the statistical probability of meeting it in the critical height band, say between 80 and 30 ft from the ground. As the aircraft spends only about 8 sec in this band during each flight, ignoring take off, this risk may be acceptably small, but any trends to make designs more susceptible to this phenomenon must be carefully watched.
8. Possible Improvements to Aircraft Longitudinal Control Response. We have shown that increasing aircraft size and speed will tend to limit manoeuvrability in the flare
and that adverse elevator lift can further delay effective elevator response especially for tailless designs in which the pitch control acts at a relatively short and inefficient moment arm. A further factor influencing precision control during landing is the relative position of the pilot in relation to the main wheels. The further the cockpit is located from the main undercarriage the more difficult the pilot must find it to judge where touchdown will occur and hence to control it.
One might conclude that all these factors combine to set an ultimate limit to aircraft size beyond which longitudinal control difficulties will lead to an unacceptable deterioration of landing performance and safety. The economic potential of the large aircraft is, however, so overwhelming that the designer is unlikely to accept this limitation as a positive barrier and he will have to explore new and perhaps radical changes in control design to overcome these difficulties.
In the search for such solutions we must isolate two distinct contributions to the problems, namely
15
those associated with longitudinal control response as such and those affecting pilot's judgement, i.e. his remoteness from the centre of the aircraft. Solutions to the latter problems were indicated in Section 4. They consist essentially of techniques which make landing control independent of pilots visual reference to the appearance of the ground.
Improvements in longitudinal control must aim, on the other hand, to speed up the aircraft's response to elevator demands and to shorten or eliminate the delay in height response caused by adverse elevator lift. We shall consider three possible avenues which the designer could explore.
(i) Techniques which modify the dynamic response of the aircraft's controls to pilot's demands to allow him to make the best possible use of the available control power.
(ii) Utilisation of novel form of longitudinal control, requiring fundamental changes in design. These will be now discussed separately.
8.1. Stability Augmentation and Control Response Augmentation. Before one considers entirely new forms of aerodynamic control, such as those discussed in Section 8.2,
one ought to examine the possibility of making more efficient use of the elevator power available in a given aircraft. The two main deficiencies limiting manoeuvrability on the large aircraft are sluggish pitch response and adverse elevator lift.
Let us examine first the problem of pitch response to elevator. Although in the flare a substantial amount of elevator is used, pilots are very far from exhausting in this manoeuvre the limits of available control. This can be seen in the examples shown in Fig. 2 and more meaningful perhaps in the statistical data presented in Fig. 30. These latter data apply to current large jets, a class of aircraft in which sluggish pitch response is certainly beginning to affect flare control. One might conclude then that pilot's control of the flare is not so much restricted by lack of control power but rather by the dynamic characteristics of the aircraft to elevator, which inhibit him from using control movements which ought to be able to speed things up. This problem is well appreciated today in many areas of aircraft handling; the pilot is reluctant to make powerful control demands because he knows that he will have difficulty in stopping the motion so initiated. This suggests stability augmentation as a potential solution.
In fact a simple pitch damper applying elevator according to
q s = 0 K
is capable of improving the longitudinal response of a typical large slender-wing aircraft to a step demand by the pilot, as indicated in Fig. 31. It should be noted that the two cases compared there are chosen to g~ . the same final steady "g'. It is interesting to note that this improvement is brought about by the artificial stabilizer quickly removing elevator from the large initial value applied by the pilot and so providing the checking control action which the unaided pilot finds difficult to achieve with confidence. Another interesting observation is that the pitch damper is effectively 'speeding up' the aircraft response, an effect which appears to contradict the role of a damper. This faster initial response is of course the result of the larger elevator angle applied by the pilot, the damper then removes excess elevator as the aircraft begins to respond. It is also seen that to produce the improvement demonstrated by this example the pitch autostabilizer requires authority over more control than was used by the pilot to produce the same g without the pitch damper and this poses a severe design condition.
If we look at the initial part of this response which is shown magnified in Fig. 32, we also observe another fringe benefit from this form of control, namely a shortening in the height response lag due to adverse elevator lift by a small amount. The reason for this has been discussed earlier in Section 3.3 and illustrated in Fig. 16.
A further improvement in pitch response is obtained if the pitch rate signal into the autostabilizer is lagged through a first order lag giving an autostabilizer law
0 t/~ = K - -
l+rs
16
This has the effect of delaying the initial opposition of the autostabilizer to the aircraft response and therefore permitting an even more rapid initial response as seen in Fig. 33. The particular attraction of this law is that it produces this improvement without increasing the control authority demanded by the stabilizer. Unfortunately, as shown in Fig. 34 the initial height response is now less favourable than with the simple pitch damper. In fact comparison with Fig. 32 shows that the time lags are practically back to the basic aircraft response and that the amount of adverse response during this initial period is sub- qt:lT1 t ially amplified.
It can be concluded that artificial pitch damping can significantly improve the elevator response of a sluggish aircraft. To produce major improvements, however, the autostabilizer must have authority over a substantial amount of the available elevator power and it is in this requirement that the practical limitations to this method will be found. As one of the main benefits of such a stability augmentation system is to improve control during landing, malfunctioning might have various consequences and therefore systems integrity must be of the highest order. Runaway of a high authority system is clearly unacceptable in this flight condition and loss of stabilization might be equally unacceptable in a case where the basic aircraft has characteristics which make it extremely difficult to perform a safe landing. In view of the potential of this form of stability augmentation the development of reliable hardware is most desirable until more radical design changes become necessary on very large aircraft.
Although some improvements are also possible to the height response-delay due to elevator lift, these are much more limited and are in conflict with the requirements for optimum pitch response.
Apart from the physical limitations mentioned above the effectiveness of pitch autostabilization is somewhat restricted by the fact that the authority of such a system can be readily saturated if the aircraft performs steady pitching manoeuvres as for instance in steady turns and then no further benefit can be derived from the stabilizer and the aircraft response reverts to that of the unstabilized condition. This then demands the introduction of washout, which by itself tends to derate the efficiency of the basic control law. There is another form of control response augmentation, which does not suffer from this disadvantage namely the systems known as manoeuvre boost or manoeuvre demand which will now be briefly discussed.
The aim of what we here call control response augmentation is so to shape control response in relation to simple pilot-demands that the aircraft response is speeded up in a similar manner to that achieved by the pitch damper in Fig. 31. In its simplest form, frequently referred to as manoeuvre boost, the augment- ation system injects into the elevator a signal proportional to rate of stick displacement so that the total elevator angle is related to pilots demand as
t lT= tle+ K flv.
Usually it will be necessary to pass the differentiated signal through a low-pass filter, so that a practical system will have a transfer function
tip - - o tlT= tlv+K l + z s
If K and ~ are identical the second term in this equation can then also be interpreted as washed-out stick displacement.
One of the attractions of the manoeuvre boost law is in the fact that it responds to rate of stick move- ment i.e. to the urgency with which control is demanded. This feature is not provided in the same way by the pitch damper.
The elevator angle generated by such a system is illustrated in Fig. 35 for a range of pilots stick inputs t/v differing in rapidity. It is seen that the elevator applied by the manoeuvre boost system is added to the pilot's demand and does not oppose the final steady response of the aircraft. Otherwise the overall effect is very similar to that produced by the pitch damper (see Fig. 32) namely an effective quickening of the initial elevator application and hence a corresponding quickening of the aircraft's pitch response. In its effect on the initial height response, the manoeuvre boost system is also very similar to that provided by
17
the pitch damper, i.e. a certain degree of improvement. To obtain comparable effects on the aircraft response the requirements for control authority by a
manoeuvre boost system are similar to those made by a pitch damper and the remarks made earlier when discussing stability augmentation apply here equally.
8.2. Novel Forms of Aerodynamic Control. We have seen that the pitch response of a large and inherently sluggish aircraft can be substantially
improved by the application of a stability augmentation or control response augmentation. Small benefits are also possible in relation to the delay of the initial height response caused by adverse elevator lift. It was also indicated that these techniques demand a substantial amount of authority over the available elevator and it is clear that these demands increase, the worse the basic aircraft characteristics are.
Ultimately these requirements will set a limit to the size of aircraft that can be made acceptable by these methods and this is particularly true if the main problem is in initial height response as discussed in Section 7. When this point is reached the designer will have to consider more basic design changes, involving new forms of aerodynamic control which do not suffer from the limitations of the traditional elevator.
The most attractive answers would appear to be direct lift control, i.e. a form of control by which lift can be varied directly in proportion to stick demand without having to wait for aircraft attitude to change and therefore incidence to increase. Direct operation of the flaps or of lift spoilers offer such a possibility.
The effects of direct lift control on aircraft handling are so obvious that they need practically no dis- cussion. Foremost in the present context, normal acceleration is instantaneously controllable by the pilot and aircraft size is no longer relevant. Apart from much faster response there is another control aspect which may well also have great relevance especially with the large aircraft in which the pilot is located a long way from the centre. As manoeuvring no longer requires incidence changes, the pilot's appreciation of height is no longer distorted, as was discussed in Section 4, by false vertical velocity clues and a perhaps significant improvement in control precision may result.
A detailed study is at present being made of the design requirements for a practical direct lift control system and of the performance and control characteristics of aircraft equipped with such a form of longitudinal control. The results of this investigation, to be published shortly show that direct lift control would appear able to overcome all the problems considered in the present study. The designers of large transport aircraft might seriously consider direct lift control not only as a means of improving flare control but also for many other potential benefits.
In a discussion of unconventional forms of longitudinal control one must mention the foreplane. Its principal attraction in the present context is the fact that it generates pitching moments by the application of favourable elevator lift. This will turn the height response delay of the conventional rear control into an advance with obvious benefits, especially to the tail-gust problem discussed in Section 7. Otherwise it does not materially alter the aircraft's pitch-response characteristics which one might again be able to improve by stability augmentation techniques. The foreplane, however, poses serious aerodynamic interference problems, and for these reasons has been unable to make many friends.
8.3. Numerical Examples. Using the same method as we had employed in Section 5 we can now attempt to estimate the improve-
ments in flare performance which might be realized by the application of the above control improvements. We take as our examples the two hypothetical SST design which we had labelled as 'medium SST' and 'large SST'.
To bring it to the level of the current subsonic jets the medium SST appears to require only a modest improvement and we consider therefore the application of control response augmentation only without introducing radically new forms of aerodynamic control. We assume that with the aid of either pitch damping or manoeuvre boost the pitch response of this aircraft can be speeded up to become similar to that of the present jets and that this may allow the pilot to use the same level of normal acceleration in the flare, i.e. 0.10 g instead of 0.075 g as was originally assumed. The corresponding improvement in flare performance is illustrated in Fig. 36a. The improvement in the height for flare initiation is noticeable but
18
not dramatic, the main difference from the corresponding performance of the subsonic jet (Fig. 18) is of course due to the extra height the pilot sits above the wheels, a factor which is not affected by control system refinements. Nevertheless the improvement may be sufficient to make this type of aircraft more acceptable.
Again referring to Figs. 18 and 19, it is apparent that for the aircraft labelled as 'large SST', improve- ments of a more substantial order are demanded, if we are to aim at the performance of the present jets as a target. We consider therefore a more radical change by assuming the application of direct lift control. There is no precedent for such a form of control other than with VSTOL aircraft and an estimate of its effect must to some extent be speculative. We have assumed rather arbitrarily that with direct lift control the pilot might use 0.125 g in the flare instead of the 0.06 g originally assumed. If this is realized then the flare performance of this large aircraft is changed as indicated in Fig. 36b. One major factor in this improvement is the absence of height response delay. The height of the pilot above the ground when he has to initiate the flare is reduced from 125 ft to 75 ft and in spite of the very unfavourable size and high approach speed we had assumed for this aircraft, its flare performance is now fully comparable to that of a con- ventional subsonic jet.
Although this Report limits itself to a discussion of only the final landing flare, it should be noted that any improvements in longitudinal control will equally benefit general approach control and result in greater precision of arrival over the threshold and therefore ease the pilots task in the flare so that the improvement will in fact have a greater effect than is indicated here. The reverse must of course also be true with respect to any deterioration in pitch control.
9. Simulation of Landings. The preceding discussion shows that, although theoretical analysis may be able to delineate certain
problem areas in the control of landings, complete and conclusive results cannot be obtained from such an analysis, as in the end the pilot is the final arbiter. His judgements and actions are clearly able to modify the results of such speculative calculations very significantly. Today problems of this nature are usually referred to simulation so that pilots can take an active part in the study. Here one has to distinguish between two techniques : variable-stability aircraft and ground-based simulators.
To simulate the landing behaviour of an aircraft convincingly, the following features must be faithfully represented: speed, the correct relationship between incidence, lift and drag, ground effect, the pitch response to elevator including the effect of adverse elevator lift and, last but not least, the correct relation- ship between the sensations in the cockpit and the movement of the main wheels. These requirements are outside the scope of the techniques normally used today in variable-stability aircraft. The main hope, therefore lies with ground based simulators. A number of workers are engaged in this field of investigation, but so far only two studies have been reported TM. Ref. 11 gives the results of a series of experiments which repeat those reported in Ref. 8, now considered unrepresentative. However, even the results obtained in the later and more carefully controlled experiments show shortcomings which throw serious doubt on their validity. In Fig. 37 one of the principal results of this experiment, namely the touchdown performance achieved in a large number of simulated landings with a subsonic jet transport are compared with the corresponding data obtained in real service operation of this aircraft. Although the statistical distribution of vertical velocities at touchdown agrees well with corresponding flight data, touchdown distances achieved on the simulator are grossly unrepresentative of the real flight situation. In fact many of these simulator landings would be unacceptable and dangerous in their extravagant waste of runway. The author of Ref. 8 states that pilots taking part in this simulation, in which the DALTO closed circuit television system was used to generate view, found it difficult to judge height and so floated excessively between essential completion of the flare and touchdown. 'The lack of resolution in the visual presentation of the near surface of the runway probably forces the pilot to feel for the runway in the last few feet of descent... '
This phenomenon may in fact reflect a general simulator problem. Not only may lack of ground detail in the visual display play a large part here but also lack of peripheral vision, which present day television techniques do not provide. Further improvements in simulators and especially in view simulation, may provide a solution of this difficulty. Until then, however, the evidence so far suggests caution in the
19
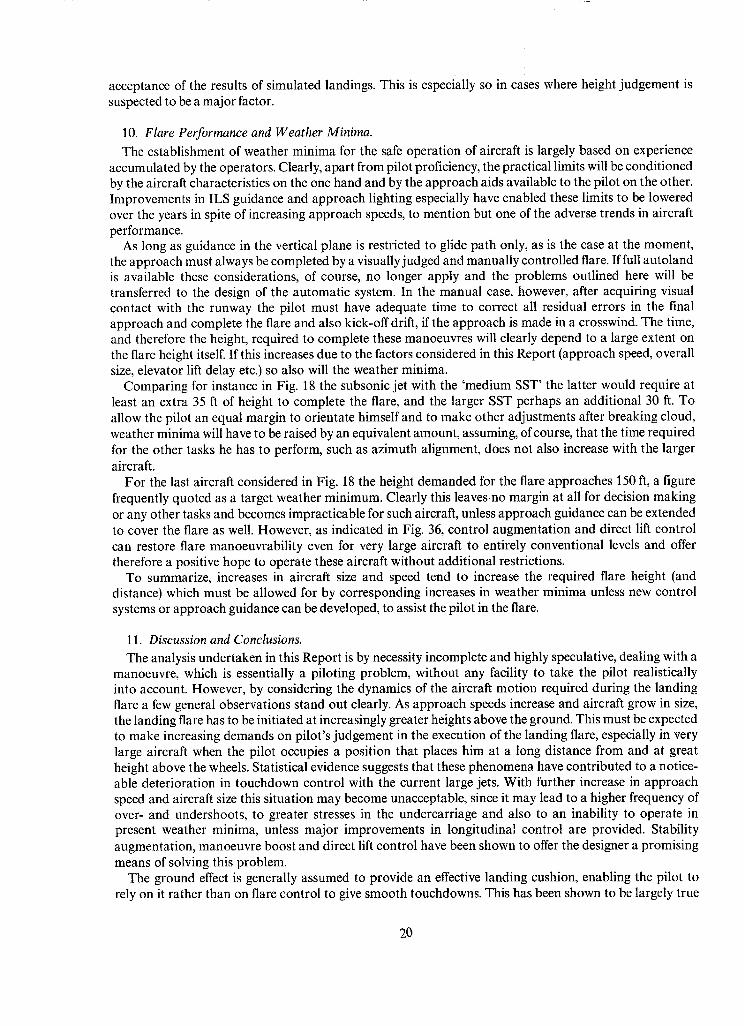
acceptance of the results of simulated landings. This is especially so in cases where height judgement is suspected to be a major factor.
10. Flare Performance and Weather Minima.
The establishment of weather minima for the safe operation of aircraft is largely based on experience accumulated by the operators. Clearly, apart from pilot proficiency, the practical limits will be conditioned by the aircraft characteristics on the one hand and by the approach aids available to the pilot on the other. Improvements in ILS guidance and approach lighting especially have enabled these limits to be lowered over the years in spite of increasing approach speeds, to mention but one of the adverse trends in aircraft performance.
As long as guidance in the vertical plane is restricted to glide path only, as is the case at the moment, the approach must always be completed by a visually judged and manually controlled flare. If full autoland is available these considerations, of course, no longer apply and the problems outlined here will be transferred to the design of the automatic system. In the manual case, however, after acquiring visual contact with the runway the pilot must have adequate time to correct all residual errors in the final approach and complete the flare and also kick-off drift, if the approach is made in a crosswind. The time, and therefore the height, required to complete these manoeuvres will clearly depend to a large extent on the flare height itself. If this increases due to the factors considered in this Report (approach speed, overall size, elevator lift delay etc.) so also will the weather minima.
Comparing for instance in Fig. 18 the subsonic jet with the 'medium SST' the latter would require at least an extra 35 ft of height to complete the flare, and the larger SST perhaps an additional 30 ft. To allow the pilot an equal margin to orientate himself and to make other adjustments after breaking cloud, weather minima will have to be raised by an equivalent amount, assuming, of course, that the time required for the other tasks he has to perform, such as azimuth alignment, does not also increase with the larger aircraft.
For the last aircraft considered in Fig. 18 the height demanded for the flare approaches 150 ft, a figure frequently quoted as a target weather minimum. Clearly this leaves.no margin at all for decision making or any other tasks and becomes impracticable for such aircraft, unless approach guidance can be extended to cover the flare as well. However, as indicated in Fig. 36, control augmentation and direct lift control can restore flare manoeuvrability even for very large aircraft to entirely conventional levels and offer therefore a positive hope to operate these aircraft without additional restrictions.
To summarize, increases in aircraft size and speed tend to increase the required flare height (and distance) which must be allowed for by corresponding increases in weather minima unless new control systems or approach guidance can be developed, to assist the pilot in the flare.
11. Discussion and Conclusions. The analysis undertaken in this Report is by necessity incomplete and highly speculative, dealing with a
manoeuvre, which is essentially a piloting problem, without any facility to take the pilot realistically into account. However, by considering the dynamics of the aircraft motion required during the landing flare a few general observations stand out clearly. As approach speeds increase and aircraft grow in size, the landing flare has to be initiated at increasingly greater heights above the ground. This must be expected to make increasing demands on pilot's judgement in the execution of the landing flare, especially in very large aircraft when the pilot occupies a position that places him at a long distance from and at great height above the wheels. Statistical evidence suggests that these phenomena have contributed to a notice- able deterioration in touchdown control with the current large jets. With further increase in approach speed and aircraft size this situation may become unacceptable, since it may lead to a higher frequency of over- and undershoots, to greater stresses in the undercarriage and also to an inability to operate in present weather minima, unless major improvements in longitudinal control are provided. Stability augmentation, manoeuvre boost and direct lift control have been shown to offer the designer a promising means of solving this problem.
The ground effect is generally assumed to provide an effective landing cushion, enabling the pilot to rely on it rather than on flare control to give smooth touchdowns. This has been shown to be largely true
20
for the conventional transport aircraft. However, when the ground effect becomes more powerful, as with slender wing aircraft, its effect on the landing is very sensitive even to small variations in the final approach condition of the aircraft and its benefit to the pilot becomes less certain. It is considered possible that such a behaviour may in fact force the pilot to adopt an even more cautious flare manoeuvre and generally increase the difficulties of precisely placing the touchdown.
Tail gusts encountered when an aircraft is in the range of heights between 80 to 30 ft from the ground are shown to be a potential hazard and the danger of the pilot being unable to effect timely recovery increases with the amount of adverse elevator lift. The phenomenon needs careful consideration especially with slender designs. Autothrottle will be beneficial in improving aircraft recovery from such upsets and it is suggested therefore, that the possibility of leaving it engaged up to the instant of touchdown should be seriously considered. The most effective solution to this problem appears, however, to be direct lift control. Operation of flaps or lift spoilers in response to stick application is an abvious mechanism to realise direct lift control and blown lift control is another promising possibility.
As the difficulties emerging from this study are concerned mainly with pilots' judgement and control, their solution may also be expedited by the development of piloting aids and in particular automatic flare control.
21
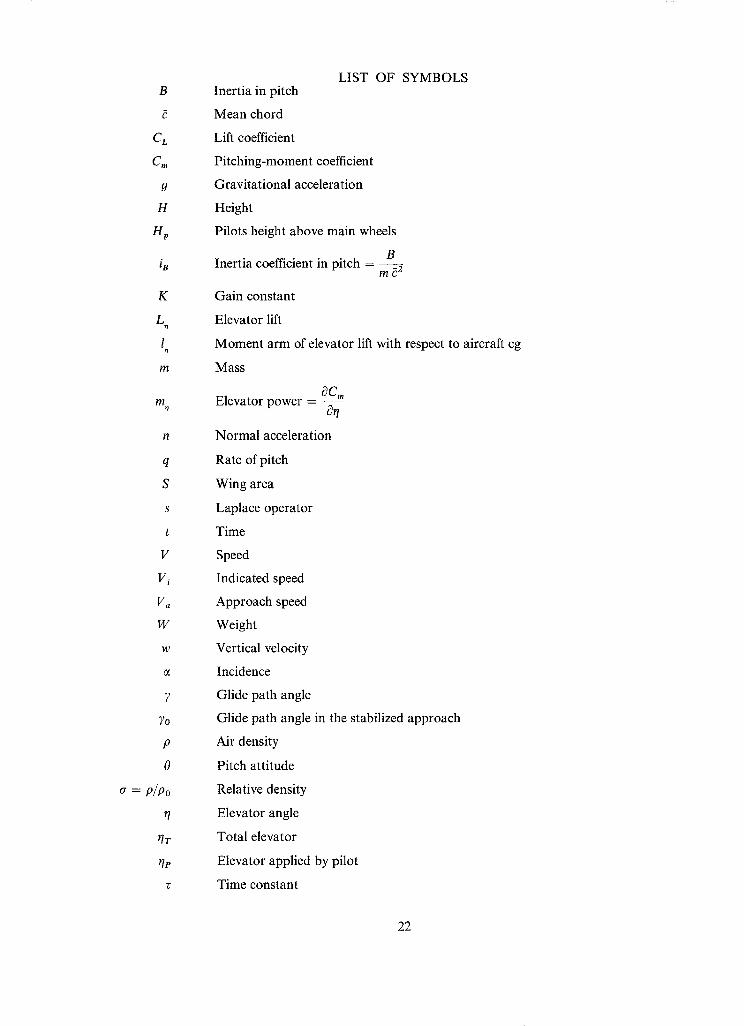
B
CL
C,.
g
H
Hp
in
K
L
l
m
m
n
q
S
S
t
V
Vi
V~
W
W
O~
7
7o
P
0
a = P/Po
r~
r/r
r/e
LIST OF SYMBOLS Inertia in pitch
Mean chord
Lift coefficient
Pitching-moment coefficient
Gravitational acceleration
Height
Pilots height above main wheels
B Inertia coefficient in pitch - g2
m
Gain constant
Elevator lift
Moment arm of elevator lift with respect to aircraft cg
Mass
0C,. Elevator power - 0r/
Normal acceleration
Rate of pitch
Wing area
Laplace operator
Time
Speed
Indicated speed
Approach speed
Weight
Vertical velocity
Incidence
Glide path angle
Glide path angle in the stabilized approach
Air density
Pitch attitude
Relative density
Elevator angle
Total elevator
Elevator applied by pilot
Time constant
22
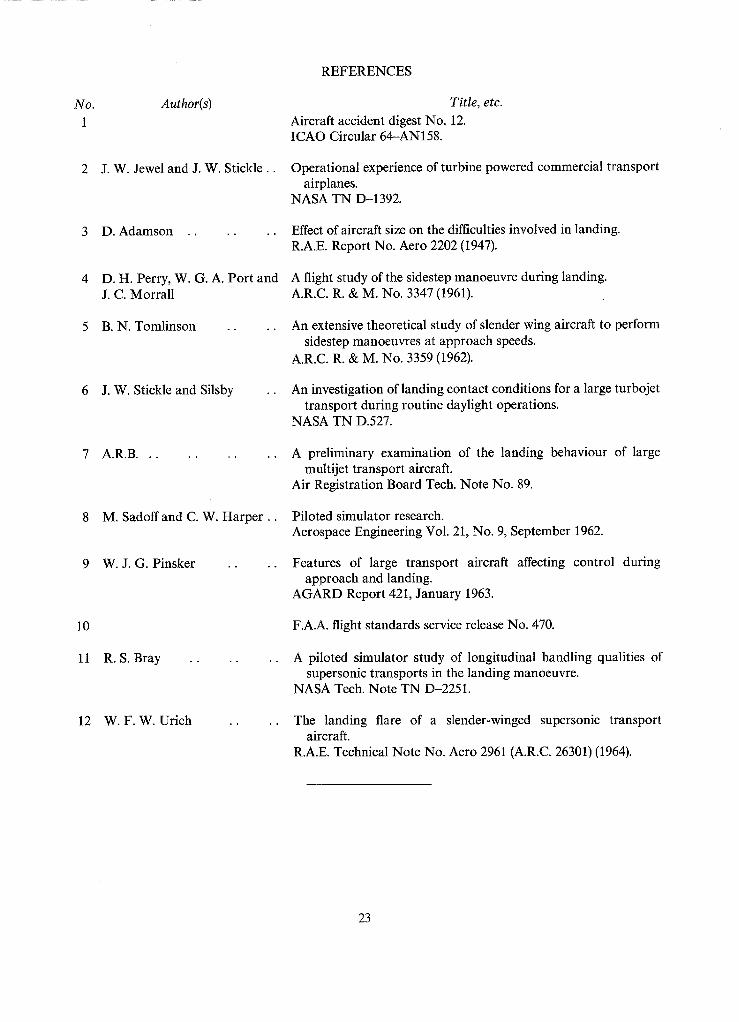
No. Author(s)
1
2 J.W. Jewel and J. W. Stickle..
10
11
3 D. Adamson . . . . . .
D. H. Perry, W. G. A. Port and J. C. Morrall
5 B.N. Tomlinson . . . .
6 J.W. Stickle and Silsby ..
7 A.R.B . . . . . . . . .
8 M. Sadoff and C. W. Harper ..
9 W.J .G. Pinsker . . . .
R. S. Bray . . . . . .
12 W.F.W. Urich . . . .
REFERENCES
Title, etc.
Aircraft accident digest No. 12. ICAO Circular 64-AN158.
Operational experience of turbine powered commercial transport airplanes.
NASA TN D-1392.
Effect of aircraft size on the difficulties involved in landing. R.A.E. Report No. Aero 2202 (1947).
A flight study of the sidestep manoeuvre during landing. A.R.C.R. & M. No. 3347 (1961).
An extensive theoretical study of slender wing aircraft to perform sidestep manoeuvres at approach speeds.
A.R.C.R. & M. No. 3359 (1962).
An investigation of landing contact conditions for a large turbojet transport during routine daylight operations.
NASA TN D.527.
A preliminary examination of the landing behaviour of large multijet transport aircraft.
Air Registration Board Tech. Note No. 89.
Piloted simulator research. Aerospace Engineering Vol. 21, No. 9, September 1962.
Features of large transport aircraft approach and landing.
AGARD Report 421, January 1963.
affecting control during
F.A.A. flight standards service release No. 470.
A piloted simulator study of longitudinal handling qualities of supersonic transports in the landing manoeuvre.
NASA Tech. Note TN D-2251.
The landing flare of a slender-winged supersonic transport aircraft.
R.A.E. Technical Note No. Aero 2961 (A.R.C. 26301) (1964).
23
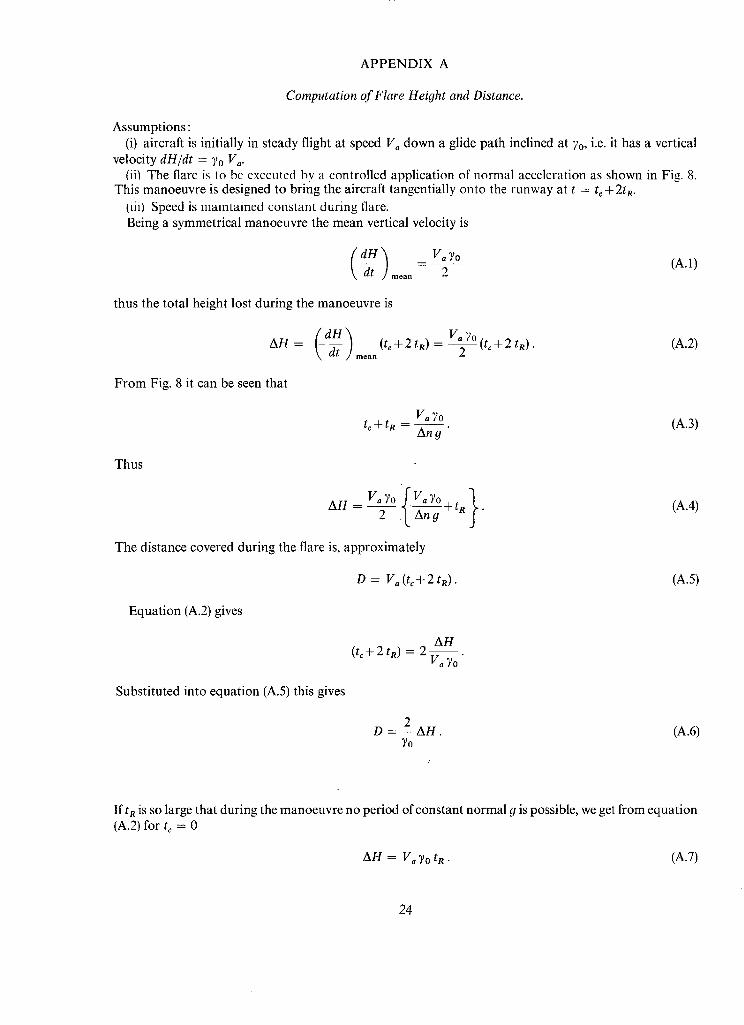
APPENDIX A
Computation of Flare Height and Distance.
Assumptions: (i) aircraft is initially in steady flight at speed V~ down a glide path inclined at 7o, i.e. it has a vertical
velocity dH/dt = 7o V~. (ii) The flare is to be executed bv a controlled application of normal acceleration as shown in Fig. 8.
This manoeuvre is designed to bring the aircraft tangentially onto the runway at t = t~+2tR. (iii) Speed is maintained constant during flare. Being a symmetrical manoeuvre the mean vertical velocity is
dH ) _ Va To (A.1) ~- . . . . 2
thus the total height lost during the manoeuvre is
From Fig. 8 it can be seen that
V~7o t ~ + t R - Ang
Thus
AH - V"7° ~ V , 7o "] 2 ~l A---~9 + t" j ~"
The distance covered during the flare is, approximately
Equation (A.2) gives
Substituted into equation (A.5) this gives
(A.2)
(A.3)
(A.4)
D = V, (t~ + 2 tR). (A.5)
AH (to + 2 tR) = 2 V~ 70
2 D = - - AH. (A.6)
70
If t R is so large that during the manoeuvre no period of constant normal g is possible, we get from equation (A.2) for t c = 0
AH = V, 7o tR. (A.7)
24
The boundary between these two cases is defined when equations (A.4) and (A.7) give an identical result:
Va~'o f Va~ 0 ']
From this equality one obtains
Anma x = Va ~_._....~o (A.8) tR g
o r
V. Yo (A.9) ~ R m a x - - An g
the maximum value of tR with which it is just possible to obtain the specified peak value of Anma x.
Va ~0 Anmax must be reduced to the value given by equation (A.8). This condition is - - - - 7 If tR > tRm~-- An g
important as tg itself, as shown in Appendix B, is a function of Anmax-
25
A P P E N D I X B
Determination of Pitch Response Lao tR.
If the flare manoeuvre An(t) is prescribed, we get
V. ~ = An(t) O
and
d An(t) g ~= dt V.
since
An(t) = - - AL ~ V. S Aa
W W
An(t) W/S A 0 t - - -
dCL/g~ p 2 ~ V . S
d 2 An(t) W/S
dt 2 p V2 dCL"
From the kinematic relationship
0 = y + ~ = - - dn(t) 0 d2n(t) W/S
dt V. ~ dt ~ OCL p 2 aa 2 V.
Let us define the flare manoeuvre by
(B.1)
(B.2)
(B.3)
(B.4)
(B.5)
(B.6)
For 0 < t < t R
=_.An.~,x ( 1-cos x t ~ for An(t) 2 \ tRJ
An(t) = Anm~x for
Anm.x [ t --- tc 'X
O < t < t R
tR < t < (tR + to)
(tR + to) < t < (to + 2 tR).
A n
A/I
dt Anmax2 Lsin(zct~) tR (B.7)
26
Substiution into equation (B.6) gives
0=Anmax zc O 2 t R V a
dt - - - f - = 2 \ tR cos ~
t ) + w/s sin 7~
-~ ~CL p Va O Oe 2
tR \ tR It
This function has a maximum at
OCz P Va g t R de 2
t a n ( r c t ~ ) = W / S ~
(B.8)
(B.9)
or
2 t R V a OC L p Vag t R
Oa 2
(B.IO)
As a crude simplification one can assume that the aircraft has a negligible manoeuvre margin, or more precisely m o =mw = 0, so that all the elevator power is available for pitch acceleration, so that
m p 2 (B.11)
This is an optimistic assumption, but permissible as the present analysis attempts only to establish a limiting flare condition, which the pilot is not expected to achieve. Under this assumption the answer obtained for ta + tc < t < t c + 2 t R is identical to that for 0 < t < tR, and that for t R < t < tR + tc will be zero. Thus the limiting condition for t~ is then given uniquely by equation (B.10) which can be solved for t n :
ti=2 ~'aXv. Omax}--~[4 \ 2 ga0ma x -I- 2max V;-0~ax ~OCLPgag I c~e 2
This expression has been computed and presented as a diagram in Fig. 12. If the pitch response is so sluggish that the originally specified value of Anmax cannot be obtained, i.e. if
according to equation (A.8)
Va ~0 - - < An . . . . . . d (B.13) tR g
then Anma x c a n no longer be specified independently, as it becomes a function of tR itself; at the same time t R, as defined by equation (B. 12) is a function of Anmax. To resolve this inter-relationship
27
Va 7o A n 1 = - -
tR g
when substituted into equation (B.10) gives a new expression
? o - 2 t 2 1 \aCL p . t~
for which t R can be determined. Equation (B.14) has been plotted as a diagram in Fig. 13.
(B.14)
28
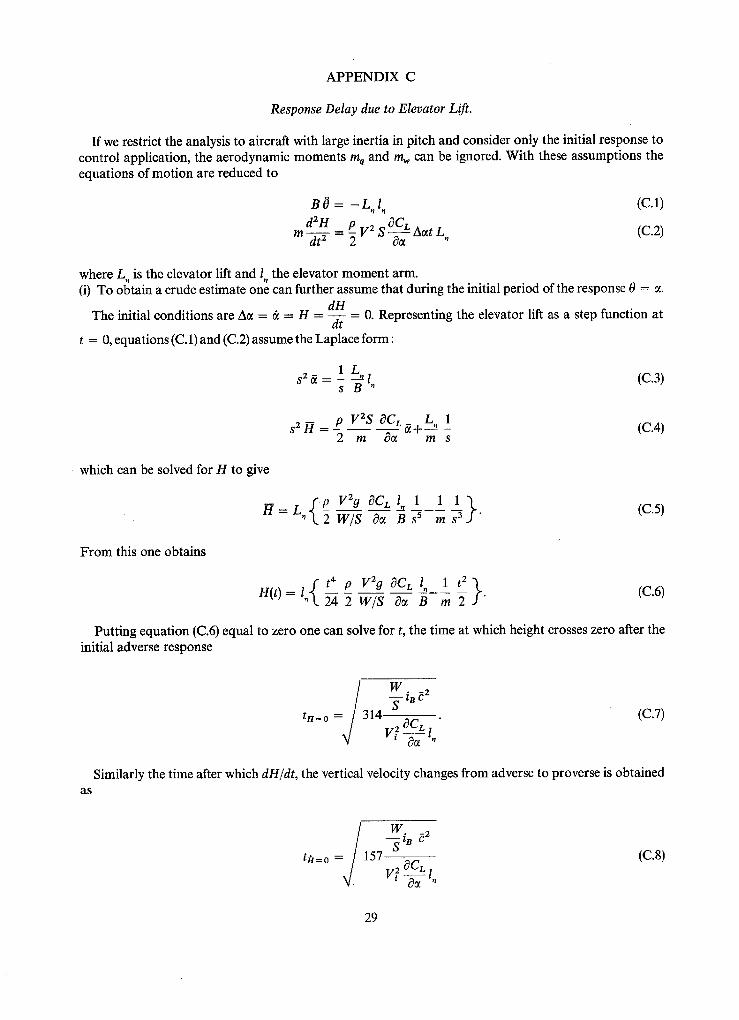
APPENDIX C
Response Delay due to Elevator Lift.
If we restrict the analysis to aircraft with large inertia in pitch and consider only the initial response to control application, the aerodynamic moments mq and rn~ can be ignored. With these assumptions the equations of motion are reduced to
B 0 = - L 1 d2H P S ~ A~t L V 2 m-yir=
(C.1)
(C.2)
where L is the elevator lift and I the elevator moment arm. (i) To ol~tain a crude estimate one can further assume that during the initial period of the response 0 = ~.
dH The initial conditions are A~ = ~ = H = d--t- = 0. Representing the elevator lift as a step function at
t = 0, equations (C.1) and (C.2) assume the Laplace form:
1 L s a = -s -ff l (c.3)
S2 ~ ~--- p V2S OC L ~-~-L I 2 m - ~ m s
(C.4)
which can be solved for H to give
_ ( p V20 O C L I 1 1 1 ) (C.5) H = L W/S O~ B s s m s a "
From this one obtains
t p V29 OC L 1 1 t 2 ) -" (C.6) H ( t ) = l 24 2 W/S a~ B m 2 "
Putting equation (C.6) equal to zero one can solve for t, the time at which height crosses zero after the initial adverse response
W 2 _ _ i B
(C.7)
Similarly the time after which dH/dt, the vertical velocity changes from adverse to proverse is obtained a s
W 2 - iB t/~=o = / 1 5 7 - - - -
2 ~CL (c.8)
29
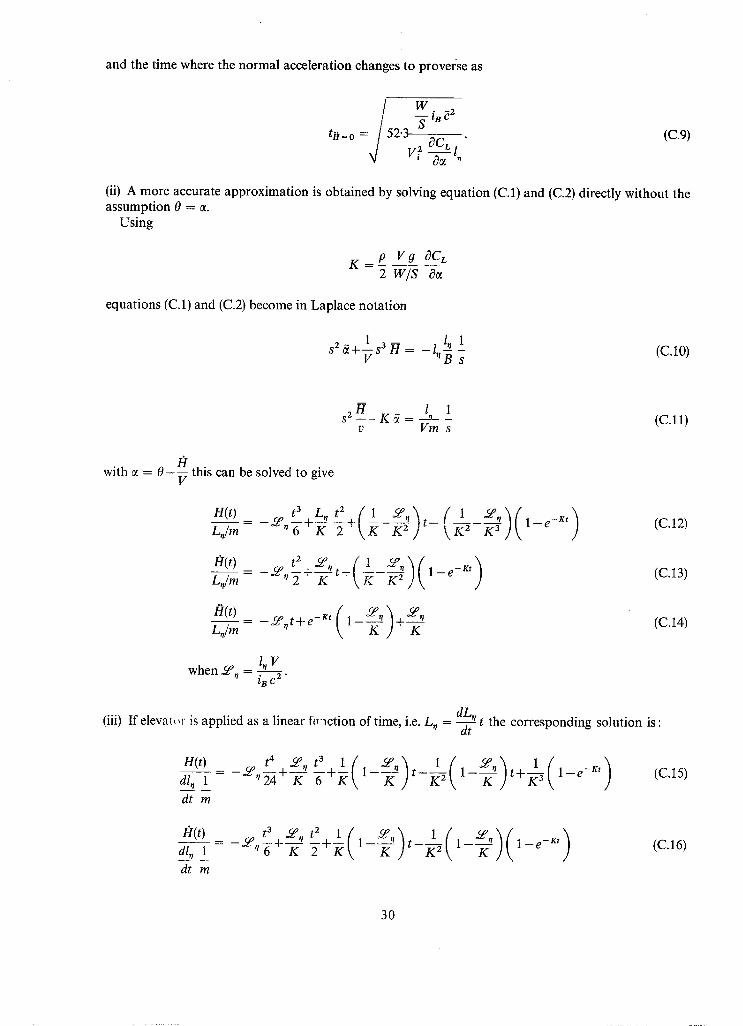
and the time where the normal acceleration changes to proverse as
W 2 __ iv6
t~= o = /52"3 S-O---C--~, - (C.9)
(ii) A more accurate approximation is obtained by solving equation (C.1) and (C.2) directly without the assumption 0 = ~.
Using
K = p Vg OC z 2 W/S O~
equations (C.1) and (C.2) become in Laplace notation
s2 8+lsa H = - l ~ 1 nBs (C.IO)
m
s2__H K ~ - 1 1 (C.ll) v Vm s
/:/ with ~ = 0 - ~ this can be solved to give
LjmH(t)- ~"-(+-K ~ + ( K ta L, 1 ) t _ ( 1 2 K ~ ) ( I _ e _ K , ) (C.12)
I:t(t) _ t2 -k- t ( 1 ~'~ L./m SYq -~ K
L . /m- £f.t+e -Kt 1- q K
when £ f . - lq V i B c 2 "
dZ_~_n t (iii) If elevat<w is applied as a linear fonction of time, i.e. Ln = dt the corresponding solution is:
dl, 1 dt m
t 4 ~z~ n t 3 1 [" 1 ~ . "~ 1 [' H(t) _ ~ _ ~ + _ _ ~ + _ ~ l _ _ ~ ) t _ _ ~ _ ~ ( l _ _ ~ ) t + _ ~ l _ e _ ~ t )
I:I(t) dl. 1 dt m
_ cp t3 ~ n t2 l ~-+~[1~ £ a \ 1 / £e. - - - ~ ) t - - K S ~ i - - - - ~ ) ( 1 - e -r' ) q g"t--~- i
(C.15)
(C.16)
30
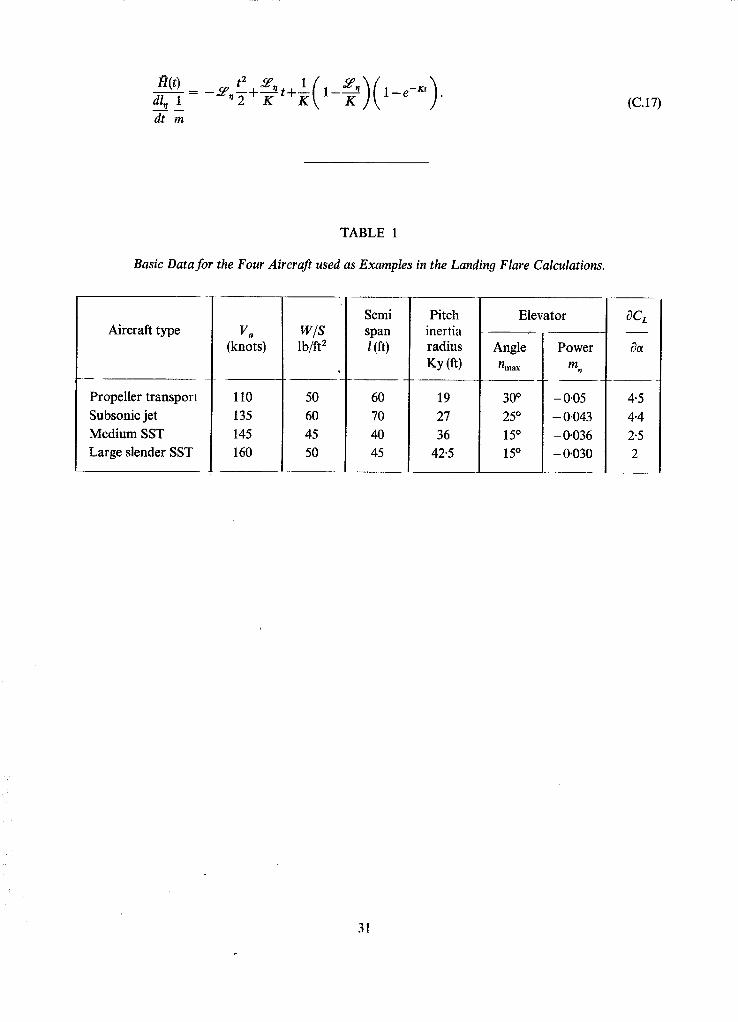
(C.17)
Aircraft type
TABLE 1
Basic Data for the Four Aircraft used as Examples in the Landin9 Flare Calculations.
Va (knots)
Propeller transport
Subsonic jet
Medium SST
Large slender SST
w/s Ib/ff 2
110
135
145
160
Semi span lift)
50
60
45
50
Pitch inertia radius
Ky fit)
60
70
40
45
Elevator
19
27
36
42.5
~C~
&x Angle Power nmax m
30 ° -- 0"05
25 ° - 0"043
15 ° -0"036
15 ° - 0"030
4.5
4.4
2.5
2
/~(t) t 2 ~-CPn 1 /' .og?,a d-~ ~ = - - o q ' , - ~ + - - ~ - t + - ~ l - - - ~ - ) ( 1 - e - X t ) •
d t m
31
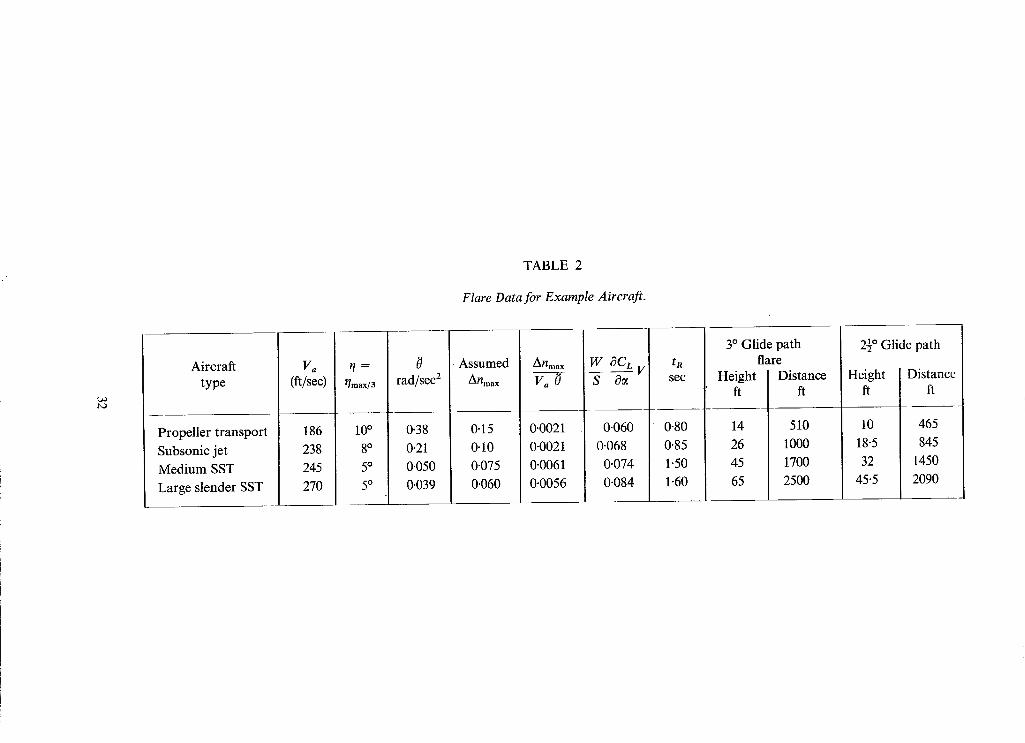
TABLE 2
Flare Data for Example Aircraft.
Aircraft type
V. q = 0 (ft/sec) t]max/3 rad/sec 2
Propeller transport
Subsonic jet Medium SST
Large slender SST
186
238 245
270
10 ° 0"38 8 ° 0"21
5 ° 0"050
5 ° 0"039
Assumed Anmax
0.15 0-10
0.075
0-060
Annlax V. 0
0.0021
0-0021
0.0061
0.0056
W OC L V ta -S- O~ s e c
0-060 0-80
0-068 0.85 0.074 [ 1-50
0-084~ 1-60
3 ° Glide path flare
Height Distance
14 510 26 1000
45 1700
65 2500
2½ ° Glide path
Height Distance
10 465
18"5 845 32 1450
45"5 2090
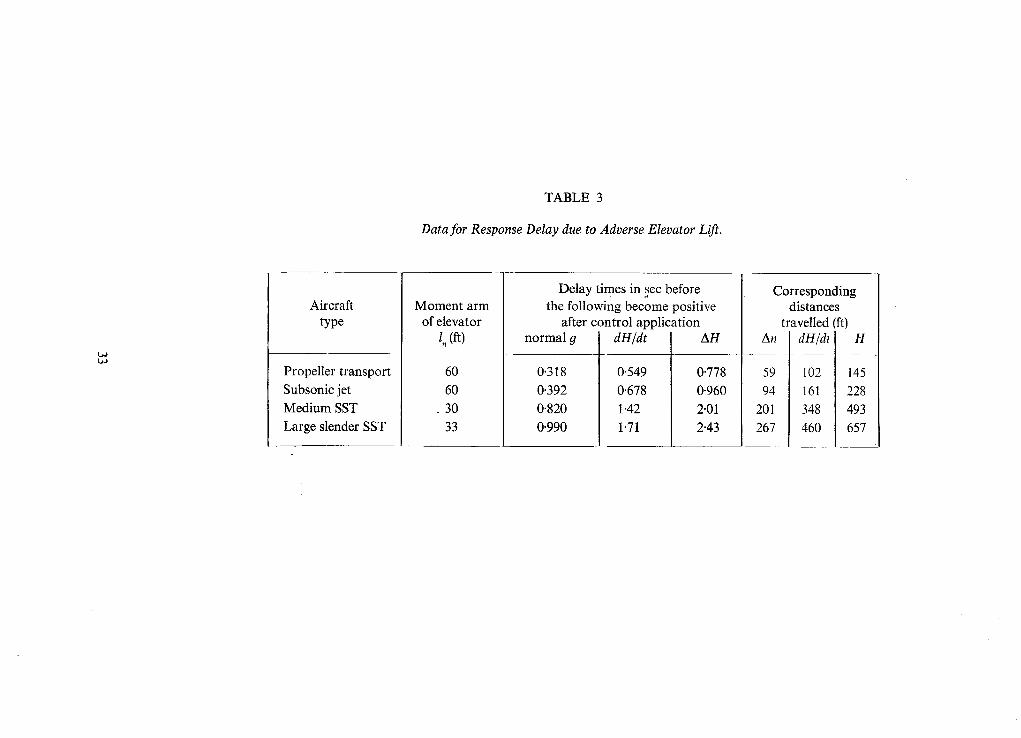
TABLE 3
Data for Response Delay due to Adverse Elevator Lift.
Aircraft type
Propeller transport
Subsonic jet
Medium SST
Large slender SST
Moment arm of elevator
l (ft) normal g dH/dt
0.318 0.549
0-392 0.678
0"820 1.42 0-990 1.71
60
60 . 30
33
Delay times in sec before the following become positive
after control application AH
0-778
0-960
2.01 2-43
Corresponding distances
travelled fit) An dH/dt H
59 102 145 94 161 228
201 348 493 267 460 657
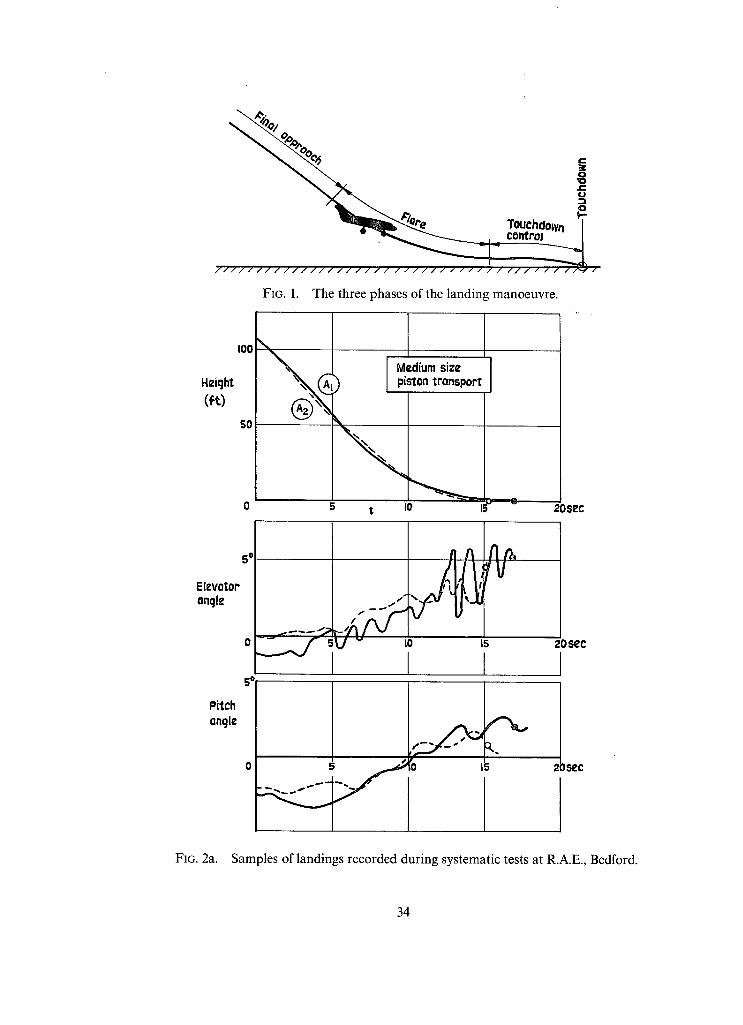
I "E3
Touchdown I
I I I I I I I I I I I I I I I I I I I I I I I I I I I I I I I I I I 1 1 I I t ~ 1
FIG. 1. The three phases of the landing manoeuvre.
HeiRht
I00
50
~ Q Medium size l piston Ironsport
®,,,,
5 i I0 ~ - - - 20see
5 @
El~'VOlOr anqle
0
S I
Pitch anqle
~ n n ~ tr lilU
_ & i ~ / , " ... -- .go" , ~
,, , . 2 - f ' V ~ ~-~/ v L# io is
15
,Dsec
)SeC
FIG. 2a. Samples of landings recorded during systematic tests at R.A.E., Bedford.
34
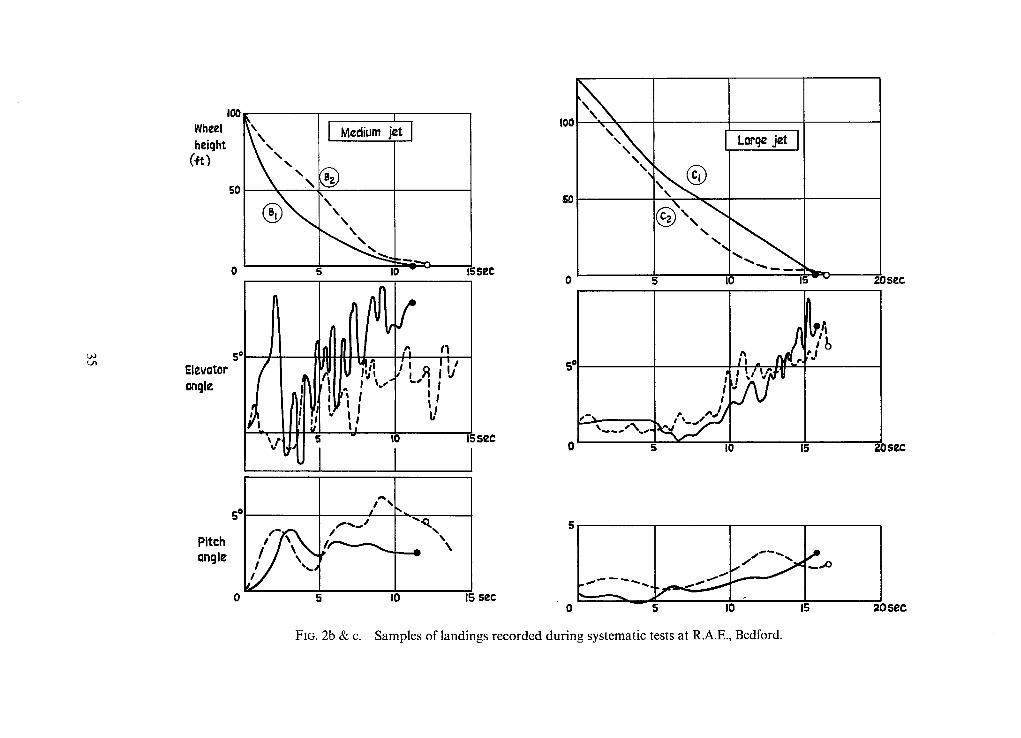
IOO Wheel heiqht
(ft~
sO
5 °
Elevotor onQle
% \
\
Medium jet--]
I0
n
vu,U
°n,(
5
f
e l
• L. I I
I i
IO
tl I I
15$ec
I$SeC
I00
SO
5 c
",,X, L~qe jet I
I0
I I ! 5 q J
20see
io 15 zosP.c
Pitch angle
S o
/ ~ %
!
5
\
I0 15 sec 0 5 I0 15 205eC
FIG. 2b & c. Samples of landings recorded during systematic tests at R.A.E., Bedford.
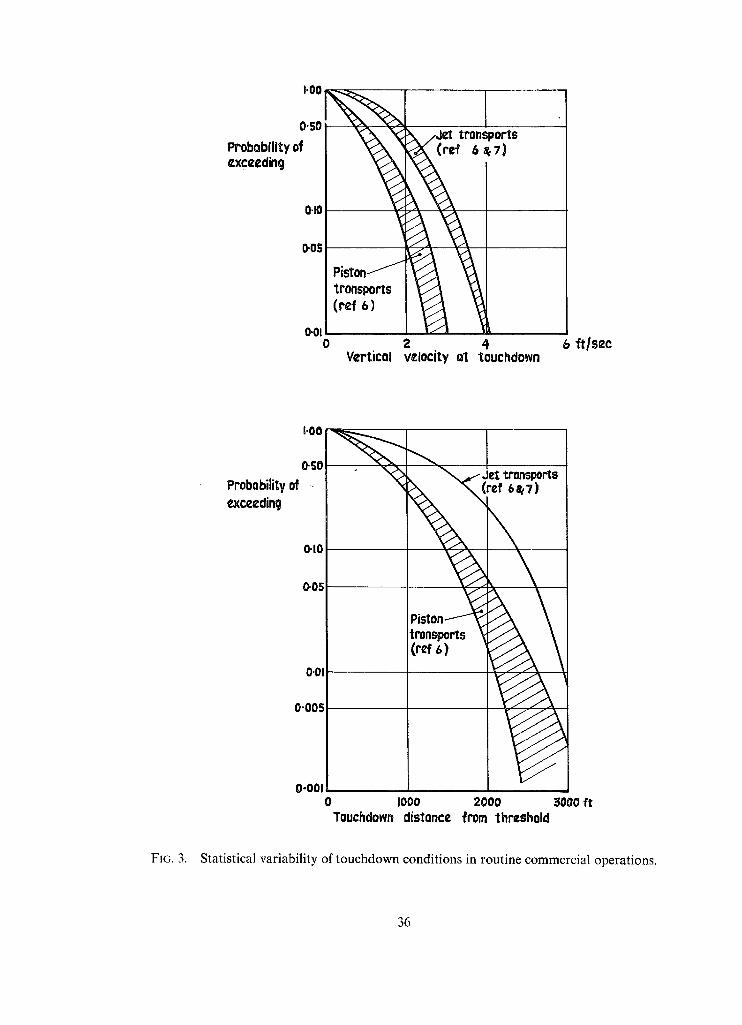
1.00
0.50
Probability of ¢xc=¢dinq
0"10
O'OS
o.01 0
i ~ ,Jet transports
P i s t ° n ~ I transports (ref 6)
2 4 Vertical vzio¢ity o1 touchdown
6 ftlsec
1.00
O.SO Probability of -
exceedinl
0"10
~05
0"01
0.005
"••• ~- Jet transports rcf 6,~7)
P i s t o n ~ t r.nspo~s ~ / A \ (r,f 6) ~ \
0-001 0 Iooo 2000 3000 ft Touchdown distance from threshold
FIG. 3. Statistical variability of touchdown conditions in routine commercial operations.
36
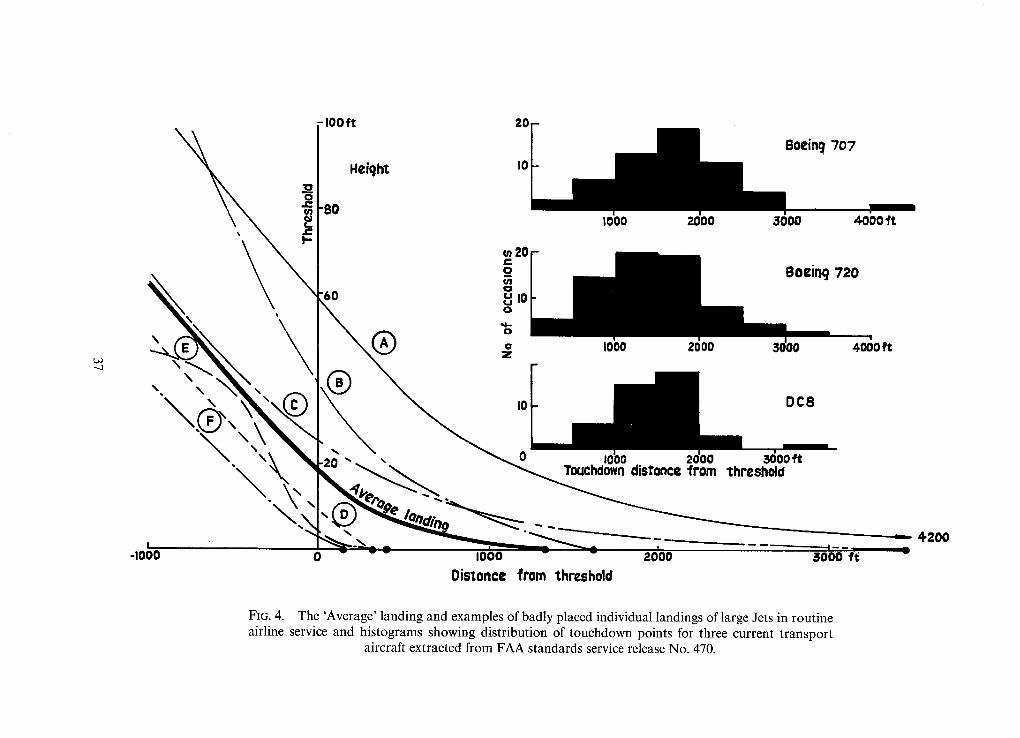
\
\
I -I000
\
\
-lOOft
Height
-80
'60
0
I0
20
o io
J
Boein9 ";07
1000 2000 3000 4000 ~'t
I0
Touchdown distance Irom
I000 2000
Distonce from threshold
off;
~hreshold
3000 f (
~--- 4200
FIG. 4. The 'Average' landing and examples of badly placed individual landings of large Jets in routine airline service and histograms showing distribution of touchdown points for three current transport
aircraft extracted from FAA standards service release No. 470.
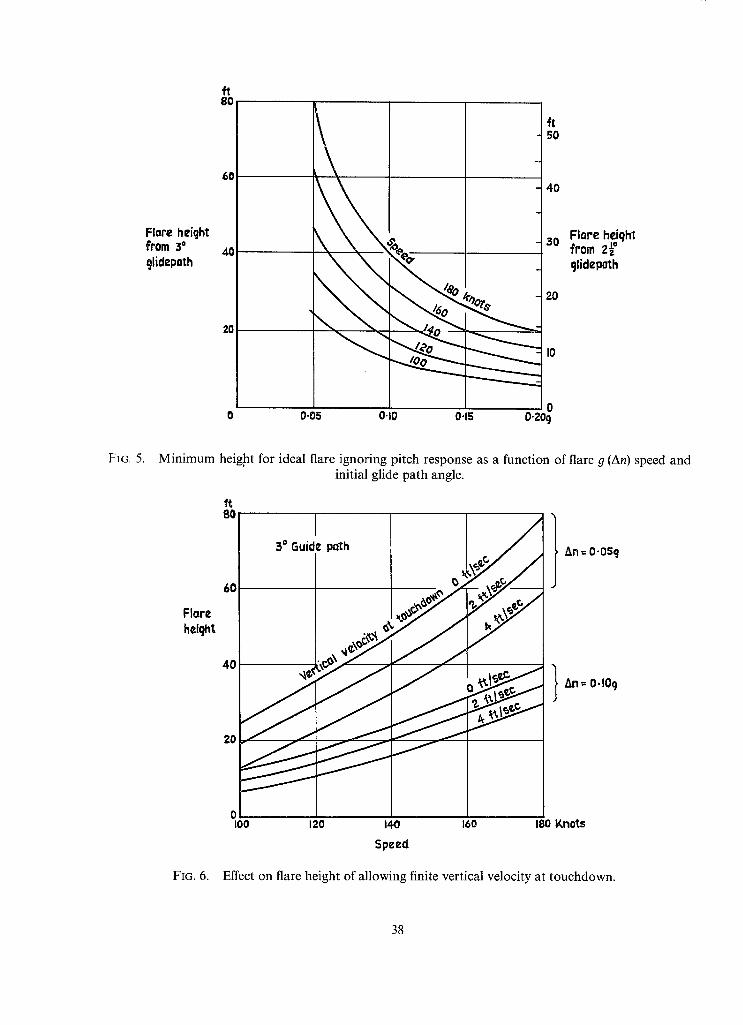
Flare h eicjht from 3 ° glidepath
ft 80
60
40
20
\ :
ft 50
4O
Flare heiqht sO from 2-" °
tlidepoth
20
10
0 0 0-05 O'lO 0"15 0"20cj
Fic. 5. Minimum height for ideal flare ignoring pitch response as a function of flare g (An) speed and initial glide path angle.
Flare heiqht
ft 8O
60
40
20
3 ° Guide path /
/ _ / / / J
o 100 120 140 160 180 Knots
l &n = O.OSq
l &n= 0.10 9
Speed
FIG. 6. Effect on flare height of allowing finite vertical velocity at touchdown.
38
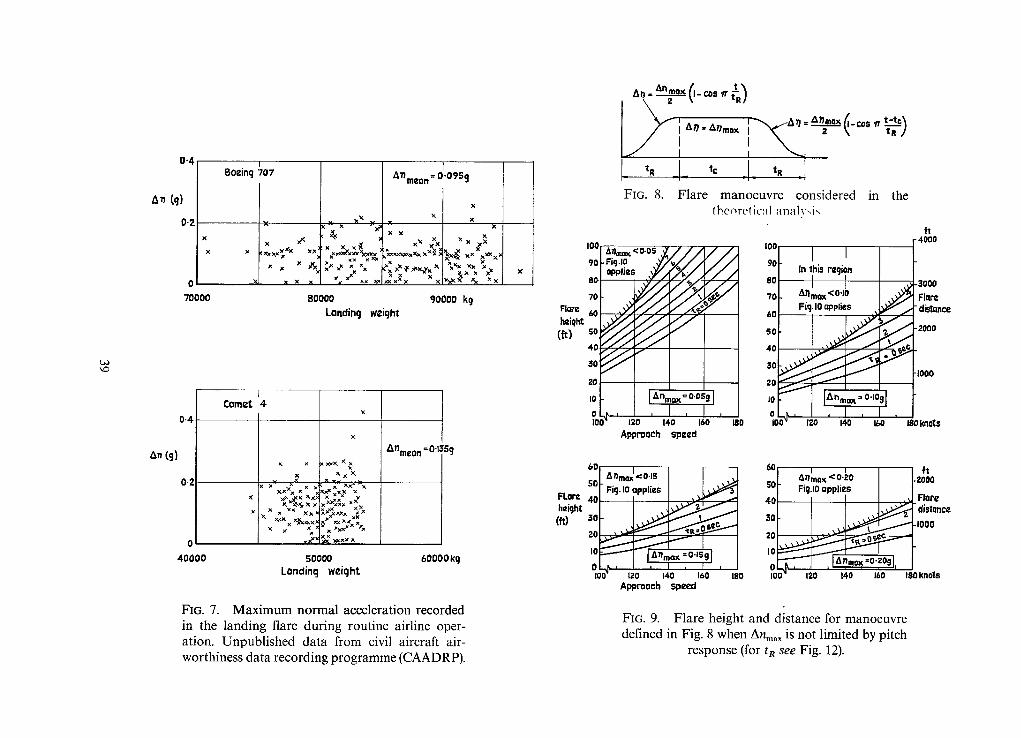
0.4
~,, Cg)
0.2
x
x
0
70000
I
Boeincj 707
x
x x~ x~)
x x x x
x x x x
x X ~X
:x x x,~ , xx x)eX
x x x xx >~
$0000
{
A'nmeon = O.09Sg
x
.< x x
x x
XxXaO~x~x t : , I x ~ Xx ~ x '
~x~Cx x x x~cx N x x
90000 k 9 Landing weight
0.4.
a,, (91
0-2
I C o m e t 4.
x
x
XX x x x
x xxx x x~x~xx x XxX
x~ x xx~ "x
,cxx" xx X x x x x ~,~
~nmeon = O-I s9
0
40000 5oooo 600ookq Lan~incj weiqht
FIG. 7. Maximum normal acceleration recorded in the landing flare during routine airline oper- ation. Unpublished data from civil aircraft air- worthiness data recording programme (CAADRP).
I00
90
8C
70
Flare 60 hNqh~
(fO so 4O
30
ZO
I0
0 |01
60
50
FLor¢ 40 height
(fO 30 20
I0
O I00
~ l A n ' A n m o x I ~*" - s ~ t - t c ~
w ]
FIG. 8. Flare manoeuvre considered in the theoretical anah,i~
Aamox<o.o5 ~Y / / •
opp,,es . ~ / r ' ~ /
I Anrnax = 0"059 I
k , I r 120 140 160
Approoch sp~,ed
? Y
'°°l I I 901 In "th;s recjion
.o/ I I .oL , . j . _ / Fig-IO applies . ~ " J
,0/
, 0 ~ J ! - - i i ,0 V " 0 L k ,
f t -4000
-3000
Flare - d~Qnce
-2000
000
180 I00 IZO 140 160 180 knots
601 I i A nmoxl¢ o-IS | At /max < 0-z0 Fi 9. I0 appl ies ~ 50 r FiQ.IO appl ies
I ~ , J -~ - " Anmox =0-z0~l _pL ~ I [ UI..I~ I I ' , L , rl
120 140 lfiO IBO I00 Approach speed
~tt .2000
Flnre "distnnce
-1000
120 140 16D 180 Rnots
FIG. 9. Flare height and distance for manoeuvre defined in Fig. 8 when Anm~x is not limited by pitch
response (for t R s e e Fig. 12).
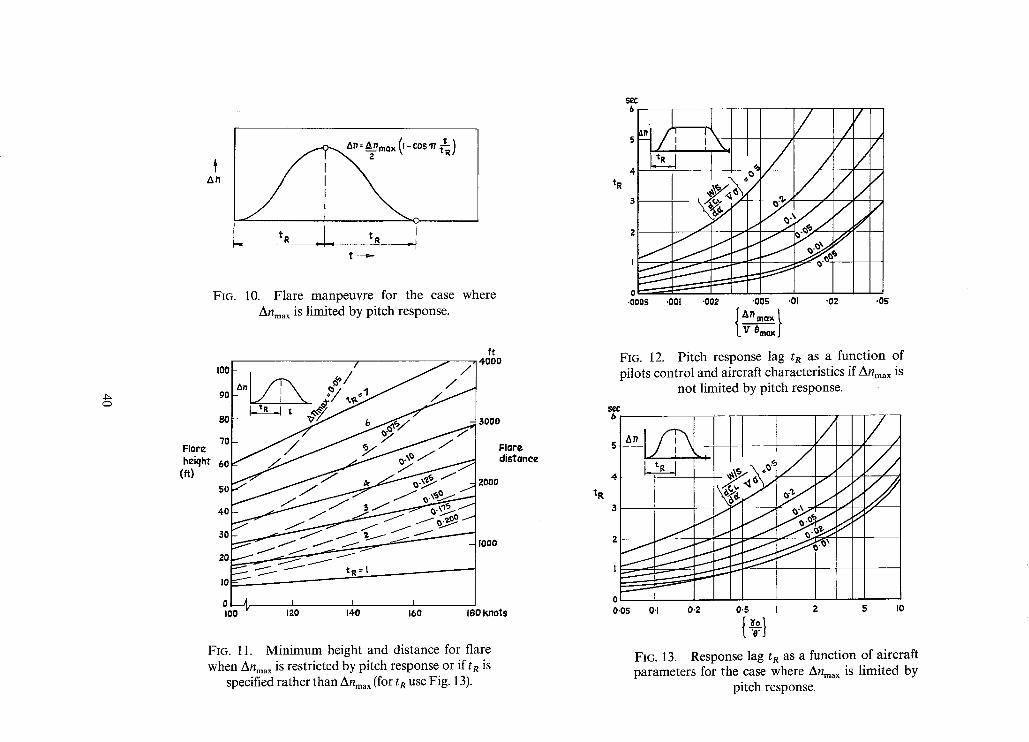
~ n
t R t R =
t - - - ~
FIG. 10. Flare manpeuvre for the case where Anma x is limited by pitch response.
I00
90
8O
"7O Flare
heiqht 60 (ft)
50
40
~°
20 1
I0 ~._
o - 4 I00
ft / / / 4000
No ! \ ~ ' / , . 2 " /0¢ / l R I t , ~ 7 / /
~ 1000
/ i I J 120 140 160 I00 Knots
FIG. 11. Minimum height and distance for flare when Anma x is restricted by pitch response or if tR is
specified rather than Anma x ( for t R use Fig. 13).
t R
sl~c
• 0005 .001 "002 "00~; '01 "02
An mo~ [ .0r
FIG. 12. Pitch response lag t R a s a function of pilots control and aircraft characteristics if An . . . . is
not limited by pitch response.
$e¢
O ~ 0"05 0-1 0"2 O'S I 2 5 I0
FIo. 13. Response lag tR as a function of aircraft parameters for the case where Anm.x is limited by
pitch response.
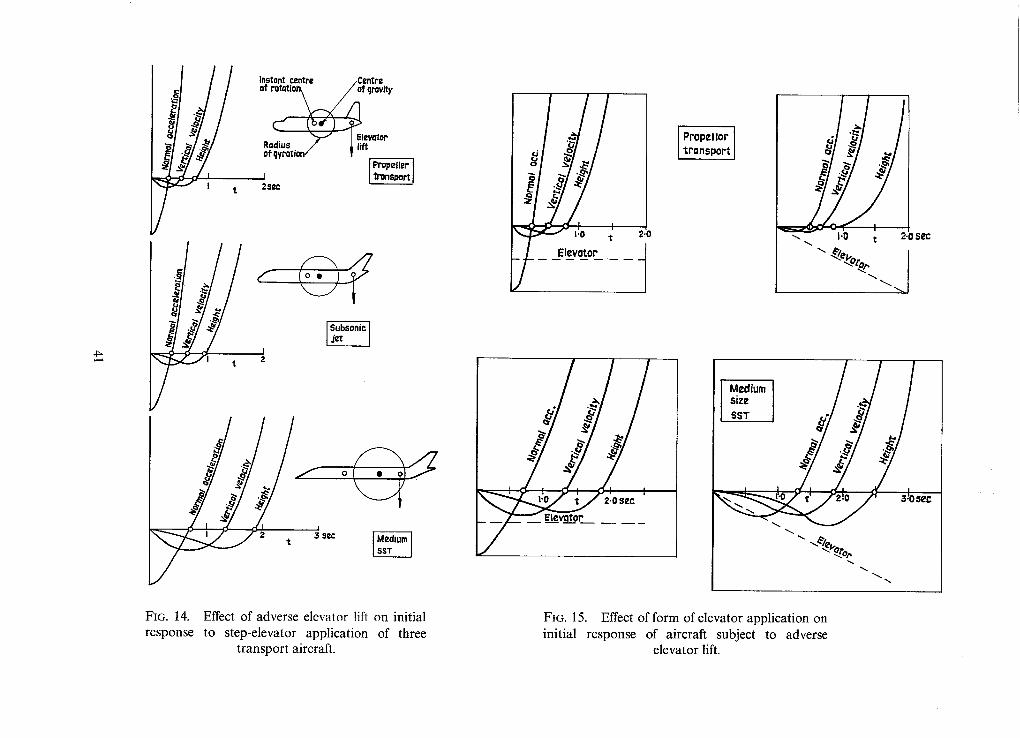
I~// In.on! centre /Centre = of rot~ion~ /~ qr~ity
~l.g++/ "o+"o ~ + ,~ ' ° ' ' ~ I°f qyPotion / f
t 2s¢c
5/ ~/
i 2 t 3 sec
i~sT i
~, !o ' 50
_ Elevator 1
EleVClt0r'
I Propellor ] tronsport
+/.+/ / +i/ .// +g
--~ 1.0 ~ 2.0 SeC
Medium size 5 S T *
' 3:0~eC
FIG. 14. Effect of adverse elevator lift on initial response to step-elevator application of three
transport aircraft.
FIG. 15. Effect of form of elevator application on initial response of aircraft subject to adverse
elevator lift.
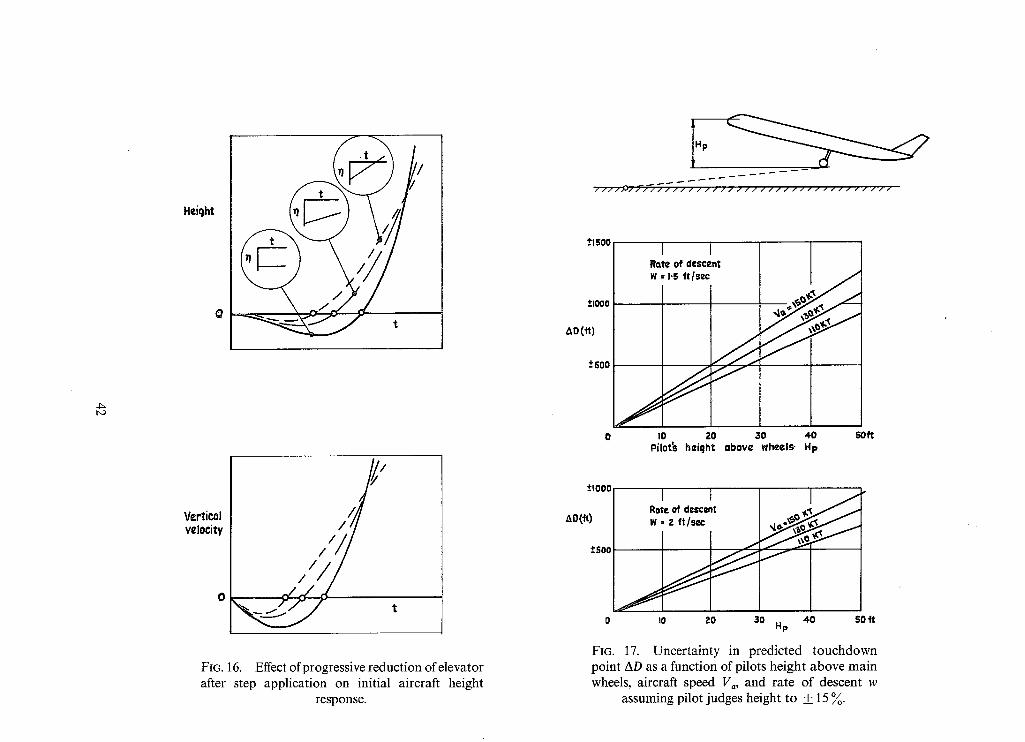
t~
Heiqht
0
Verticol wloe i ty
0
/
/ / / ,,//
, / / /
FIG. 16. Effect of progressive reduction of elevator after step application on initial aircraft height
response.
/ / / , - ~T f f - / ; / / / / / / / / / / / / / / " / / / / / / / / t / / / / / " / / /
~lSOO
+.IOOO
~xo(+t)
-+ soo
I I Rate of descent W = I.S ft/s=c
I0 20 3O 40 Pilot~ heiqht above wheels Hp
SOft
riO00
~O(+t)
.+500
I I Rote of descent W = 2 ft/sec
o Io 20 30 40 so Hp
FIG. 17. Uncertainty in predicted touchdown point AD as a function of pilots height above main wheels, aircraft speed V,, and rate of descent w
assuming pilot judges height to ___ 15 ~ .
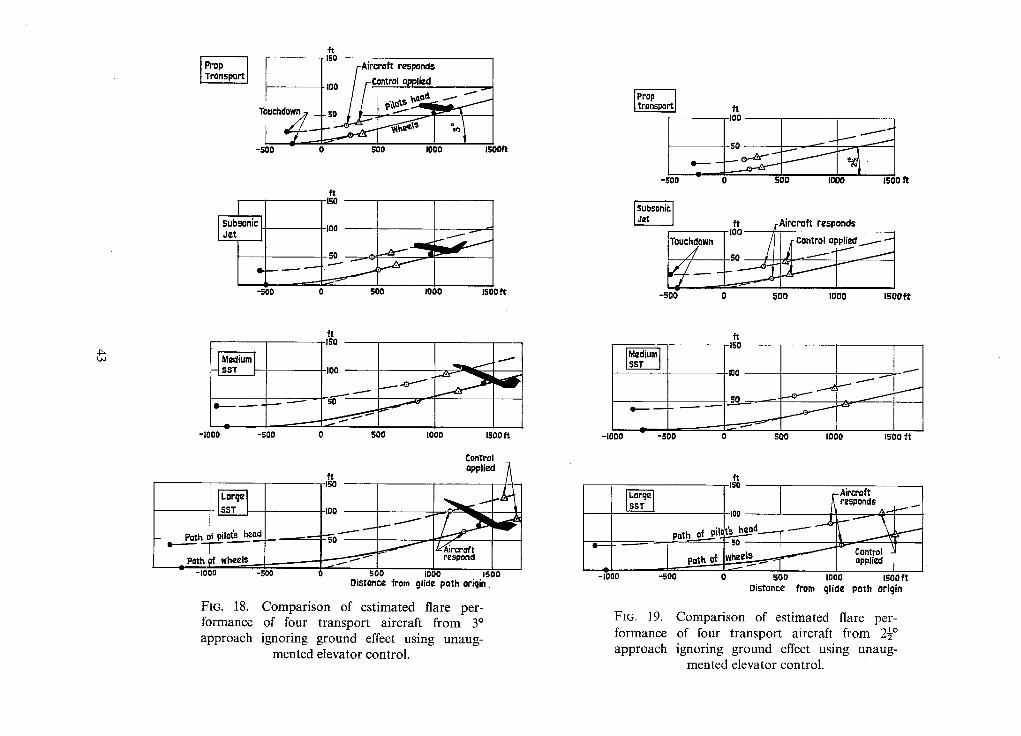
~t
'+" FAircroft respoms ioo //-COntrol applied
/ / uehdown~ _ . ~o 1 t ~. ~ ~ i i : ~ ' ~
-SO0 0 500 I000 150Oft
f t
I00 I~et,
......-
*S00 0
.J
SO0 1000 150Oft
ft ISO
I00
-I000 -SO0 0 500
J
100o 1500~
Control
~0 l applied
oPoth of wheels -1000 -500 0 500 1000 JSO0
Distance from glide path origin.
1 FIG. 18. Comparison of estimated flare per- formance of four transport aircraft from 3 ° approach ignoring ground effect using unaug-
mented elevator control.
-SOn
0 e
f t
lSO0 ft
f t r Aircraft responds
ITouchdown I I00 / ] l r Control applied ~ ~'~
I / / I+o / l l J l _ ~ - t ~ . 1 ~
-500 0 500 1000 1500~¢t
IO0
5 0 .,---"
-I000 -500 0
I
I SO0 IO00 1500 f t
-~oo
f t
ISO , - AircrMt responds
_ path of
-SO0 0 500 1000 ISO0 f t Distance "from glide path origin
FIG. 19. Comparison of estimated flare per- formance of four transport aircraft from 2½ ° approach ignoring ground effect using unaug-
mented elevator control.
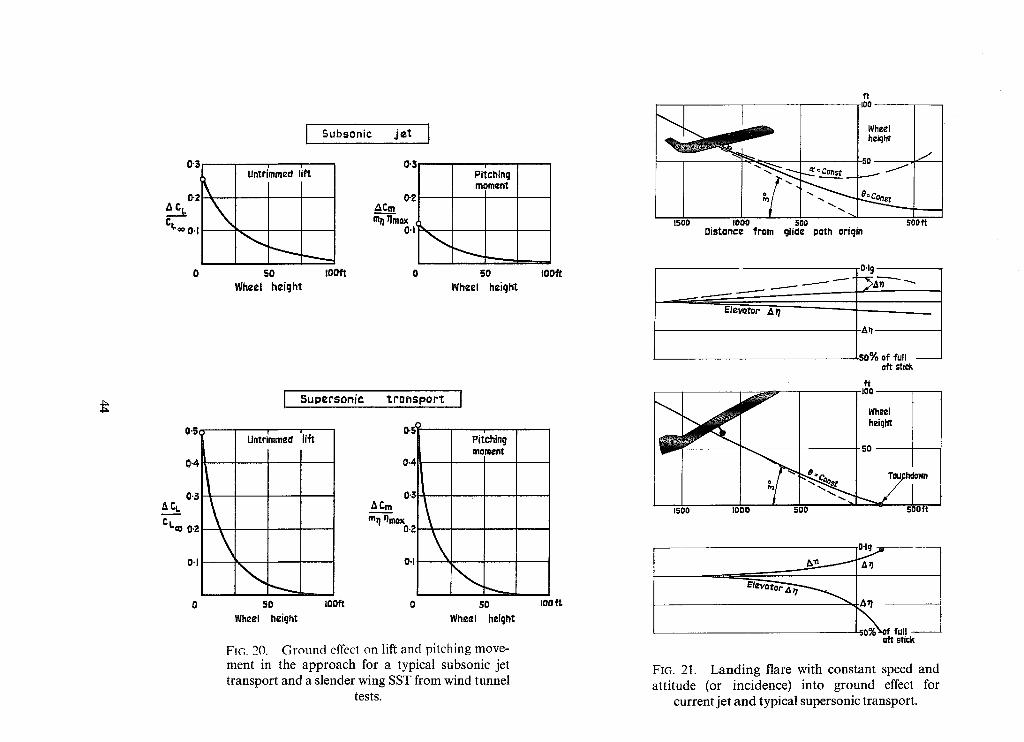
I Subsonic jet I
0"3
£ L O 2 k
c~,~ o.~1 \
Untri'mmed liP?.
I
i f3
&2 ~Cm ml I llm~.(
0 SO IOOfl 0 Wheel h¢ighl
i PRching moment
I
50 I~/heel height
0.5
0"4
& CL 0.3
\ e l m 0,2
0-1
Supersonic "transport J
i Untrimmed 'lift
I I
0"~ ACre
mq llmOXo.2
O.I
0.4
L
Pitching moment
0 50 IOOft O SO Wheel heignt Wheel height
Fie,. 20. Ground effect on lift and pitching move- ment in the approach for a typical subsonic jet transport and a slender wing SST from wind tunnel
tests.
IDiOt
I00
1500 IO00 Distance from
ft I00
Wheel heiqht
50 /
500 500f glide poth oriqin
' 0-19
IS0% of full
l
1500 I 000 500
aft stick
ft I00
Wheel heiqht
50
.._77
r P , ~ "l}'l I I I aft stick
FIG. 21. Landing flare with constant speed and attitude (or incidence) into ground effect for
current jet and typical supersonic transport.
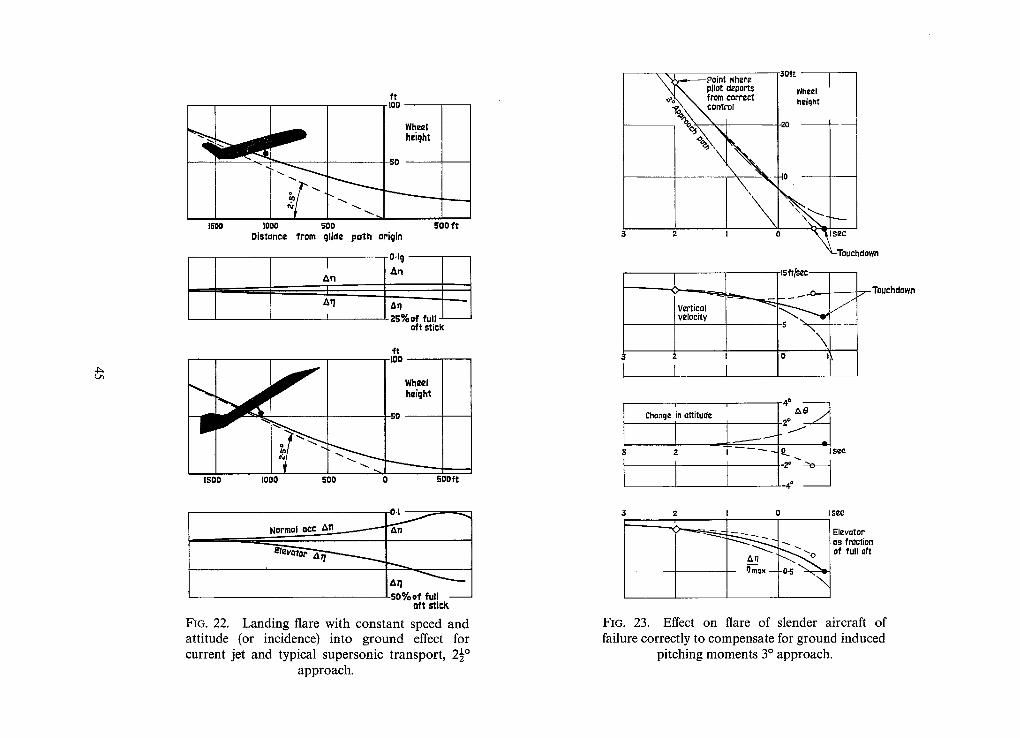
4~
I000 500 Distance from glide path origin
ft I00
o
50
Wh~zl height
5oof1
aft stick
1500
I J l I '°° ~ I I wheal ~ ~ 1 1 ~ [ [ height
1500 I000 500 0 $OOft
Normal o c ~ ~ ' ~
¢~0]_ A.f 4~lgll oft stieP,
FIG. 22. Landing flare with constant speed and attitude (or incidence) into ground effect for current jet and typical supersonic transport, 2½ °
approach.
whevz
, \ control
% " \ ~
! )<
velocity
2 I
I_ I
3Oft [
Wheel height
'°li t O
"LTouchdown
_ - ~ ~ 7-T°uehd°wn
0 ',
Chonq¢ in attitude ' I ~ ' ~ e ~
3 2 I O I see
~'~"~--~. Elevator ~ ~ as frQetion
of full aft &q ~mmax -0-5 -~ -
\
FIG. 23. Effect on flare of slender aircraft of failure correctly to compensate for ground induced
pitching moments 3 ° approach.
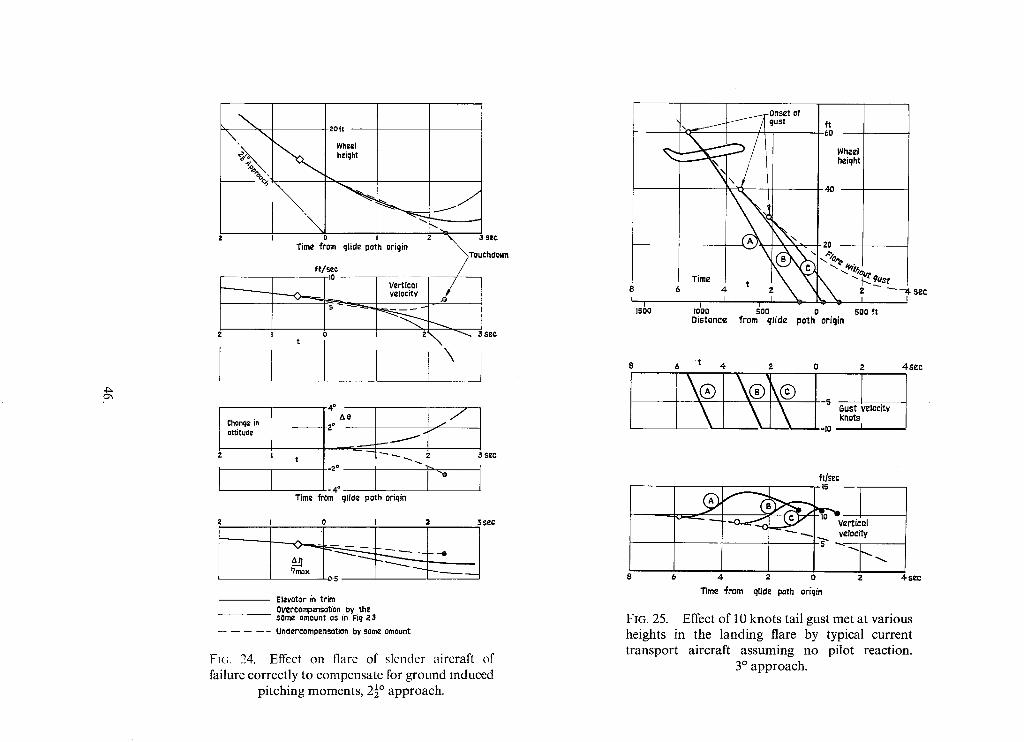
0",
~ 20 ft
Whsel hekJht
, ~ - . ~ ! o 2 % 3 SeC
Time from glide path origin ~Touchdown ft/ssc
~ _ ~ ,0 VertiCal / velocKy
\
Chon~z in o attitude
I t s¢c
/:4=- Time from glide path oriqin
2 0 1 2 5 Se¢
Elevator in trim OVercornp~nsotion by the
- - some amount as in Fig 23 gndercompensotJon by some amount
FiG. 24. Effect on flare of slender aircraft of failure correctly to compensate for ground reduced
pitching moments, 2½ ° approach.
~.~..~F Onset of ~[,, / f /~ gust
Time B
i I 1500
ft 60
Wheel height
, zO
\\%;,. i
i 1ooo soo o SO0 f t Distance from ql[de path origin
9u~- t T S£C
l t 4 2 0 2 4 Se C
- I0 I
8 4 sec
velocity
(~ 4 2 0 2 Time "From glide path origin
FIG. 25. Effect of 10 knots tail gust met at various heights in the landing flare by typical current transport aircraft assuming no pilot reaction.
3 ° approach.
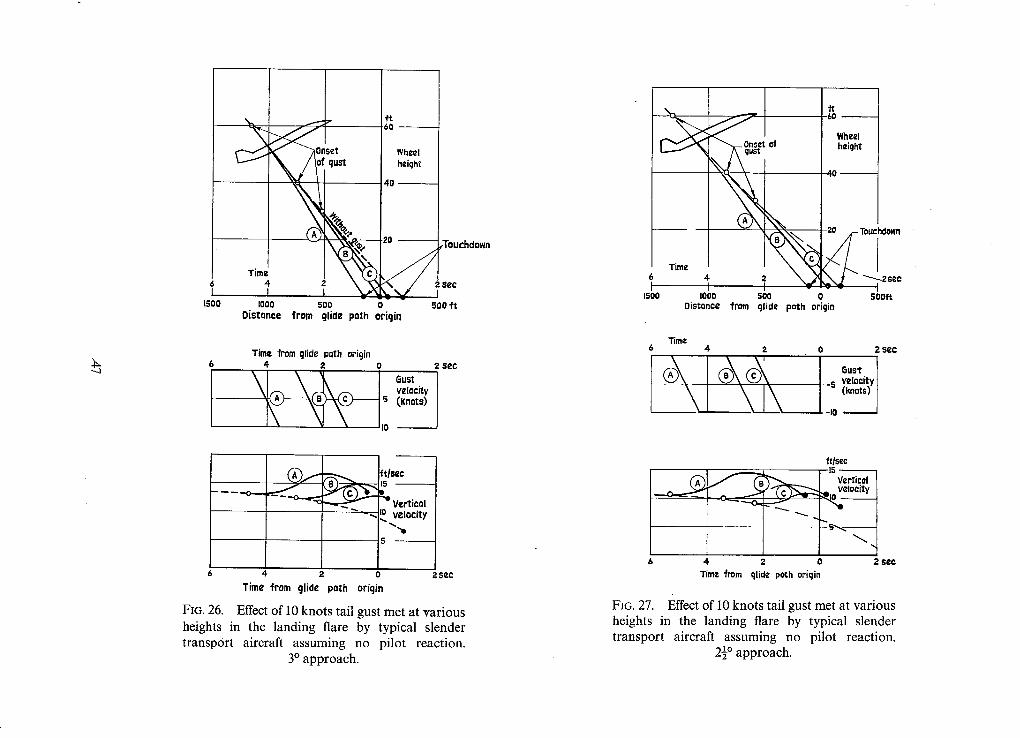
6
ISO0
\ //0+ qust
lOOO 500 OistQnoe
~t 60
Wheel heiqht
,Touchdown
~ 2 s e e
500 f t from qlide path or[qin
Time from ¢Jlide path origin 4 2 o
velocity s (Kno~=)
IO
SeC
Q
4
Time from glide path ori
ftlsec 15
"~ Vertical velocity
5
2 5¢C in
FIG. 26. Effect of 10 knots tail gust met at various heights in the landing flare by typical slender transport aircraft assuming no pilot reaction.
3 ° approach.
1500
ff &O
Wheel ha, ight
T°ucid°wn
"'~2SeC IOOO SO0 0 SOOft
Distance from qlJd~, path origin
Time 4 2 o 2 s¢¢
Gus'[' velocity
-S (knots)
- f h
6 4. 2
ftls¢c
Vertical +<elocity
2 sea Time from clliaz path origin
FIG. 27. Effect of 10 knots tail gust met at various heights in the landing flare by typical slender transport aircraft assuming no pilot reaction.
2½ ° approach.
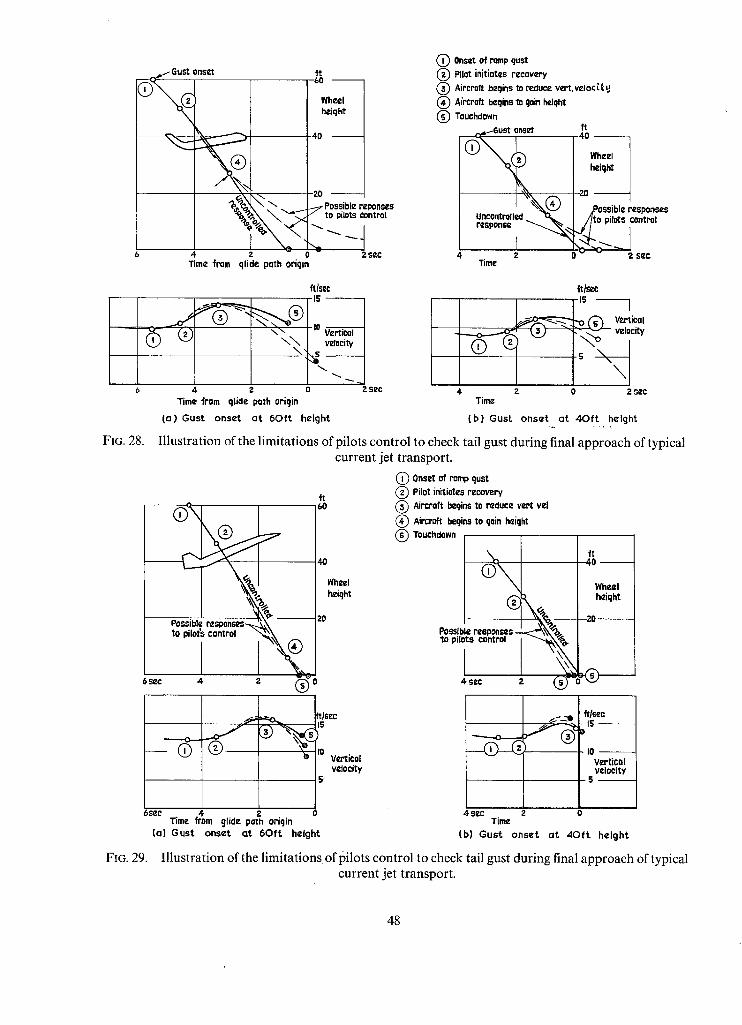
FIG. 28.
~ - Gust onset
®
?oK<
-60 - -
Wheel he:iqht
40
"20 - - ~ Possible rePonscS
to pilots Control
~ l ~, Sc, C 4 2
Time from qlide path oriqm
if/see i o
\ \ Vertical \ ~ velocity
\ ' ~
Z $eC
Onset of romp qust ( ~ Pilot initiates recovery <~ Aircraft bzqins to reduce vert,velocL~.cJ ( ~ Aircraft beq/ns to gain kciqht
Touchdown
=\\® - .-~++eresp0.ses
Time
+t/me
" v¢l(
s \ \
\ 4 2 0 4 z o 2 ~ec
Time ~rom qlide path oriqJn Timz
(a) Gust onset a t 6Of t height (b ) Gust onset a t 4Of t height . 1 . - , .
Illustration of the limitations of pilots control to check tail gust during final approach of typical current jet transport.
ff
l I +
~ ' ~ I I Wheel
%+_ I - - - - - - - - - - - - - - - - - ~ \ < ~ - - - - - - - - 1 2 o Possible I '¢sPonses-~ I '°°"i°°=1
6 Sec 4 2 ~ 0
( ~ Onset of romp qust ( ~ Pilot initiates recovery @ Aircraft beqins to retluce vert vel
<~ Aircraft beqins to qoin heiqht Touchdown
Possible reGponses- +o piloes control
4 sec 2 ~ "
ft 40
Wheel hmiqht
--20
~ > - -
ftlscc 15 )
Io Vertical velocity
5
FIG. 29.
l " t ] s e c
15 0
4s¢c Time
(b) Gust onset a t
I0 Vertical velocity
5
6sea Time fr+om glide pat~ oriqin 0
(a] Gust onset a t 6Of t height 4O f t height
Illustration of the limitations of pilots control to check tail gust during final approach of typical current jet transport.
48
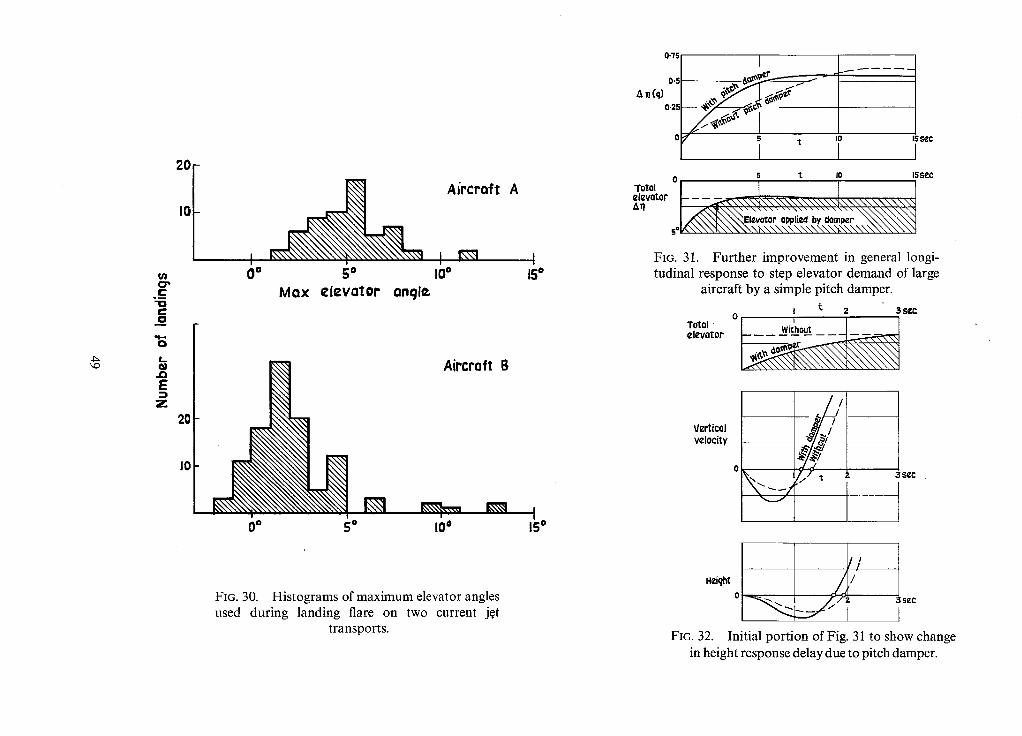
20
o ~ . c n o c:
o
L.
J~ E
Z
I0
I 0
, ~o 0 e
!
0 ° !
~o
M o x e l e v a t o r onql~
Aircraft A
!
I0 e 15 °
Aircraft B
i I
I0 ° 15 °
FIG. 30. Histograms of maximum elevator angles used during landing flare on two current j~t
transports.
0"/5
0.~
an(q) 0.25
5 t IO
I 15 geC
0 5 1. IO 15S£C
S o I ~ ' ~ \ \ \ ~ \ \ \ \ \ ~ \ \ \ \ \ \ \ \ ~ \ \ \ \ \ \ \ " ~
Total elevator ATI
FIG. 31. Further improvement in general longi- tudinal response to step elevator demand of large
aircraft by a simple pitch damper.
I t 2 3 S ¢ C 0 I
TOtal ' Withou~ elevator
Wrtical velocity
// Haiq~ ~ /
0
FIG. 32. Initial portion of Fig. 31 to show change in height response delay due to pitch damper.
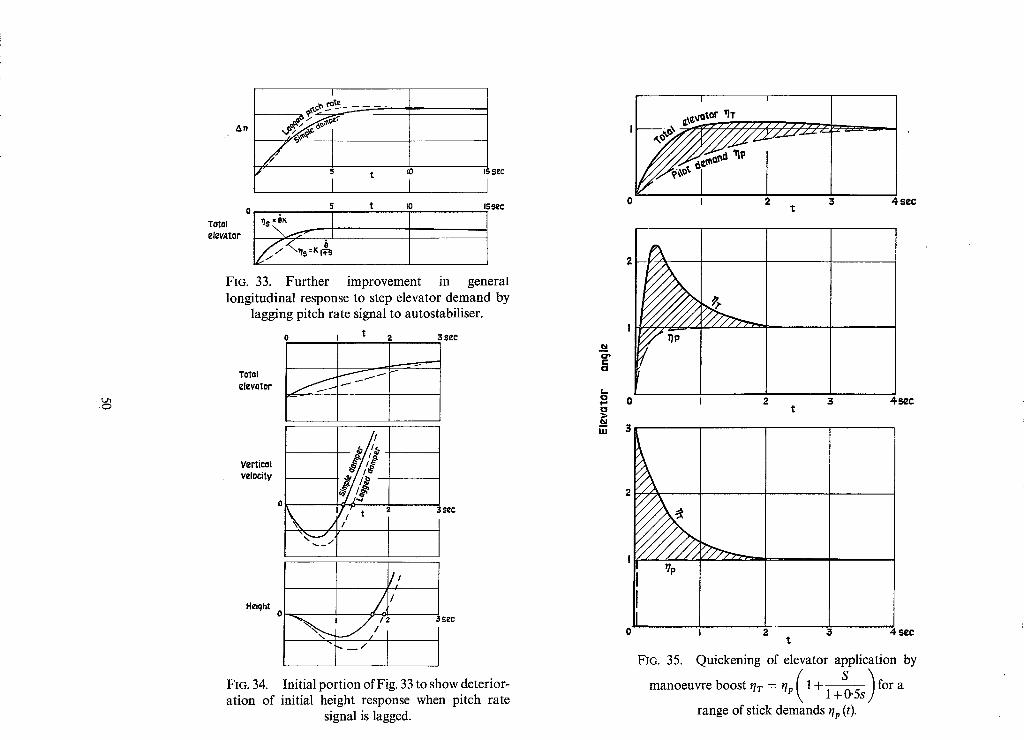
#ti'l
I
, ~> ~,,.#_'~ . . . . . . . . . , , , < > ~
0
Totol ~ls "ftK I elr/Ator
5 1 IO
L 15 5eC
1 5 t iO 155~C
FIG. 33. Further improvement in general longitudinal response to step elevator demand by
lagging pitch rate signal to autostabiliser.
0 I t 2 3 Sec
To~ol
VeVi¢"l #/l~ ,~//,~ v , , o ~ , y ~/,/~
I
Heiql~ 0 Z /
i / ,'2 3sec
" ~ _ ~ 1 i I
FIG. 34. Initial portion of Fig. 33 to show deterior- ation of initial height response when pitch rate
signal is lagged.
I
C O
t . , O 0
lht
3
I I
0 I 2 3 4 sec t
2 3 4 ~ c t
2 3 4 set $
FIG. 35. Quickening of elevator application by
manoeuvre boost qr = t/p 1-t
range of stick demands t/p (t).
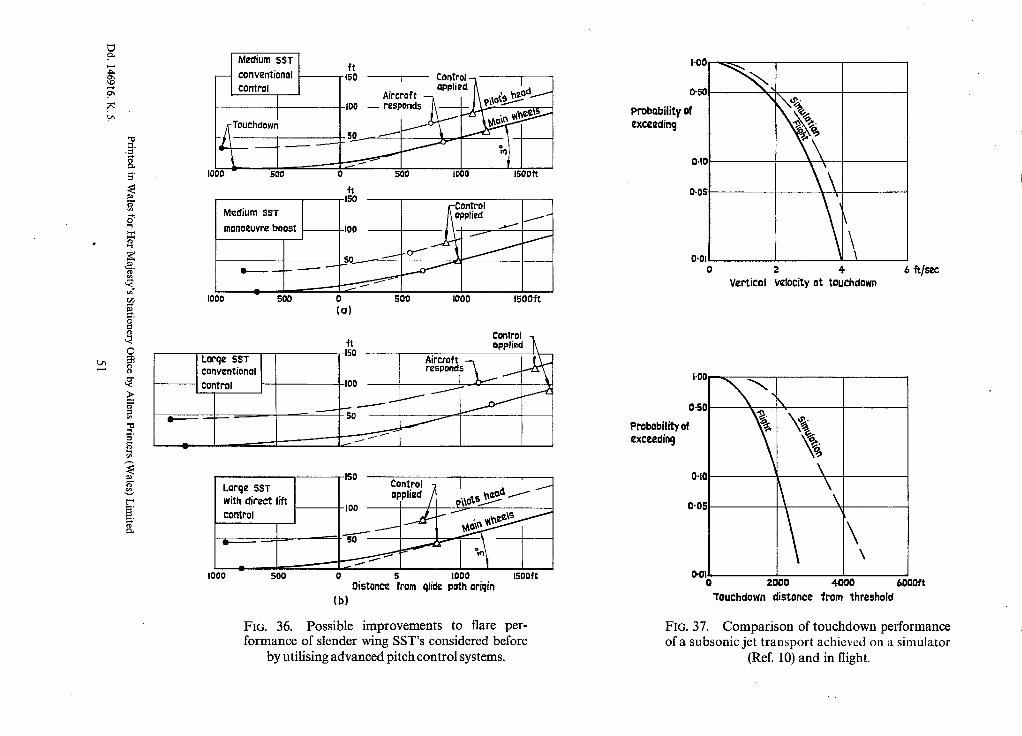
t ~
~u
=
o
> E
i Medium IST l conventionol control
1000 500
ft t;~d [ LUFI LFUI --~
Opplied~ '_A Aircroft ~ I ~ .._~'n ~ ¢ 0 " /
Ioo - respo.dsh I ~ o , e . ~ "~
o 500 IOOO Isooft ft ISO ~ Control Mcdiurn SST
manoeuvre boost I00
500 0 la)
I000 500 MOO 150Oft
Control ft applied
Lor'qe SST ISO Aircraft -.-, ~ \~ 0o ..,0oo, 7S: control I00
50
,150 I Control ~1 I . ' Lorcje SST I applied / l "ol,S ~¢o- / /
With direct lift I ,oo I 11 ~-~ ~ ' - J
- . - - ~ - ~ 50
Iooo soo o s tooo Isoo~t Distonc¢ from qlide path oriqin
(b)
FIG. 36. Possible improvements to flare per- formance of slender wing SST's considered before
by utilising advanced pitch control systems.
I'00
0"50
Probability of ¢xceeain 9
0.10
O.OS
0,01 0
Ve~ieol
\ 4
VeloCity 0t toUchdown 6 fusee
1.0¢
0-50
Probobility of £xeceding
0.10
0"05
0"01
\
\
o zooo 4000 600Oft Touchdown distance from threshold
FIG. 37. Comparison of touchdown performance of a subsonic jet transport achieved on a simulator
(Ref. 10) and in flight.
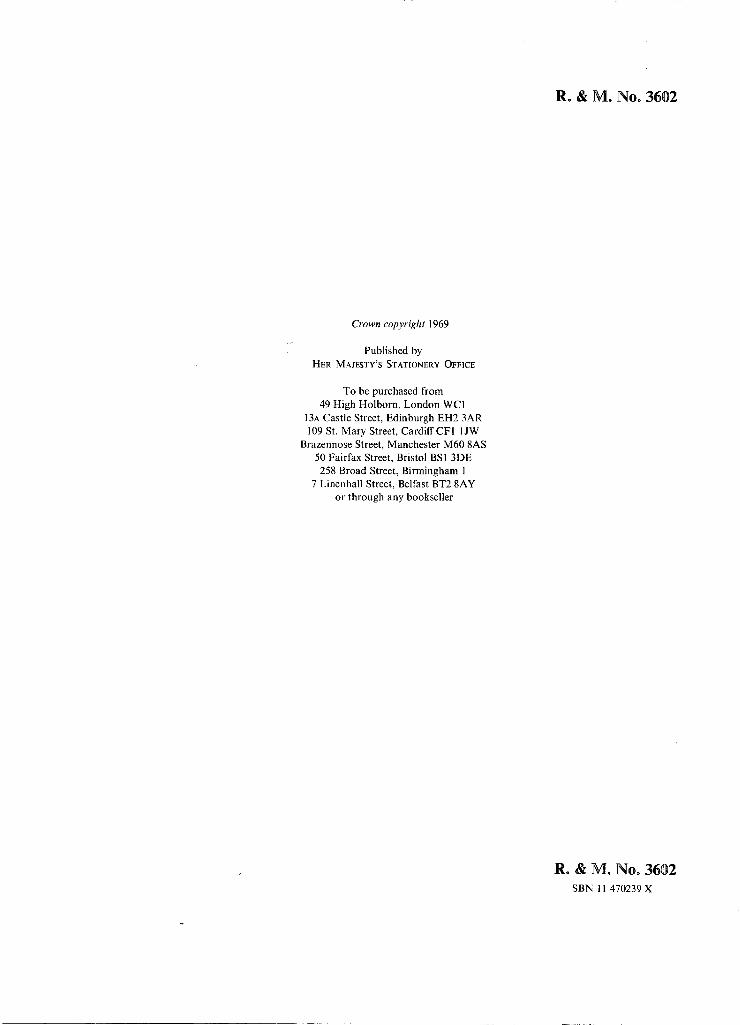
R. & M. No. 3602
Crown copyright 1969
Published by HER MAJESTY'S STATIONERY OFFICE
To be purchased from 49 High Holborn, London WCI
13A Castle Street, Edinburgh EH2 3AR 109 St. Mary Street, Cardif fCFl 1JW
Brazennose Street, Manchester M60 8AS 50 Fairfa× Street, Bristol BSI 3DE 258 Broad Street, Birmingham 1
7 Linenhall Street, Belfast BT2 8AY or through any bookseller
Ro & M. No, 3602 SBN 1 l 470239 X