Embed Size (px)
Citation preview
Development of a Digital Standard to Specify Surface Requirements
Michelle Voelker, Paul Kemper, Frank Peters
Industrial and Manufacturing Systems Engineering
Iowa State University, Ames, Iowa 50011
ABSTRACT
Communication of specifications between a customer and a manufacturer is important for meeting form, fit, and functional requirements of any part. Current standards for the inspection of cast metal surfaces use qualitative methods to inspect the surface quality leaving room for variation in interpretation of the standard. A quantitative standard for specifying casted surfaces is being developed to reduce this variation and eliminate confusion between the customer and manufacturer. It allows the customer to specify exactly what is needed as opposed to limiting them to a subjective comparator or image to base their requirements off of. Additionally, this quantitative method can be used to verify visual inspection results internally within a company or to promote the automation of the inspection qualification process. Methods developed for this standard will provide a consistent means of collecting data and reduce overall variability among manufacturers.
I. INTRODUCTION Inspecting parts to meet quality standards is important for meeting customer needs. In metal casting, current standards use qualitative methods to determine acceptability of surface quality. These methods result in large variation in measurement error, both repeatability and reproducibility, due to inconsistencies for a single inspector between parts and between inspectors on the same part [1]. The proposed digital standard that quantifies acceptance criteria is being developed to reduce the amount of error during inspection to verify results from a visual method. For the customer, a quantitative, or digital, standard will allow them to be able to communicate to the manufacturer exactly what they need or want. It does not limit the customer to a specific set of surface finishes like other standards that use a set of comparators or images to specify requirements. Additionally, a process for measuring the components of the standard must be outlined so the inspection process is consistent among manufacturers. This will require methods in order to determine the underlying geometry to customize the calculations based on the actual geometry of the part post-shrinkage and post-finishing as opposed to a nominal model, which would vary from part to part and give inconsistent measurements of the surface.
Proceedings of the Steel Founders’ Society of America—Technical & Operating Conference, Chicago, ILDecember 10-12, 2015
2
II. CURRENT STANDARDS
The Alloy Casting Institute (ACI) Surface Indicator Scale, Manufacturer Standardization Society (MSS) SP-55 Visual Method, and American Society for Testing and Materials (ASTM) A802 that reference the Steel Castings Research and Trade Association (SCRATA) comparator platescontinue to be the leading standards in metal casting inspection. In addition, the GAR Electroforming Cast Comparator C9 is used in some surface roughness inspection processes.
A. ACI Surface Indicator Scale
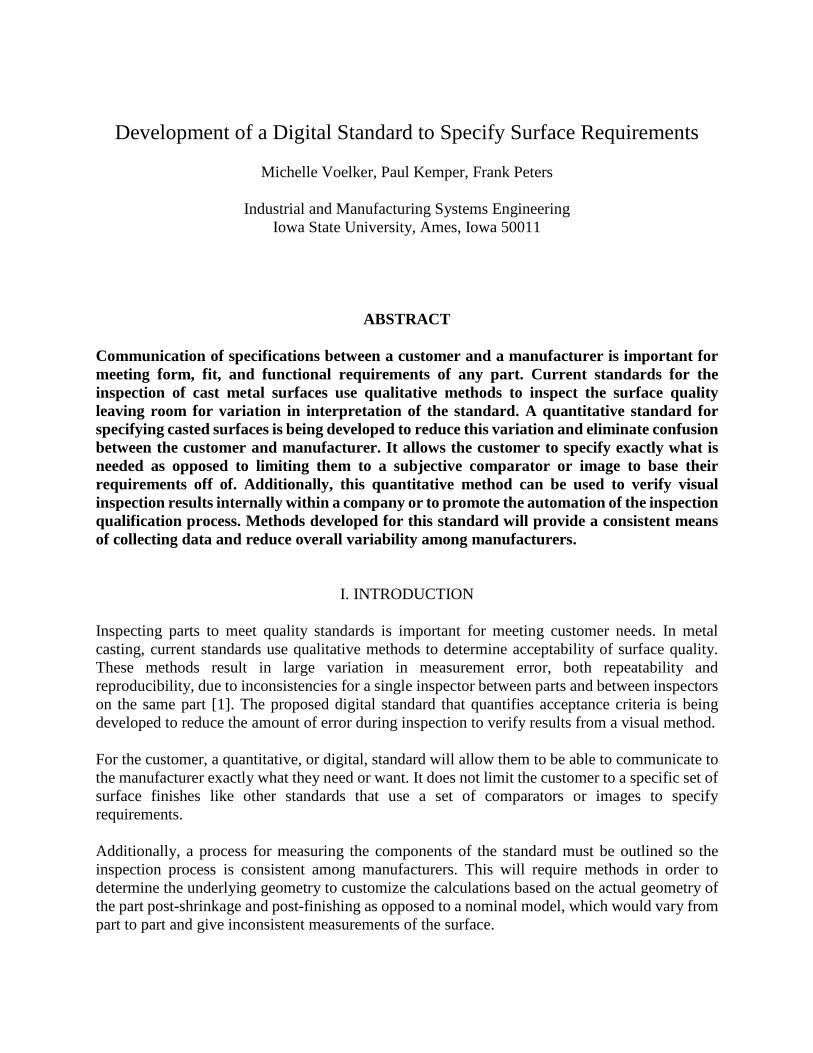
The ACI Surface Indicator method uses a metal plate with four surface variations, as seen in Figure 1. The method evaluates “general smoothness, height and depth of irregularities extending beyond the range of general variations, and frequency and distribution of such irregularities [2].” The comparator swatches are designated SIS-1 through SIS-4 and correspond to the root mean square (RMS) average deviation in micro-inches. Additionally, the standard specifies criteria for the height and frequency of surface abnormalities through a series of grids of a “controlling square inch.”
B. MSS SP-55 Visual Method
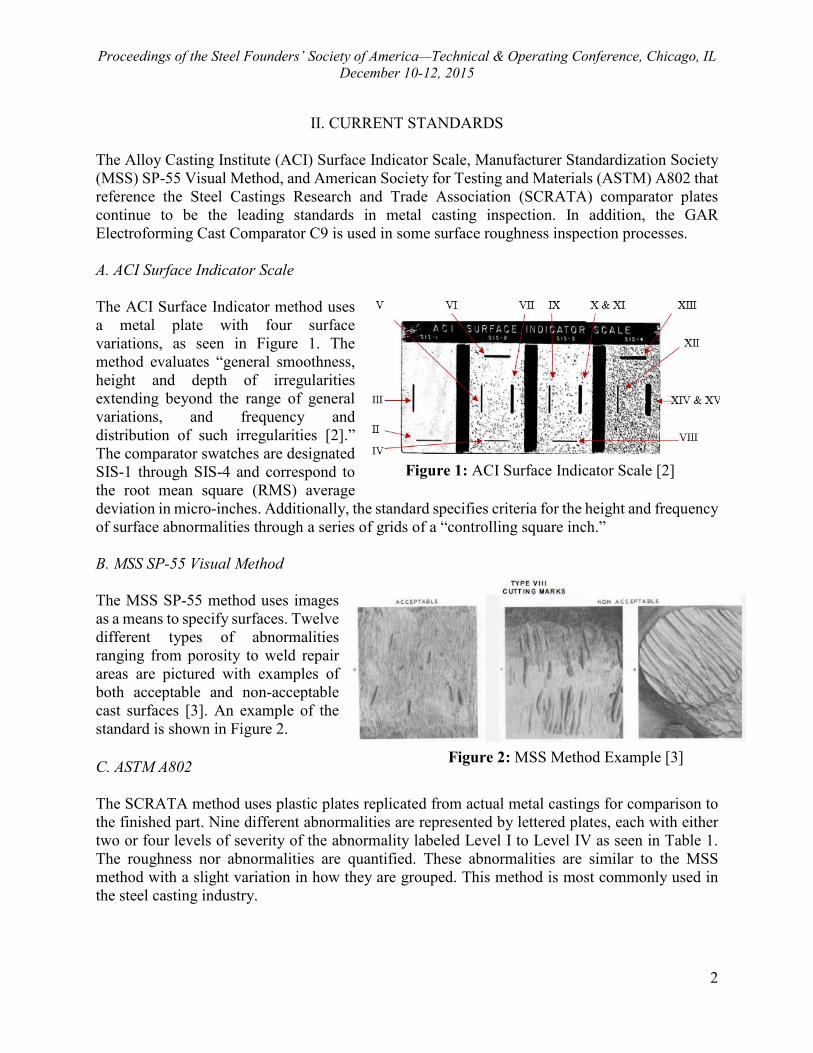
The MSS SP-55 method uses images as a means to specify surfaces. Twelve different types of abnormalities ranging from porosity to weld repair areas are pictured with examples of both acceptable and non-acceptable cast surfaces [3]. An example of the standard is shown in Figure 2.
C. ASTM A802
The SCRATA method uses plastic plates replicated from actual metal castings for comparison to the finished part. Nine different abnormalities are represented by lettered plates, each with either two or four levels of severity of the abnormality labeled Level I to Level IV as seen in Table 1. The roughness nor abnormalities are quantified. These abnormalities are similar to the MSS method with a slight variation in how they are grouped. This method is most commonly used in the steel casting industry.
Figure 1: ACI Surface Indicator Scale [2]
Figure 2: MSS Method Example [3]
Proceedings of the Steel Founders’ Society of America—Technical & Operating Conference, Chicago, ILDecember 10-12, 2015
3
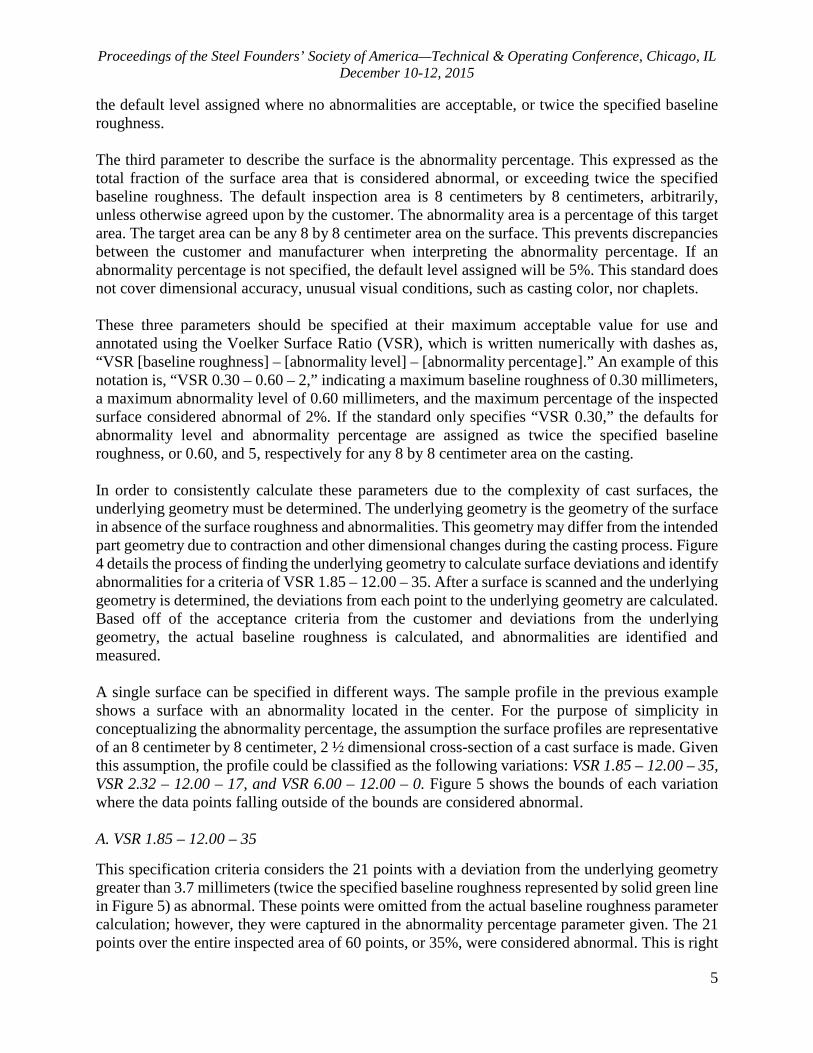
Table 1: Visual Inspection Acceptance Criteria of ASTM A802 [4]
D. GAR Electroforming Cast Microfinish Comparator C9
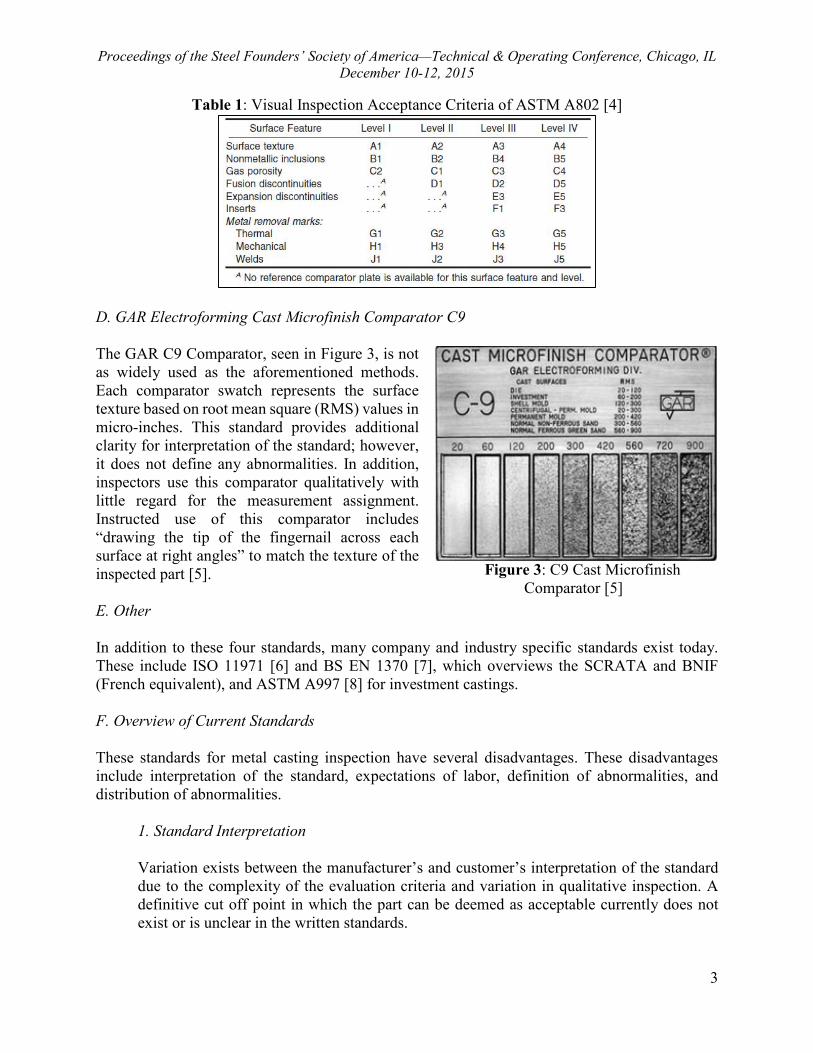
The GAR C9 Comparator, seen in Figure 3, is not as widely used as the aforementioned methods. Each comparator swatch represents the surface texture based on root mean square (RMS) values in micro-inches. This standard provides additional clarity for interpretation of the standard; however, it does not define any abnormalities. In addition, inspectors use this comparator qualitatively with little regard for the measurement assignment. Instructed use of this comparator includes “drawing the tip of the fingernail across each surface at right angles” to match the texture of the inspected part [5].
E. Other
In addition to these four standards, many company and industry specific standards exist today. These include ISO 11971 [6] and BS EN 1370 [7], which overviews the SCRATA and BNIF (French equivalent), and ASTM A997 [8] for investment castings.
F. Overview of Current Standards
These standards for metal casting inspection have several disadvantages. These disadvantages include interpretation of the standard, expectations of labor, definition of abnormalities, and distribution of abnormalities.
1. Standard Interpretation
Variation exists between the manufacturer’s and customer’s interpretation of the standard due to the complexity of the evaluation criteria and variation in qualitative inspection. A definitive cut off point in which the part can be deemed as acceptable currently does not exist or is unclear in the written standards.
Figure 3: C9 Cast Microfinish Comparator [5]

Proceedings of the Steel Founders’ Society of America—Technical & Operating Conference, Chicago, IL December 10-12, 2015
4
2. Labor Expectations Personnel must be trained on the standard and should have the standard documentation in hand in order to make the determination of whether or not the part is acceptable. These methods rely solely on the individual’s sensory capability as opposed to hard data. Due to the subjectivity of the decision, the cutoff point can move out over time or among people. Research has shown that training must be ongoing to keep personnel ‘calibrated’ [9]. 3. Undefined Abnormalities Surface abnormalities not contained within the given standard make it difficult to assign a value to the finished part. Furthermore, many abnormalities cannot be determined via visual inspection and rather require metallurgical analysis. Furthermore, the origin of the abnormality is quite irrelevant to the final casting use in most cases. 4. Abnormality Distribution The distribution of abnormalities versus size over the entire part is not clearly specified. For example, if one large crater is acceptable on a part, there is no reasoning behind why multiple craters of smaller size are not acceptable.
With the decreasing cost of non-contact technologies, such as white light and laser scanning, a quantitative method can be introduced to increase reliability and repeatability of the casting inspection process.
III. DEVELOPMENT OF THE STANDARD
The quantitative standard (Appendix 1) uses data obtained from three-dimensional scans of a portion of a casting in order to objectively inspect a surface. From this data, the three main parameters specified by the customer are verified, including the baseline roughness, abnormality level, and abnormality percentage. The baseline roughness, measured in millimeters, is the roughness average of the cast surface disregarding abnormalities. This parameter is the minimum requirement to be specified by the customer. Default values will be assigned to other parameters if none are specified. Abnormalities are any surface anomaly present that is not part of random variation due to the actual baseline roughness and are greater than, arbitrarily, twice the specified baseline roughness. Therefore, there is no need for the customer to specify every type of abnormality that could possibly occur, as with the SCRATA standard; all abnormality types are encompassed under the abnormality level parameter. These include, but are not limited to, porosity, inclusions, and expansion. Abnormalities are considered any point exceeding twice the specified baseline roughness. The abnormality level is specified in millimeters and is represented by the absolute distance of the data point from the underlying geometry. If an abnormality level is not specified,
Proceedings of the Steel Founders’ Society of America—Technical & Operating Conference, Chicago, IL December 10-12, 2015
5
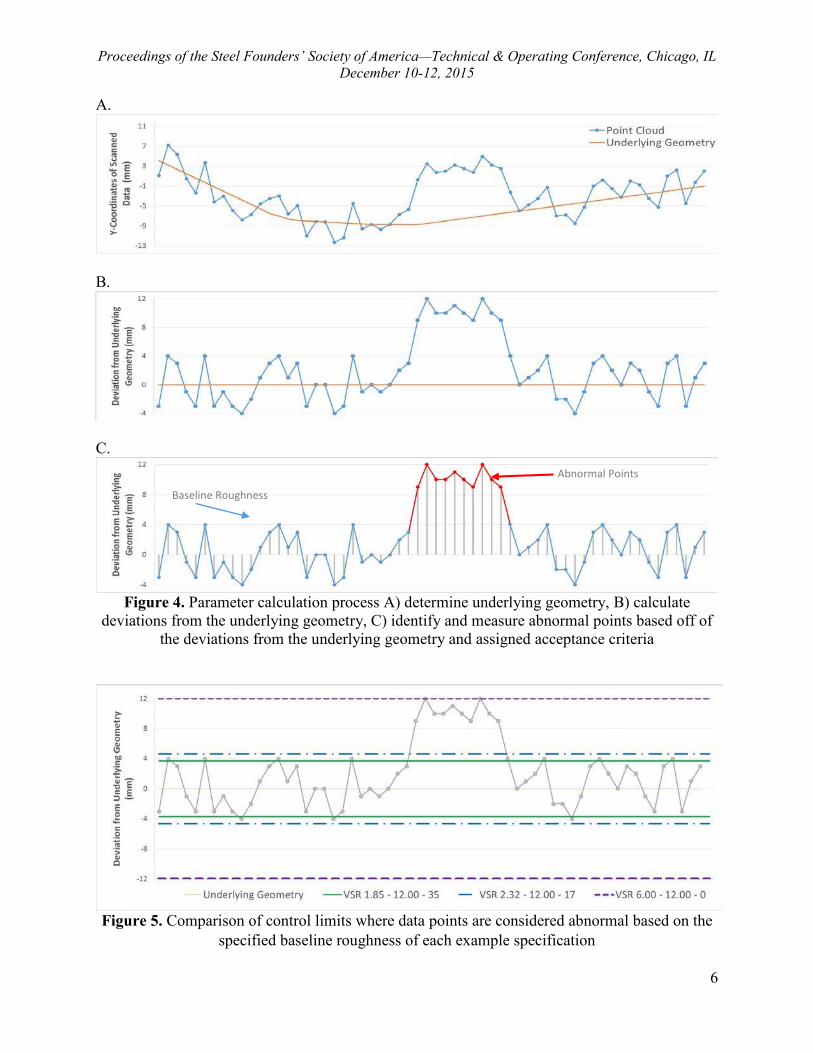
the default level assigned where no abnormalities are acceptable, or twice the specified baseline roughness. The third parameter to describe the surface is the abnormality percentage. This expressed as the total fraction of the surface area that is considered abnormal, or exceeding twice the specified baseline roughness. The default inspection area is 8 centimeters by 8 centimeters, arbitrarily, unless otherwise agreed upon by the customer. The abnormality area is a percentage of this target area. The target area can be any 8 by 8 centimeter area on the surface. This prevents discrepancies between the customer and manufacturer when interpreting the abnormality percentage. If an abnormality percentage is not specified, the default level assigned will be 5%. This standard does not cover dimensional accuracy, unusual visual conditions, such as casting color, nor chaplets. These three parameters should be specified at their maximum acceptable value for use and annotated using the Voelker Surface Ratio (VSR), which is written numerically with dashes as, “VSR [baseline roughness] – [abnormality level] – [abnormality percentage].” An example of this notation is, “VSR 0.30 – 0.60 – 2,” indicating a maximum baseline roughness of 0.30 millimeters, a maximum abnormality level of 0.60 millimeters, and the maximum percentage of the inspected surface considered abnormal of 2%. If the standard only specifies “VSR 0.30,” the defaults for abnormality level and abnormality percentage are assigned as twice the specified baseline roughness, or 0.60, and 5, respectively for any 8 by 8 centimeter area on the casting. In order to consistently calculate these parameters due to the complexity of cast surfaces, the underlying geometry must be determined. The underlying geometry is the geometry of the surface in absence of the surface roughness and abnormalities. This geometry may differ from the intended part geometry due to contraction and other dimensional changes during the casting process. Figure 4 details the process of finding the underlying geometry to calculate surface deviations and identify abnormalities for a criteria of VSR 1.85 – 12.00 – 35. After a surface is scanned and the underlying geometry is determined, the deviations from each point to the underlying geometry are calculated. Based off of the acceptance criteria from the customer and deviations from the underlying geometry, the actual baseline roughness is calculated, and abnormalities are identified and measured. A single surface can be specified in different ways. The sample profile in the previous example shows a surface with an abnormality located in the center. For the purpose of simplicity in conceptualizing the abnormality percentage, the assumption the surface profiles are representative of an 8 centimeter by 8 centimeter, 2 ½ dimensional cross-section of a cast surface is made. Given this assumption, the profile could be classified as the following variations: VSR 1.85 – 12.00 – 35, VSR 2.32 – 12.00 – 17, and VSR 6.00 – 12.00 – 0. Figure 5 shows the bounds of each variation where the data points falling outside of the bounds are considered abnormal. A. VSR 1.85 – 12.00 – 35
This specification criteria considers the 21 points with a deviation from the underlying geometry greater than 3.7 millimeters (twice the specified baseline roughness represented by solid green line in Figure 5) as abnormal. These points were omitted from the actual baseline roughness parameter calculation; however, they were captured in the abnormality percentage parameter given. The 21 points over the entire inspected area of 60 points, or 35%, were considered abnormal. This is right
Proceedings of the Steel Founders’ Society of America—Technical & Operating Conference, Chicago, ILDecember 10-12, 2015
6
A.
B.
C.
Figure 4. Parameter calculation process A) determine underlying geometry, B) calculate deviations from the underlying geometry, C) identify and measure abnormal points based off of
the deviations from the underlying geometry and assigned acceptance criteria
Figure 5. Comparison of control limits where data points are considered abnormal based on the specified baseline roughness of each example specification
Abnormal Points
Baseline Roughness
Proceedings of the Steel Founders’ Society of America—Technical & Operating Conference, Chicago, IL December 10-12, 2015
7
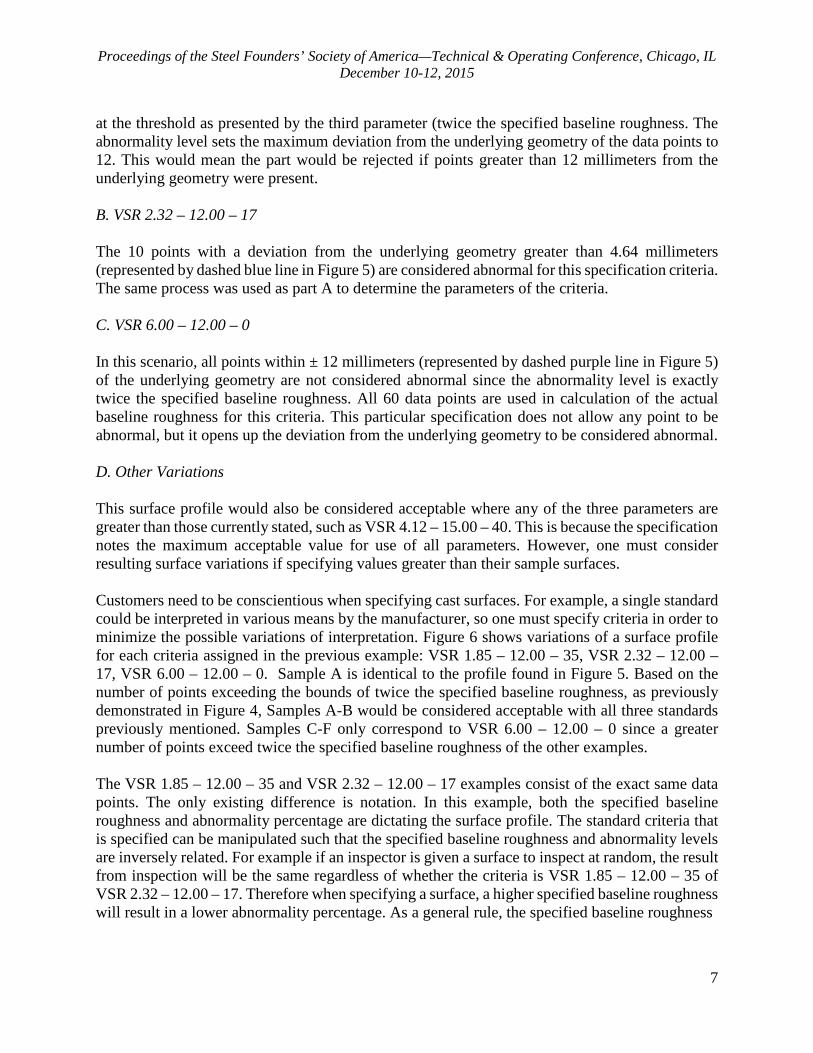
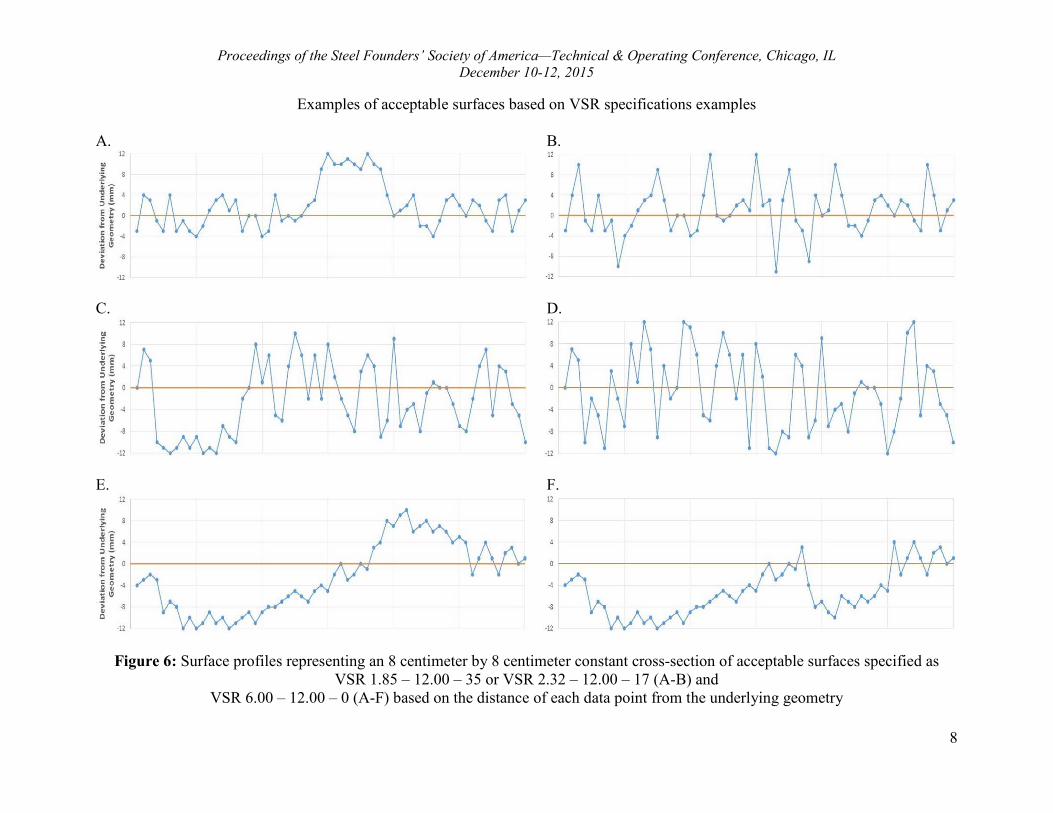
at the threshold as presented by the third parameter (twice the specified baseline roughness. The abnormality level sets the maximum deviation from the underlying geometry of the data points to 12. This would mean the part would be rejected if points greater than 12 millimeters from the underlying geometry were present. B. VSR 2.32 – 12.00 – 17 The 10 points with a deviation from the underlying geometry greater than 4.64 millimeters (represented by dashed blue line in Figure 5) are considered abnormal for this specification criteria. The same process was used as part A to determine the parameters of the criteria. C. VSR 6.00 – 12.00 – 0 In this scenario, all points within ± 12 millimeters (represented by dashed purple line in Figure 5) of the underlying geometry are not considered abnormal since the abnormality level is exactly twice the specified baseline roughness. All 60 data points are used in calculation of the actual baseline roughness for this criteria. This particular specification does not allow any point to be abnormal, but it opens up the deviation from the underlying geometry to be considered abnormal. D. Other Variations This surface profile would also be considered acceptable where any of the three parameters are greater than those currently stated, such as VSR 4.12 – 15.00 – 40. This is because the specification notes the maximum acceptable value for use of all parameters. However, one must consider resulting surface variations if specifying values greater than their sample surfaces. Customers need to be conscientious when specifying cast surfaces. For example, a single standard could be interpreted in various means by the manufacturer, so one must specify criteria in order to minimize the possible variations of interpretation. Figure 6 shows variations of a surface profile for each criteria assigned in the previous example: VSR 1.85 – 12.00 – 35, VSR 2.32 – 12.00 – 17, VSR 6.00 – 12.00 – 0. Sample A is identical to the profile found in Figure 5. Based on the number of points exceeding the bounds of twice the specified baseline roughness, as previously demonstrated in Figure 4, Samples A-B would be considered acceptable with all three standards previously mentioned. Samples C-F only correspond to VSR 6.00 – 12.00 – 0 since a greater number of points exceed twice the specified baseline roughness of the other examples. The VSR 1.85 – 12.00 – 35 and VSR 2.32 – 12.00 – 17 examples consist of the exact same data points. The only existing difference is notation. In this example, both the specified baseline roughness and abnormality percentage are dictating the surface profile. The standard criteria that is specified can be manipulated such that the specified baseline roughness and abnormality levels are inversely related. For example if an inspector is given a surface to inspect at random, the result from inspection will be the same regardless of whether the criteria is VSR 1.85 – 12.00 – 35 of VSR 2.32 – 12.00 – 17. Therefore when specifying a surface, a higher specified baseline roughness will result in a lower abnormality percentage. As a general rule, the specified baseline roughness
Proceedings of the Steel Founders’ Society of America—Technical & Operating Conference, Chicago, ILDecember 10-12, 2015
8
Examples of acceptable surfaces based on VSR specifications examples
A. B.
C. D.
E. F.
Figure 6: Surface profiles representing an 8 centimeter by 8 centimeter constant cross-section of acceptable surfaces specified asVSR 1.85 – 12.00 – 35 or VSR 2.32 – 12.00 – 17 (A-B) and
VSR 6.00 – 12.00 – 0 (A-F) based on the distance of each data point from the underlying geometry
Proceedings of the Steel Founders’ Society of America—Technical & Operating Conference, Chicago, IL December 10-12, 2015
9
and abnormality percentage are inversely related when assigning different specifications to the same surface. To simplify specification assignment and interpretation, it is suggested the abnormality percentage for an 8 centimeter by 8 centimeter surface area does not exceed 10%. All parts deemed acceptable through VSR 1.85 – 12.00 – 35 and VSR 2.32 – 12.00 – 17 will also be considered acceptable under the VSR 6.00 – 12.00 – 0 criteria; however unlike the other two requirement examples, VSR 6.00 – 12.00 – 0 also can be specified by increasing the number of points located further from the underlying geometry while maintaining a roughness less than or equal to 6.00 millimeters. Since an abnormality is defined as greater than twice the specified baseline roughness, any data falling within ±12 millimeters from the underlying geometry would not be considered abnormal. Therefore, since the sample surfaces do not have any data points falling outside of this range, the abnormality percentage is 0%. This method sets a range on the maximum permissible deviation from the underlying geometry as opposed to calling out any abnormalities and is ideal when specifying no abnormalities can be present on the surface. In order to begin assigning criteria to their castings, customers can use current castings as a baseline for specifying a standard. To do this, customers can select a part with what they consider the least acceptable surface roughness and abnormality level, or a part that is not of the highest quality but still meets their current surface expectations. After using a non-contact method to collect data points from the surface, the customer can select a criteria for that surface by comparing the data to the underlying geometry. A single acceptance criteria may be specified over the entire cast surface, or multiple criteria may be specified for various areas of the casting in order to reduce the variation of interpretation using the methods discussed in this section.
IV. CASE STUDY OF PROPOSED STANDARD
The objective of this case study was to evaluate the different methods of determining the standard parameters of point cloud data. This information was used to determine the mathematical gap for the evaluation criteria of the digital standard. Methods were evaluated to explore the general proof of concept of the process. A. Evaluation of Non-contact Scanning Alternatives Previous work included the evaluation of the standard parameters using alternative methods to non-contact scanning. This included comparisons of the casting to the original CAD model, contact profilometers, and non-contact profilometers. The first method explored was to compare the point cloud data to an original solid computer model. This nearly perfect geometric model of the casting could easily be compared to a scan of the actual cast part to identify variation between the two. However, this method was not considered feasible due to the variability between the part and model after manufacturing from contraction, among other geometric variations. These variations would not allow for an accurate calculation of the surface parameters of the standard.
Proceedings of the Steel Founders’ Society of America—Technical & Operating Conference, Chicago, ILDecember 10-12, 2015
10
To evaluate contact methods, a MahrSurf SD 26 surface profilometer was used. The profilometer software is designed to calculate the roughness by eliminating waviness in the sample; however, unlike machining, the waviness and roughness are not cyclical, which makes filtering more difficult. For example, too much of the surface variation for roughness was filtered out with the waviness for rougher parts. Rougher parts also more frequently gave incomplete readings due to the curvature and height of abnormalities exceeding the range on the profilometer. Additionally, since this method only provided data for a three-inch, two-dimensional profile, it was not representative of the entire cast surface.
The Zygo Surface Profiler was also examined. This non-contact, three-dimensional profilometry method took a surface scan of a 1 centimeter diameter spot. The filtering functions for roughness and waviness appeared to be similar to the contact method. Much like the contact method, this method was found not to be feasible due to the very small surface area that the sample could cover on the part and the time it took to collect data.
B. Methods
A single surface of three sample castings was scanned manually using a Faro Edge scan arm. The scan data was saved as a point cloud text file and imported into Cloud Compare software for evaluation. The point clouds were not subsampled or manipulated prior to running the software. Two methods used for the initial evaluations of the surface included localized roughness(comparison of points to surrounding points) and shape fitting (comparison of points to best fit plane). Analysis was done within commercial software for the proof of concept.
C. Results
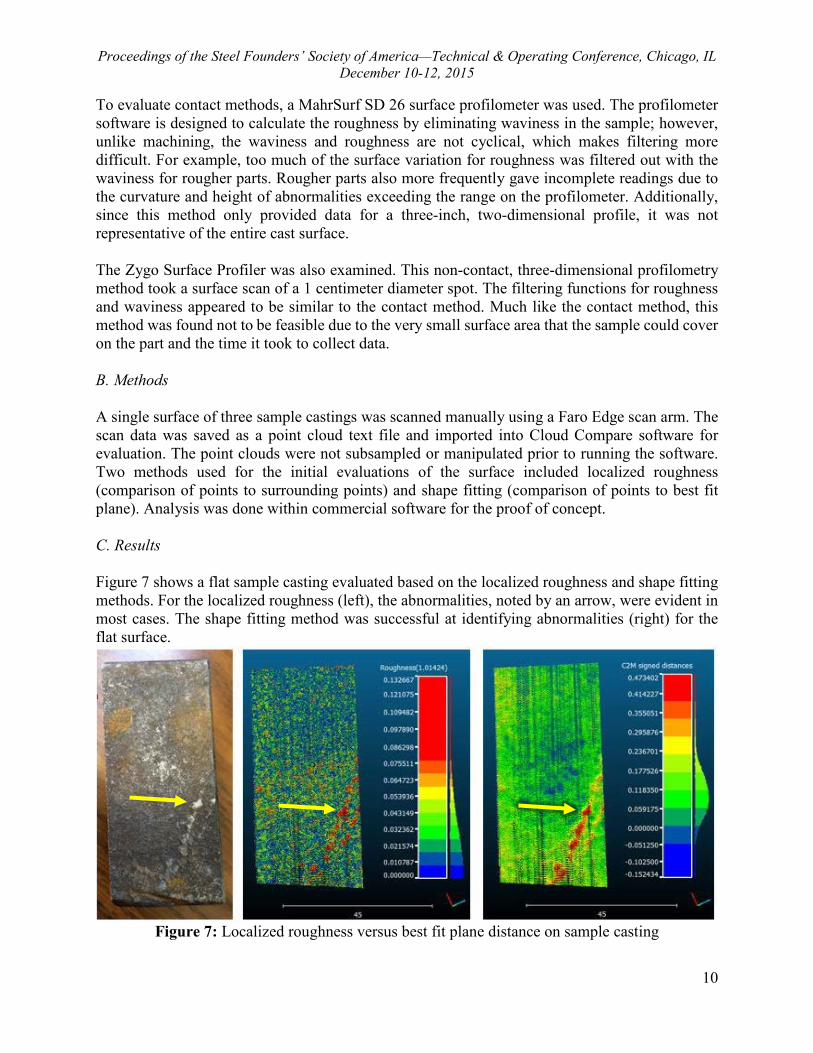
Figure 7 shows a flat sample casting evaluated based on the localized roughness and shape fittingmethods. For the localized roughness (left), the abnormalities, noted by an arrow, were evident in most cases. The shape fitting method was successful at identifying abnormalities (right) for the flat surface.
Figure 7: Localized roughness versus best fit plane distance on sample casting
Proceedings of the Steel Founders’ Society of America—Technical & Operating Conference, Chicago, ILDecember 10-12, 2015
11
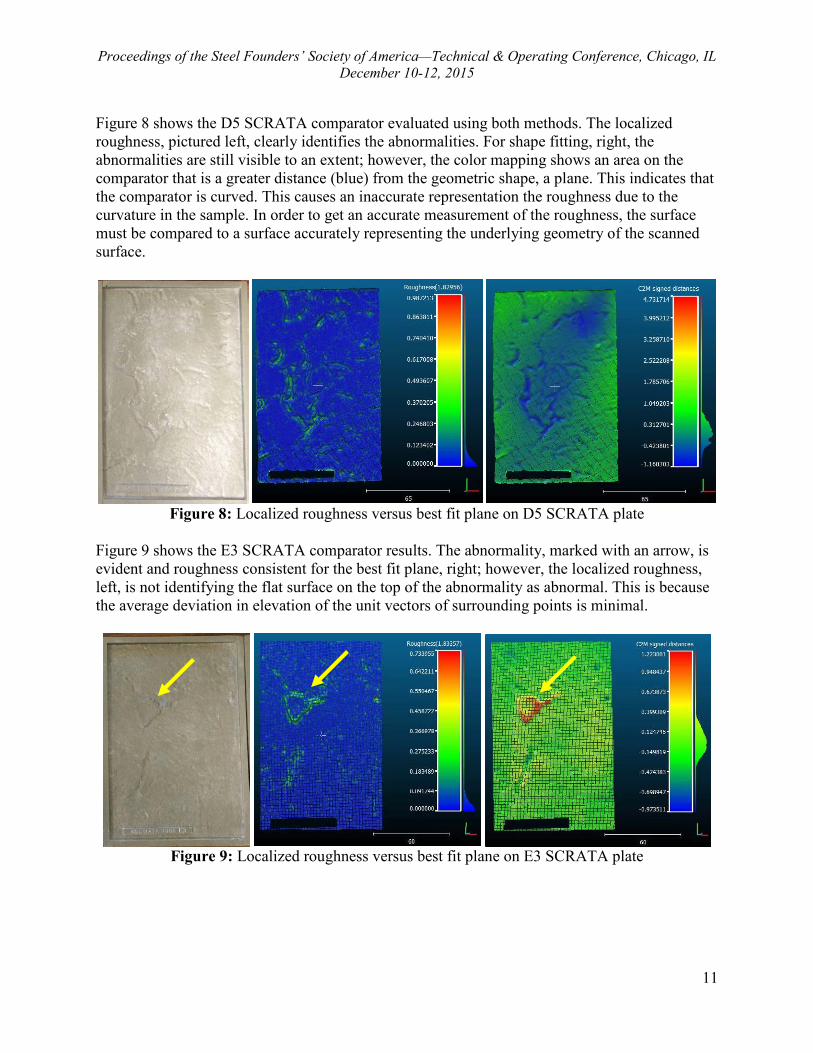
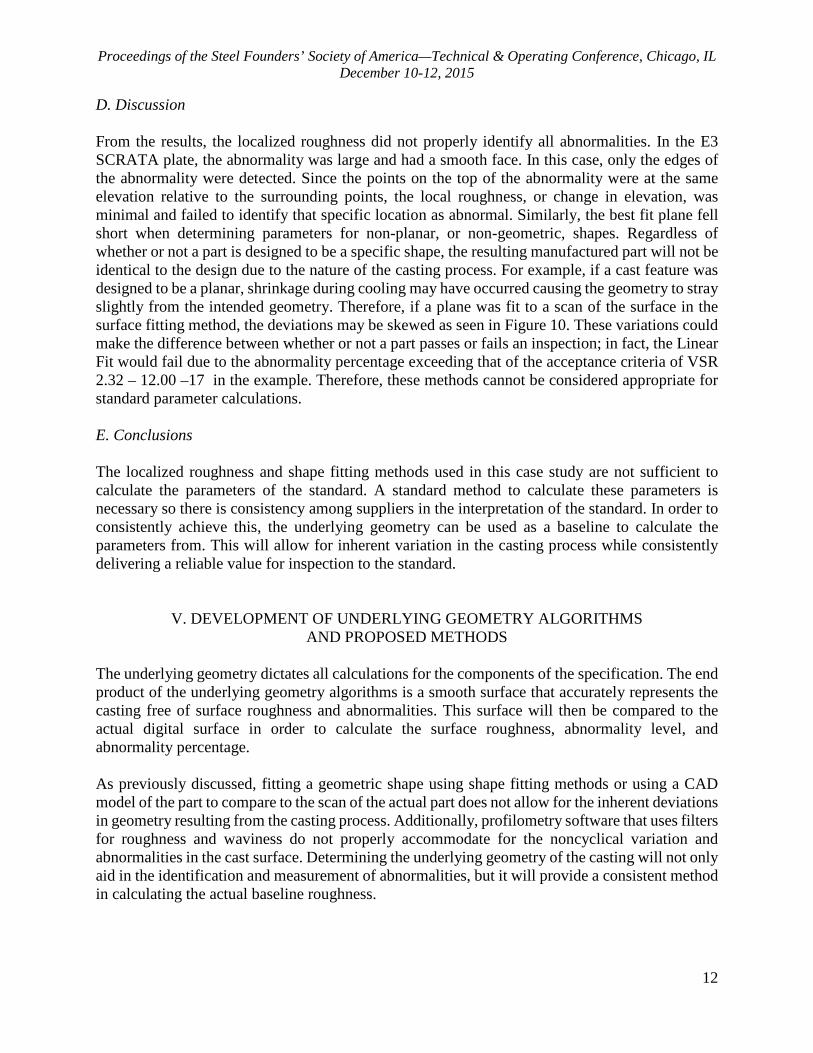
Figure 8 shows the D5 SCRATA comparator evaluated using both methods. The localized roughness, pictured left, clearly identifies the abnormalities. For shape fitting, right, the abnormalities are still visible to an extent; however, the color mapping shows an area on the comparator that is a greater distance (blue) from the geometric shape, a plane. This indicates that the comparator is curved. This causes an inaccurate representation the roughness due to the curvature in the sample. In order to get an accurate measurement of the roughness, the surface must be compared to a surface accurately representing the underlying geometry of the scanned surface.
Figure 8: Localized roughness versus best fit plane on D5 SCRATA plate
Figure 9 shows the E3 SCRATA comparator results. The abnormality, marked with an arrow, is evident and roughness consistent for the best fit plane, right; however, the localized roughness, left, is not identifying the flat surface on the top of the abnormality as abnormal. This is because the average deviation in elevation of the unit vectors of surrounding points is minimal.
Figure 9: Localized roughness versus best fit plane on E3 SCRATA plate
Proceedings of the Steel Founders’ Society of America—Technical & Operating Conference, Chicago, IL December 10-12, 2015
12
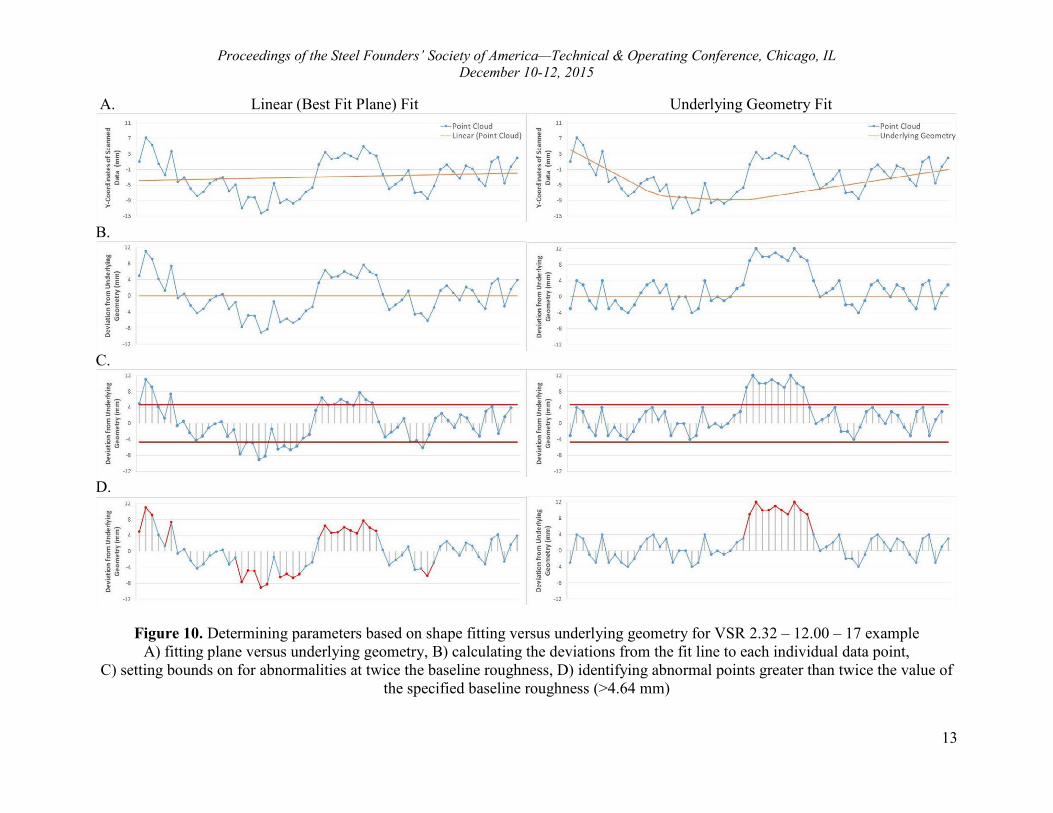
D. Discussion From the results, the localized roughness did not properly identify all abnormalities. In the E3 SCRATA plate, the abnormality was large and had a smooth face. In this case, only the edges of the abnormality were detected. Since the points on the top of the abnormality were at the same elevation relative to the surrounding points, the local roughness, or change in elevation, was minimal and failed to identify that specific location as abnormal. Similarly, the best fit plane fell short when determining parameters for non-planar, or non-geometric, shapes. Regardless of whether or not a part is designed to be a specific shape, the resulting manufactured part will not be identical to the design due to the nature of the casting process. For example, if a cast feature was designed to be a planar, shrinkage during cooling may have occurred causing the geometry to stray slightly from the intended geometry. Therefore, if a plane was fit to a scan of the surface in the surface fitting method, the deviations may be skewed as seen in Figure 10. These variations could make the difference between whether or not a part passes or fails an inspection; in fact, the Linear Fit would fail due to the abnormality percentage exceeding that of the acceptance criteria of VSR 2.32 – 12.00 –17 in the example. Therefore, these methods cannot be considered appropriate for standard parameter calculations. E. Conclusions The localized roughness and shape fitting methods used in this case study are not sufficient to calculate the parameters of the standard. A standard method to calculate these parameters is necessary so there is consistency among suppliers in the interpretation of the standard. In order to consistently achieve this, the underlying geometry can be used as a baseline to calculate the parameters from. This will allow for inherent variation in the casting process while consistently delivering a reliable value for inspection to the standard.
V. DEVELOPMENT OF UNDERLYING GEOMETRY ALGORITHMS AND PROPOSED METHODS
The underlying geometry dictates all calculations for the components of the specification. The end product of the underlying geometry algorithms is a smooth surface that accurately represents the casting free of surface roughness and abnormalities. This surface will then be compared to the actual digital surface in order to calculate the surface roughness, abnormality level, and abnormality percentage. As previously discussed, fitting a geometric shape using shape fitting methods or using a CAD model of the part to compare to the scan of the actual part does not allow for the inherent deviations in geometry resulting from the casting process. Additionally, profilometry software that uses filters for roughness and waviness do not properly accommodate for the noncyclical variation and abnormalities in the cast surface. Determining the underlying geometry of the casting will not only aid in the identification and measurement of abnormalities, but it will provide a consistent method in calculating the actual baseline roughness.
Proceedings of the Steel Founders’ Society of America—Technical & Operating Conference, Chicago, ILDecember 10-12, 2015
13
A. Linear (Best Fit Plane) Fit Underlying Geometry Fit
B.
C.
D.
Figure 10. Determining parameters based on shape fitting versus underlying geometry for VSR 2.32 – 12.00 – 17 example A) fitting plane versus underlying geometry, B) calculating the deviations from the fit line to each individual data point,
C) setting bounds on for abnormalities at twice the baseline roughness, D) identifying abnormal points greater than twice the value of the specified baseline roughness (>4.64 mm)
Proceedings of the Steel Founders’ Society of America—Technical & Operating Conference, Chicago, IL December 10-12, 2015
14
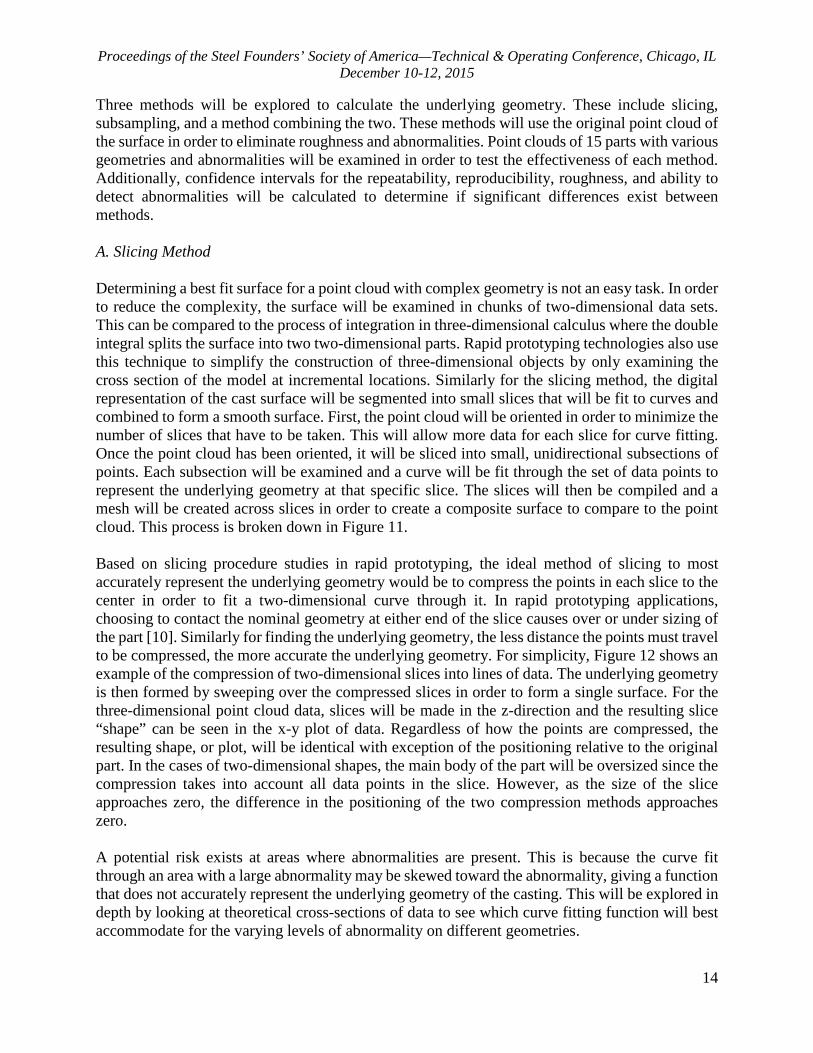
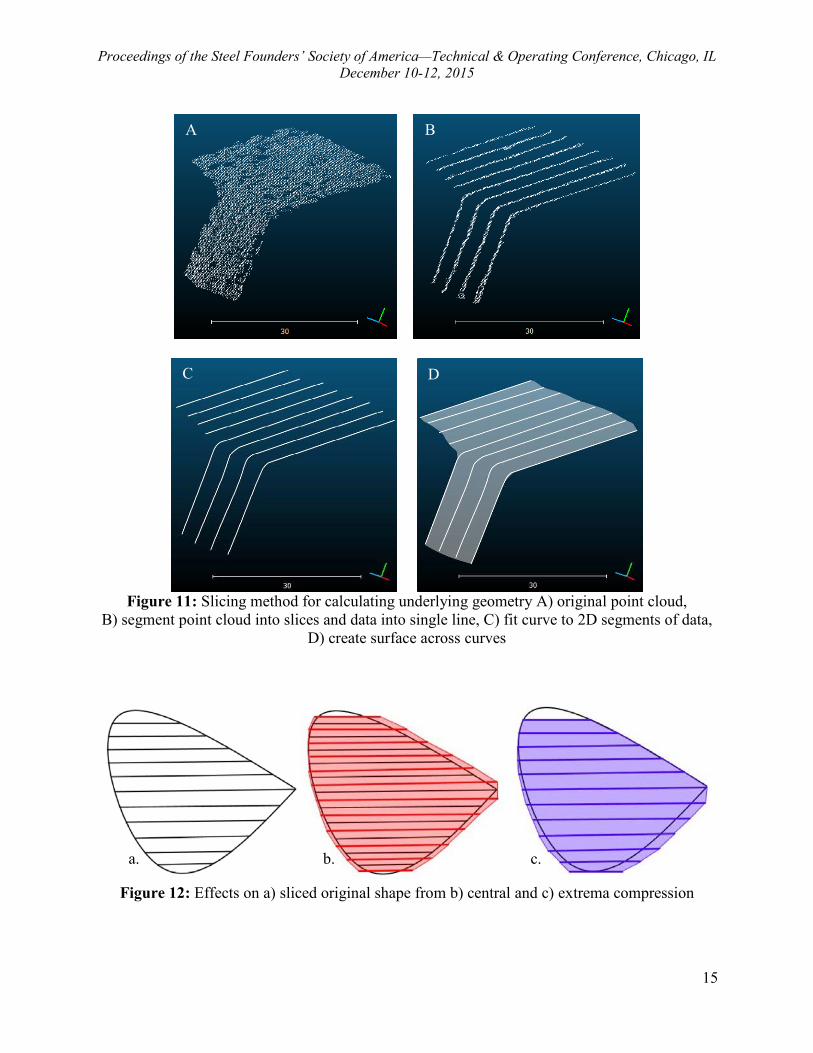
Three methods will be explored to calculate the underlying geometry. These include slicing, subsampling, and a method combining the two. These methods will use the original point cloud of the surface in order to eliminate roughness and abnormalities. Point clouds of 15 parts with various geometries and abnormalities will be examined in order to test the effectiveness of each method. Additionally, confidence intervals for the repeatability, reproducibility, roughness, and ability to detect abnormalities will be calculated to determine if significant differences exist between methods. A. Slicing Method Determining a best fit surface for a point cloud with complex geometry is not an easy task. In order to reduce the complexity, the surface will be examined in chunks of two-dimensional data sets. This can be compared to the process of integration in three-dimensional calculus where the double integral splits the surface into two two-dimensional parts. Rapid prototyping technologies also use this technique to simplify the construction of three-dimensional objects by only examining the cross section of the model at incremental locations. Similarly for the slicing method, the digital representation of the cast surface will be segmented into small slices that will be fit to curves and combined to form a smooth surface. First, the point cloud will be oriented in order to minimize the number of slices that have to be taken. This will allow more data for each slice for curve fitting. Once the point cloud has been oriented, it will be sliced into small, unidirectional subsections of points. Each subsection will be examined and a curve will be fit through the set of data points to represent the underlying geometry at that specific slice. The slices will then be compiled and a mesh will be created across slices in order to create a composite surface to compare to the point cloud. This process is broken down in Figure 11. Based on slicing procedure studies in rapid prototyping, the ideal method of slicing to most accurately represent the underlying geometry would be to compress the points in each slice to the center in order to fit a two-dimensional curve through it. In rapid prototyping applications, choosing to contact the nominal geometry at either end of the slice causes over or under sizing of the part [10]. Similarly for finding the underlying geometry, the less distance the points must travel to be compressed, the more accurate the underlying geometry. For simplicity, Figure 12 shows an example of the compression of two-dimensional slices into lines of data. The underlying geometry is then formed by sweeping over the compressed slices in order to form a single surface. For the three-dimensional point cloud data, slices will be made in the z-direction and the resulting slice “shape” can be seen in the x-y plot of data. Regardless of how the points are compressed, the resulting shape, or plot, will be identical with exception of the positioning relative to the original part. In the cases of two-dimensional shapes, the main body of the part will be oversized since the compression takes into account all data points in the slice. However, as the size of the slice approaches zero, the difference in the positioning of the two compression methods approaches zero. A potential risk exists at areas where abnormalities are present. This is because the curve fit through an area with a large abnormality may be skewed toward the abnormality, giving a function that does not accurately represent the underlying geometry of the casting. This will be explored in depth by looking at theoretical cross-sections of data to see which curve fitting function will best accommodate for the varying levels of abnormality on different geometries.
Proceedings of the Steel Founders’ Society of America—Technical & Operating Conference, Chicago, ILDecember 10-12, 2015
15
Figure 11: Slicing method for calculating underlying geometry A) original point cloud, B) segment point cloud into slices and data into single line, C) fit curve to 2D segments of data,
D) create surface across curves
Figure 12: Effects on a) sliced original shape from b) central and c) extrema compression
a. b. c.
A B
C D
Proceedings of the Steel Founders’ Society of America—Technical & Operating Conference, Chicago, ILDecember 10-12, 2015
16
B. Subsampling Method
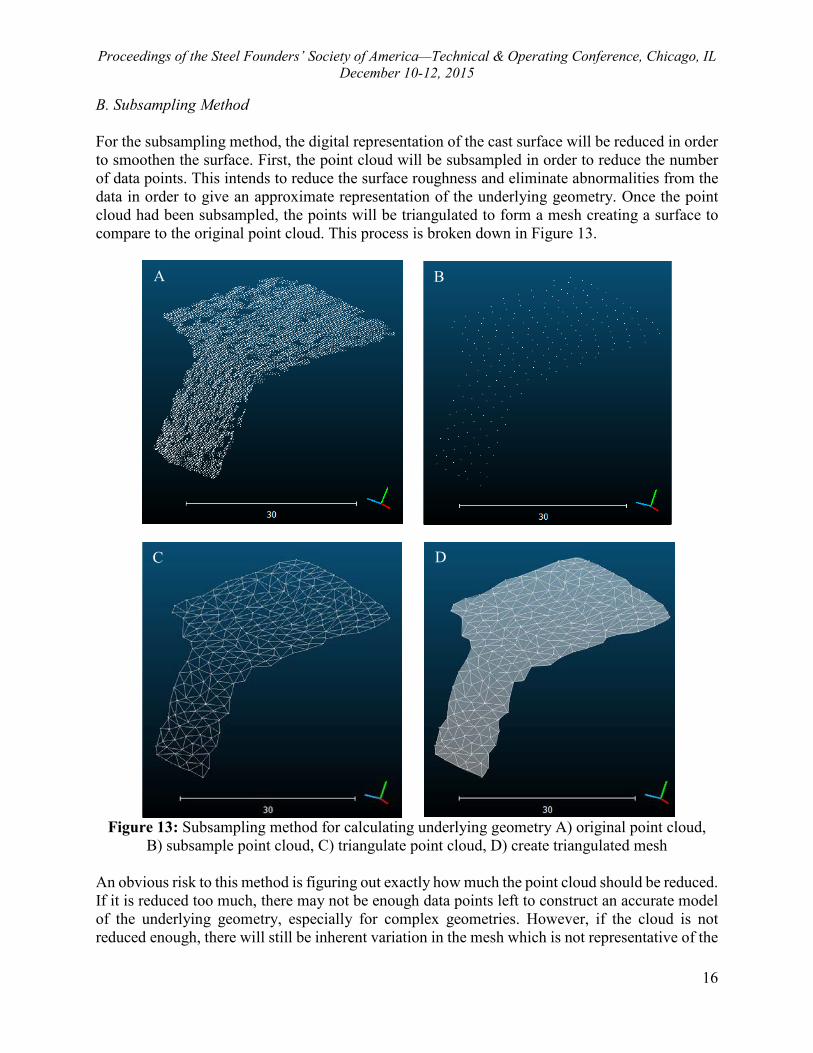
For the subsampling method, the digital representation of the cast surface will be reduced in order to smoothen the surface. First, the point cloud will be subsampled in order to reduce the number of data points. This intends to reduce the surface roughness and eliminate abnormalities from the data in order to give an approximate representation of the underlying geometry. Once the point cloud had been subsampled, the points will be triangulated to form a mesh creating a surface to compare to the original point cloud. This process is broken down in Figure 13.
Figure 13: Subsampling method for calculating underlying geometry A) original point cloud,
B) subsample point cloud, C) triangulate point cloud, D) create triangulated mesh
An obvious risk to this method is figuring out exactly how much the point cloud should be reduced. If it is reduced too much, there may not be enough data points left to construct an accurate model of the underlying geometry, especially for complex geometries. However, if the cloud is not reduced enough, there will still be inherent variation in the mesh which is not representative of the
A B
C D
Proceedings of the Steel Founders’ Society of America—Technical & Operating Conference, Chicago, IL December 10-12, 2015
17
underlying geometry, but more so a reduced roughness of a surface. Therefore, the point cloud must be reduced to a point density less than that of the original point cloud, or the mesh constructed based off of these points will be identical to that of the original surface. Also, if subsampled points are located on an abnormality, it will skew the underlying geometry for that location and cause issues when calculating abnormality levels since they will more likely be considered a part feature as opposed to an abnormality. C. Combined Method The combined method integrates the slicing and subsampling methods. First, the point cloud will be subsampled in order to reduce the noise in the data. Next the part will be oriented in order to minimize slices to maximize the length, or amount of data, of each individual slice. This is important because if the amount of data in the slice is too small, the fitted curve may not accurately represent the underlying geometry. After the part is oriented, it will be sliced in unidirectional slices. Each slice will then have a curve fit through it and the curves will be combined to create a surface function. After the curves are combined, a mesh will be formed over the top of the curve functions to create a composite surface to compare against the original point cloud. This method reduces the risk of the other two methods, but some risk still exists. Again, we have the issue with the thickness of the slices and the debate of whether or not the intermediary data points should be compressed centrally or to one end of the slice. Additionally, the slices should not exceed the point density of the original scanned part in order to encompass a sufficient amount of data in each slice to fit a curve.
VI. FUTURE WORK
To complete the development of the standard, a series of baseline roughness values and abnormality levels based on industry castings will be established to serve as a guideline when choosing acceptance criteria for a surface. Additionally, methods to collect and clean point cloud data for use in this standard are currently being developed to increase repeatability and reproducibility when calculating components of the VSR. This includes the continued development of algorithms for the underlying geometry of the scanned part. To examine each method for the determination of underlying geometry, the repeatability and reproducibility will be explored. Samples used for this study will include, at minimum, the following: three parts with no foreseen abnormalities with unique surface geometries to test the accuracy of the curve fitting element of the algorithms; three flat parts with varying levels of abnormalities to the test abnormality detection element of the algorithms; and three SCRATA plates and three industry samples to test the overall effectiveness of the algorithms. Future work includes exploring the feasibility of a semi-automated inspection process to enhance the visual inspection qualification process and verify acceptance of visually inspected surfaces.
Proceedings of the Steel Founders’ Society of America—Technical & Operating Conference, Chicago, IL December 10-12, 2015
18
VII. REFERENCES [1] Daricilar, G. Measurement Error of Visual Casting Surface Inspection. M.S. Thesis, Iowa State
University, 2005. [2] Eubanks, P. E. et al. Standard for the Visual Inspection of Casting Surfaces. Manual. Des
Plaines: Steel Founders' Society of America Alloy Casting Institute, 1969. [3] MSS. Quality Standard for Steel Castings for Valves, Flanges and Fittings and Other Piping
Components (Visual Method). Tech. no. SP-55. New York: Manufacturers Standardization Society of the Valve and Fittings Industry, 1961.
[4] ASTM International. Standard Practice for Steel Castings, Surface Acceptance Standards,
Visual Examination. Tech. no. A802/A802M-95. West Conshohocken: ASTM Int'l, 2006. [5] ASME. Surface Texture: Surface Roughness, Waviness and Lay. New York: American Society
of Mechanical Engineers, 2009. Print. ASME B46.1-2009. [6] International Standards Organization. Steel and iron castings –Visual examination of surface
quality. Tech. no. ISO 11971. 2008. [7] Brittish Standards Institution. Founding—Surface roughness inspection by visual tactile
comparators. Tech. no. BS EN 1370. Europe: European Committee for Standardizations, 2011.
[8] ASTM International. Standard Practice for Investment Castings, Surface Acceptance
Standards, Visual Examination. Tech. no. A997-08. West Conshohocken: ASTM Int'l, 2012. [9] Peters, Frank, Richard Stone, Kristopher Watts, et al. "Visual Inspection of Casting Surfaces."
AFS Transactions (2013): 45-52. [10] Liao, Y.-S., and Y.-Y. Chiu. "A New Slicing Procedure for Rapid Prototyping Systems." The
International Journal of Advanced Manufacturing Technology 18.8 (2001): 579-85.
Proceedings of the Steel Founders’ Society of America—Technical & Operating Conference, Chicago, IL December 10-12, 2015
19
VIII: APPENDIX Appendix 1: Draft Standard
Quantitative Inspection Acceptance Criteria for Cast Metal Surfaces
Designation: AXXX -15
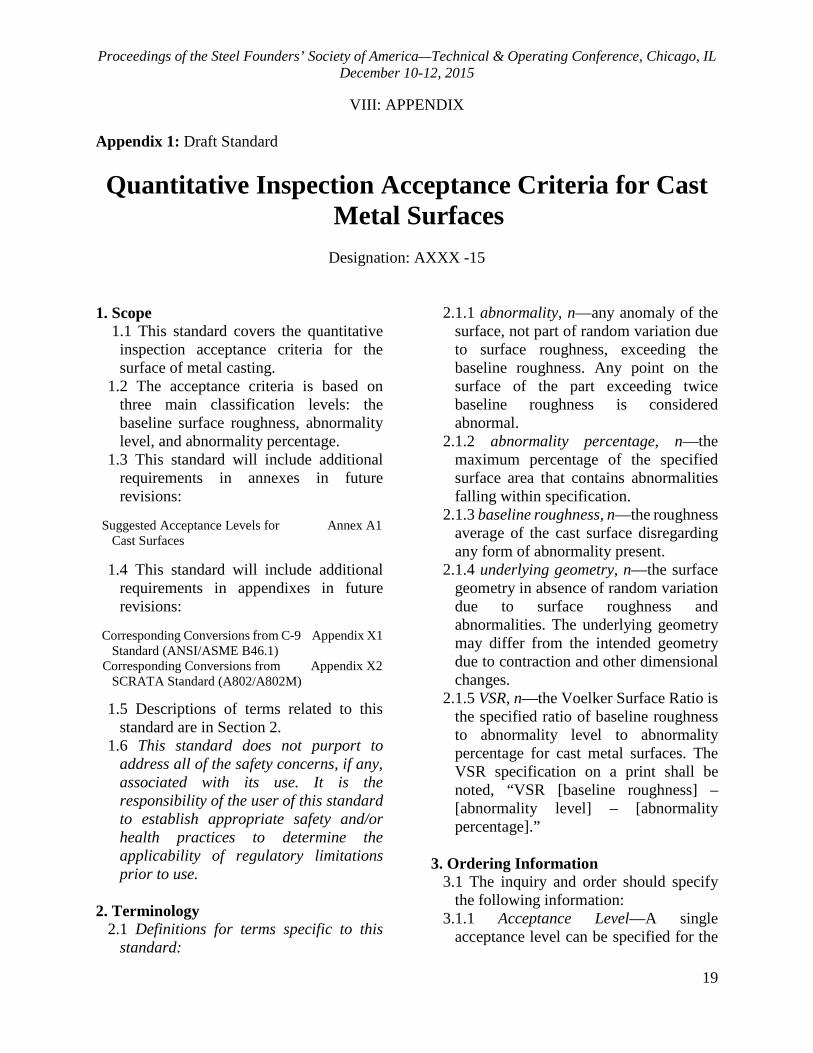
1. Scope 1.1 This standard covers the quantitative
inspection acceptance criteria for the surface of metal casting.
1.2 The acceptance criteria is based on three main classification levels: the baseline surface roughness, abnormality level, and abnormality percentage.
1.3 This standard will include additional requirements in annexes in future revisions:
Suggested Acceptance Levels for Annex A1 Cast Surfaces 1.4 This standard will include additional
requirements in appendixes in future revisions:
Corresponding Conversions from C-9 Appendix X1 Standard (ANSI/ASME B46.1) Corresponding Conversions from Appendix X2 SCRATA Standard (A802/A802M)
1.5 Descriptions of terms related to this standard are in Section 2.
1.6 This standard does not purport to address all of the safety concerns, if any, associated with its use. It is the responsibility of the user of this standard to establish appropriate safety and/or health practices to determine the applicability of regulatory limitations prior to use.
2. Terminology 2.1 Definitions for terms specific to this
standard:
2.1.1 abnormality, n—any anomaly of the surface, not part of random variation due to surface roughness, exceeding the baseline roughness. Any point on the surface of the part exceeding twice baseline roughness is considered abnormal.
2.1.2 abnormality percentage, n—the maximum percentage of the specified surface area that contains abnormalities falling within specification.
2.1.3 baseline roughness, n—the roughness average of the cast surface disregarding any form of abnormality present.
2.1.4 underlying geometry, n—the surface geometry in absence of random variation due to surface roughness and abnormalities. The underlying geometry may differ from the intended geometry due to contraction and other dimensional changes.
2.1.5 VSR, n—the Voelker Surface Ratio is the specified ratio of baseline roughness to abnormality level to abnormality percentage for cast metal surfaces. The VSR specification on a print shall be noted, “VSR [baseline roughness] – [abnormality level] – [abnormality percentage].”
3. Ordering Information 3.1 The inquiry and order should specify
the following information: 3.1.1 Acceptance Level—A single
acceptance level can be specified for the
Proceedings of the Steel Founders’ Society of America—Technical & Operating Conference, Chicago, IL December 10-12, 2015
20
entire casting surface, or multiple acceptance levels may be specified for different locations on a single part based on part function.
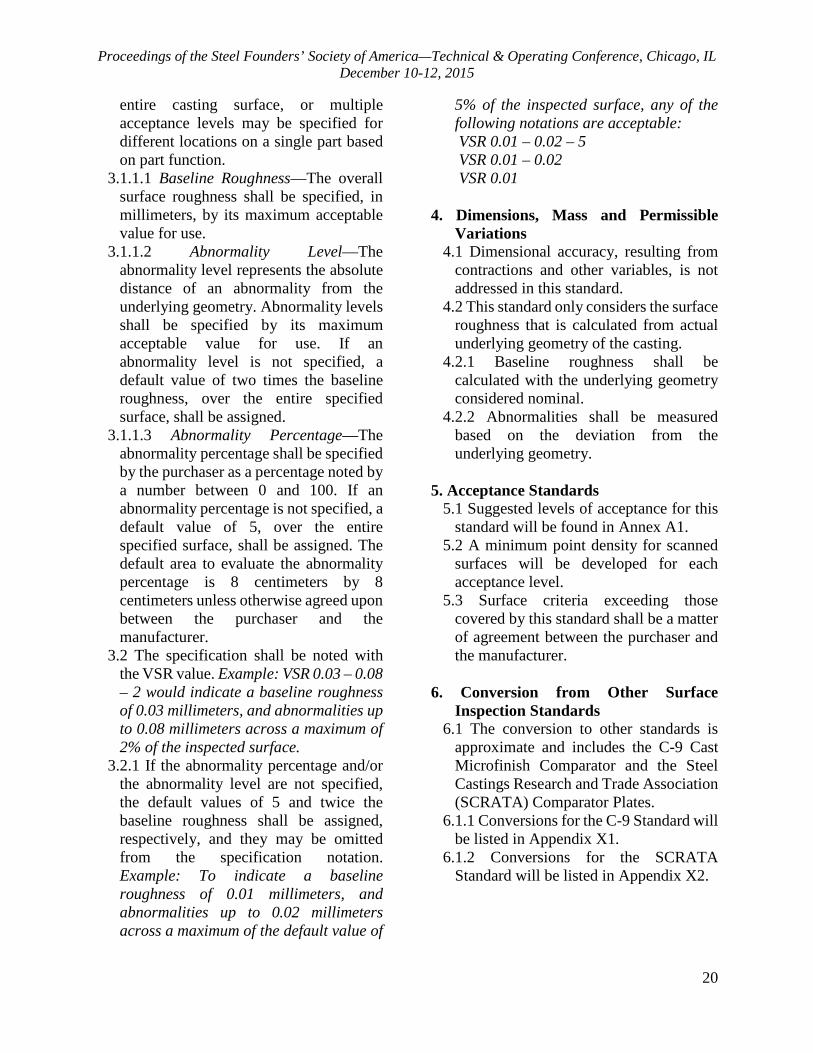
3.1.1.1 Baseline Roughness—The overall surface roughness shall be specified, in millimeters, by its maximum acceptable value for use.
3.1.1.2 Abnormality Level—The abnormality level represents the absolute distance of an abnormality from the underlying geometry. Abnormality levels shall be specified by its maximum acceptable value for use. If an abnormality level is not specified, a default value of two times the baseline roughness, over the entire specified surface, shall be assigned.
3.1.1.3 Abnormality Percentage—The abnormality percentage shall be specified by the purchaser as a percentage noted by a number between 0 and 100. If an abnormality percentage is not specified, a default value of 5, over the entire specified surface, shall be assigned. The default area to evaluate the abnormality percentage is 8 centimeters by 8 centimeters unless otherwise agreed upon between the purchaser and the manufacturer.
3.2 The specification shall be noted with the VSR value. Example: VSR 0.03 – 0.08 – 2 would indicate a baseline roughness of 0.03 millimeters, and abnormalities up to 0.08 millimeters across a maximum of 2% of the inspected surface.
3.2.1 If the abnormality percentage and/or the abnormality level are not specified, the default values of 5 and twice the baseline roughness shall be assigned, respectively, and they may be omitted from the specification notation. Example: To indicate a baseline roughness of 0.01 millimeters, and abnormalities up to 0.02 millimeters across a maximum of the default value of
5% of the inspected surface, any of the following notations are acceptable:
VSR 0.01 – 0.02 – 5 VSR 0.01 – 0.02 VSR 0.01 4. Dimensions, Mass and Permissible
Variations 4.1 Dimensional accuracy, resulting from
contractions and other variables, is not addressed in this standard.
4.2 This standard only considers the surface roughness that is calculated from actual underlying geometry of the casting.
4.2.1 Baseline roughness shall be calculated with the underlying geometry considered nominal.
4.2.2 Abnormalities shall be measured based on the deviation from the underlying geometry.
5. Acceptance Standards 5.1 Suggested levels of acceptance for this
standard will be found in Annex A1. 5.2 A minimum point density for scanned
surfaces will be developed for each acceptance level.
5.3 Surface criteria exceeding those covered by this standard shall be a matter of agreement between the purchaser and the manufacturer.
6. Conversion from Other Surface
Inspection Standards 6.1 The conversion to other standards is
approximate and includes the C-9 Cast Microfinish Comparator and the Steel Castings Research and Trade Association (SCRATA) Comparator Plates.
6.1.1 Conversions for the C-9 Standard will be listed in Appendix X1.
6.1.2 Conversions for the SCRATA Standard will be listed in Appendix X2.
Proceedings of the Steel Founders’ Society of America—Technical & Operating Conference, Chicago, IL December 10-12, 2015
21
7. Keywords 7.1 castings; inspection standards;
quantitative 8. Supplemental Requirements The following supplementary requirements
shall apply only when specified by the purchaser in the purchase order or contract.
8.1 Unusual visual conditions are not addressed by this standard.
8.1.1 Unusual visual conditions include discoloration and evidence of rework.
8.1.2 Unusual visual conditions shall be a matter of agreement between the purchaser and the manufacturer.
8.2 Chaplets, or inserts, are not permissible under this standard.
8.2.1 Requirements pertaining to chaplets or inserts shall be a matter of agreement between the purchaser and the manufacturer.