Embed Size (px)
DESCRIPTION
Sustainable Building Assessment Tools have not yet measured the association between user satisfactionwith adaptive behavior and energy efficiency. The current research aims to rectify this problem by testingthe hypothesis that user satisfaction with adaptive behavior affects building energy consumption. To testthe hypothesis, the staff’s overall satisfaction with adaptive behavior in response to tenant energyefficiencyfeatures was used as the independent variable, while office unit energy consumption was usedas the dependent variable. A set of conceptual variables and measured variables were identified for boththe dependent and independent variables. A total of nine possible combinations of measured variableswere investigated through a survey fielded in ten office units. The survey analysis determined that thebuilding users are not satisfied with the tenant energy efficiency features and that they may adapt theindoor environment cooling and lighting qualities. An expert input study was conducted to validate theresults with respect to the hypothesis. Seven experts who had experience in building assessments wereinvited to participate in the input study. Grounded group decision making analysis method confirmed thehypothesis testing results. The research results indicated that user adaptive behaviors directly affectbuilding energy performance. Sustainable Building Assessment Tool developers along with energyefficient building design consultants and contractors could make use of these research findings.
Citation preview
70:7 (2014) 89–97 | www.jurnalteknologi.utm.my | eISSN 2180–3722 |
Full paper Jurnal
Teknologi
Correlation Study on User Satisfaction from Adaptive Behavior and Energy Consumption in Office Buildings Ali Keyvanfar
a*, Arezou Shafaghat
a, Mohd Zaimi Abd Majid
a, Hasanuddin Lamit
b, Kherun Nita Ali
c
aConstruction Research Center (CRC), construction Research Alliance (CRA), Universiti Teknologi Malaysia, 81310 UTM Johor Bahru, Johor, Malaysia bCenter of Built Environment in the Malays World (KALAM), Faculty of Built Environment, Universiti Teknologi Malaysia, 81310 UTM Johor Bahru, Johor, Malaysia cDepartment of Quantity Survey, Faculty of Built Environment, Universiti Teknologi Malaysia, 81310 UTM Johor Bahru, Johor, Malaysia
*Corresponding author: [email protected]
Article history
Received :1 May 2014 Received in revised form :
14 September 2014
Accepted :1 Oktober 2014
Graphical abstract
Graphical abstract
Abstract
Sustainable Building Assessment Tools have not yet measured the association between user satisfaction with adaptive behavior and energy efficiency. The current research aims to rectify this problem by testing
the hypothesis that user satisfaction with adaptive behavior affects building energy consumption. To test
the hypothesis, the staff’s overall satisfaction with adaptive behavior in response to tenant energy-efficiency features was used as the independent variable, while office unit energy consumption was used
as the dependent variable. A set of conceptual variables and measured variables were identified for both
the dependent and independent variables. A total of nine possible combinations of measured variables were investigated through a survey fielded in ten office units. The survey analysis determined that the
building users are not satisfied with the tenant energy efficiency features and that they may adapt the
indoor environment cooling and lighting qualities. An expert input study was conducted to validate the results with respect to the hypothesis. Seven experts who had experience in building assessments were
invited to participate in the input study. Grounded group decision making analysis method confirmed the
hypothesis testing results. The research results indicated that user adaptive behaviors directly affect building energy performance. Sustainable Building Assessment Tool developers along with energy
efficient building design consultants and contractors could make use of these research findings.
Keywords: Social sustainability; building assessment; energy efficiency; energy performance; user
satisfaction; adaptive behavior, group decision making
© 2014 Penerbit UTM Press. All rights reserved.
1.0 INTRODUCTION
Researchers on ‘sustainability managerial techniques in building
construction practice’ manage the implementation of
sustainability methods and techniques in building practice. This
implementation is performed with the aid of four sustainability
methods and techniques, including (a) governmental status, (b)
building codes, (c) private and professional associations or Non-
Governmental Organizations (NGOs), and (d) marketing
strategies1. Of these, the largest contributor to enhanced
sustainability in building practices is the private and professional
associations, including NGOs1. NGOs have mainly implemented
multi-perspective ‘Building assessment tools’ to enhance the
sustainability of building practices in specific regional areas2,3.
In the building construction industry, assessment tools are
specifically used to benchmark the enhancement of sustainability
in building practices4,5,6. The use of assessment tools is a
contribution of ‘Managing Sustainability’ to the building
construction industry. These tools are traditionally referred to as
‘Environmental building assessment tools’ or ‘Green building
assessment tools’ and are more recently referred to as ‘Sustainable
building assessment tools’.
Building assessment tools mainly aim to benchmark a
‘Capacity Building’ as a sustainable building case (i.e., social,
economic, and environmental building) in a specific geographic
region. This assessment includes existing buildings as well as new
buildings across diverse functionalities, such as office buildings,
residential buildings, commercial buildings, etc.7 These tools
involve a variety of facets of sustainability assessment, including
energy efficiency, water management, waste management, land
use, etc.1 Basically, these features cover the
greenery/environmental issues, along with consideration of the
economically and socially sensitive approaches. To improve the
usability of tools within a building lifecycle, the assessment may
benchmark a building’s ‘sustainability’ in design phase,
construction phase, operational phase, and/or demolition phase7.
According to Haapio and Viitaniemi7, the end users of these
assessment tools could be architects, engineers, facility managers,
building owners, consultants, authority, contractor, and/or
academic researchers. The academic researchers use the
90 Ali Keyvanfar et al. / Jurnal Teknologi (Sciences & Engineering) 70:7 (2014), 89–97
sustainable building assessment tools indirectly as decision
support tools to meet the requirements of building sustainability
accreditation8.
There are some efforts being undertaken by ‘Standards’ to
establish standardized requirements for building assessment tools.
The International Organization for Standardization (ISO)9,10
investigates features of assessments to develop a harmonized
standard to measure the sustainability. The ASHRAE-55
standard11 measures the correlation between indoor thermal
environmental parameters (temperature, thermal radiation,
humidity, and air speed) and user parameters (clothing insulation
and metabolism rate). The use of the ASHRAE-55 standard11 aids
building energy managers in providing thermal environmental
conditions acceptable to a majority of users12. The EN15251
standard13 establishes environmental input parameters for the
design and energy performance calculations of non-industrial
buildings, such as office buildings12. Recently, the Temperature
Limits guideline (ATG) was developed, which is an alternative to
the Weighted Temperature Exceeding Hours method (GTO). The
ATG has the flexibility to make recommendations for various
types of buildings, including naturally ventilated buildings and
mechanically conditioned buildings with sealed facades12.
Additionally, the Construction Related Sustainability Indicators
Project (CRISP) is a thematic network of sustainability indicators
for construction and cities that have been developed based on a
review of all the existing tools.
Since the early 1990s, approximately sixty ‘Sustainable
Building Assessment Tools’ have been established, such as the
Building Research Establishment Environmental Assessment
Method (BREEAM), Leadership in Energy and Environmental
Design (LEED), Sustainable Building tool (SBtool), Green Mark
Scheme, and the Green Building Index (GBI). These tools aid to
enhance the building construction industry in ‘managing
sustainability’. However, there are some shortcomings in the
performance of these tools. Abdalla et al.1 mentioned these tools
are not accurate in the estimation of the energy consumption
because they do not address the sustainability programs of end-
users. Christensen2 stated that social sustainability criteria
including ‘user satisfaction’ and ‘development impact on
community’ must be considered in sustainable building
assessment tools.
Sustainable building assessment tools evaluate user
satisfaction with diverse dimensions, including building
architectural design, building value management, building asset
management, real estate management, and construction
management. However, user satisfaction has been analyzed
independent of the Indoor Environmental Quality (IEQ) energy
efficiency practices3. Indeed, user satisfaction criterion should be
evaluated in conjunction with energy efficiency to reduce
operating, occupancy, and maintenance costs for owners and
tenants, while simultaneously enhancing environment
preservation4. Indeed, enhancing energy efficiency at buildings
may reduce greenhouse gas emissions and address issues related
to climate change and global warming4.
Yu et al.7 stated that the behavior and activities of building
occupants can affect energy consumption in a building, along with
six other factors, including Climate, Building-related
characteristics, User-related characteristics (excluding social and
economic factors), Building services systems and operation,
Social and economic factors, and Indoor Environmental Quality
(IEQ). However, the ‘behavior and activities of building
occupants’ has yet to be integrated with building assessment tool
development8. Among the diverse behaviors and activities of
occupants, ‘adaptive behavior’ is a measure of user satisfaction
that may enhance an energy program9,10,11,12. Brager and de Dear13
define user adaptive behavior as all activities to ‘fit’ the indoor
climate to individual or collective requirements. Liu et al.12 stated
that adaptive behavior can be conscious or unconscious, while
multiple environmental factors can affect it (e.g., climate, culture
and economics). Contextual factors and the user’s surroundings
may have a conscious and positive impact on his/her behavior14.
Contextual factors provide ‘adaptive opportunities’15 and
‘adaptive constraints’16. Tabak and de Vries17 divided staff
behavior activities into skeleton activities and intermediate
activities. Tabak and de Vries17 defined skeleton activities as
those that fulfill the requirements of the job descriptions of the
staff (e.g., chairing meetings, giving lessons, etc.) and
intermediate activities as those that fulfill the psychological and
physical requirements of the staff (e.g., getting a drink).
Intermediate activities are often non-scheduled activities, while
skeleton are often scheduled activities.
2.0 THE ABSENCE OF USER SATISFACTION
MEASUREMENT IN SUSTAINABLE BUILDING
ASSESSMENT TOOLS
There are some shortcomings with the sustainable building
assessment tools described and used by the researchers in the
available literature. Abdalla et al.1 indicated that the building
assessment tools do not accurately in estimate building energy
consumption because they do not consider end-user sustainability
programs. Christensen2 stated that the social sustainability criteria
such as ‘user satisfaction’ and ‘development impact on
community’ need to be considered more in the tools.
Reviewing the literature in diverse disciplines indicates that
the user satisfaction has been analyzed independent of the
environmental and economic aspects of sustainable building
practices12. Among the various factors that affect energy
consumption in a building, the research on ‘building-user
behavior and activities’ was not sufficiently investigated13.
Among the diverse types of building-user behavior and activities,
‘adaptive behavior’ is a measure of user satisfaction that may
enhance an energy program14,15,16,17. Dibra et al.18, Eang19, and
Yun and Steemers18 stated that building-user behavior and
activities is the most common cause of fluctuation in the actual
energy consumption relative to planned energy consumption.
Wilkinson et al.4 stated that research on ‘user satisfaction from
adaptive behavior’ in building energy estimation was not yet
mature. In fact, user satisfaction from adaptive behavior is not yet
included in the index formulas of the sustainable building
assessment tools. Linking energy consumption with building-user
behavior and activities may potentially aid building facility
managers in optimizing, and somewhat, reducing their energy
usage.
Although some efforts are being undertaken by standards
organizations, such as the International Organization for
Standardization9,10 and the American Society of Heating,
Refrigerating and Air Conditioning Engineers (ASHRAE)11 to
establish standardized requirements for sustainable building
assessment tools, the capacity to measure user satisfaction with
adaptive behavior still remains a significant issue.
To date, various methods and models have been used and/or
developed for sustainable building assessment tools to measure
user satisfaction in energy-efficient buildings. However, these
user satisfaction index analysis methods and models cannot
measure the user satisfaction with adaptive behavior.
In this regard, the current research planned to explore the
correlation between user satisfaction from adaptive behavior and
building energy consumption to be applied in sustainable building
assessment tools. The research establishes a user satisfaction from
adaptive behavior to capture the overall cognitive experience of
91 Ali Keyvanfar et al. / Jurnal Teknologi (Sciences & Engineering) 70:7 (2014), 89–97
the staff in building energy consumption. This research focuses on
models and methods of data collection on user satisfaction in the
design phase of the building lifecycle.
2.1 Effects of Building User to Energy Performances
Chung20, Roetzel et al.21, and Yun and Steemers22 stated that the
‘behavior and activities of building occupants (i.e., users)’ is the
most common cause of fluctuation in actual energy consumption
relative to planed energy consumption. Jackson38, in his review
paper, highlighted previous studies that developed various models
or simulation programs to measure and predict users’ differing
energy consumption behavioral patterns. Studies of the impact of
user behavior and interaction with building systems on energy
consumption have increased the knowledge and understanding of
building performance. Eang19 defined ‘tenant’ and ‘land lord’s
energy consumption features’. The landlord’s consumption
includes all the energy consumption occurring in common areas
for cooling, lighting, or any other purpose. The land-lord energy
consumption features are less dependent on the tenancy rate, and
building users commonly do not have control over these features.
The energy consumption of tenants occurs mainly in the areas
where energy consumption depends on the tenancy rate and the
behavior of tenants. The consumption of tenants include energy
consumption from:
Lighting systems,
Cooling systems,
Building facilities (e.g., elevator),
Work equipment (e.g., printers, and computers).
As a consequence, while these advances are compelling,
incorporating the attitude and self-sufficiency habits of users23 and
the ‘Voluntary Simplicity’ approach24, both of which potentially
have large implications for energy consumption, remains as a
critical challenge. Adaptive behavior might take the form of
adopting an energy-saving life style; however, based on the
research of Sorrell et al.25, such behavior may result in poor
consumption habits due to the ‘rebound effect’. Jackson26
indicated that ‘green’ social marketing campaigns and financial
incentives can avoid such rebound effects. Azar and Menassa27
and Allsop et al.28 addressed the ‘word of mouth’ effect, which is
considered to be a very influential channel of green
communication based on the research of Harrison-Walker29.
The above-mentioned techniques are qualitative techniques
for achieving appropriate life style change through the
implementation of adaptive behavior. A review of the literature in
the field that discusses studies and simulations of building-user
adaptive behavior confirm that this type of awareness can
significantly influence building energy use26,28.
Interaction between user behavior and building systems for
energy consumption has increased the knowledge and
understanding of building performance. Eang19 stated that it is
possible to save a significant amount of energy by improving
building design. Cole et al. 30 reported a manifesto from the
Passive and Low Energy Architecture–PLEA31 conference. They
stated that the building user can reduce energy consumption by
• Including ‘social and ethical challenges’ in building
energy efficiency program.
• Considering the ‘dynamic and responsible’ involvement
of the user and the designer in the architecture design
phase of the building project.
Andersen et al.32 identified ‘user control’ as an important
factor for energy efficiency. To avoid energy-wasting behavior,
Maaijen et al.33 described the need to deploy energy effectively to
provide comfort only in those locations where it is needed. To
achieve this effective deployment conveniently, Heating,
Ventilation, and Air Conditioning (HVAC) systems must adapt
automatically to comfort levels of actual individuals. Maaijen et
al.33 proposed a method where the user is involved in the control
loop, called the ‘human in the loop approach’. In this approach,
the human is taken as the leading factor in the design and control
of HVAC systems, which can reduce energy consumption on
cooling demand by 40% of the total energy demand.
In addition, several software simulation models have been
created to predict user behavior and improve the performance of
design. These models are designed “…to help researchers
exploring relationships between building users and building
performance variables”34. Hoes et al.35 indicated that the behavior
component of these models is usually based on empirical data.
The users of simulation models usually attempt to simplify the
occupant activities; however, it is important to consider all the
complexities involved36. Yao et al.37 stated that these models do
not include a comprehensive list of the occupant activities.
Eang19 identifies ‘tenant’ and ‘land lord’ energy consumption
features. The landlord’s consumption includes all the energy
consumption occurring in common areas for cooling, lighting, or
any other purposes. Land-lord energy consumption features are
less dependent on the tenancy rate, and building users commonly
do not have control over these features. The tenants’ consumption
is mainly in the areas where energy consumption depends on the
tenancy rate and tenant’s behavior. Tenants’ consumption
includes energy consumption in: Lighting systems, Cooling
systems, Building facilities (e.g., elevators), and Work equipment
(e.g., printers and computers).
2.2 Importance of Enhancing Energy Efficient Building
Practices
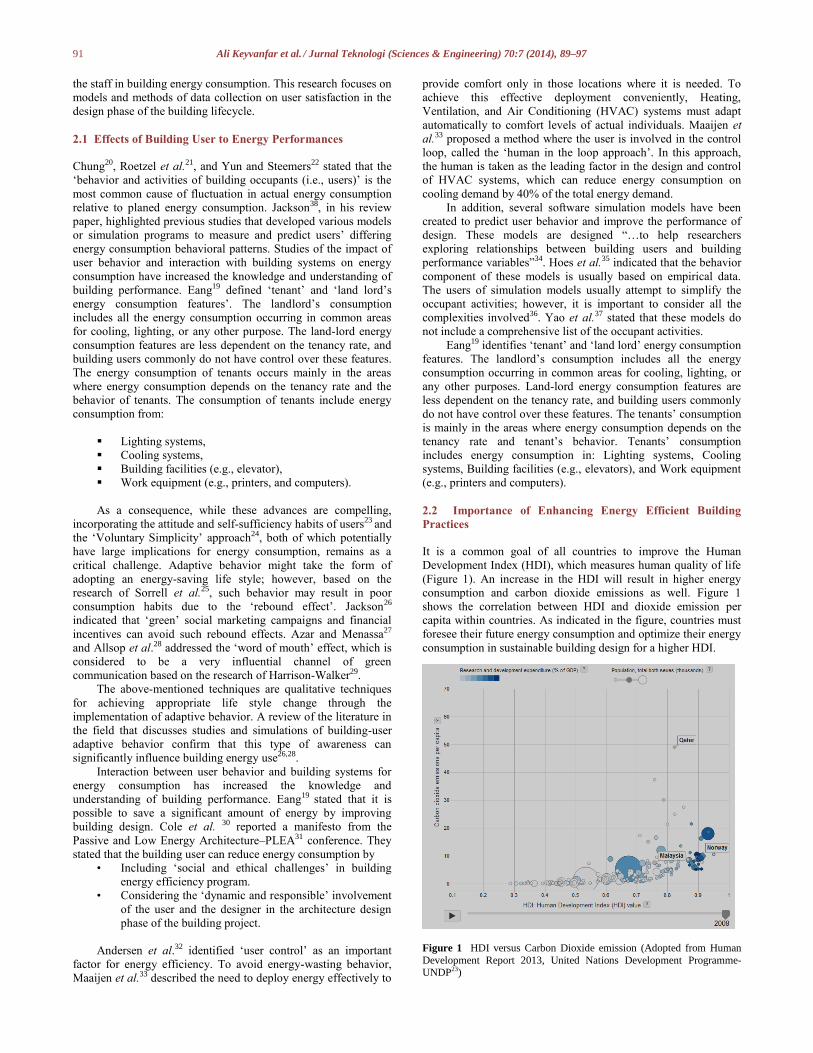
It is a common goal of all countries to improve the Human
Development Index (HDI), which measures human quality of life
(Figure 1). An increase in the HDI will result in higher energy
consumption and carbon dioxide emissions as well. Figure 1
shows the correlation between HDI and dioxide emission per
capita within countries. As indicated in the figure, countries must
foresee their future energy consumption and optimize their energy
consumption in sustainable building design for a higher HDI.
Figure 1 HDI versus Carbon Dioxide emission (Adopted from Human
Development Report 2013, United Nations Development Programme- UNDP23)
92 Ali Keyvanfar et al. / Jurnal Teknologi (Sciences & Engineering) 70:7 (2014), 89–97
In summary, the reviewed literature indicated that user
satisfaction was not dependently incorporated with energy
efficiency in sustainable building assessment tools. In particular,
effects of ‘user satisfaction with adaptive behavior’ on building
energy consumption were not yet established7. Zhang and
Barrett39 stated that “there are no published studies that test if the
design of a sustainable building can have a positive influence on
pro-environmental behavior of a transient population within that
space”.
In this regard, this research investigates the correlation
between building-user satisfaction with adaptive behavior and
energy efficiency. Based on established definitions of adaptive
behavior in an energy efficient building, this study defines
adaptive behavior as behavior that expresses the personal or
environmental adjustment of users in response to the following
conditions of the indoor environment:
• Off-time running of energy consuming systems.
• Slightly uncomfortable indoor environmental conditions
that are not considered unacceptable by users.
In this study, ‘adaptive behavior’ refers only to the
technological and personal aspects of adaptation. Psychological
and physiological adaptation are not covered. Because
psychological adaptation is dynamic, it cannot be forecast
accurately in design phase of project life cycle. It is obvious from
laws of causality that ‘physiological’ adaptation is a prime mover
(i.e., cause) of ‘Technological’ and ‘Personal’ adaptation (i.e.,
effect). Indeed, measuring dissatisfaction with ‘Technological’
and ‘Personal’ adaptation eliminates dissatisfaction from
‘Physiological’ adaptation13.
Based on the issues discussed, this research defined a 'null
hypothesis' and ‘alternative hypothesis’ to investigate the
observed problem. The null hypothesis is:
H0, ‘Building-user satisfaction with adaptive behavior does not
have an effect on building energy consumption’ (r =0).
While the alternative hypothesis is:
H1, ‘Building-user satisfaction with adaptive behavior affects
building energy consumption’ (r0).
3.0 HYPOTHESIS TESTING
The research conducted hypothesis testing through a survey to
determine if it is appropriate to reject the null hypothesis because
of the validity of the alternative hypothesis. In this study, the Type
I error ‘’ is set at 0.05; correspondingly, the p-value of less than
0.05 is considered as an acceptable result to reject the null
hypothesis.
A structured fixed format questionnaire was designed to
collect data, within which, the conceptual variables, independent
variables, dependent variables, and control variables were been
indicated. The staff’s overall satisfaction with adaptive behavior
in response to tenant energy efficiency features was the
independent variable. Office unit energy consumption was the
dependent variable. The conceptual variables corresponding to the
dependent variable and the independent variables are as follows:
1) Independent variables in the survey instrument:
The conceptual variables of the independent variable are as
follows:
• The staff’s overall satisfaction with adaptive behavior in
response to an energy efficient cooling system,
• The staff’s overall satisfaction with adaptive behavior in
response to an energy efficient lighting system,
• The staff’s overall satisfaction with adaptive behavior in
response to an energy efficient building facility (e.g., an
elevator),
• The staff’s overall satisfaction with adaptive behavior in
response to energy efficient work equipment.
The measurement of the independent variable used the following
categories:
• ‘DS’ for Dissatisfied,
• ‘N’ for neutral, and
• ‘S’ for satisfied.
The control variables are described in the below.
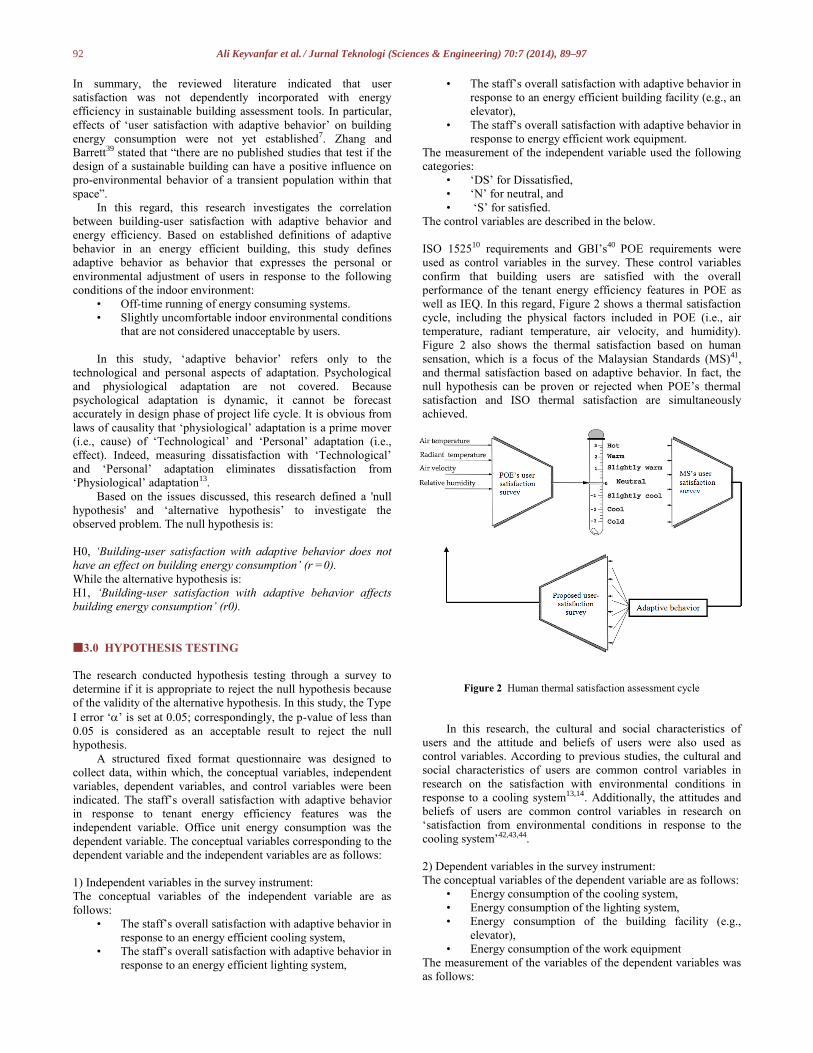
ISO 152510 requirements and GBI’s40 POE requirements were
used as control variables in the survey. These control variables
confirm that building users are satisfied with the overall
performance of the tenant energy efficiency features in POE as
well as IEQ. In this regard, Figure 2 shows a thermal satisfaction
cycle, including the physical factors included in POE (i.e., air
temperature, radiant temperature, air velocity, and humidity).
Figure 2 also shows the thermal satisfaction based on human
sensation, which is a focus of the Malaysian Standards (MS)41,
and thermal satisfaction based on adaptive behavior. In fact, the
null hypothesis can be proven or rejected when POE’s thermal
satisfaction and ISO thermal satisfaction are simultaneously
achieved.
Figure 2 Human thermal satisfaction assessment cycle
In this research, the cultural and social characteristics of
users and the attitude and beliefs of users were also used as
control variables. According to previous studies, the cultural and
social characteristics of users are common control variables in
research on the satisfaction with environmental conditions in
response to a cooling system13,14. Additionally, the attitudes and
beliefs of users are common control variables in research on
‘satisfaction from environmental conditions in response to the
cooling system’42,43,44.
2) Dependent variables in the survey instrument:
The conceptual variables of the dependent variable are as follows:
• Energy consumption of the cooling system,
• Energy consumption of the lighting system,
• Energy consumption of the building facility (e.g.,
elevator),
• Energy consumption of the work equipment
The measurement of the variables of the dependent variables was
as follows:
93 Ali Keyvanfar et al. / Jurnal Teknologi (Sciences & Engineering) 70:7 (2014), 89–97
• ‘E+’ for an increase in energy consumption from the
expected energy consumption,
• ‘E’ for the same energy consumption as expected,
• ‘E-‘ for a decrease in energy consumption from the
expected energy consumption
Control variables related to the dependent variable are as follows:
The validity of observation, as a control variable, was confirmed
using the Building Energy Management System (BEMS).
In the developing user satisfaction adaptive behavior criteria
based on the reviewed literature, two additional control variables
have been considered: users’ cultural and social characteristics
and users’ attitude and beliefs. This research used these variables
as the control variables in the investigation into the relationship
between user satisfaction with adaptive behavior and the energy
consumption of a building.
Users’ Cultural and Social Dimensions: According to the
literature, one of the control variables used in the research on
satisfaction with environmental conditions in response to a
cooling system is the cultural and social contextual dimension of
the users13,39,43,44. To date, there is no definitive evidence on the
effect of the ‘cultural and social dimension’. Researchers using
the term ‘cultural and social dimension’ referred to the dress code
and clothing habits/behaviors of the occupants of a particular
building, or workplace culture, such as taking a siesta in the heat
of the day, the local and vernacular architecture, the traditional
means of construction and the demographics of building users.
However, none of these factors have been investigated as a special
subject.
Users’ Attitude and Beliefs: Another control variable used in
research on satisfaction with environmental condition in response
to cooling system is building users’ attitudes and beliefs. de Dea42
argued that occupants’ attitudes and beliefs towards the
environment may boost the ‘forgiveness’ factor in the assessment
of conditions created by building systems. However, according to
Jensen et al.42, people generally tend to distance themselves from
behavior that might be considered too different and troublesome.
In addition, as Edwards43 indicated, environmental attitudes are
not always translated into action and may negatively impact
people’s productivity. Lan et al.44 reported that the loss of
productivity has already been detected in slightly unsatisfactorily
cool conditions.
Based on the conceptual and measurable variables, the
researcher identified nine (9) possible observations for survey on
hypothesis testing: ‘DS&E+’ observation, ‘DS&E’ observation,
‘DS&E-‘ observation, ‘N&E+’ observation, ‘N&E’ observation,
‘N&E-‘ observation, ‘S&E+’ observation, ‘S&E’ observation, and
‘S&E-‘ observation.
3.1 Selection of the Case Study for the Survey
To conduct the survey to test the hypothesis, the research study
identified three possible energy efficient buildings using on the
Malaysia Green Building Index (GBI) 2010 report: the Ministry
of Energy and Water Resource Management building (known as
the Low Energy Office (LEO)), the Green Energy Office (GEO),
and the Energy Commission office building (known as ST-
Diamond).
Through an expert input study, the three potential case study
subjects were validated on the following criteria: accessibility of
framework users to researchers, validity of ISO 1525:2007 ISO
152510 requirements for Indoor Environmental Quality (IEQ),
standard Post Occupancy Evaluation (POE) track records,
eagerness of BEMS to support the study, availability of the POE
result, and having been under operation for more than 5 years.
The expert input study resulted in the selection of the Low Energy
Office (LEO) Building of the Ministry of Energy, Water and
Communications located at the city of Putrajaya, Malaysia.
The LEO building is equipped with energy saving design
features, a building control system and energy recovery system,
daylight and shading, energy management system and an energy
manager. The LEO building achieved a 50% energy savings,
equal to 114 kWh/m2 per year. The LEO building has the
temperatures set to 24ºC for the offices and 26ºC for the corridors.
The relatively low energy consumption is due to a higher
population density, approximately 60 m2/person, compared to that
of conventional office buildings (normally at 14–20 m2/person)
along with a good infiltration of outside air into the building. The
CO2 level in the building ranges within 280–450 ppm despite the
set-point concentration of 1,000 ppm in the ASHRAE
recommendation. The distribution of energy consumption is: 45%
cooling system, 21% lighting systems, and 34% equipment.
3.2 Conducting the Survey at Leo
Using the POE method, over 20% of the total occupants should be
calculated as sample size. Thus, the researchers conducted the
survey with ten (10) office units that are representative of the total
population of office users. One respondent in each office unit
represented of the entire unit staff. Each respondent was identified
based on the recommendation of the building manager. Within the
survey, the researcher asked personal information of the
respondents. Subsequently, the researcher described different nine
possible observations to the respondents. Next, the researcher
recorded the observation of each office unit based on the answers
of respondent(s) on following queries: “Which option describes
your staff’s satisfaction level from their adaptive behavior in
response to ‘Tenant energy efficiency features’?”, and, “What is
the effect of this satisfaction level on the energy consumption of
the considered ‘Tenant energy efficiency features’?”
In the last part of the questionnaire, the researcher asked the
respondents if the recorded result is subject to the specific
composition of staff, including 1) Proportion of male to female, 2)
Proportion of Malays to Chinese or Indian races, 3) Proportions of
single, shared, and open working spaces, 4) Proportion of staff
within a specific age group of 25-45 or 45-above. The researcher
double checked the information to confirm of the answers with
respondents at the end of each interview.
4.0 RESULTS OF HYPOTHESIS
To test the hypothesis, the collected data from the survey was
integrated with the following questions (Q). This action was
conducted to enable the ease of importing the data into SPSS
(Statistical Package for the Social Sciences) for analysis.
Q1- Energy consumption of the cooling system,
Q2- The staff’s overall satisfaction with adaptive behavior in
response to the energy efficient cooling system,
Q3- Energy consumption of the lighting system,
Q4- The staff’s overall satisfaction with adaptive behavior in
response to the energy efficient lighting system,
Q5- Energy consumption of the building facility (elevator, etc.),
Q6- The staff’s overall satisfaction with adaptive behavior in
response to energy efficient building facility (elevator, etc.),
Q7- Energy consumption of the work equipment,
Q8- The staff’s overall satisfaction with adaptive behavior in
response to energy efficient work equipment
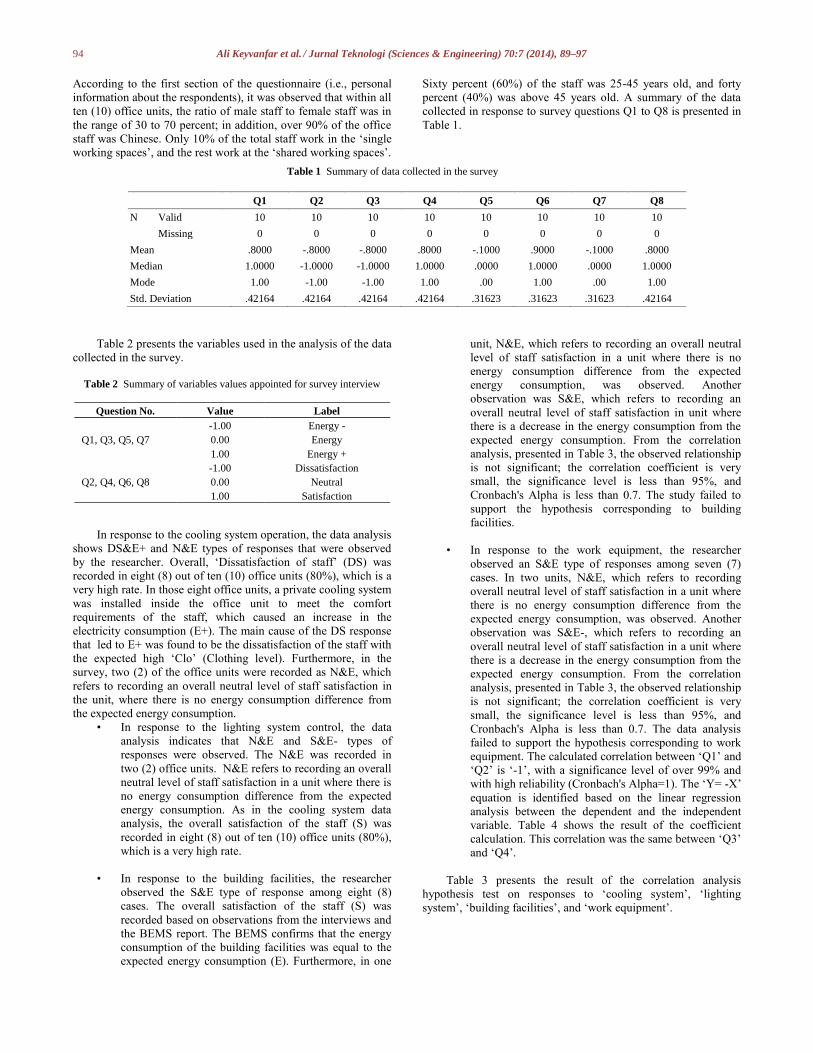
94 Ali Keyvanfar et al. / Jurnal Teknologi (Sciences & Engineering) 70:7 (2014), 89–97
According to the first section of the questionnaire (i.e., personal
information about the respondents), it was observed that within all
ten (10) office units, the ratio of male staff to female staff was in
the range of 30 to 70 percent; in addition, over 90% of the office
staff was Chinese. Only 10% of the total staff work in the ‘single
working spaces’, and the rest work at the ‘shared working spaces’.
Sixty percent (60%) of the staff was 25-45 years old, and forty
percent (40%) was above 45 years old. A summary of the data
collected in response to survey questions Q1 to Q8 is presented in
Table 1.
Table 2 presents the variables used in the analysis of the data
collected in the survey.
Table 2 Summary of variables values appointed for survey interview
Question No. Value Label
Q1, Q3, Q5, Q7
-1.00 Energy -
0.00 Energy
1.00 Energy +
Q2, Q4, Q6, Q8
-1.00 Dissatisfaction
0.00 Neutral
1.00 Satisfaction
In response to the cooling system operation, the data analysis
shows DS&E+ and N&E types of responses that were observed
by the researcher. Overall, ‘Dissatisfaction of staff’ (DS) was
recorded in eight (8) out of ten (10) office units (80%), which is a
very high rate. In those eight office units, a private cooling system
was installed inside the office unit to meet the comfort
requirements of the staff, which caused an increase in the
electricity consumption (E+). The main cause of the DS response
that led to E+ was found to be the dissatisfaction of the staff with
the expected high ‘Clo’ (Clothing level). Furthermore, in the
survey, two (2) of the office units were recorded as N&E, which
refers to recording an overall neutral level of staff satisfaction in
the unit, where there is no energy consumption difference from
the expected energy consumption.
• In response to the lighting system control, the data
analysis indicates that N&E and S&E- types of
responses were observed. The N&E was recorded in
two (2) office units. N&E refers to recording an overall
neutral level of staff satisfaction in a unit where there is
no energy consumption difference from the expected
energy consumption. As in the cooling system data
analysis, the overall satisfaction of the staff (S) was
recorded in eight (8) out of ten (10) office units (80%),
which is a very high rate.
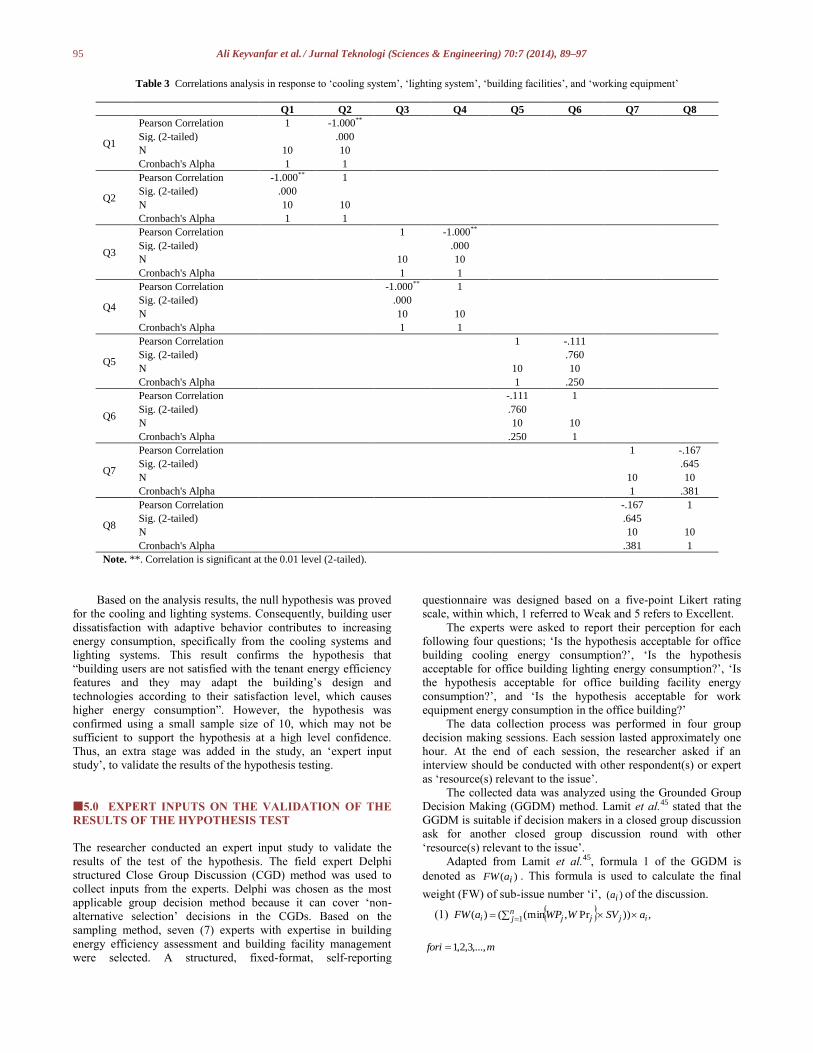
• In response to the building facilities, the researcher
observed the S&E type of response among eight (8)
cases. The overall satisfaction of the staff (S) was
recorded based on observations from the interviews and
the BEMS report. The BEMS confirms that the energy
consumption of the building facilities was equal to the
expected energy consumption (E). Furthermore, in one
unit, N&E, which refers to recording an overall neutral
level of staff satisfaction in a unit where there is no
energy consumption difference from the expected
energy consumption, was observed. Another
observation was S&E, which refers to recording an
overall neutral level of staff satisfaction in unit where
there is a decrease in the energy consumption from the
expected energy consumption. From the correlation
analysis, presented in Table 3, the observed relationship
is not significant; the correlation coefficient is very
small, the significance level is less than 95%, and
Cronbach's Alpha is less than 0.7. The study failed to
support the hypothesis corresponding to building
facilities.
• In response to the work equipment, the researcher
observed an S&E type of responses among seven (7)
cases. In two units, N&E, which refers to recording
overall neutral level of staff satisfaction in a unit where
there is no energy consumption difference from the
expected energy consumption, was observed. Another
observation was S&E-, which refers to recording an
overall neutral level of staff satisfaction in a unit where
there is a decrease in the energy consumption from the
expected energy consumption. From the correlation
analysis, presented in Table 3, the observed relationship
is not significant; the correlation coefficient is very
small, the significance level is less than 95%, and
Cronbach's Alpha is less than 0.7. The data analysis
failed to support the hypothesis corresponding to work
equipment. The calculated correlation between ‘Q1’ and
‘Q2’ is ‘-1’, with a significance level of over 99% and
with high reliability (Cronbach's Alpha=1). The ‘Y= -X’
equation is identified based on the linear regression
analysis between the dependent and the independent
variable. Table 4 shows the result of the coefficient
calculation. This correlation was the same between ‘Q3’
and ‘Q4’.
Table 3 presents the result of the correlation analysis
hypothesis test on responses to ‘cooling system’, ‘lighting
system’, ‘building facilities’, and ‘work equipment’.
Table 1 Summary of data collected in the survey
Q1 Q2 Q3 Q4 Q5 Q6 Q7 Q8
N Valid 10 10 10 10 10 10 10 10
Missing 0 0 0 0 0 0 0 0
Mean .8000 -.8000 -.8000 .8000 -.1000 .9000 -.1000 .8000
Median 1.0000 -1.0000 -1.0000 1.0000 .0000 1.0000 .0000 1.0000
Mode 1.00 -1.00 -1.00 1.00 .00 1.00 .00 1.00
Std. Deviation .42164 .42164 .42164 .42164 .31623 .31623 .31623 .42164
95 Ali Keyvanfar et al. / Jurnal Teknologi (Sciences & Engineering) 70:7 (2014), 89–97
Table 3 Correlations analysis in response to ‘cooling system’, ‘lighting system’, ‘building facilities’, and ‘working equipment’
Q1 Q2 Q3 Q4 Q5 Q6 Q7 Q8
Q1
Pearson Correlation 1 -1.000**
Sig. (2-tailed) .000
N 10 10
Cronbach's Alpha 1 1
Q2
Pearson Correlation -1.000** 1
Sig. (2-tailed) .000
N 10 10
Cronbach's Alpha 1 1
Q3
Pearson Correlation 1 -1.000**
Sig. (2-tailed) .000
N 10 10
Cronbach's Alpha 1 1
Q4
Pearson Correlation -1.000** 1
Sig. (2-tailed) .000
N 10 10
Cronbach's Alpha 1 1
Q5
Pearson Correlation 1 -.111
Sig. (2-tailed) .760
N 10 10
Cronbach's Alpha 1 .250
Q6
Pearson Correlation -.111 1
Sig. (2-tailed) .760
N 10 10
Cronbach's Alpha .250 1
Q7
Pearson Correlation 1 -.167
Sig. (2-tailed) .645
N 10 10
Cronbach's Alpha 1 .381
Q8
Pearson Correlation -.167 1
Sig. (2-tailed) .645
N 10 10
Cronbach's Alpha .381 1
Note. **. Correlation is significant at the 0.01 level (2-tailed).
Based on the analysis results, the null hypothesis was proved
for the cooling and lighting systems. Consequently, building user
dissatisfaction with adaptive behavior contributes to increasing
energy consumption, specifically from the cooling systems and
lighting systems. This result confirms the hypothesis that
“building users are not satisfied with the tenant energy efficiency
features and they may adapt the building’s design and
technologies according to their satisfaction level, which causes
higher energy consumption”. However, the hypothesis was
confirmed using a small sample size of 10, which may not be
sufficient to support the hypothesis at a high level confidence.
Thus, an extra stage was added in the study, an ‘expert input
study’, to validate the results of the hypothesis testing.
5.0 EXPERT INPUTS ON THE VALIDATION OF THE
RESULTS OF THE HYPOTHESIS TEST
The researcher conducted an expert input study to validate the
results of the test of the hypothesis. The field expert Delphi
structured Close Group Discussion (CGD) method was used to
collect inputs from the experts. Delphi was chosen as the most
applicable group decision method because it can cover ‘non-
alternative selection’ decisions in the CGDs. Based on the
sampling method, seven (7) experts with expertise in building
energy efficiency assessment and building facility management
were selected. A structured, fixed-format, self-reporting
questionnaire was designed based on a five-point Likert rating
scale, within which, 1 referred to Weak and 5 refers to Excellent.
The experts were asked to report their perception for each
following four questions; ‘Is the hypothesis acceptable for office
building cooling energy consumption?’, ‘Is the hypothesis
acceptable for office building lighting energy consumption?’, ‘Is
the hypothesis acceptable for office building facility energy
consumption?’, and ‘Is the hypothesis acceptable for work
equipment energy consumption in the office building?’
The data collection process was performed in four group
decision making sessions. Each session lasted approximately one
hour. At the end of each session, the researcher asked if an
interview should be conducted with other respondent(s) or expert
as ‘resource(s) relevant to the issue’.
The collected data was analyzed using the Grounded Group
Decision Making (GGDM) method. Lamit et al.45 stated that the
GGDM is suitable if decision makers in a closed group discussion
ask for another closed group discussion round with other
‘resource(s) relevant to the issue’.
Adapted from Lamit et al.45, formula 1 of the GGDM is
denoted as )( iaFW . This formula is used to calculate the final
weight (FW) of sub-issue number ‘i’, )( ia of the discussion.
(1) ,))Pr,(min()( 1 ijnj jji aSVWWPaFW
mfori ,...,3,2,1
96 Ali Keyvanfar et al. / Jurnal Teknologi (Sciences & Engineering) 70:7 (2014), 89–97
Where,
jWP refers to the assigned weight by the participants number ‘j’
in a closed group discussion on sub-issue‘ ia ’,
jW Pr refers to the assigned weight by the resource(s) relevant
to the issue, whom were introduced by participant number ‘j’ in
the closed group discussion for sub-issue ‘ ia ’,
‘ ia ’, refers to the sub-issue under discussion,
max)( iaFW refers to the maximum possible weight that can be
given for sub-issue ‘ ia ’,
jSV refers to the CGD sessions value (SV) used by the decision
researcher for the CGD session included participant number ‘j’.
In the cases where the participant(s) did not introduce other
resource(s) relevant to the issue, jj WWP Pr,max was taken
as jWP .
Furthermore, the participant(s) in the cases where participant(s)
did not vote and did not provide an absolute decision for the
introduced resource(s) relevant to the issue, jj WWP Pr,min was
taken as jW Pr . Formula (2) indicates the consensus calculation
of the GGDM for sub-issue ‘‘ ia ’, based on percentage (%). If the
final consensus calculated is over 70%, then the issue is approved.
6.0 DISCUSSION ON FINDINGS
It is obvious that a study on user satisfaction with adaptive
behavior requirements will enhance the sustainability of a
building in terms of functionality, serviceability, adoptability,
human comfort requirements, well-being, risk reduction of
investment and a have negative impact on the environment13.
Focusing on the energy efficient building, user satisfaction
evaluation has been traditionally considered in the operation and
maintenance phase of building life cycle. However, a literature
review indicates that the majority of building assessment tools
lack a focus on the energy, environmental, and/or economic
aspects in the design phase of the building life cycle. As a result,
the current research established a comprehensive list of user-
satisfaction adaptive behaviors for the evaluation of an energy
efficient building in the ‘Design’ phase. The research findings
help to enhance the sustainability assessment techniques for
buildings. Indeed, such an assessment will assist building design
and construction teams to have a quantitative assessment on the
downstream requirements of the satisfaction of end-users.
A critical literature review on previous studies indicates that
building user satisfaction is correlated to energy consumption.
However, there is no evidence demonstrating the effect of
‘building user satisfaction with adaptive behavior’ on ‘building
energy consumption’. To address this, a survey with expert input
was performed to clarify the issue. The research defined a null
hypothesis based on a content analysis of the reviewed literature.
The hypothesis testing survey found that building user
dissatisfaction from the adaptive behavior contributes to
increasing the building energy consumption, specifically for the
cooling and lighting systems, i.e., building users are not satisfied
with the tenant energy efficiency features and they may adapt the
building indoor environment design according to their satisfaction
level, which causes higher energy consumption.
An expert input study to support the results of the survey to
test the hypothesis with a higher confidence level. The expert
input study used Delphi structured close group discussions. The
expert(s) justifications were collected based on four (4) questions
that investigated the acceptability of the hypothesis on the cooling
system, the lighting system, the building facilities, and the work
equipment. The expert input data was analyzed using GGDM,
which resulted with 70% saturation in the acceptance of the
hypothesis for the ‘cooling system’ and the ‘lighting system’.
6.0 CONCLUSION AND RECOMMENDATIONS
Based on the research results, we conclude that social issues and
social behavior effects on the energy efficiency should be
considered by sustainable building assessment tool developers in
the design phase of the building life cycle. In particular, user
satisfaction with adaptive behavior is an inter-connected criterion
in compliance with energy efficiency in the development of a
sustainable building assessment tool, and also, in sustainable
urban assessment46,47.
In conclusion, the study was successful in investigating the
effect of ‘building user satisfaction from adaptive behavior’ on
‘building energy consumption’. The findings indicated the
importance of this study and confirmed that previous efforts were
not sufficient in this area. Conducting a survey and obtaining
expert input resulted in accepting ‘cooling system’ and ‘lighting
system’ as the main factors in tenant energy consumption.
Managing the adaptive behavior of the building users will
assist investors, developers, tenants, and government bodies to
make informed decisions on the energy management of buildings.
The research findings can be used by Sustainable Building
Assessment Tool developers. Moreover, ‘energy-efficient
building design consultants’ and ‘design and build contractors’
are also possible direct users of the research findings. The
findings indicate that both professionals and practitioners must
consider user satisfaction in the design to achieve social
sustainability in the energy-efficient building.
In addition, considering the adaptive behavior of the building
user reduces the risk of volatile investment as well as future
competitiveness of the building asset in the market. The results of
this study will assist professionals in benchmarking previously
completed and future projects.
The practical approaches of energy efficient building design
will be investigated in further studies. In particular, the physical
and structural aspects of sustainable building need to be studies
which have been recommended in previous construction
researches, such as, Talebi et al.48, and Abdulrahman et al.49.
Acknowledgement
The authors would like to thank Ministry of Science, Technology,
and Innovation (MOSTI) funded the research projects vote no.
4S055 and 4S042. Also, the authors appreciate theses
organization for their supports and contributions, Research
Management Center, KALAM, and Sustainability Research
Alliance (SUTRA) at Universiti Teknologi Malaysia.
References [1] G. Abdalla, G. Maas, J. Huyghe, M. Oostra. 2011. Criticism on
Environmental Assessment Tools. 2nd International Conference on
Environmental Science and Technology, IPCBEE, 6, Singapore.
[2] P. Christensen. 2011. Assessing Assessment: Toward a More Holistic
Rating System for Sustainability Performance. Available from
http://eres.scix.net/data/works/att/eres2011_336.content.pdf access at
November 2012.
97 Ali Keyvanfar et al. / Jurnal Teknologi (Sciences & Engineering) 70:7 (2014), 89–97
[3] [3] A. Zimmerman, M. Martin. 2001. Post Occupancy Evaluation:
Benefits and Barriers. Building Research and Information. 29(2): 168–
74.
[4] [4] S. J. Wilkinson, R. G. Reed, J. Junaidah. 2011. User Satisfaction in
Sustainable Office Buildings: A Preliminary Study. Proceeding of 17th PRRES Pacific Rim Real Estate Society Conference Gold Coast,
Australia.
[5] [5] A. Keyvanfar, A. Shafaghat., M. Z. Abd Majid., H. B. Lamit, M.
W. Hussin, Kh.N. Binti Ali, A. Dhafer Saad. 2014. User Satisfaction
Adaptive Behaviors for Assessing Energy Efficient Building Indoor
Cooling and Lighting Environment. Renewable and Sustainable Energy
Reviews. 39: 277–295. [6] [6] M. Z. Abd Majid; W. Z. Zakaria; H. Lamit; A. Keyvanfar; A.
Shafaghat; E. S. Bakti. 2012. Construction Information Systems for
Executive Management in Monitoring Work Progress. Advanced
Science Letters. 15(1): 169–171.
[7] [7] Z. Yu, F. Haghighat, B. Fung, E. Morofsky, H. Yoshino. 2011. A
Methodology for Identifying and Improving Occupant Behavior in
Residential Buildings. Energy. 36: 6596–6608.
[8] [8] V. Tabak, B. de Vries. 2010. Methods for the Prediction of Intermediate Activities by Office Occupants. Building and Environment.
451366–1372.
[9] [9] International Organization for Standardization–ISO/TS21931-1.
2006. Sustainability in Building Construction–Framework for Methods
of Assessment for Environmental Performance of Construction Works
International Standards Organization, Geneva.
[10] [10] ISO/TS 21931-1. Sustainability in Building Construction–
Framework for Methods of Assessment for Environmental Performance of Construction Works–Part 1: Buildings; 2006.
http://www.iso.org/iso/catalogue_detail.htm?csnumber=40434.
[11] [11] American Society of Heating, Refrigerating and Air-Conditioning
Engineers-ASHRAE. 2010. ANSI/ASHRAE Standard 55-2010: The
Design of Sustainable Buildings for Occupant Comfort. GA: American
Society of Heating, Refrigerating and Air-Conditioning Engineers.
[12] [12] J. Liu, R. Yao, J. Wang, B. Li. 2012. Occupants’ Behavioural Adaptation in Workplaces with Non-central Heating and Cooling
System. Applied Thermal Engineering. 35: 40–54.
[13] [13] G. S. Brager, R. J. de Dear. 1998. Thermal Adaptation in the Built
Environment: A Literature Review. Energy and Buildings. 27: 83–96.
[14] D.W.L. Wu, A. DiGiacomo, A. Kingstone, A Sustainable Building
Promotes Pro- Environmental Behavior: An Observational Study on
Food Disposal, PLOS One, DOI: 10.1371/journal.pone.0053856 (2013).
[15] N. Baker, M. Standeven, Comfort for free-running buildings. Energy and Buildings, 23 (1996) 175-182
[16] N. Oseland, M. Humphreys, Trends in thermal comfort. Building
Research Establishment, Watford, United Kingdom (1994).
[17] V. Tabak, B. de Vries, Methods for the prediction of intermediate
activities by office occupants. Building and Environment, 45 (2010)
1366–1372.
[18] A. Dibra, A. Mahdavi, C. Koranteng, An analysis of user behaviour and
indoor climate in an office building in Kosovo. Advances in Applied Science Research, 2(5) (2011) 48-63.
[19] L.S. Eang, Energy Efficiency of Office Buildings in Singapore.
Available at
http://www.bdg.nus.edu.sg/buildingenergy/publication/papers/paper4.ht
ml (2001), access at Nov. 2012
[20] W. Chung. 2011. Review of building energy-use performance
benchmarking methodologies. APPL ENERG: 88:1470–1479. [21] Roetzel A, Tsangrassoulis A, Dietrich U, Busching S. A review of
occupant control on natural ventilation, RENEW SUST ENERG REV;
14 (2010) 1001–1013
[22] G.Y Yun., and Steemers K. User behaviour of window control in offices
during summer and winter. Proceeding of CISBAT International
conference, Lausanne, Switzerland; 2007.
[23] A. Campbell, PE. Conserve, W.L. Rodgers. The Quality of American
Life, Russell Sage; 1975. [24] D. Leonard-Barton. 1981. Voluntary Simplicity Lifestyles and Energy
Conservation. J CONSUM RES, 8:243-252.
[25] S. Sorrell, L. Dimitropoulos, M. Sommerville. Empirical Estimates of
the Direct Rebound Effect: A Review. Energ Policy; 2009, 37(4):1356-
1371.
[26] T. Jackson. Motivating Sustainable Consumption: a review of evidence
on consumer behaviour and behavioural change. Technical Report,
Centre for Environmental Strategy, University of Surrey, Surrey, United
Kingdom; 2005.
[27] E. Azar, CC. Menassa. Agent-Based Modeling of Occupants and Their
Impact on Energy Use in Commercial Buildings. J COMPUT CIVIL
ENG; 2012: 26(4): 506–518. [28] Allsop DT, Bassett BR, Hoskins JA. Word of mouth research: principles
and applications. J ADVERTISING RES; 2007: 47(4):398-411.
[29] LJ. Harrison-Walker. The Measurement of Word-of-Mouth
Communication and an Investigation of Service Quality and Customer
Commitment as Potential Antecedents. J SERV RES; 2001, 4(1):60-75.
[30] R.J. Cole, Z. Brown, S. McKay, Building human agency: a timely
manifesto. Building Research & Information, 38(3) (2010) 339-350. [31] Passive and Low Energy Architecture–PLEA; 2009. http://plea-
arch.org/plea-proceedings/
[32] RV. Andersen, J. Toftum, KK. Andersen, BW. Olesen. Survey of
occupant behaviour and control of indoor environment in Danish
dwellings, ENERGY BUILDINGS; 2013; 41 (1): 11–16.
[33] R. Maaijen, W. Zeiler, G. Boxem, W. Maassen. Human centered
energy control: taking the occupancy in the control loop of building
systems. REHVA Journal, REHVA Annual meeting; 2012. http://www.rehva.eu/en/577.human-centered-energy-control-taking-the-
occupancy-in-the-control-loop-of-building-systems, access at June
2012.
[34] F. Haldi F, D. Robinson. On the behaviour and adaptation of office
occupants. BUILD ENVIRON; 2008, 43(12):2163-77.
[35] , P. Hoes, JLM. Hensen, MGLC Loomans, B de Vries, D. Bourgeois.
User behavior in whole building simulation. Energy Buildings; 2009,
41(3):295–302. [36] Yang L, Yan H, Lam JC. Thermal comfort and building energy
consumption implications –A review; Applied Energy; 2014, 115: 164–
173.
[37] R. Yao, B. Li, J. Liu, A theoretical adaptive model of thermal comfort–
Adaptive Predicted Mean Vote (aPMV). Building and Environment,
44(10) (2009) 2089-2096.
[38] Human Development Report, United Nations Development Programme- UNDP 2013) , URL. http://hdr.undp.org/en/data/explorer/
[39] Y. Zhang, P. Barrett . Factors influencing occupants’ blind-control
behaviour in a naturally ventilated office building. BUILD ENVIRON;
2012, 54:137-147.
[40] Pertubuhan Akitek Malaysia-PAM. Green Building Index-GBI.2009.
http://www.greenbuildingindex.org/ access at May 2010.
[41] Malaysian Standard, MS 1525. Code Of Practice On Energy Efficiency
And Use Of Renewable Energy For Non-Residential Buildings, Department Of Standards Malaysia;2007.
http://www.standardsmalaysia.gov.my
[42] Jensen W, Fischer B, Wentz T, Camara G. A proposed LEED standard
for indoor acoustical quality. J GREEN BUILD;2008, 3(1): 93-101.
[43] Edwards B. Benefits of green offices in the UK: analysis from examples
built in the 1990s. SUSTAIN DEV; 2006: 14:190–204.
[44] Lan L,Wargocki P, Lian Z. Quantitative measurement of productivity
loss due to thermal discomfort. Energy Buildings;2011, 43(5):1057-1062.
[45] H. Lamit, A. Shafaghat, M.z. Abd Majid, A. Keyvanfar, M.H.Bin
Ahmad, T.A. Malik TA, Grounded Group Decision Making
(GGDM) Model, Journal of Advanced Science Letters, 19(10)
(2013), 3077-3080.
[46] HB Lamit, A Shafaghat, MZ Majid, A Keyvanfar, MHB Ahmad, TA
Malik, The Path Walkability Index (PAWDEX) Model: To Measure Built Environment Variables Influencing Residents' Walking Behavior,
Advanced Science Letters 19 (10), 3017-3020
[47] H.B. Lamit; A. Shafaghat; M.Z. Abd. Majid; A. Keyvanfar; Mohd
Hamdan Bin Ahmad; T.A. Malik; Rosli Bin Zin; Mohammadreza
Yadollahi, Application of the Path Walkability Index (Pawdex) Model:
A Case Study of Retail Walking Pattern Recognition in Taman
University Skudai, Johor, Malaysia, Advanced Science Letters 19 (10),
3021-3024 [48] [35] E. Talebi; MMD Tahir; F. Zahmatkesh; A. Yasreen; J. Mirza,
Thermal behavior of cylindrical buckling restrained braces at elevated
temperatures, The Scientific World Journal. 2014;2014.
[49] [36] A. S. Abdulrahman, Mohammad Ismail, Mohammad Sakhawat
Hussain. 2011. Corrosion Inhibitors for Steel Reinforcement in
Concrete: A Review. Scientific Research and Essays. 6(20): 4152–4162.