Embed Size (px)
Citation preview

2018 ECONOMIC OUTLOOK34th Annual Economic Roundtable
Ray MajorChief Economist
Jan 18, 2018
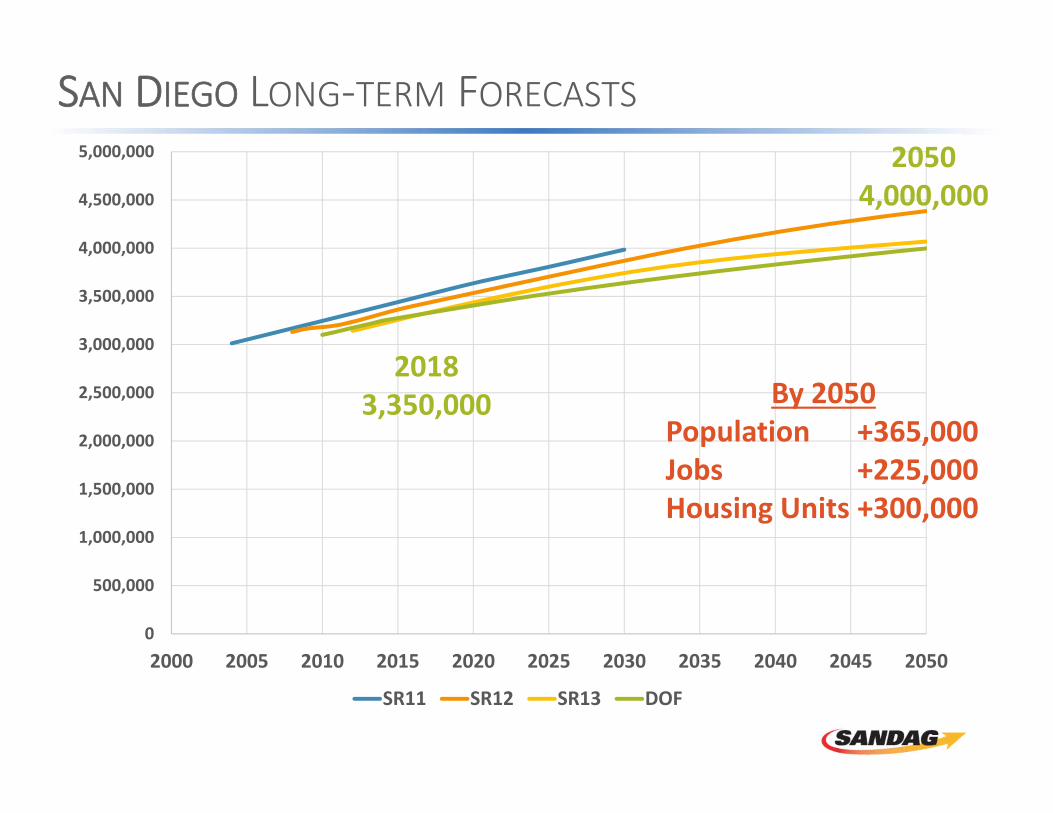
SAN DIEGO LONG‐TERM FORECASTS
0
500,000
1,000,000
1,500,000
2,000,000
2,500,000
3,000,000
3,500,000
4,000,000
4,500,000
5,000,000
2000 2005 2010 2015 2020 2025 2030 2035 2040 2045 2050
SR11 SR12 SR13 DOF
20183,350,000
2050 4,000,000
By 2050Population +365,000Jobs +225,000Housing Units +300,000

San Diego Outlook: Jobs
4
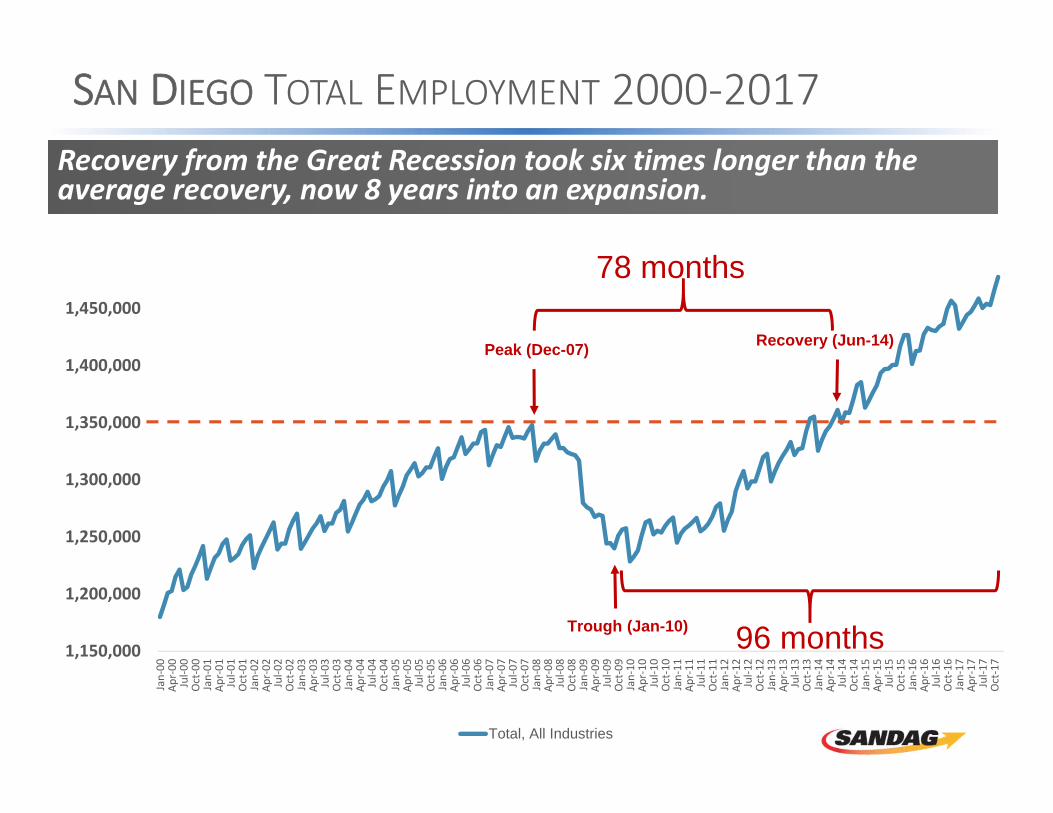
Recovery from the Great Recession took six times longer than the average recovery, now 8 years into an expansion.
1,150,000
1,200,000
1,250,000
1,300,000
1,350,000
1,400,000
1,450,000
Jan‐00
Apr‐00
Jul‐0
0Oct‐00
Jan‐01
Apr‐01
Jul‐0
1Oct‐01
Jan‐02
Apr‐02
Jul‐0
2Oct‐02
Jan‐03
Apr‐03
Jul‐0
3Oct‐03
Jan‐04
Apr‐04
Jul‐0
4Oct‐04
Jan‐05
Apr‐05
Jul‐0
5Oct‐05
Jan‐06
Apr‐06
Jul‐0
6Oct‐06
Jan‐07
Apr‐07
Jul‐0
7Oct‐07
Jan‐08
Apr‐08
Jul‐0
8Oct‐08
Jan‐09
Apr‐09
Jul‐0
9Oct‐09
Jan‐10
Apr‐10
Jul‐1
0Oct‐10
Jan‐11
Apr‐11
Jul‐1
1Oct‐11
Jan‐12
Apr‐12
Jul‐1
2Oct‐12
Jan‐13
Apr‐13
Jul‐1
3Oct‐13
Jan‐14
Apr‐14
Jul‐1
4Oct‐14
Jan‐15
Apr‐15
Jul‐1
5Oct‐15
Jan‐16
Apr‐16
Jul‐1
6Oct‐16
Jan‐17
Apr‐17
Jul‐1
7Oct‐17
Total, All Industries
Peak (Dec-07) Recovery (Jun-14)
Trough (Jan-10)
78 months
SAN DIEGO TOTAL EMPLOYMENT 2000‐2017
96 months
6
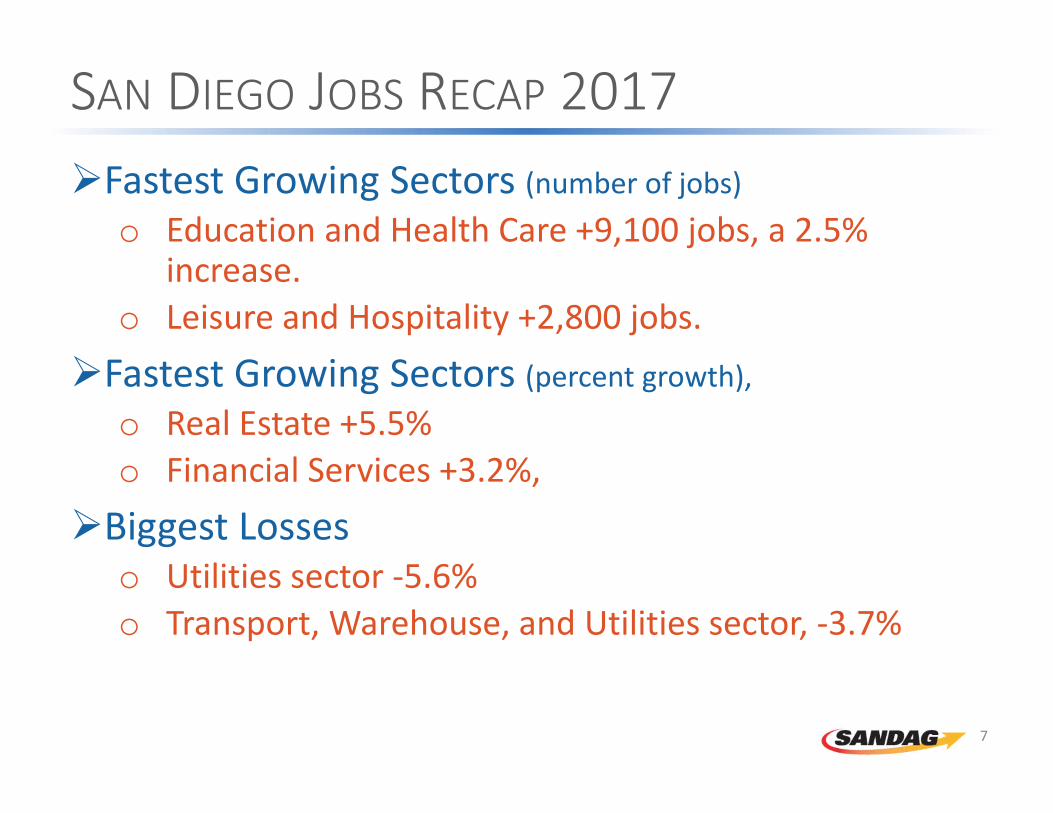
SAN DIEGO JOBS RECAP 2017 Fastest Growing Sectors (number of jobs)
o Education and Health Care +9,100 jobs, a 2.5% increase.
o Leisure and Hospitality +2,800 jobs. Fastest Growing Sectors (percent growth),
o Real Estate +5.5% o Financial Services +3.2%,
Biggest Losseso Utilities sector ‐5.6% o Transport, Warehouse, and Utilities sector, ‐3.7%
7
San Diego Outlook:Wages
8
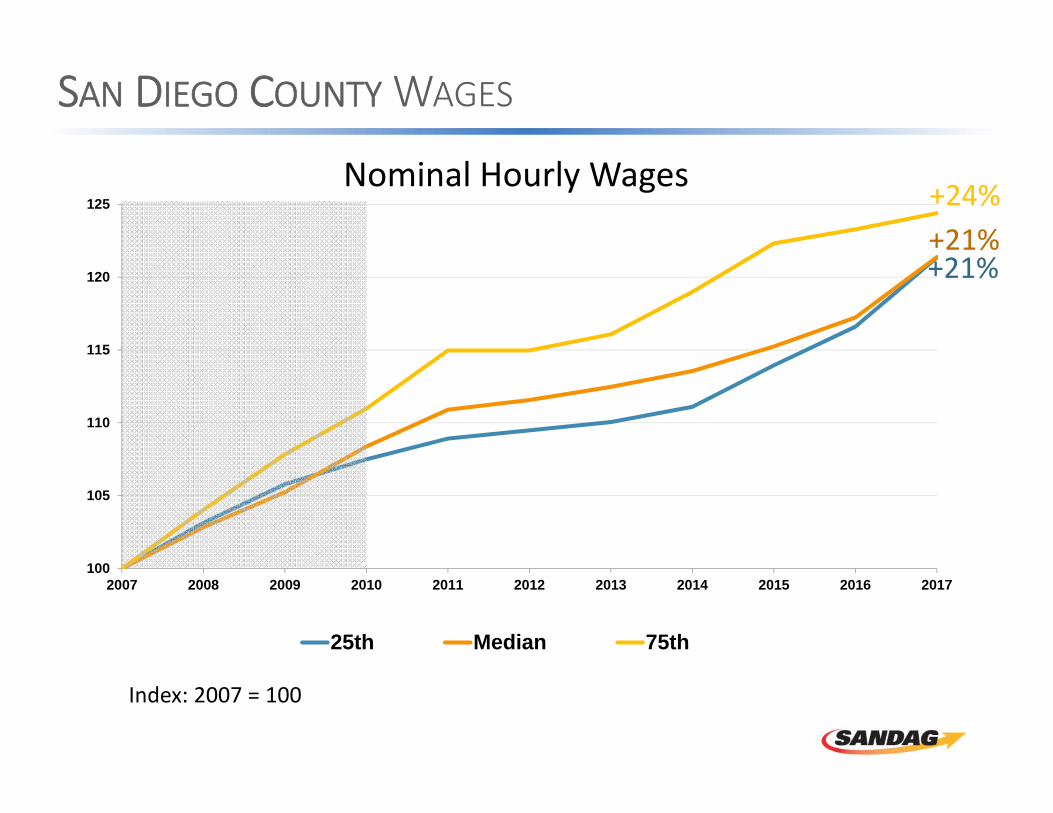
Nominal Hourly Wages
Index: 2007 = 100
+21%
100
105
110
115
120
125
2007 2008 2009 2010 2011 2012 2013 2014 2015 2016 2017
25th Median 75th
+24%
+21%
SAN DIEGO COUNTY WAGES
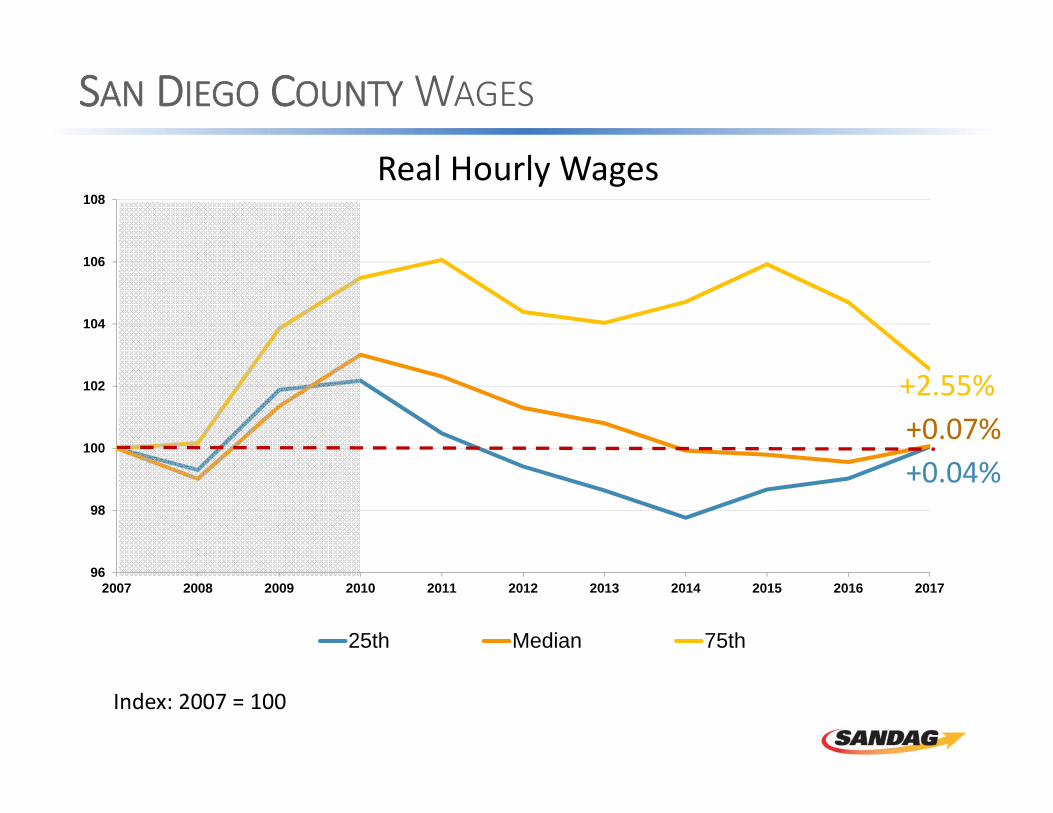
Real Hourly Wages
Index: 2007 = 100
+0.04%
96
98
100
102
104
106
108
2007 2008 2009 2010 2011 2012 2013 2014 2015 2016 2017
25th Median 75th
+2.55%+0.07%
SAN DIEGO COUNTY WAGES
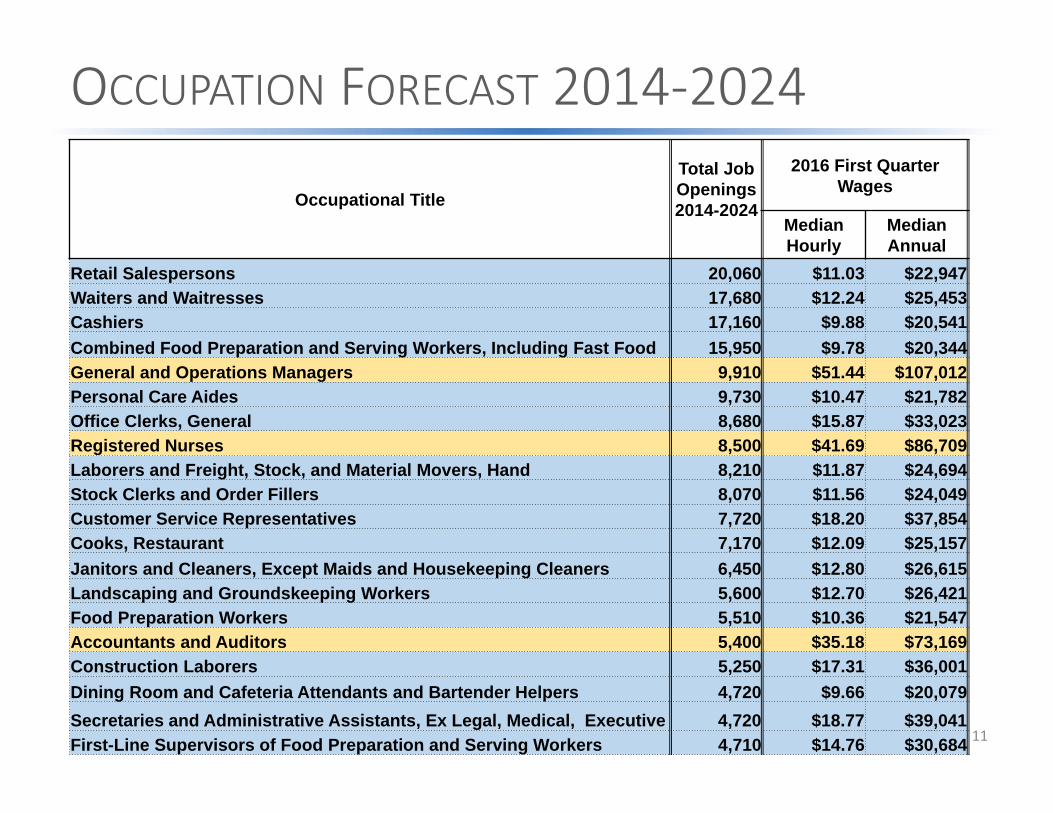
OCCUPATION FORECAST 2014‐2024
11
Occupational Title
Total Job Openings 2014-2024
2016 First QuarterWages
Median Hourly
Median Annual
Retail Salespersons 20,060 $11.03 $22,947Waiters and Waitresses 17,680 $12.24 $25,453Cashiers 17,160 $9.88 $20,541Combined Food Preparation and Serving Workers, Including Fast Food 15,950 $9.78 $20,344General and Operations Managers 9,910 $51.44 $107,012Personal Care Aides 9,730 $10.47 $21,782Office Clerks, General 8,680 $15.87 $33,023Registered Nurses 8,500 $41.69 $86,709Laborers and Freight, Stock, and Material Movers, Hand 8,210 $11.87 $24,694Stock Clerks and Order Fillers 8,070 $11.56 $24,049Customer Service Representatives 7,720 $18.20 $37,854Cooks, Restaurant 7,170 $12.09 $25,157Janitors and Cleaners, Except Maids and Housekeeping Cleaners 6,450 $12.80 $26,615Landscaping and Groundskeeping Workers 5,600 $12.70 $26,421Food Preparation Workers 5,510 $10.36 $21,547Accountants and Auditors 5,400 $35.18 $73,169Construction Laborers 5,250 $17.31 $36,001Dining Room and Cafeteria Attendants and Bartender Helpers 4,720 $9.66 $20,079Secretaries and Administrative Assistants, Ex Legal, Medical, Executive 4,720 $18.77 $39,041First-Line Supervisors of Food Preparation and Serving Workers 4,710 $14.76 $30,684
San Diego Outlook:Housing
12
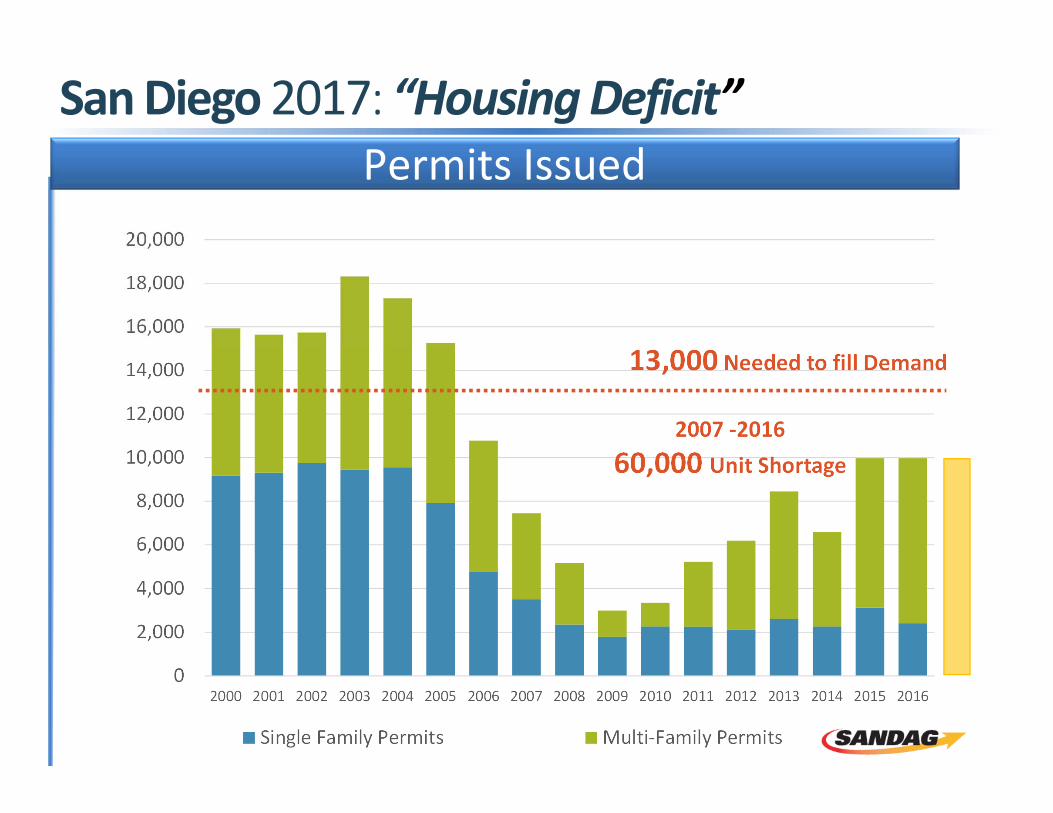
0
2,000
4,000
6,000
8,000
10,000
12,000
14,000
16,000
18,000
20,000
2000 2001 2002 2003 2004 2005 2006 2007 2008 2009 2010 2011 2012 2013 2014 2015 2016
Single Family Permits Multi‐Family Permits
2007 ‐2016 60,000 Unit Shortage
13,000 Needed to fill Demand
Permits IssuedSan Diego 2017: “Housing Deficit”
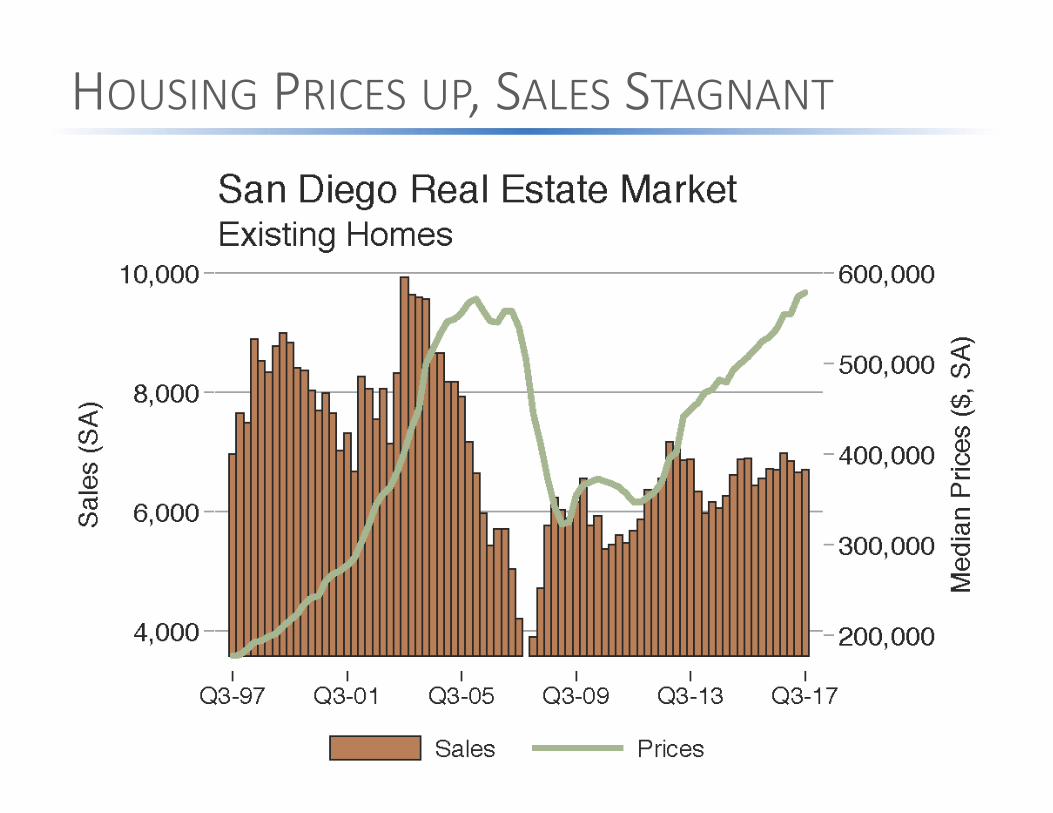
HOUSING PRICES UP, SALES STAGNANT
14
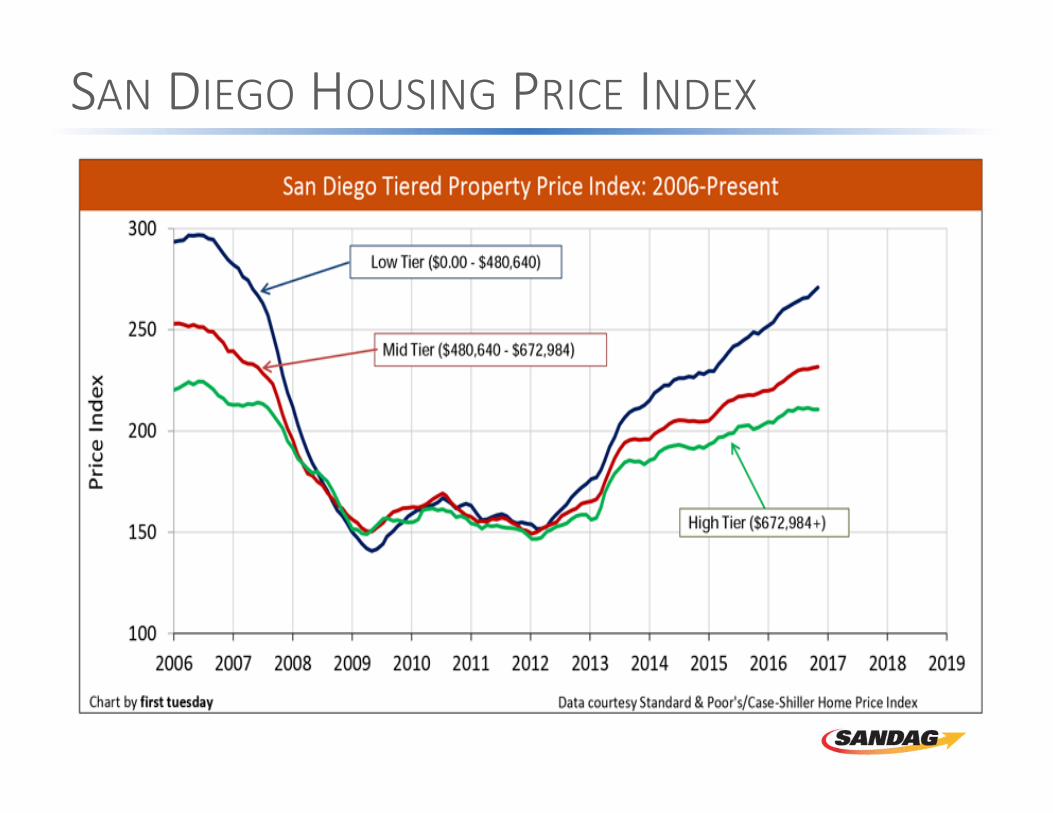
SAN DIEGO HOUSING PRICE INDEX
Apr
-91
Jan-
92O
ct-9
2Ju
l-93
Apr
-94
Jan-
95O
ct-9
5Ju
l-96
Apr
-97
Jan-
98O
ct-9
8Ju
l-99
Apr
-00
Jan-
01O
ct-0
1Ju
l-02
Apr
-03
Jan-
04O
ct-0
4Ju
l-05
Apr
-06
Jan-
07O
ct-0
7Ju
l-08
Apr
-09
Jan-
10O
ct-1
0Ju
l-11
Apr
-12
Jan-
13O
ct-1
3Ju
l-14
Apr
-15
Jan-
16O
ct-1
60%
10%
20%
30%
40%
50%
60%
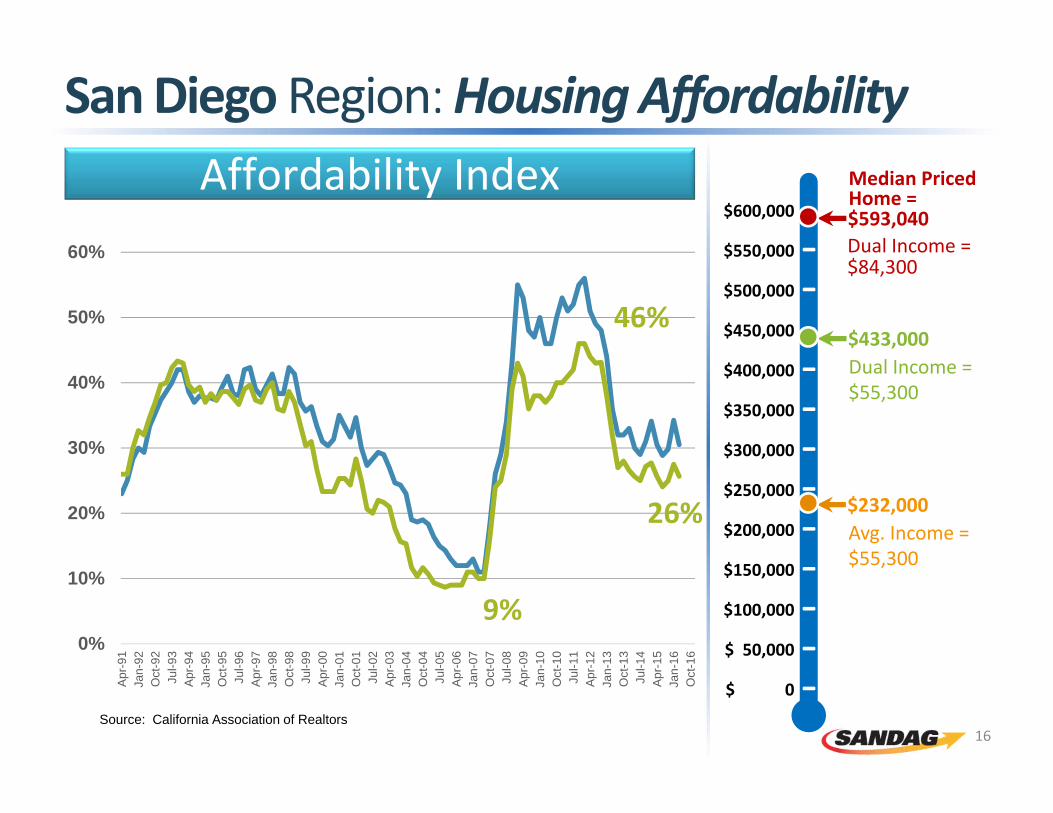
Source: California Association of Realtors
46%
16
Affordability Index
9%
26%
San Diego Region: Housing Affordability
$600,000
$550,000
$500,000
$450,000
$400,000
$350,000
$300,000
$250,000
$200,000
$150,000
$100,000
$ 50,000
$ 0
‐‐‐‐‐‐‐‐‐‐‐‐‐
Median PricedHome = $593,040
$433,000Dual Income =$55,300
$232,000Avg. Income =$55,300
Dual Income =$84,300
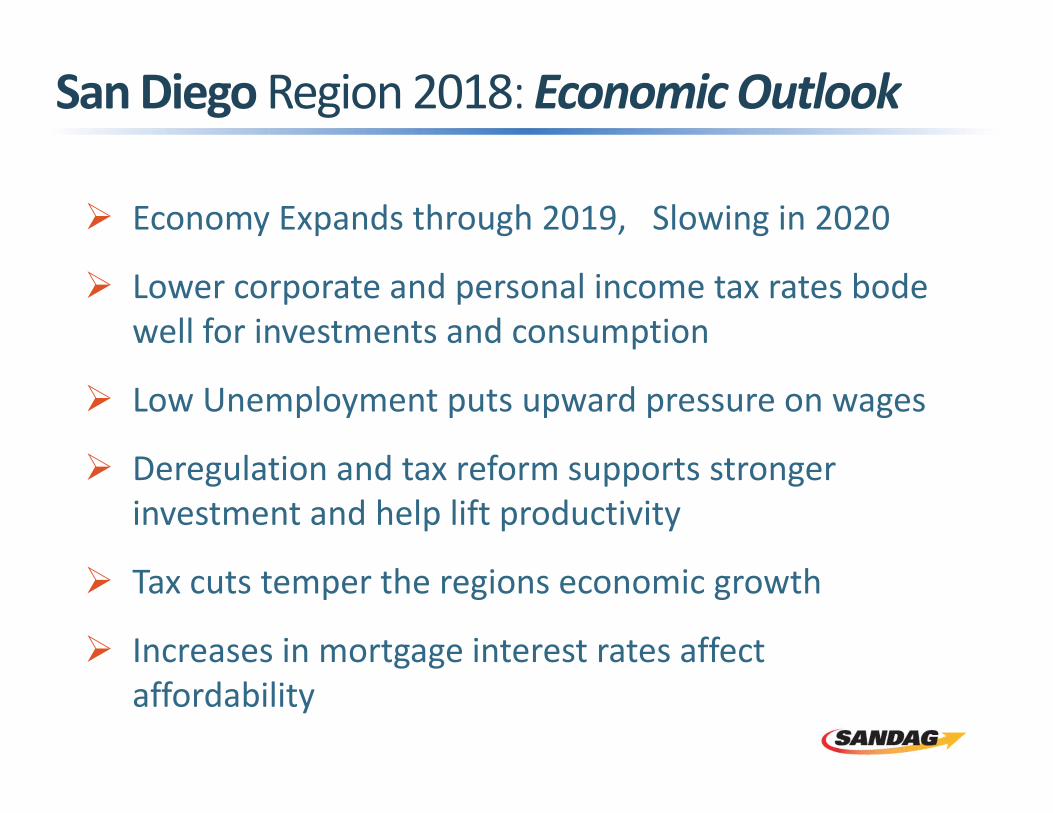
San Diego Region 2018: Economic Outlook
Economy Expands through 2019, Slowing in 2020
Lower corporate and personal income tax rates bode well for investments and consumption
Low Unemployment puts upward pressure on wages
Deregulation and tax reform supports stronger investment and help lift productivity
Tax cuts temper the regions economic growth
Increases in mortgage interest rates affect affordability