Embed Size (px)
DESCRIPTION
Mantenimiento de redes informativas
Citation preview
Table of contents
Introduction . . . . . . . . . . . . . . . . . . . . . . . . . . . . . . . . . . . . . . . . . . . . . . . . . . . . . 2
Background . . . . . . . . . . . . . . . . . . . . . . . . . . . . . . . . . . . . . . . . . . . . . . . . . . . . . 2The TCP Protocol . . . . . . . . . . . . . . . . . . . . . . . . . . . . . . . . . . . . . . . . . . . . . 4
The Life of a Packet . . . . . . . . . . . . . . . . . . . . . . . . . . . . . . . . . . . . . . . . . . . 6
Other Troubleshooting Factors . . . . . . . . . . . . . . . . . . . . . . . . . . . . . . . . . . 7
Why UDP is so Different . . . . . . . . . . . . . . . . . . . . . . . . . . . . . . . . . . . . . . . 8
Why is Understanding Troubleshooting Important . . . . . . . . . . . . . . . . . . 9
Application Flow . . . . . . . . . . . . . . . . . . . . . . . . . . . . . . . . . . . . . . . . . . . . . . . . 13The Amazing Sequence of Events in Connecting
to a Server . . . . . . . . . . . . . . . . . . . . . . . . . . . . . . . . . . . . . . . . . . . . . . . . . 13
DHCP . . . . . . . . . . . . . . . . . . . . . . . . . . . . . . . . . . . . . . . . . . . . . . . . . . . . . . 15
DNS Lookups . . . . . . . . . . . . . . . . . . . . . . . . . . . . . . . . . . . . . . . . . . . . . . . 16
ARP Broadcasting . . . . . . . . . . . . . . . . . . . . . . . . . . . . . . . . . . . . . . . . . . . . 21
The Route to the Server . . . . . . . . . . . . . . . . . . . . . . . . . . . . . . . . . . . . . . . 24
Establishing the Connection to the Server . . . . . . . . . . . . . . . . . . . . . . . . 26
Sender/Receiver Interaction . . . . . . . . . . . . . . . . . . . . . . . . . . . . . . . . . . . 30
The Flow of Data . . . . . . . . . . . . . . . . . . . . . . . . . . . . . . . . . . . . . . . . . . 32
Closing the Connection . . . . . . . . . . . . . . . . . . . . . . . . . . . . . . . . . . . . 40
Understanding How Applications Fail . . . . . . . . . . . . . . . . . . . . . . . . . . . 42
Failures with DNS . . . . . . . . . . . . . . . . . . . . . . . . . . . . . . . . . . . . . . . . . 42
Failures with ARP . . . . . . . . . . . . . . . . . . . . . . . . . . . . . . . . . . . . . . . . . 44
Failures with Routing . . . . . . . . . . . . . . . . . . . . . . . . . . . . . . . . . . . . . . 47
Problems in Establishing a Connection . . . . . . . . . . . . . . . . . . . . . . . . 51
Slow Responses from Servers . . . . . . . . . . . . . . . . . . . . . . . . . . . . . . . . 53
Closing the Connection . . . . . . . . . . . . . . . . . . . . . . . . . . . . . . . . . . . . 54
Troubleshooting Applications . . . . . . . . . . . . . . . . . . . . . . . . . . . . . . . . . . . . . . 55Baselining . . . . . . . . . . . . . . . . . . . . . . . . . . . . . . . . . . . . . . . . . . . . . . . . . . 56
Five Key Steps to Successful Application Troubleshooting . . . . . . . . . . . 58
Determine the domain of the problem and
exonerate the network . . . . . . . . . . . . . . . . . . . . . . . . . . . . . . . . . . . . . 58
Validating Connectivity to the Application Server . . . . . . . . . . . . . . . 65
Determine the Network Path . . . . . . . . . . . . . . . . . . . . . . . . . . . . . . . . 70
Application Flow Analysis . . . . . . . . . . . . . . . . . . . . . . . . . . . . . . . . . . . 73
Using OptiView® Integrated ClearSight™ Analyzer . . . . . . . . . . . . . . . 77
Fix the Problem . . . . . . . . . . . . . . . . . . . . . . . . . . . . . . . . . . . . . . . . . . . 83
Validate the Fix . . . . . . . . . . . . . . . . . . . . . . . . . . . . . . . . . . . . . . . . . . . 84
Document the Fix . . . . . . . . . . . . . . . . . . . . . . . . . . . . . . . . . . . . . . . . . 85
Case Studies . . . . . . . . . . . . . . . . . . . . . . . . . . . . . . . . . . . . . . . . . . . . . . . . 85
Case Study 1: Obtaining Switch Statistics . . . . . . . . . . . . . . . . . . . . . . 85
Case Study 2: Investigating WAN Link Performance . . . . . . . . . . . . . . 87
Summary . . . . . . . . . . . . . . . . . . . . . . . . . . . . . . . . . . . . . . . . . . . . . . . . . . . . . . . 89
www .flukenetworks .com1
Network and Application Troubleshooting Guide Second Edition
Fluke Networks 2 www.flukenetworks.com3
Guide to Troubleshooting Application Problems
For more resources: www.flukenetworks.com/content/edge
Guide to Troubleshooting Application Problems
IntroductionControversy began early on when computers were connected to
each other and programmers began to write applications that
sent information back and forth between them. The controversy is
whether the apparent slowness in performance of the application
is due to how the program is executing, or the slowness in the
network. When networks were first used, links were very slow when
compared to direct connections between computers, printers and
disk drives. So, networks often were blamed for the waiting time
for the system to produce output.
However, today’s networks operate at vastly higher speeds. When
users get frustrated with the performance of an application, it is
difficult to isolate whether the lack of performance is in the pro-
cessing in the network attached devices, or in the network itself.
In this document, we will address this problem. In order to do
this we will need to discuss how applications work. In particular,
we will focus on how they use or fail to use the network. This will
include both failure to send information in a timely manner and
failure to respond to requests coming from the network. We’ll
also give you a guide in what to look for when troubleshooting
applications.
BackgroundCompanies have become almost totally dependent on computers
to conduct their business. How many times have you been in a
retail store or government office and heard a staff member say,
“We can’t help you because the system is down.” Companies
depend on computers for a variety of tasks. Revenue and
expenditures are recorded in transaction processing systems.
Orders are taken and inventories are adjusted in similar systems.
Most written communications are now done by email rather
than by letters that are typed and mailed. Even instant written
communications such as instant messaging are moving from fad
status to serious message communications where business is
negotiated and deals are closed.
Beginning about 2000, businesses began to seriously evolve
voice communications over to data networks with VoIP (Voice over
IP). Most communications carriers and a majority of large enter-
prise companies use VoIP exclusively for voice messaging. With
the explosion of YouTube and Internet TV, video is beginning to
come into enterprise networks as well. Very recently, a new area
is collaboration. Under the label of Web 2.0, it represents a group
of tools that allow users to share and exchange voice, data and
video for the purpose of collaborating on projects. These tools
and services are rapidly becoming popular with lawyers, marketing
groups, consulting firms and service providers such as architects
and engineers.
In TCP/IP networks, applications can be distinguished by
the protocol over which they run. TCP and UDP were created nearly
forty years ago and have proven to be extremely robust. While
modifications in TCP have been made over the years, its essential
operation has remained almost constant. In our document we’ll
focus on TCP applications, since they represent the large majority
of data-based applications in which users may report slowness.
Fluke Networks 4 www.flukenetworks.com5
Guide to Troubleshooting Application Problems
For more resources: www.flukenetworks.com/content/edge
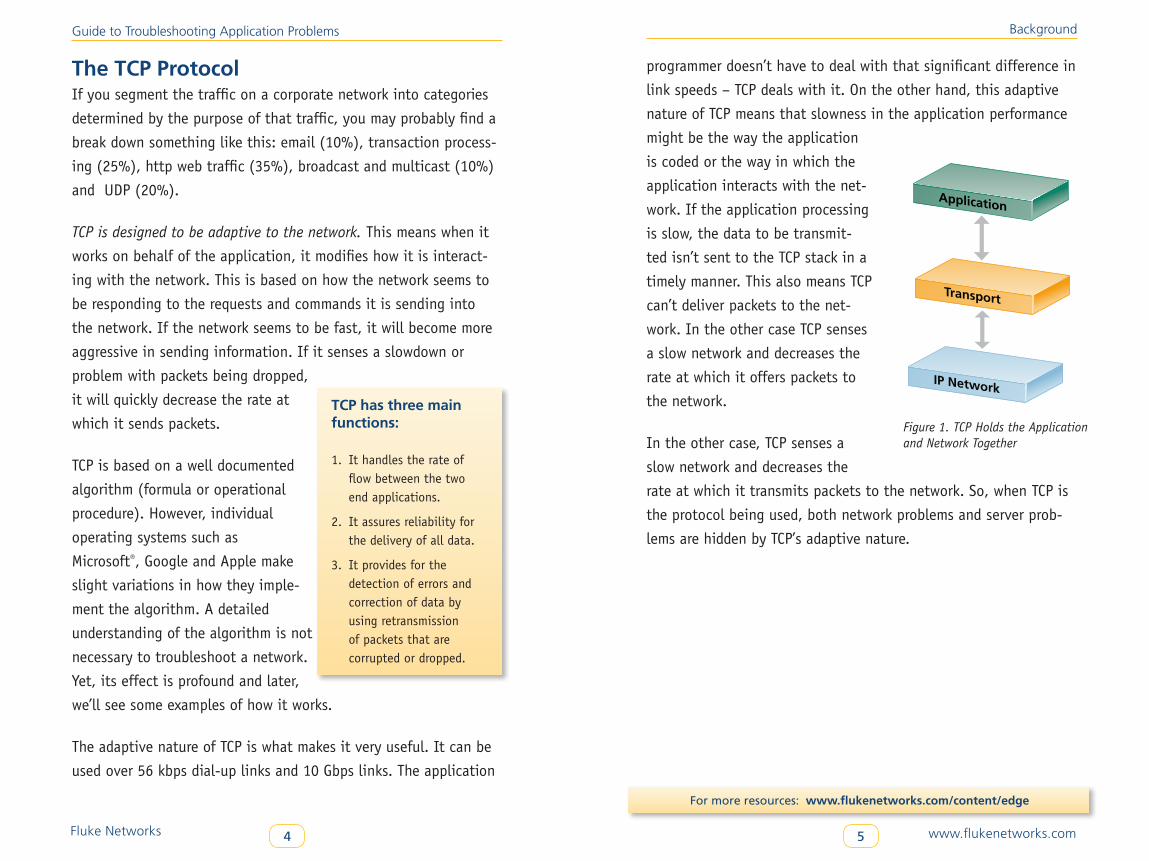
The TCP Protocol If you segment the traffic on a corporate network into categories
determined by the purpose of that traffic, you may probably find a
break down something like this: email (10%), transaction process-
ing (25%), http web traffic (35%), broadcast and multicast (10%)
and UDP (20%).
TCP is designed to be adaptive to the network. This means when it
works on behalf of the application, it modifies how it is interact-
ing with the network. This is based on how the network seems to
be responding to the requests and commands it is sending into
the network. If the network seems to be fast, it will become more
aggressive in sending information. If it senses a slowdown or
problem with packets being dropped,
it will quickly decrease the rate at
which it sends packets.
TCP is based on a well documented
algorithm (formula or operational
procedure). However, individual
operating systems such as
Microsoft®, Google and Apple make
slight variations in how they imple-
ment the algorithm. A detailed
understanding of the algorithm is not
necessary to troubleshoot a network.
Yet, its effect is profound and later,
we’ll see some examples of how it works.
The adaptive nature of TCP is what makes it very useful. It can be
used over 56 kbps dial-up links and 10 Gbps links. The application
TCP has three main functions:
1. It handles the rate of flow between the two end applications.
2. It assures reliability for the delivery of all data.
3. It provides for the detection of errors and correction of data by using retransmission of packets that are corrupted or dropped.
Background
programmer doesn’t have to deal with that significant difference in
link speeds – TCP deals with it. On the other hand, this adaptive
nature of TCP means that slowness in the application performance
might be the way the application
is coded or the way in which the
application interacts with the net-
work. If the application processing
is slow, the data to be transmit-
ted isn’t sent to the TCP stack in a
timely manner. This also means TCP
can’t deliver packets to the net-
work. In the other case TCP senses
a slow network and decreases the
rate at which it offers packets to
the network.
In the other case, TCP senses a
slow network and decreases the
rate at which it transmits packets to the network. So, when TCP is
the protocol being used, both network problems and server prob-
lems are hidden by TCP’s adaptive nature.
Figure 1
IP Network
Transport
Application
Figure 1. TCP Holds the Application and Network Together
Fluke Networks 6 www.flukenetworks.com7
Guide to Troubleshooting Application Problems
For more resources: www.flukenetworks.com/content/edge
The Life of a PacketLet’s consider a relatively simple model of client/server interaction
where TCP is being used. Let’s say we have data to send from the
client to the server. (It works almost identically when the server
sends data to the client.) The client application creates a block
of data and sends it to the TCP software in the client’s computer.
It’s placed in an output buffer and timers are started that
are associated with that block of data. TCP finds out from the
operating system how much data it can send in each outgoing
TCP block called a segment or Maximum Segment Size (MSS).
TCP MSSs can range from 1460 bytes for 100 Mb and 8960 bytes for
1 Gb (with Jumbo Frames).
This segment is delivered to the IP software and the IP addresses
of the sender and receiver are added. Then the IP software
contacts the operating system to say an outgoing message is
ready to be sent. When the operating system gives the okay,
the outgoing packet is moved to the network interface card (NIC)
to be sent. In this entire process, the performance of the client
processor is critical to how fast this all can take place.
After the packet is sent from the interface card, the network
performance is the critical factor. Packets can follow a short, fast
route, a slow, long route or any combination of links. It is common
for a packet to traverse 10-20 individual network links when going
over an Internet connection. Like the adage about the strength
of a chain depending on the weakest link, the speed through the
network depends on the slowest link. More often than not, the
Background
slowest link is the access link into the network and the egress link
out of the network.
At the server, the TCP segment is received on the NIC, delivered
to the IP software and the process described above is reversed.
During this process, it is the speed of the processing in the server
that affects how quickly the data is received and the acknowledge-
ment is prepared to be sent back.
In conclusion, there are three critical phases necessary for the
successful delivery of the application message to the server’s
application:
1. Processing of the message in the client to prepare it to be sent.
2. Network delivery.
3. Processing in the server when the message arrives.
Other Troubleshooting FactorsThere are some other things that make it difficult to troubleshoot
TCP applications. The TCP protocol isn’t very well understood. Just
recently information about TCP’s operation has begun to appear
in networking textbooks and industry whitepapers. Yet, it is the
single layer of the seven layer model which has a significant
influence on the performance of the application-to-network
interface. Because it isn’t well understood, network engineers and
technicians usually don’t look at it as a source of explaining what
is causing a problem. Often, they look at server configurations,
Fluke Networks 8 www.flukenetworks.com9
Guide to Troubleshooting Application Problems
For more resources: www.flukenetworks.com/content/edge
cabling issues, or system memory as explanations when actually
these have little relationship to the underlying problem.
Also, TCP isn’t an especially efficient protocol. For years, data
communications experts considered an overhead amount of 20% or
more to be excessive. But TCP may operate with 50% or more over-
head when the actual application data bytes and the total bytes
are used to calculate the overhead.
Finally, as we will learn later in this document, TCP reacts very
aggressively to packets that are dropped within the network.
When a single packet is dropped, a file transfer may decrease its
delivery rate by 70% or more.
Why UDP is so DifferentWhile we won’t examine UDP in detail in this paper, it is worth-
while to consider how it compares with TCP. That will amplify what
we have learned about TCP.
UDP makes no provision for flow control, error detection or correc-
tion, or the reliability of data delivery. These responsibilities are
pushed up to the application. Therefore, since UDP involves much
less processing, poor performance is more often dependent on the
performance of the network or the slowness of the processor unit.
If the processor is slow, other applications will show the same
Background
slowness. This makes the isolation of the cause of slowness less
complicated than in the case of TCP applications.
Why is Understanding Troubleshooting ImportantWhen applications appear to be slow, frustrated users waste time
and energy. Slow applications cause lost time which, in turn,
means lost money. Also, IT staff time is misspent. In some
instances, help desk or PC analysts expend much of their time
rebooting client stations or checking IP configurations and
cabling connections.
When an effort is made to learn about troubleshooting applications
and the skills are applied to the system to improve the perfor-
mance of both the network and the applications, it’s an investment
in the company. It pays off in dividends the same way that saving
on shipping costs, reducing fuel consumption or eliminating any
other inefficiency, pay off.
But troubleshooting TCP applications isn’t easy. Unlike voice or
video, which are typically UDP based, application performance
degradation isn’t obvious. If the sound is bad or the TV screen
shows distortion, everyone sees it immediately. But with TCP
applications like transaction processing systems, performance
tends to be judged based on how the system behaved yesterday.
If it is slower today than it was yesterday, users begin to
complain. Even worse, if the application degrades slowly, the
Fluke Networks 10 www.flukenetworks.com11
Guide to Troubleshooting Application Problems
For more resources: www.flukenetworks.com/content/edge
change may not be detected at all and the company begins to
lose money through the inefficiency.
Understanding Types of ApplicationsThere are many examples of applications that will fall under our
scrutiny. Web applications include both applications that actually
communicate over the Internet and any that use a browser such
as Internet Explorer®, Chrome®, Safari® or Firefox®. The latter
are often called web enabled applications. It is becoming more
common for applications to be described as “browser-based.” This
generally means that the user begins by opening a browser and
connecting to the server application from within that browser
window. Most of us have used these applications when we do on-
line banking, order a movie, or reserve an airline ticket. What is
important to us is that the underlying traffic will be transmitted
between the client and the server using HTTP (hypertext transfer
protocol) or HTTPS (secure hypertext transfer protocol). Both of
these are TCP based application program interfaces.
SQL (structured query language) applications involve calls from
a client application to a server database application for records
or tables from a SQL database. These can be, or don’t have to be,
web enabled and use HTTP or HTTPS. For example, the client
application can present a result to a user that asks for a field to
be completed on the screen. After filling in a value, it is sent to
the server to do a computation. The server takes the result and
determines that another record needs to be returned to the
client. All of this interaction takes place under the control of the
TCP protocol and will be affected by TCP’s operation, the individual
processors’ performances and the network’s performance.
Background
Closely associated to database activity are transaction processing
systems. These often overlap SQL database applications.
In transaction processing systems, the emphasis is on taking
relatively small amounts of data and doing a calculation in a short
period of time. ERP systems that have individual components such
as an accounts payable module, inventory module, or order entry
module are examples of transaction processing systems. When a
user changes a customer’s telephone number, a transaction has
occurred. The data to make such a change and the information
that shows that the change occurred are transferred between
the client and the server under the control of TCP.
Imaging systems, such as those that inventory photos or x-rays,
are also very often TCP based. They are usually very large files and
moving them from a server to a client is a bulk transfer. Such bulk
transfers are the reason TCP was originally designed. One major
application program interface that is used to do this is FTP
(file transfer protocol). It can be executed from the command
line, from within a file transfer program or from within a browser.
A user clicks on a thumbnail of the image they want to view and
the FTP protocol is invoked to retrieve the image from the server.
FTP is one of the best examples of simple application of the TCP
protocol. The client identifies the file to be retrieved (in this case
an image), and a separate connection is opened for the transfer.
The emphasis in the operation is to send as much data as possible
as quickly as the network can handle it. These applications can
saturate links on networks more quickly than almost any other type
of application. As a result, they appear to be more sensitive to the
Fluke Networks 12 www.flukenetworks.com13
Guide to Troubleshooting Application Problems
For more resources: www.flukenetworks.com/content/edge
method of operation dictated within TCP. Small network problems
become very evident in a file transfer, especially if it is a large file.
Data warehousing systems are also dependent on bulk file
transfers. A data warehouse is generally considered to be a highly
organized, indexed repository of a company’s electronic documents.
When a document needs to be retrieved, the client application
indicates the document or documents or parameters that uniquely
define the information needed. When the server application
receives this information, it retrieves the information and sends
it as a bulk file transfer. Consequently they are nearly always TCP
based. And, as a result, they behave very much like other file
transfer based processes.
While VoIP payload is transferred between the phones using UDP,
the call set-up often uses TCP. In the exchange that takes place
when a phone goes off-hook, only small amounts of data are
transferred. However, the process can involve ARP, DNS and other
protocols that may be required. Poor performance or failure in
this connection won’t affect the quality of the call. Problems will
be apparent in the time it takes to make the connection or the
lack of signaling tones to which we have become accustomed. For
example, the user might dial but not hear either a busy signal or a
ringing tone.
Another category of applications that use TCP are CRM (customer relationship management) systems. They are usually
a combination of transaction oriented and database systems.
They also depend on TCP.
Before we delve more deeply into the application flow process,
we need to consider one more item.
Application Flow
Application FlowWe’re going to consider six issues that affect application flow: 1. DNS lookups
2. ARP resolution
3. Establishing the TCP connection
4. Sender/receiver (interaction)
5. Data flow
6. Closing the TCP connection
In this section we will not consider UDP applications because they
typically represent 15% or less of the traffic on the network and
it is easier to isolate the cause of the poor performance. We will
discuss UDP later in the paper.
The Amazing Sequence of Events in Connecting to a ServerVery few of us ever stop to consider what is actually taking
place when we click on an icon that tells our application to get
something from a server. But understanding the process can be
very helpful. Let’s start when our user sits down at their desk to
begin working with the application. We’ll assume the computer was
turned off over night and the first thing they want to do is check
the company’s home page for notifications about weather related
cancellations.
Fluke Networks 14 www.flukenetworks.com15
Guide to Troubleshooting Application Problems
For more resources: www.flukenetworks.com/content/edge
Here is a typical sequence:
1. Computer off.
2. Computer powered up.
3. OS loaded, NIC detected.
4. If DHCP is enabled, the DHCP server is contacted to receive these values.
5. TCP/IP stack checked: IP address, mask, default router (gateway) and DNS server known.
6. User indicates to start connection to server (e.g. open IE).
7. IE request is created for the default home page (e.g. www.google.com).
8. IP software looks up a DNS server IP address (which we assume is not local).
9. IP software sends ARP request to local net to get MAC address of router.
10. The router receives the ARP broadcast, recognizes that it is the target of the query and sends a response containing its MAC address onto the network as a broadcast.
11. IP software sends DNS request to router, which forwards to DNS server.
12. DNS server returns IP address for www.google.com.
13. TCP/IP stack makes TCP connection request.
14. Network delivers connection request.
15. Connection established.
16. (Story to be continued later).
Application Flow
It’s rather easy to see that there is much that can go wrong.
We’ll be referring back to this sequence later in our discussion.
With the dependence that companies have on TCP based
applications, we now turn our attention to the six phases of
the TCP connection between the client and server applications.
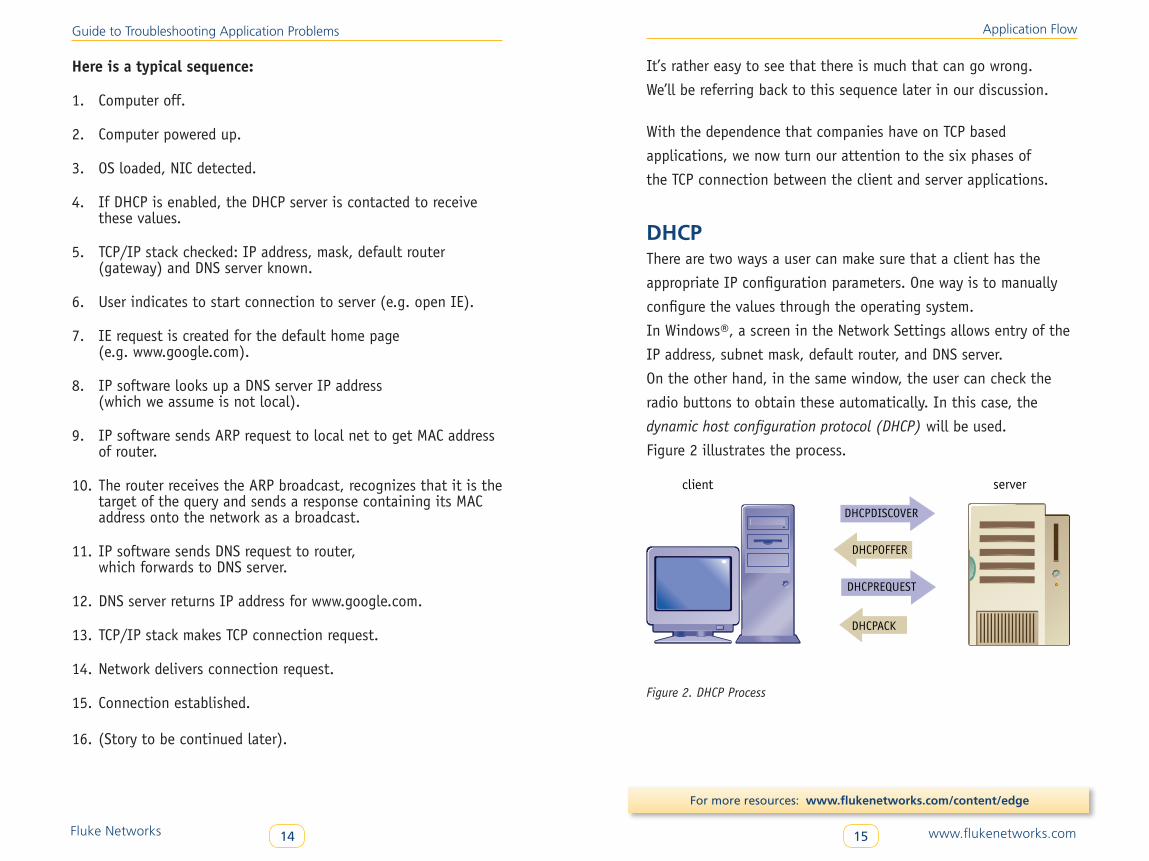
DHCPThere are two ways a user can make sure that a client has the
appropriate IP configuration parameters. One way is to manually
configure the values through the operating system.
In Windows®, a screen in the Network Settings allows entry of the
IP address, subnet mask, default router, and DNS server.
On the other hand, in the same window, the user can check the
radio buttons to obtain these automatically. In this case, the
dynamic host configuration protocol (DHCP) will be used.
Figure 2 illustrates the process.
client server
DHCPREQUEST
DHCPOFFER
DHCPDISCOVER
DHCPACK
Figure 2. DHCP Process
Fluke Networks 16 www.flukenetworks.com17
Guide to Troubleshooting Application Problems
For more resources: www.flukenetworks.com/content/edge
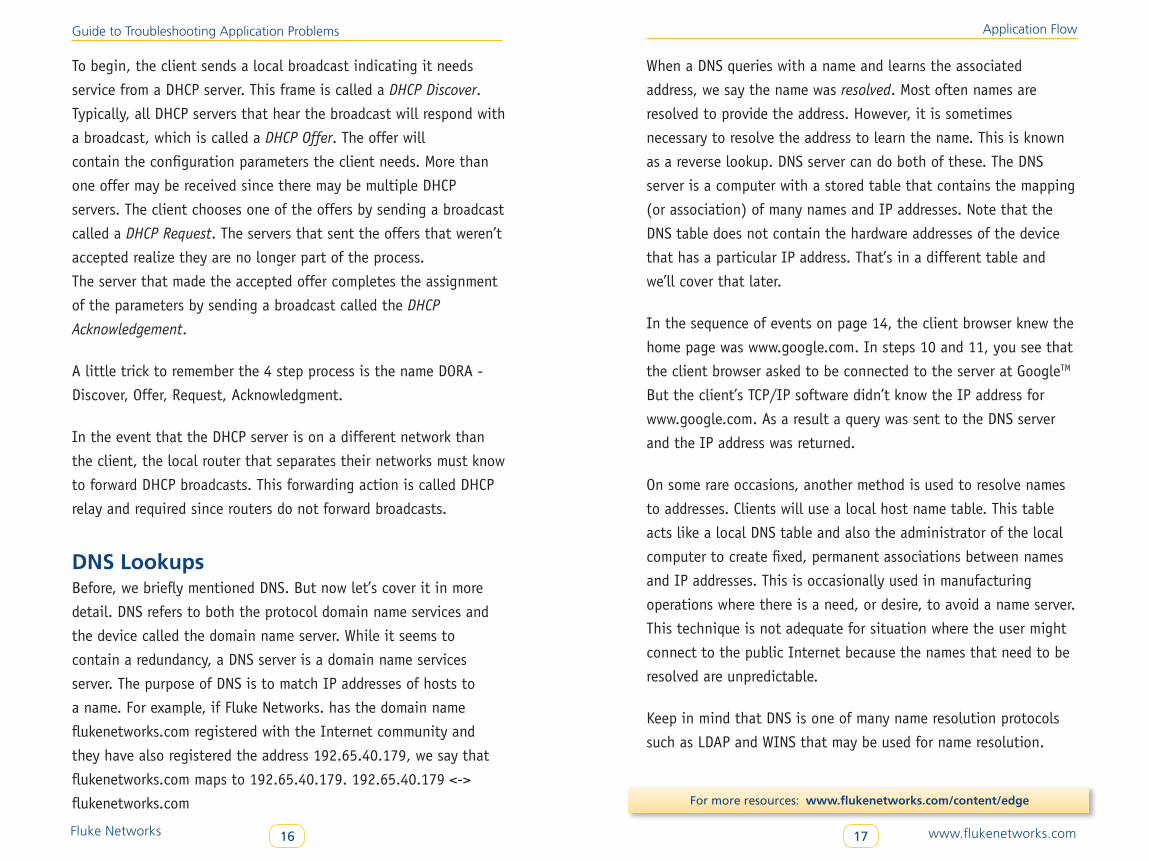
To begin, the client sends a local broadcast indicating it needs
service from a DHCP server. This frame is called a DHCP Discover.
Typically, all DHCP servers that hear the broadcast will respond with
a broadcast, which is called a DHCP Offer. The offer will
contain the configuration parameters the client needs. More than
one offer may be received since there may be multiple DHCP
servers. The client chooses one of the offers by sending a broadcast
called a DHCP Request. The servers that sent the offers that weren’t
accepted realize they are no longer part of the process.
The server that made the accepted offer completes the assignment
of the parameters by sending a broadcast called the DHCP
Acknowledgement.
A little trick to remember the 4 step process is the name DORA -
Discover, Offer, Request, Acknowledgment.
In the event that the DHCP server is on a different network than
the client, the local router that separates their networks must know
to forward DHCP broadcasts. This forwarding action is called DHCP
relay and required since routers do not forward broadcasts.
DNS LookupsBefore, we briefly mentioned DNS. But now let’s cover it in more
detail. DNS refers to both the protocol domain name services and
the device called the domain name server. While it seems to
contain a redundancy, a DNS server is a domain name services
server. The purpose of DNS is to match IP addresses of hosts to
a name. For example, if Fluke Networks. has the domain name
flukenetworks.com registered with the Internet community and
they have also registered the address 192.65.40.179, we say that
flukenetworks.com maps to 192.65.40.179. 192.65.40.179 <->
flukenetworks.com
Application Flow
When a DNS queries with a name and learns the associated
address, we say the name was resolved. Most often names are
resolved to provide the address. However, it is sometimes
necessary to resolve the address to learn the name. This is known
as a reverse lookup. DNS server can do both of these. The DNS
server is a computer with a stored table that contains the mapping
(or association) of many names and IP addresses. Note that the
DNS table does not contain the hardware addresses of the device
that has a particular IP address. That’s in a different table and
we’ll cover that later.
In the sequence of events on page 14, the client browser knew the
home page was www.google.com. In steps 10 and 11, you see that
the client browser asked to be connected to the server at GoogleTM
But the client’s TCP/IP software didn’t know the IP address for
www.google.com. As a result a query was sent to the DNS server
and the IP address was returned.
On some rare occasions, another method is used to resolve names
to addresses. Clients will use a local host name table. This table
acts like a local DNS table and also the administrator of the local
computer to create fixed, permanent associations between names
and IP addresses. This is occasionally used in manufacturing
operations where there is a need, or desire, to avoid a name server.
This technique is not adequate for situation where the user might
connect to the public Internet because the names that need to be
resolved are unpredictable.
Keep in mind that DNS is one of many name resolution protocols
such as LDAP and WINS that may be used for name resolution.
Fluke Networks 18 www.flukenetworks.com19
Guide to Troubleshooting Application Problems
For more resources: www.flukenetworks.com/content/edge
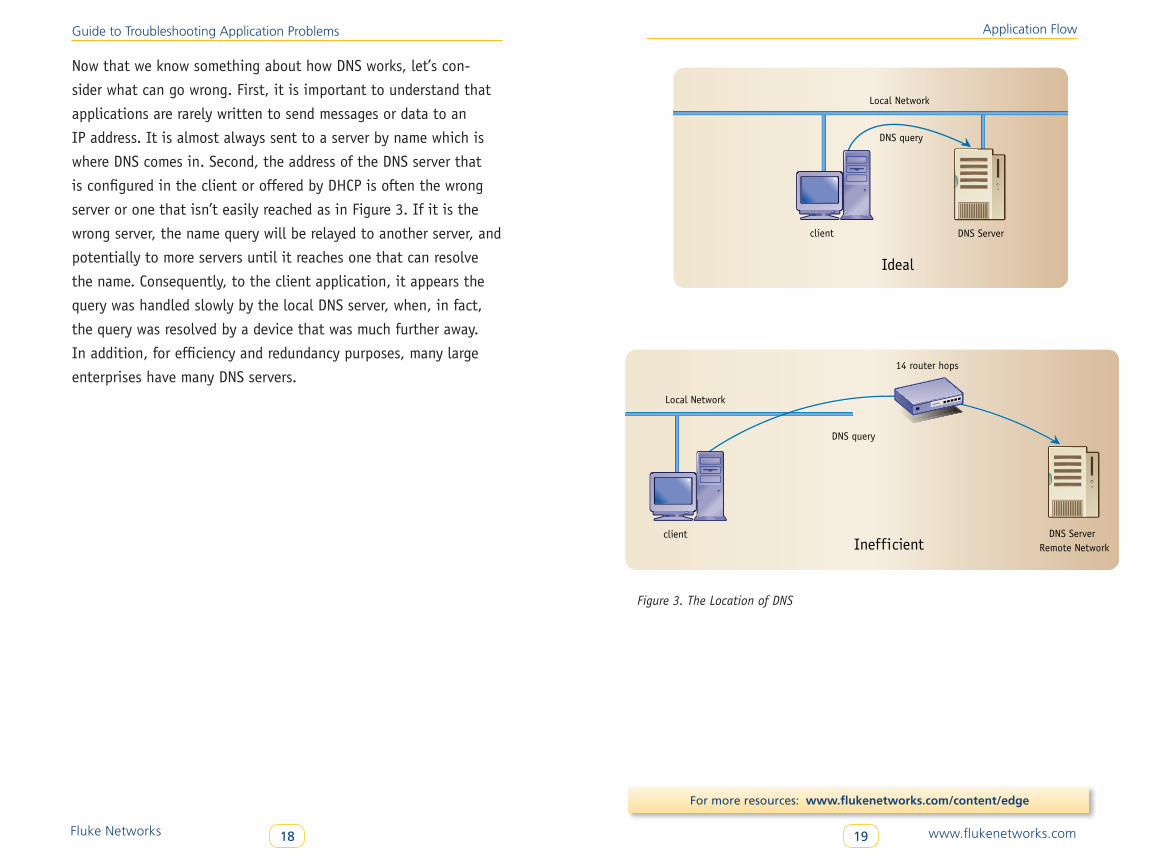
Now that we know something about how DNS works, let’s con-
sider what can go wrong. First, it is important to understand that
applications are rarely written to send messages or data to an
IP address. It is almost always sent to a server by name which is
where DNS comes in. Second, the address of the DNS server that
is configured in the client or offered by DHCP is often the wrong
server or one that isn’t easily reached as in Figure 3. If it is the
wrong server, the name query will be relayed to another server, and
potentially to more servers until it reaches one that can resolve
the name. Consequently, to the client application, it appears the
query was handled slowly by the local DNS server, when, in fact,
the query was resolved by a device that was much further away.
In addition, for efficiency and redundancy purposes, many large
enterprises have many DNS servers.
Application Flow
Figure 3. The Location of DNS
DNS Serverclient
Figure 3
Local Network
Ideal
DNS query
client DNS ServerRemote NetworkInefficient
DNS query
14 router hops
Local Network
Fluke Networks 20 www.flukenetworks.com21
Guide to Troubleshooting Application Problems
For more resources: www.flukenetworks.com/content/edge
The packet that contains the query name is called a command.
The response, coming from the DNS server that contains the IP
address, is called the response. In Figure 4 you can see three DNS
commands and three corresponding responses.
Figure 4. DNS Commands and Responses
So, in conclusion, DNS can be slow due to network slowness,
improper or poor choice of DNS server, or a lost query. In the
latter case, usually the client automatically sends a second or third
request after it times out on the first request. DNS can also fail,
if the query contains a name that can’t be recognized or if no
DNS server can be found. Of these two possibilities, the second is
more common because the administrator of the computer lists a
nonexistent DNS server or provides an invalid address in the TCP/IP
configuration. For example, you might be surprised by how many
users configure their TCP/IP stack by inserting the company’s email
or web server in the DNS server field.
Application Flow
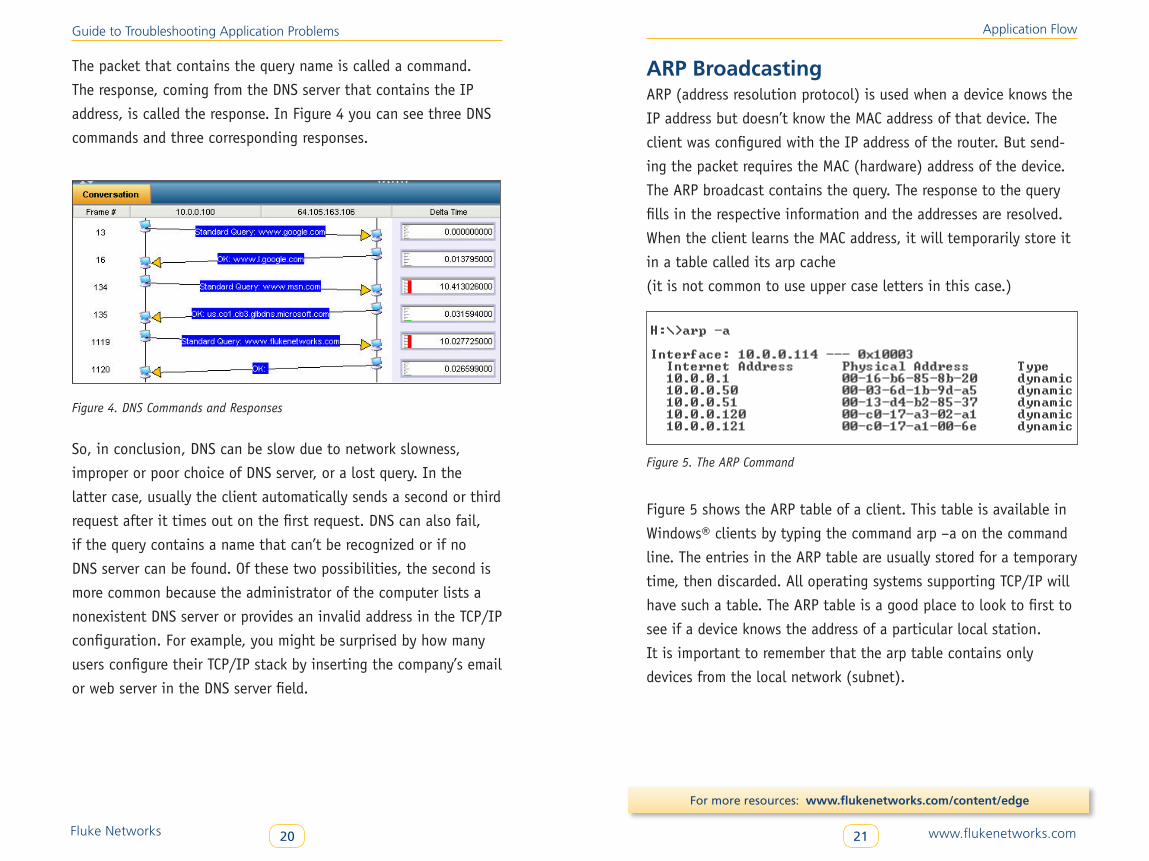
ARP BroadcastingARP (address resolution protocol) is used when a device knows the
IP address but doesn’t know the MAC address of that device. The
client was configured with the IP address of the router. But send-
ing the packet requires the MAC (hardware) address of the device.
The ARP broadcast contains the query. The response to the query
fills in the respective information and the addresses are resolved.
When the client learns the MAC address, it will temporarily store it
in a table called its arp cache
(it is not common to use upper case letters in this case.)
Figure 5. The ARP Command
Figure 5 shows the ARP table of a client. This table is available in
Windows® clients by typing the command arp –a on the command
line. The entries in the ARP table are usually stored for a temporary
time, then discarded. All operating systems supporting TCP/IP will
have such a table. The ARP table is a good place to look to first to
see if a device knows the address of a particular local station.
It is important to remember that the arp table contains only
devices from the local network (subnet).
Fluke Networks 22 www.flukenetworks.com23
Guide to Troubleshooting Application Problems
For more resources: www.flukenetworks.com/content/edge
Devices beyond a router will not be listed because they are on
another network.
Another view of this problem is illustrated here:
IP A <--> IP B
MAC x MAC y
Suppose the device with IP address A wants to send a message to
the device with IP address B. It knows its own MAC address but not
the MAC address of the other station. Its application directed the
message to be sent to IP address B. Or, possibly, its application
directed it be sent to a name at B and DNS provided the IP address
B. Either way, it still needs the MAC address of B to complete its
task. ARP will be invoked and the entry B and y will be added to
the arp table for temporary storage.
The ARP protocol is a necessary part of TCP networking (in the
case of IPv4). ARP is also used for some more discretionary tasks.
Sometimes referred to as discovery techniques, ARP is used when
a device like a server wants to see who is actually on a local
network. By sequentially sending an ARP query to every possible
address and then watching who responds, it can build a list of
devices that are actually functioning on the network. Windows®
browsing and many network troubleshooting tools implement this
technique.
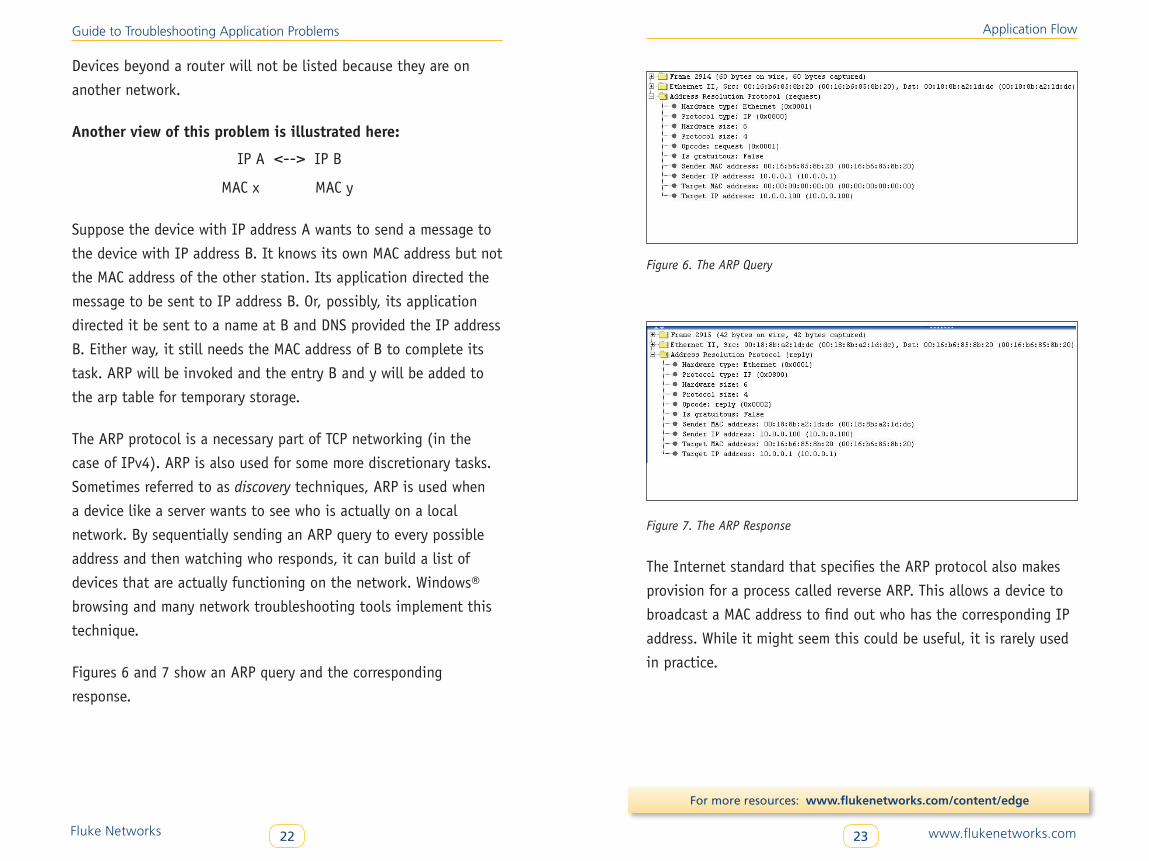
Figures 6 and 7 show an ARP query and the corresponding
response.
Application Flow
Figure 6. The ARP Query
Figure 7. The ARP Response
The Internet standard that specifies the ARP protocol also makes
provision for a process called reverse ARP. This allows a device to
broadcast a MAC address to find out who has the corresponding IP
address. While it might seem this could be useful, it is rarely used
in practice.
Fluke Networks 24 www.flukenetworks.com25
Guide to Troubleshooting Application Problems
For more resources: www.flukenetworks.com/content/edge
The Route to the ServerSuppose that the client has now obtained the IP address of the
server and knows it isn’t on the local network. The client also
knows the MAC address of the router. The client has a connection
request that needs to reach the server. Of course it will send it to
the router which will in turn forward it to another router, and so
forth until it arrives at the router on the server’s local network.
Keep in mind, that when it reaches the destination network, that
router may need to invoke ARP to get the server’s MAC address.
But how many steps (links) will the connection request pass
through and how fast and reliable is each link? And, is the route
selected the optimal route? Usually that is determined by two
things: how the network was designed and what routing protocol
was used. If a particular link is slow and was used to create the
path from the client to the server, a response to the connection
request will be slow. Had a faster link been used to create the path
the response will be quicker.
In today’s IP networks, routers establish a set of links between
the potential sending and receiving networks using a routing
protocol. Investigating how such protocols work is beyond the
scope of this document, but it is important to understand a few
things that are common to all routing protocols. First, they are
dynamic and automatic. That is, they will build a set of links
among themselves so that all devices can be reached by other
devices. Second, they periodically update each other so that if a
link fails, a new set of paths are created. Finally, they all make
provisions for static routes, or routes that are manually created and
remain fixed under all circumstances. Consequently, the choice of
the route from the client to the server is made by the network
Application Flow
and not the client or the server. Some routing protocols allow
routers to select links based on the quality of the links. Other
routing protocols use only the criterion of how many links remain
to the destination network.
Probably the most widely used tool for investigating the route
between two devices is the application trace route, which is built
into nearly all TCP/IP stacks. While we’ll discuss trace route later,
it is helpful to look at the output created by using it.
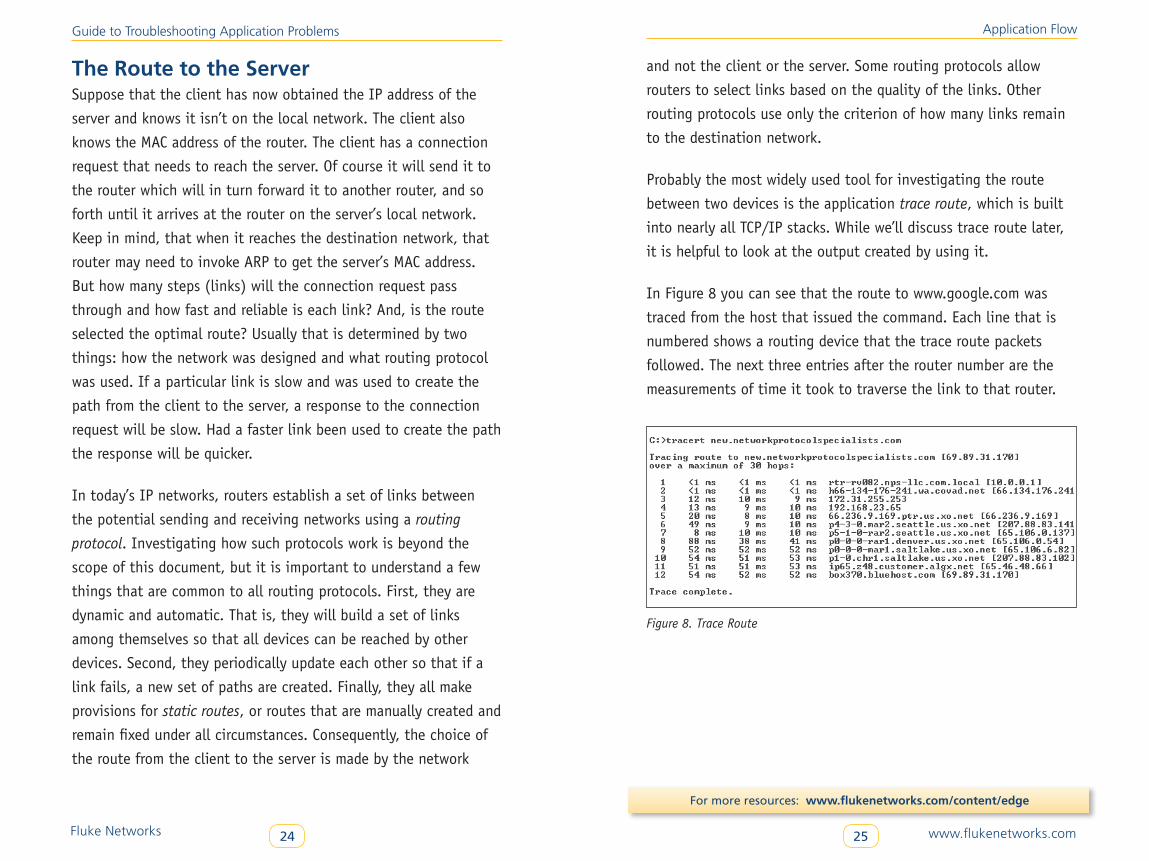
In Figure 8 you can see that the route to www.google.com was
traced from the host that issued the command. Each line that is
numbered shows a routing device that the trace route packets
followed. The next three entries after the router number are the
measurements of time it took to traverse the link to that router.
Figure 8. Trace Route
Fluke Networks 26 www.flukenetworks.com27
Guide to Troubleshooting Application Problems
For more resources: www.flukenetworks.com/content/edge
Establishing the Connection to the ServerThe method of creating the connection for all TCP applications is
the same. It is widely known as the three-way handshake. Here’s
what happens.
Before data can be transferred over the connection, certain param-
eters of operation must be agreed upon by the sending and receiv-
ing TCP stacks. Just a reminder that TCP is responsible for flow
control, reliable delivery, and error control. In order to determine
on how this will be handled, each TCP stack exchanges certain
information during this three-way handshake. For example, in order
to establish the maximum number of bytes that will be permitted
in each packet, the sender includes a statement of the intended
MSS (maximum segment size). While this is normally 1460 bytes, it
isn’t mandatory that value be used.
Another thing that must be established is how many bytes the
receiver can receive in total in its receive buffer. This value, called
the window advertisement, is also indicated in the first packet
exchanged in the handshake. The other end records this value and
any adjustments it receives so that it never overwhelms its partner
with too much data. The exchange of these two values provide for
flow control.
Additional parameters which may be advertised are Selective
Acknowledgements (more efficient retransmissions) and Scale
Option (increase TCP Window past 65K).
Another value that must be established is the point at which each
end will begin to count bytes of data. This is a random value called
the initial sequence number and each announces their value in
Application Flow
the first two steps of the handshake. From that initial value, every
byte of data transferred increases the sequence value by exactly
one. So, for example, if the initial sequence number for a device
is 36,100,000 and it transfers 50 bytes of data, the next sequence
value it will use is 36,100,050.
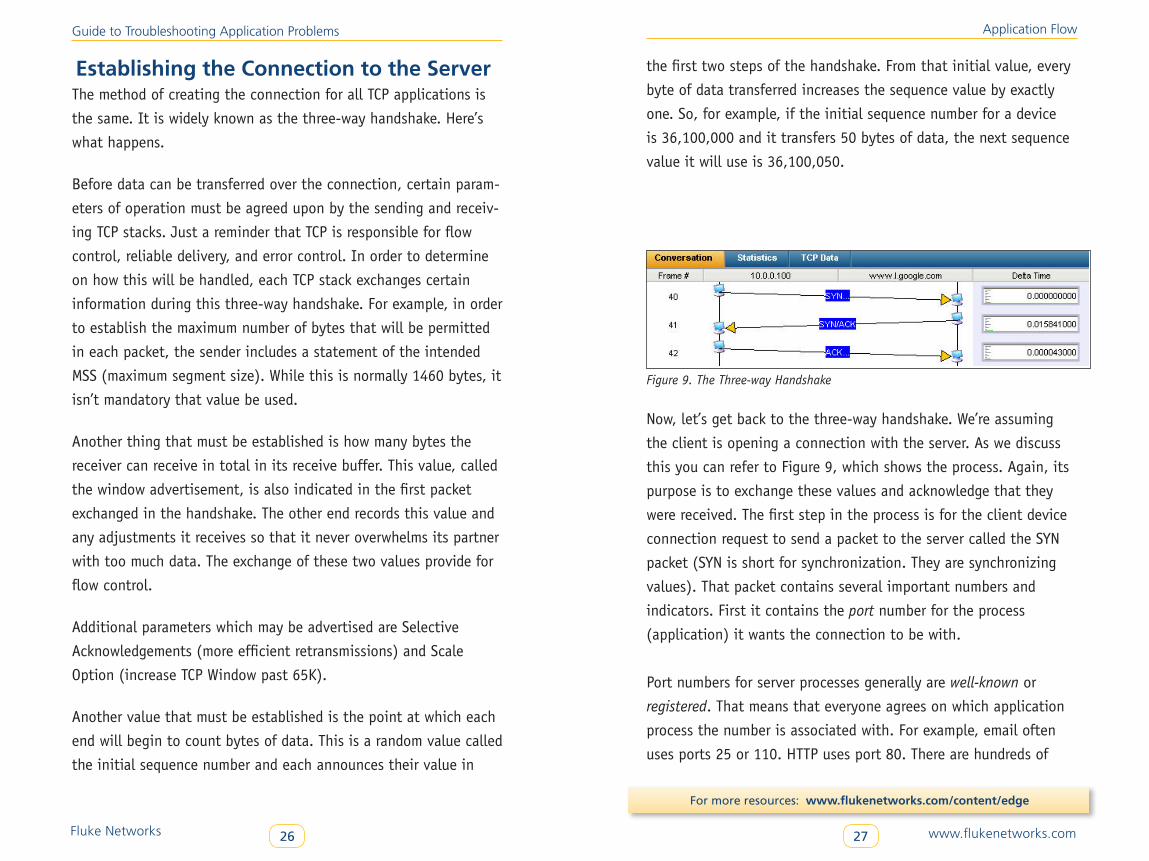
Figure 9. The Three-way Handshake
Now, let’s get back to the three-way handshake. We’re assuming
the client is opening a connection with the server. As we discuss
this you can refer to Figure 9, which shows the process. Again, its
purpose is to exchange these values and acknowledge that they
were received. The first step in the process is for the client device
connection request to send a packet to the server called the SYN
packet (SYN is short for synchronization. They are synchronizing
values). That packet contains several important numbers and
indicators. First it contains the port number for the process
(application) it wants the connection to be with.
Port numbers for server processes generally are well-known or
registered. That means that everyone agrees on which application
process the number is associated with. For example, email often
uses ports 25 or 110. HTTP uses port 80. There are hundreds of
Fluke Networks 28 www.flukenetworks.com29
Guide to Troubleshooting Application Problems
For more resources: www.flukenetworks.com/content/edge
others. It’s a good idea to learn most of the common ones. Like
so many other network topics, using your favorite search engine
and the phrase “TCP port numbers” will lead you to many lists that
are available. In this step, the client will normally use a randomly
chosen port. For example, Windows® often selects a value in the
range of 2000-2500.
The SYN packet also contains the sender’s window advertisement.
Also, it contains a request for the maximum transmission unit
(MTU). Finally, it indicates the fact that it is a SYN packet by
setting a single bit equal to one. That particular bit is never set
to one unless SYN is being indicated.
In the second step in the three-way handshake, the server sends
a response called the SYN/ACK packet to the client. It contains
its window advertisement, initial sequence number and the port
numbers of the two application processes. It also takes the
sequence number it received, increases the value by one and
returns it as its acknowledgement value. This is how it tells the
other TCP entity that it is now synchronized to its sequence
numbers. It will also change the value of a single bit, the
acknowledgement bit to one. Therefore, in its packet both the
SYN bit and the ACK bit are one and that is why the packet is
called the SYN/ACK packet.
In the third and last step of the handshake, the client sends
a packet with the sequence number increased by one (That’s
cheating because it didn’t actually send data bytes. It’s the only
exception to the rule about sequence numbers.) This third packet
allows the client to acknowledge that it received the server’s
acceptance of the opening of the connection. The connection is
Application Flow
now prepared to allow data to flow between the two applications
represented by the port numbers.
A common metric of performance of the network application is the
round trip time (RTT). This is the time from when the SYN is sent
and the SYN/ACK is returned. This value is one of the things the
sending TCP stack uses to determine how much data should be
offered to the network. If the RTT is low, the network appears to
be fast. If the RTT is high, the network or the server appears to
be slow and the TCP stack will adjust accordingly.
In Figure 10, an HTTP Get command is sent to the server in the
first step. 65 ms. later that packet is acknowledged. This time
is the RTT. It is important to note that this value isn’t the
application response time. This is the acknowledgement of the
TCP protocol in the server. The application responds in the third
step shown in Figure 10.
Fluke Networks 30 www.flukenetworks.com31
Guide to Troubleshooting Application Problems
For more resources: www.flukenetworks.com/content/edge
Sender/Receiver InteractionThe most common model for interaction in the TCP/IP environ-
ment is the client server model. In this model, the client makes a
request for some form of service and the server fulfills this request.
For example, the client browser may request the objects on a home
page. An ERP client may request a field from within a data record
on the server. As illustrated before, a client process may invoke FTP
to receive a large file. In each case, the client is making a request
that it hopes the server will fulfill. The server applications that
fulfill these requests are sometimes called services. So, we may say
that a particular service is or isn’t available on the server. The way
a client knows whether or not a service (process) is available is
by the response to the SYN packet. If the server responds to the
SYN with a SYN/ACK, it is informing the client that the service is
available. For example, that’s why requests for web pages are sent
to port 80. That port identifies a server that is acting as a web
server. While it might also act as an email server, if it doesn’t
respond to SYNs sent to port 25, it is informing the client it
doesn’t do email services using the SMTP (simple mail transfer
protocol) system. That service is not available.
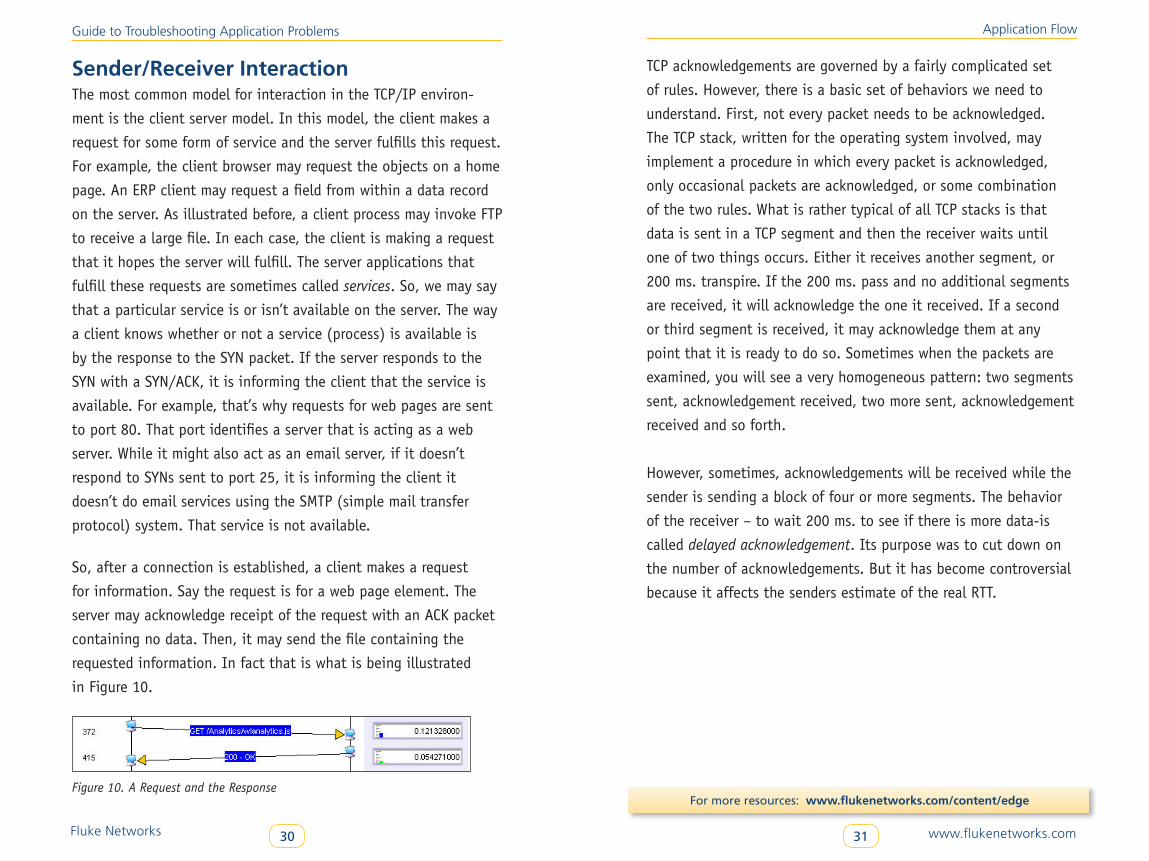
So, after a connection is established, a client makes a request
for information. Say the request is for a web page element. The
server may acknowledge receipt of the request with an ACK packet
containing no data. Then, it may send the file containing the
requested information. In fact that is what is being illustrated
in Figure 10.
Figure 10. A Request and the Response
Application Flow
TCP acknowledgements are governed by a fairly complicated set
of rules. However, there is a basic set of behaviors we need to
understand. First, not every packet needs to be acknowledged.
The TCP stack, written for the operating system involved, may
implement a procedure in which every packet is acknowledged,
only occasional packets are acknowledged, or some combination
of the two rules. What is rather typical of all TCP stacks is that
data is sent in a TCP segment and then the receiver waits until
one of two things occurs. Either it receives another segment, or
200 ms. transpire. If the 200 ms. pass and no additional segments
are received, it will acknowledge the one it received. If a second
or third segment is received, it may acknowledge them at any
point that it is ready to do so. Sometimes when the packets are
examined, you will see a very homogeneous pattern: two segments
sent, acknowledgement received, two more sent, acknowledgement
received and so forth.
However, sometimes, acknowledgements will be received while the
sender is sending a block of four or more segments. The behavior
of the receiver – to wait 200 ms. to see if there is more data-is
called delayed acknowledgement. Its purpose was to cut down on
the number of acknowledgements. But it has become controversial
because it affects the senders estimate of the real RTT.
Fluke Networks 32 www.flukenetworks.com33
Guide to Troubleshooting Application Problems
For more resources: www.flukenetworks.com/content/edge
The Flow of DataTCP has a long list of rules that the sending and receiving
protocol software must follow. The method used in the complete
implementation of the protocol is beyond the scope of this
document. However, here are a few of the rules that help in
understanding the relationship between how TCP behaves and
the network performance:
• Delayed acknowledgements, described above.
• If packets are received out of order, the last segment isn’t
acknowledged until the missing segments are received. Rather,
the last segment that was received in order is acknowledged.
• If a sender doesn’t receive an acknowledgement of a segment,
it doesn’t immediately resend the segment. (It could still be
in transit). Instead, it waits until it receives three duplicate
acknowledgements of the previously received segment.
At that point it assumes the next segment was lost and
proceeds with the retransmission. Since this is often before
a time out on the segment has occurred, the policy is called
fast retransmission.
• It uses a technique called slow start. In this procedure one or
two segments are sent and the acknowledgements are awaited.
If they return quickly, the sender increases the block size (that
is, the number of segments it sends simultaneously). It will
continue to increase the block size until one of two things hap-
pens: either there is a time out because an acknowledgement
isn’t received (such as when a segment has been discarded) or
the total data sent is one-half the receiver’s advertised window
value.
Application Flow
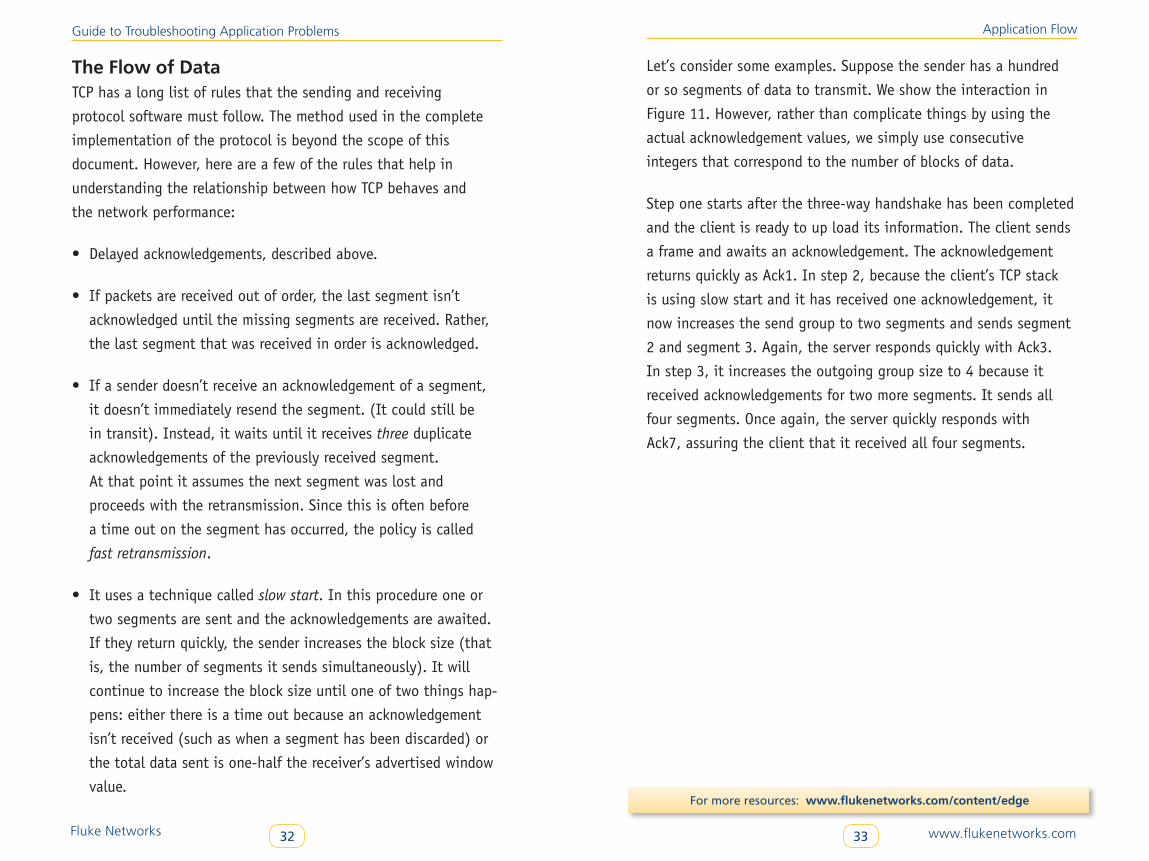
Let’s consider some examples. Suppose the sender has a hundred
or so segments of data to transmit. We show the interaction in
Figure 11. However, rather than complicate things by using the
actual acknowledgement values, we simply use consecutive
integers that correspond to the number of blocks of data.
Step one starts after the three-way handshake has been completed
and the client is ready to up load its information. The client sends
a frame and awaits an acknowledgement. The acknowledgement
returns quickly as Ack1. In step 2, because the client’s TCP stack
is using slow start and it has received one acknowledgement, it
now increases the send group to two segments and sends segment
2 and segment 3. Again, the server responds quickly with Ack3.
In step 3, it increases the outgoing group size to 4 because it
received acknowledgements for two more segments. It sends all
four segments. Once again, the server quickly responds with
Ack7, assuring the client that it received all four segments.
Fluke Networks 34 www.flukenetworks.com35
Guide to Troubleshooting Application Problems
For more resources: www.flukenetworks.com/content/edge
1
Figure 11: TCP Ideal Flow
client
time
2
server
1
3
4
Ack 1
2
3
4
7
8
Ack 12
Ack 3
Ack 7
12
}
Figure 11. TCP Operation
Application Flow
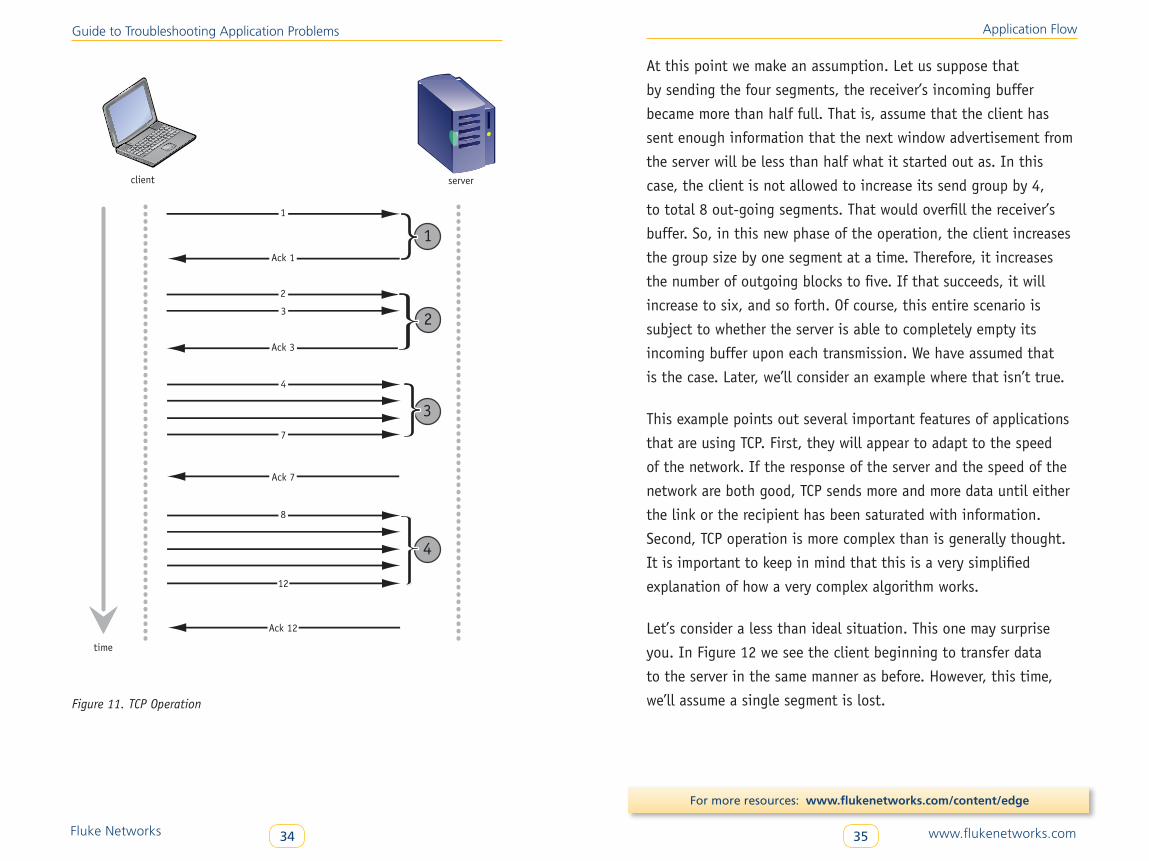
At this point we make an assumption. Let us suppose that
by sending the four segments, the receiver’s incoming buffer
became more than half full. That is, assume that the client has
sent enough information that the next window advertisement from
the server will be less than half what it started out as. In this
case, the client is not allowed to increase its send group by 4,
to total 8 out-going segments. That would overfill the receiver’s
buffer. So, in this new phase of the operation, the client increases
the group size by one segment at a time. Therefore, it increases
the number of outgoing blocks to five. If that succeeds, it will
increase to six, and so forth. Of course, this entire scenario is
subject to whether the server is able to completely empty its
incoming buffer upon each transmission. We have assumed that
is the case. Later, we’ll consider an example where that isn’t true.
This example points out several important features of applications
that are using TCP. First, they will appear to adapt to the speed
of the network. If the response of the server and the speed of the
network are both good, TCP sends more and more data until either
the link or the recipient has been saturated with information.
Second, TCP operation is more complex than is generally thought.
It is important to keep in mind that this is a very simplified
explanation of how a very complex algorithm works.
Let’s consider a less than ideal situation. This one may surprise
you. In Figure 12 we see the client beginning to transfer data
to the server in the same manner as before. However, this time,
we’ll assume a single segment is lost.
Fluke Networks 36 www.flukenetworks.com37
Guide to Troubleshooting Application Problems
For more resources: www.flukenetworks.com/content/edge
Application Flow
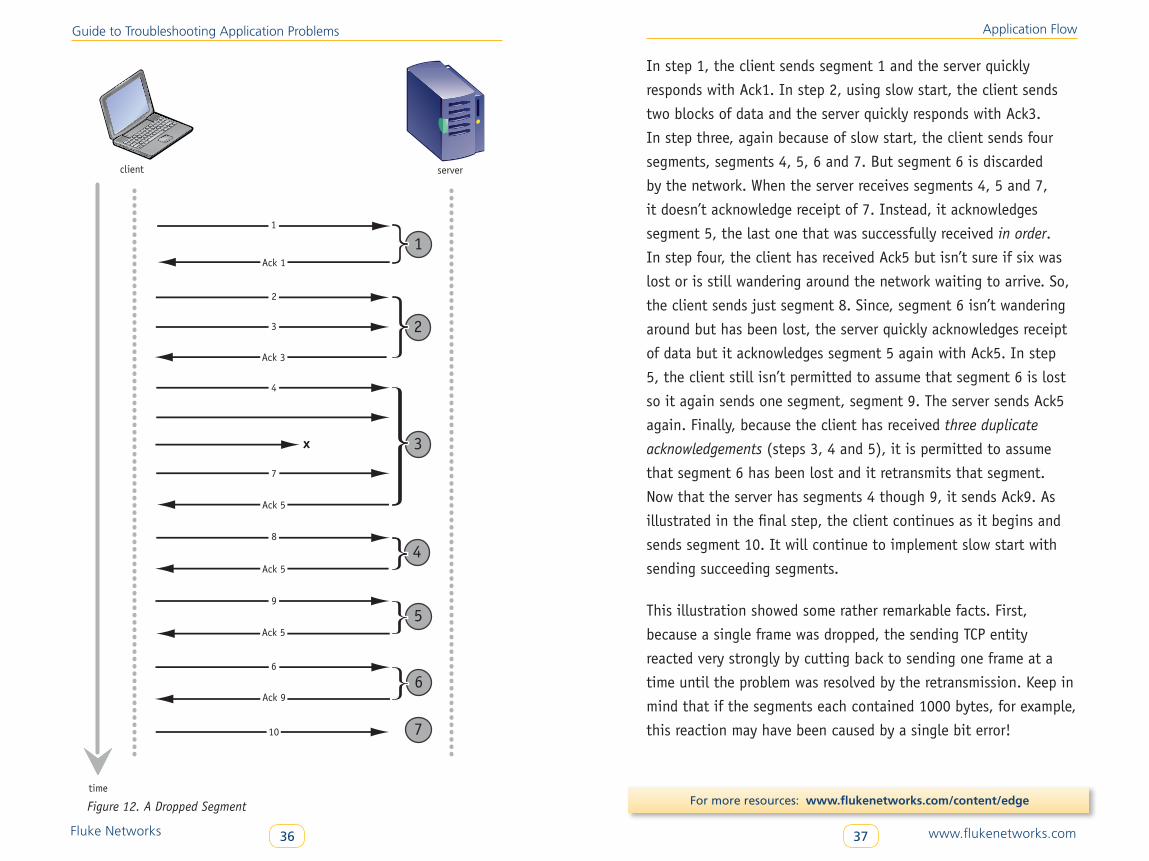
In step 1, the client sends segment 1 and the server quickly
responds with Ack1. In step 2, using slow start, the client sends
two blocks of data and the server quickly responds with Ack3.
In step three, again because of slow start, the client sends four
segments, segments 4, 5, 6 and 7. But segment 6 is discarded
by the network. When the server receives segments 4, 5 and 7,
it doesn’t acknowledge receipt of 7. Instead, it acknowledges
segment 5, the last one that was successfully received in order.
In step four, the client has received Ack5 but isn’t sure if six was
lost or is still wandering around the network waiting to arrive. So,
the client sends just segment 8. Since, segment 6 isn’t wandering
around but has been lost, the server quickly acknowledges receipt
of data but it acknowledges segment 5 again with Ack5. In step
5, the client still isn’t permitted to assume that segment 6 is lost
so it again sends one segment, segment 9. The server sends Ack5
again. Finally, because the client has received three duplicate
acknowledgements (steps 3, 4 and 5), it is permitted to assume
that segment 6 has been lost and it retransmits that segment.
Now that the server has segments 4 though 9, it sends Ack9. As
illustrated in the final step, the client continues as it begins and
sends segment 10. It will continue to implement slow start with
sending succeeding segments.
This illustration showed some rather remarkable facts. First,
because a single frame was dropped, the sending TCP entity
reacted very strongly by cutting back to sending one frame at a
time until the problem was resolved by the retransmission. Keep in
mind that if the segments each contained 1000 bytes, for example,
this reaction may have been caused by a single bit error!
1
2
3
Figure 12: TCP Lost Segment
client
time
2
server
1
3
4
Ack 1
Ack 3
Ack 5
4
8
5
6
7
x
7
Ack 5
9
Ack 5
6
Ack 9
}
}
}
}
10
Figure 12. A Dropped Segment
Fluke Networks 38 www.flukenetworks.com39
Guide to Troubleshooting Application Problems
For more resources: www.flukenetworks.com/content/edge
This clearly demonstrates that TCP does not behave well in error
prone environments such as those created by wireless or poorly
cabled networks. When comparing the first and second examples,
it was clear that a single bit error could reduce the throughput by
thousands of bytes in the time interval illustrated.
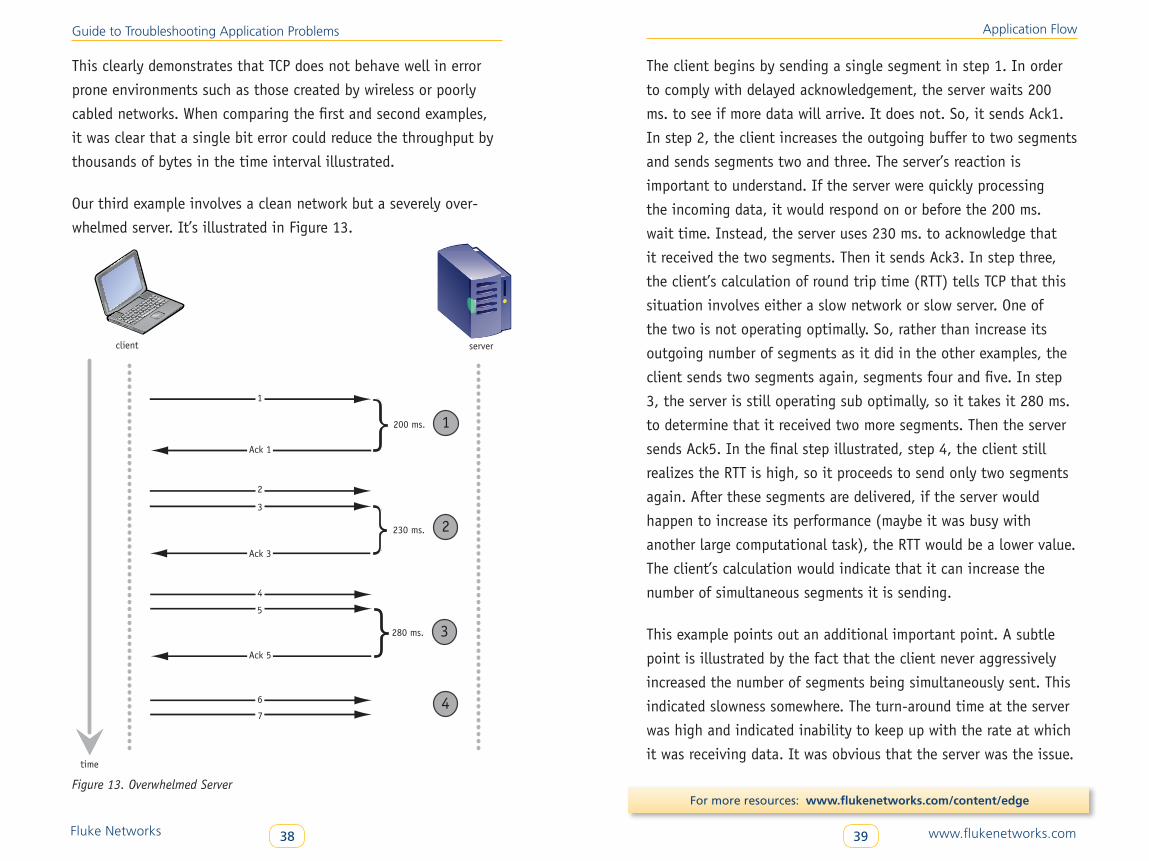
Our third example involves a clean network but a severely over-
whelmed server. It’s illustrated in Figure 13.
1
2
3
Figure 13: TCP flow: slow server
client
time
2
server
200 ms.
230 ms.
280 ms.
1
3
4
}
}
}
Ack 1
Ack 3
Ack 5
4
5
6
7
Application Flow
The client begins by sending a single segment in step 1. In order
to comply with delayed acknowledgement, the server waits 200
ms. to see if more data will arrive. It does not. So, it sends Ack1.
In step 2, the client increases the outgoing buffer to two segments
and sends segments two and three. The server’s reaction is
important to understand. If the server were quickly processing
the incoming data, it would respond on or before the 200 ms.
wait time. Instead, the server uses 230 ms. to acknowledge that
it received the two segments. Then it sends Ack3. In step three,
the client’s calculation of round trip time (RTT) tells TCP that this
situation involves either a slow network or slow server. One of
the two is not operating optimally. So, rather than increase its
outgoing number of segments as it did in the other examples, the
client sends two segments again, segments four and five. In step
3, the server is still operating sub optimally, so it takes it 280 ms.
to determine that it received two more segments. Then the server
sends Ack5. In the final step illustrated, step 4, the client still
realizes the RTT is high, so it proceeds to send only two segments
again. After these segments are delivered, if the server would
happen to increase its performance (maybe it was busy with
another large computational task), the RTT would be a lower value.
The client’s calculation would indicate that it can increase the
number of simultaneous segments it is sending.
This example points out an additional important point. A subtle
point is illustrated by the fact that the client never aggressively
increased the number of segments being simultaneously sent. This
indicated slowness somewhere. The turn-around time at the server
was high and indicated inability to keep up with the rate at which
it was receiving data. It was obvious that the server was the issue.
Figure 13. Overwhelmed Server
Fluke Networks 40 www.flukenetworks.com41
Guide to Troubleshooting Application Problems
For more resources: www.flukenetworks.com/content/edge
We have seen from these three examples, that TCP is a complicated
process. However, it has certain core features that help us
to isolate where problems are located. We should point out here,
that in a real world analysis, the block numbers would be replaced
by sequence and acknowledgement numbers that are often eight
or more characters in length, rather than the single digit block
numbers used in these examples. This means that the analysis
of a capture file that is being analyzed may take considerable time.
This could be the main reason that network engineers tend to
avoid this deep inspection to search for problems. Yet, such
inspection is analogous to the medical doctor who orders an MRI.
It can be very revealing. With practice and good network trouble-
shooting tools, you can become very proficient in such analysis.
Throughout our discussion, we have illustrated one-way transfers
of data. TCP is a full-duplex protocol. That means it is designed to
allow for simultaneous flows in both directions. In practice, this
isn’t done very often. We think the half-duplex flows that have
been illustrated not only simplify the illustrations but are more
likely to be what you will encounter.
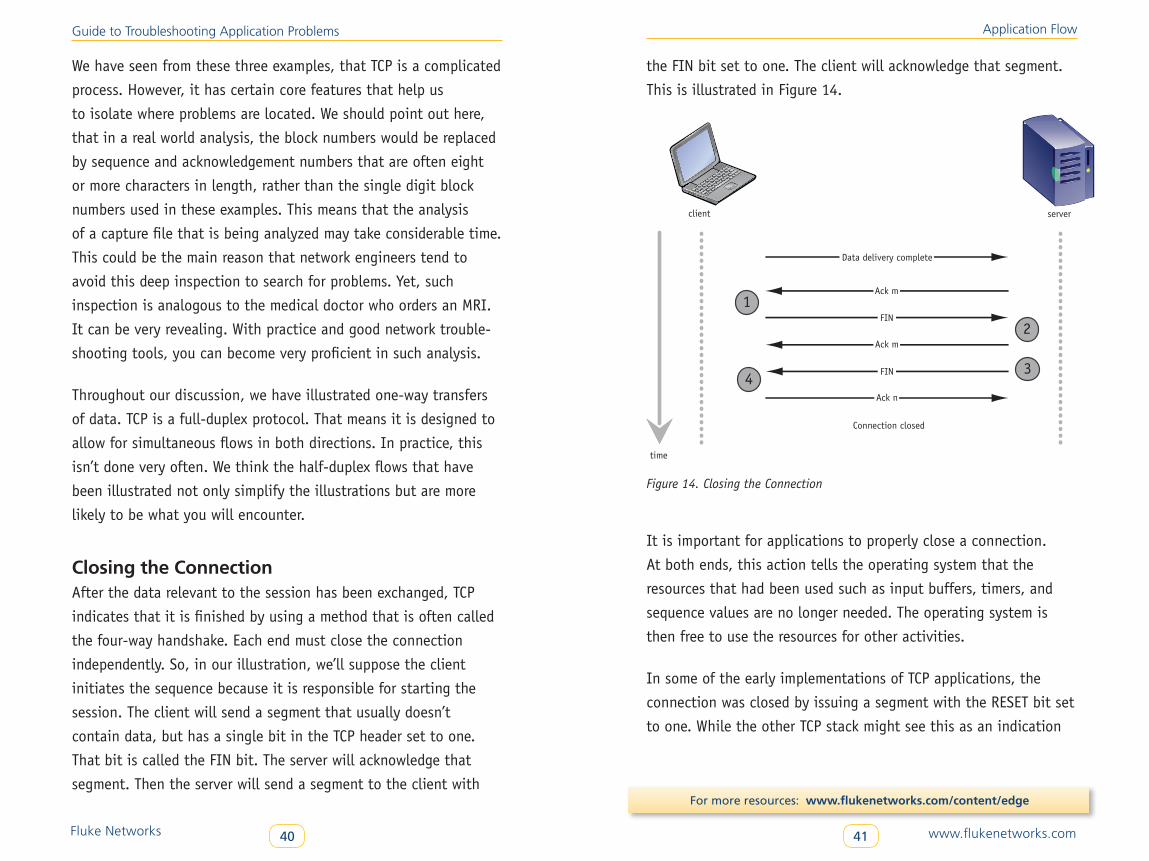
Closing the ConnectionAfter the data relevant to the session has been exchanged, TCP
indicates that it is finished by using a method that is often called
the four-way handshake. Each end must close the connection
independently. So, in our illustration, we’ll suppose the client
initiates the sequence because it is responsible for starting the
session. The client will send a segment that usually doesn’t
contain data, but has a single bit in the TCP header set to one.
That bit is called the FIN bit. The server will acknowledge that
segment. Then the server will send a segment to the client with
Application Flow
the FIN bit set to one. The client will acknowledge that segment.
This is illustrated in Figure 14.
Ack m
server
Data delivery complete
FIN
Connection closed
Ack m
FIN
Ack n
Figure 14: TCP flow: closing the connection
client
time
1
2
34
Figure 14. Closing the Connection
It is important for applications to properly close a connection.
At both ends, this action tells the operating system that the
resources that had been used such as input buffers, timers, and
sequence values are no longer needed. The operating system is
then free to use the resources for other activities.
In some of the early implementations of TCP applications, the
connection was closed by issuing a segment with the RESET bit set
to one. While the other TCP stack might see this as an indication
Fluke Networks 42 www.flukenetworks.com43
Guide to Troubleshooting Application Problems
For more resources: www.flukenetworks.com/content/edge
the session was over, it might also correctly interpret it as an
indication that the timers and sequence numbers were confused
and needed to be corrected. Issuing resets occasionally causes
servers to retain resources for the TCP session long after they are
no longer being used by the applications. Of course, nearly the
same thing might be expected if the FIN segment were to be lost.
But in this case, the other end would not acknowledge receipt of
the FIN segment and it would eventually be retransmitted. So, the
four-way handshake is the proper way for a session to be closed.
Understanding How Applications Fail
Failures with DNSIn order to understand how DNS can fail we need to look more
closely at how it works. When a client wants to make a request
of a server, it usually has the name of the server such as
www.psu.edu or www.flukenetworks.com. DNS is a distributed
database that stores the names and the corresponding IP
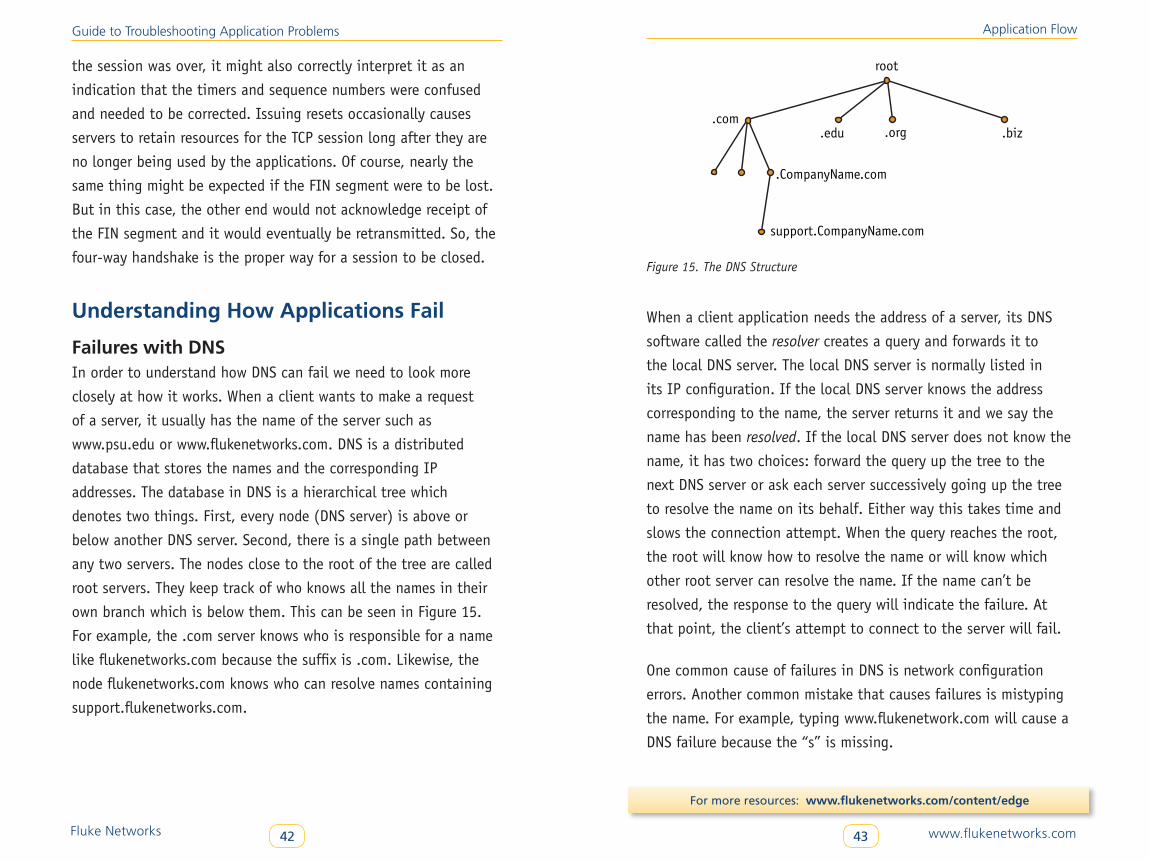
addresses. The database in DNS is a hierarchical tree which
denotes two things. First, every node (DNS server) is above or
below another DNS server. Second, there is a single path between
any two servers. The nodes close to the root of the tree are called
root servers. They keep track of who knows all the names in their
own branch which is below them. This can be seen in Figure 15.
For example, the .com server knows who is responsible for a name
like flukenetworks.com because the suffix is .com. Likewise, the
node flukenetworks.com knows who can resolve names containing
support.flukenetworks.com.
Application Flow
Figure 15
root
.biz.org.edu.com
.CompanyName.com
support.CompanyName.com
Figure 15. The DNS Structure
When a client application needs the address of a server, its DNS
software called the resolver creates a query and forwards it to
the local DNS server. The local DNS server is normally listed in
its IP configuration. If the local DNS server knows the address
corresponding to the name, the server returns it and we say the
name has been resolved. If the local DNS server does not know the
name, it has two choices: forward the query up the tree to the
next DNS server or ask each server successively going up the tree
to resolve the name on its behalf. Either way this takes time and
slows the connection attempt. When the query reaches the root,
the root will know how to resolve the name or will know which
other root server can resolve the name. If the name can’t be
resolved, the response to the query will indicate the failure. At
that point, the client’s attempt to connect to the server will fail.
One common cause of failures in DNS is network configuration
errors. Another common mistake that causes failures is mistyping
the name. For example, typing www.flukenetwork.com will cause a
DNS failure because the “s” is missing.
Fluke Networks 44 www.flukenetworks.com45
Guide to Troubleshooting Application Problems
For more resources: www.flukenetworks.com/content/edge
Failures with ARPRemember that ARP is the protocol that is used by a station that
needs to communicate with an IP address but doesn’t know the
local hardware address. Probably the two most common failures
with ARP are duplicate IP addresses and incorrect configuration of
the default gateway. If a user or other administrator of a computer
assigns an address to their NIC that is already in use by someone
else on the network, ARP tables in the network may have conflict-
ing information in them. While each TCP/IP stack is permitted
to handle ARP entry caching in their own manner, some use only
entries they query for, while others use anything they hear from
sending the query/response combination.
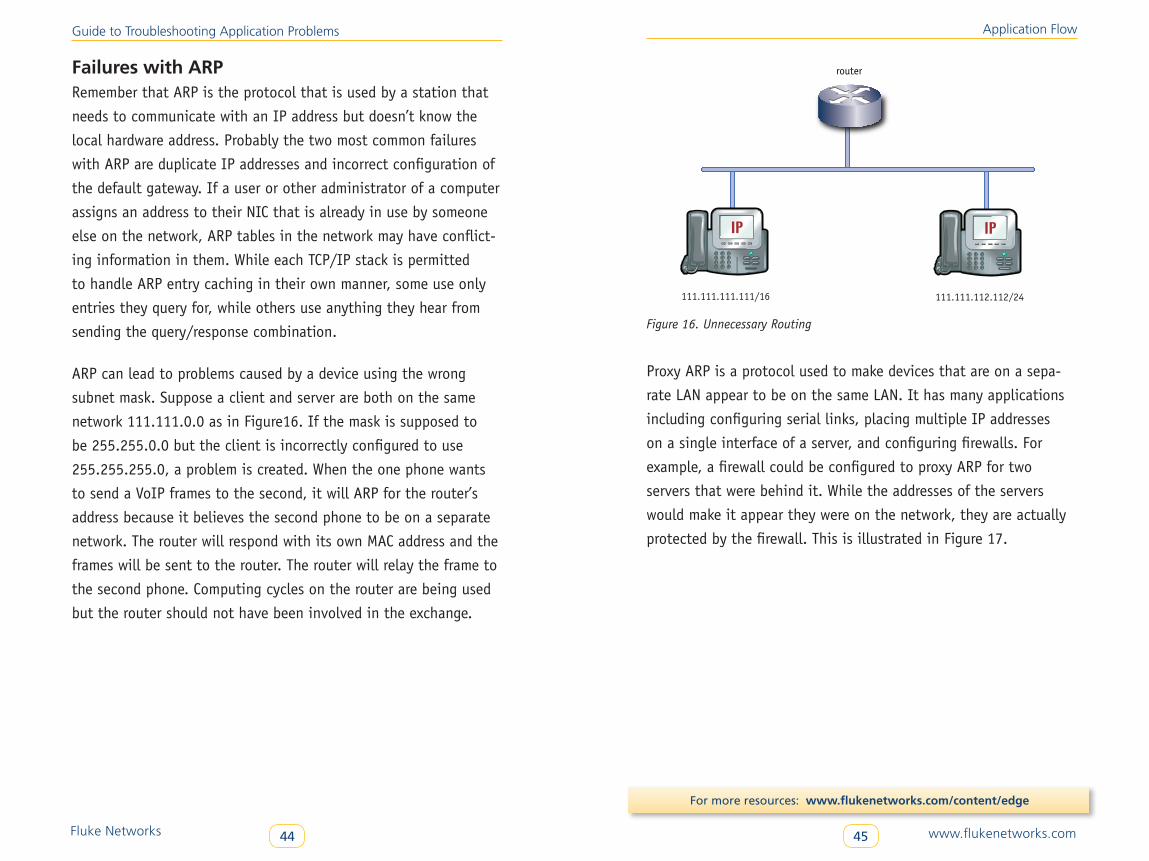
ARP can lead to problems caused by a device using the wrong
subnet mask. Suppose a client and server are both on the same
network 111.111.0.0 as in Figure16. If the mask is supposed to
be 255.255.0.0 but the client is incorrectly configured to use
255.255.255.0, a problem is created. When the one phone wants
to send a VoIP frames to the second, it will ARP for the router’s
address because it believes the second phone to be on a separate
network. The router will respond with its own MAC address and the
frames will be sent to the router. The router will relay the frame to
the second phone. Computing cycles on the router are being used
but the router should not have been involved in the exchange.
Application Flow
router
Figure 16
111.111.111.111/16 111.111.112.112/24
Figure 16. Unnecessary Routing
Proxy ARP is a protocol used to make devices that are on a sepa-
rate LAN appear to be on the same LAN. It has many applications
including configuring serial links, placing multiple IP addresses
on a single interface of a server, and configuring firewalls. For
example, a firewall could be configured to proxy ARP for two
servers that were behind it. While the addresses of the servers
would make it appear they were on the network, they are actually
protected by the firewall. This is illustrated in Figure 17.
Fluke Networks 46 www.flukenetworks.com47
Guide to Troubleshooting Application Problems
For more resources: www.flukenetworks.com/content/edge
Figure 17
server 1 server 2
firewall
Where is Server 1?
Here Iam!
Figure 17. Proxy ARP
In this case when a station wants to communicate with Server 1,
it will send an ARP broadcast. The firewall will respond with a
unicast response. This creates the impression in the station that
the firewall is, in fact, Server 1. Network administrators like this
technique because it completely hides the fact that the two
servers are on a separate, protected network.
But proxy ARP is prone to being misconfigured. Especially in the
case of servers that need multiple IP addresses on a physical NIC
and in cases where it is used in mobile IP applications.
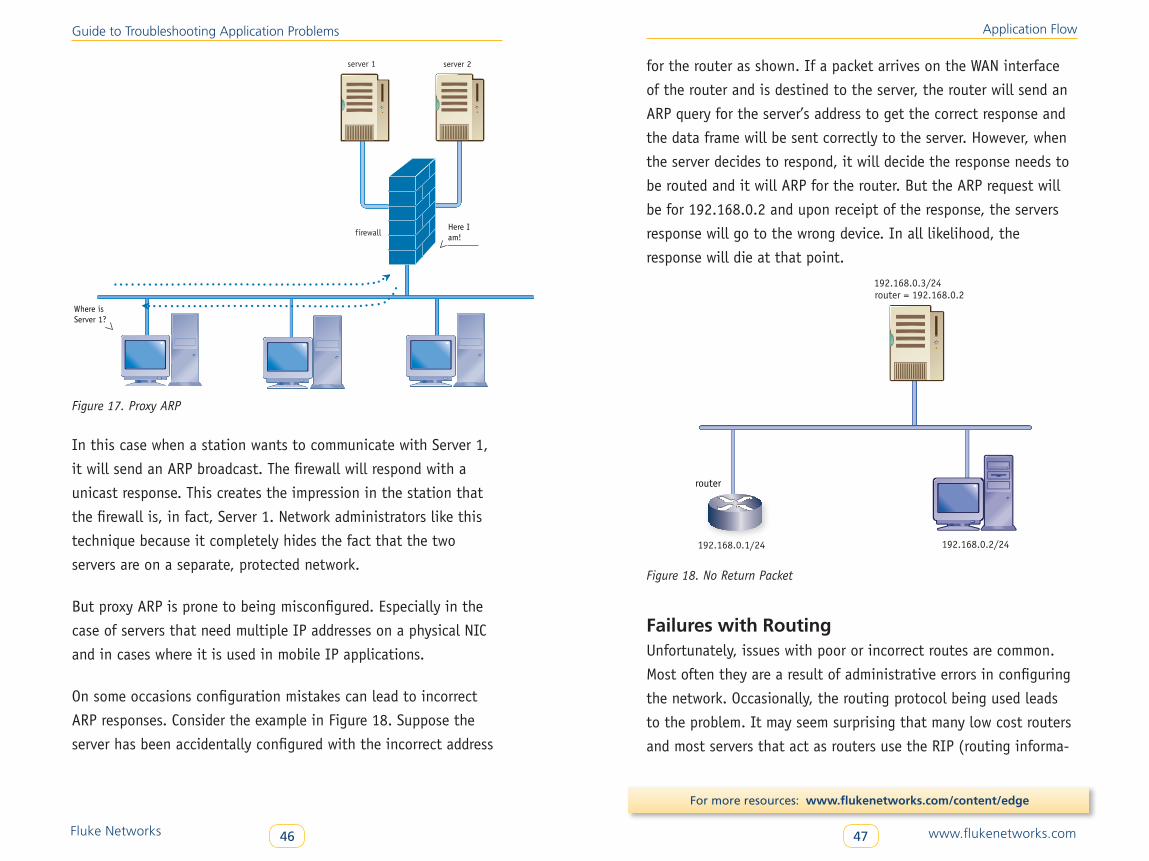
On some occasions configuration mistakes can lead to incorrect
ARP responses. Consider the example in Figure 18. Suppose the
server has been accidentally configured with the incorrect address
Application Flow
for the router as shown. If a packet arrives on the WAN interface
of the router and is destined to the server, the router will send an
ARP query for the server’s address to get the correct response and
the data frame will be sent correctly to the server. However, when
the server decides to respond, it will decide the response needs to
be routed and it will ARP for the router. But the ARP request will
be for 192.168.0.2 and upon receipt of the response, the servers
response will go to the wrong device. In all likelihood, the
response will die at that point.
192.168.0.1/24
Figure 18
router
192.168.0.2/24/
192.168.0.3/24router = 192.168.0.2
Figure 18. No Return Packet
Failures with RoutingUnfortunately, issues with poor or incorrect routes are common.
Most often they are a result of administrative errors in configuring
the network. Occasionally, the routing protocol being used leads
to the problem. It may seem surprising that many low cost routers
and most servers that act as routers use the RIP (routing informa-
Fluke Networks 48 www.flukenetworks.com49
Guide to Troubleshooting Application Problems
For more resources: www.flukenetworks.com/content/edge
tion protocol). That protocol is over thirty years old. Routers and
servers that use the protocol choose the destination path based on
the number of hops (links between routers). However, no provision
is made to assess the speed or throughput of a link. Consequently,
links might be in a path that is very slow when an alternative path
is not being used. The best way to spot a slow link is probably to
use a tool like trace route.
One factor that can be important is the network router discarding
packets. Among routers, there is no provision for retransmission.
So, the client or the server must determine that the routers have
discarded packets. When they do, they will generally retransmit the
packets. But you will recall that we pointed out that this retrans-
mission can happen significantly later and cause TCP to slow down
its rate of delivery by a large factor. So, why would routers discard
packets? There are two main reasons. First, a packet arrives at a
router and it is corrupted. That is, it has been damaged and the
router detects that some information it contains is incorrect.
It won’t try to determine the correct information. That would
use valuable processor cycles. It discards the packet. In certain
instances, it will send a packet called an ICMP (Internet Control
Message Protocol) packet back to the source indicating the
discard. But the packet is lost. The second thing that can happen
is that the router simply becomes too congested (that is, busy).
Nearly all routers will reach a threshold where they begin to
randomly discard traffic in order to do as much correct routing as
they can. Again, the impact on TCP applications in the client or
the server can be devastating.
Application Flow
Printing problems are often associated with routing errors. For
example, if a client is logged into a server that is on the other side
of a WAN link, but chooses to print to a local printer, the print file
may go across the WAN link to the print spooler (queue). When
the printer is available, the file will return across the WAN link to
reach the printer. This is a remarkably common occurrence and
usually creates slow printing because WAN links tend to have
limited bandwidth.
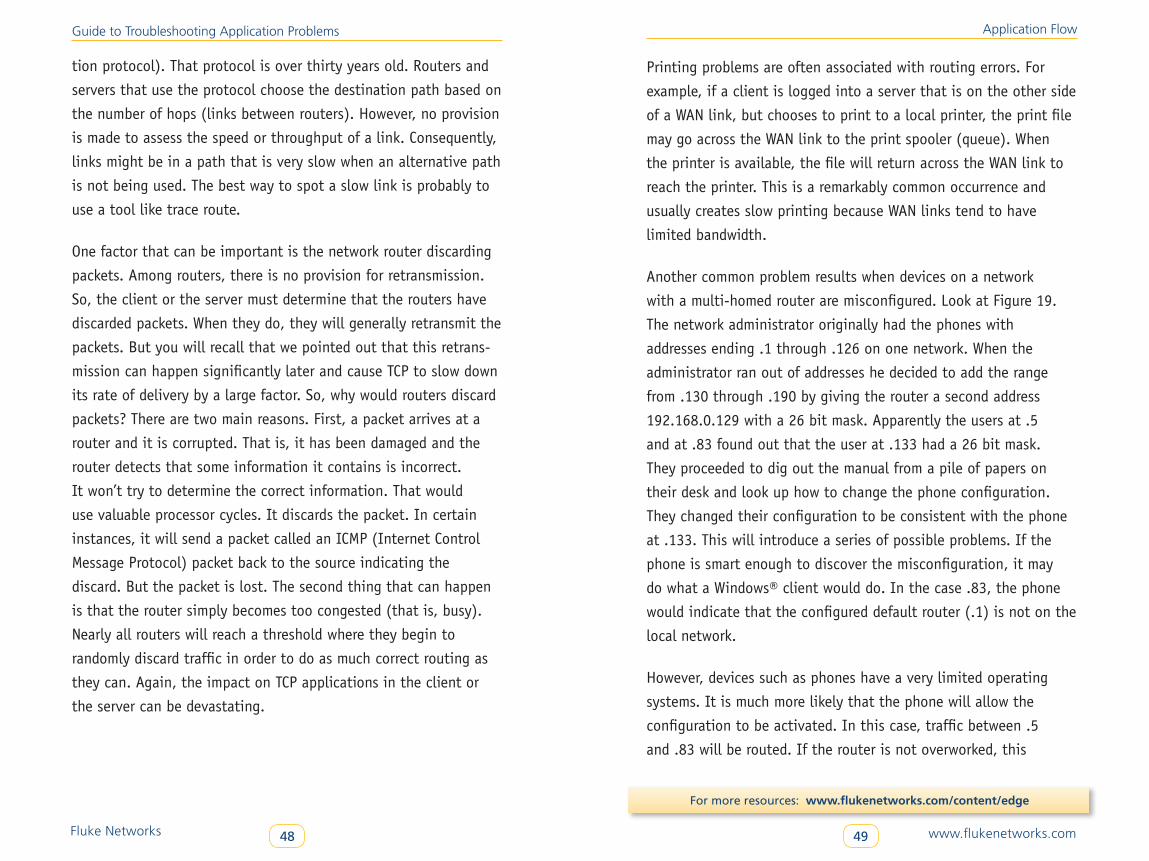
Another common problem results when devices on a network
with a multi-homed router are misconfigured. Look at Figure 19.
The network administrator originally had the phones with
addresses ending .1 through .126 on one network. When the
administrator ran out of addresses he decided to add the range
from .130 through .190 by giving the router a second address
192.168.0.129 with a 26 bit mask. Apparently the users at .5
and at .83 found out that the user at .133 had a 26 bit mask.
They proceeded to dig out the manual from a pile of papers on
their desk and look up how to change the phone configuration.
They changed their configuration to be consistent with the phone
at .133. This will introduce a series of possible problems. If the
phone is smart enough to discover the misconfiguration, it may
do what a Windows® client would do. In the case .83, the phone
would indicate that the configured default router (.1) is not on the
local network.
However, devices such as phones have a very limited operating
systems. It is much more likely that the phone will allow the
configuration to be activated. In this case, traffic between .5
and .83 will be routed. If the router is not overworked, this
Fluke Networks 50 www.flukenetworks.com51
Guide to Troubleshooting Application Problems
For more resources: www.flukenetworks.com/content/edge
misconfiguration could be hidden for years. However, when the
router becomes overly congested with bursty traffic, it could
begin to drop packets in calls between these two stations.
router
192.168.0.5/26 192.168.0.83/26 192.168.0.133/26
Figure 19
192.168.0.1/25192.168.0.129/26
Figure 19. Incorrect Configuration
Packet loss along the route can be hidden. For example, suppose
a pair of layer two switches are connected directly by a fiber or
twisted pair connection. Because no other devices except the
switches are normally monitoring such a link, bit errors can occur
that cause the link to corrupt data frames. This problem will be
dealt with by the end stations. If the applications that are
losing the frames are TCP based, the effect will be significant.
If the administrator of the network is using the link for VoIP
transport, minor frame loss will not likely be evident in the quality
of the calls. This can cause the administrator to search elsewhere
for the cause and miss the actual source of the degradation in
performance. Other causes of packet loss can be an over subscribed
quality of service technique, bad NIC cards in routers, or
intermediate wireless links (such as wireless bridges).
Application Flow
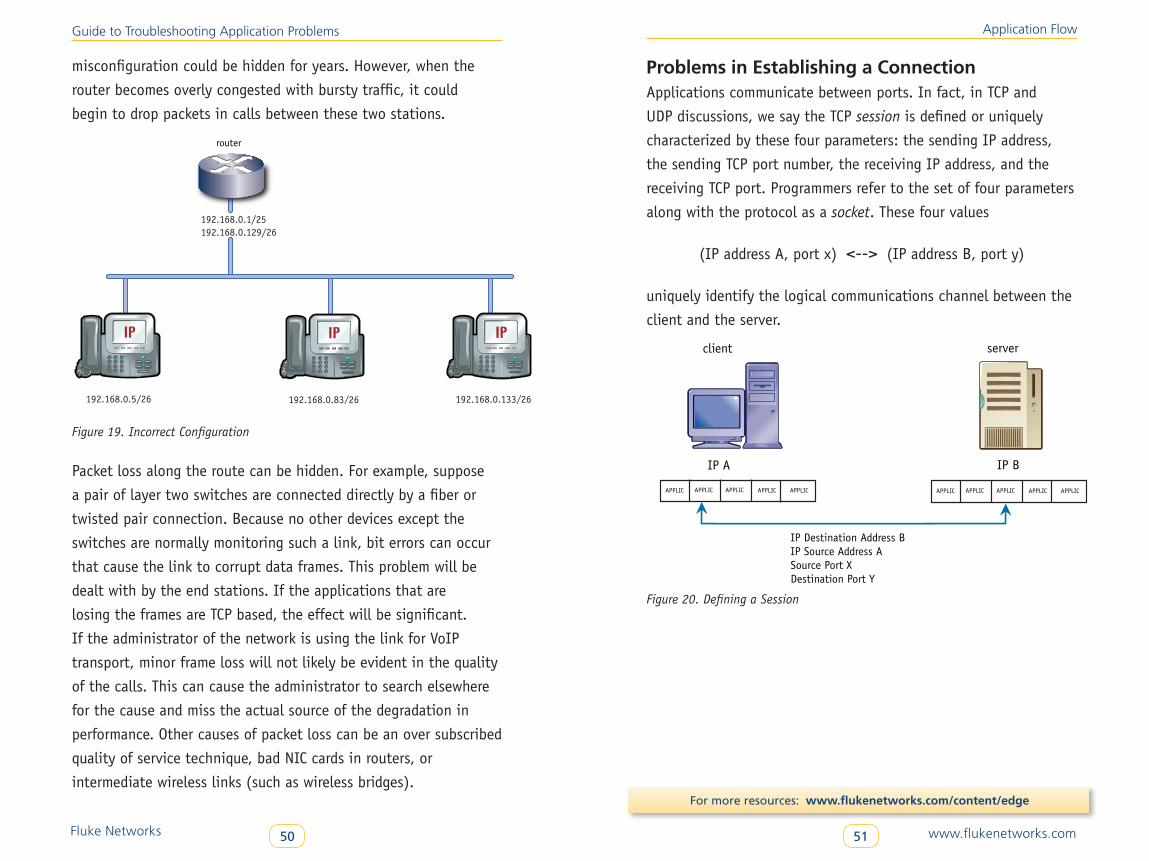
Problems in Establishing a ConnectionApplications communicate between ports. In fact, in TCP and
UDP discussions, we say the TCP session is defined or uniquely
characterized by these four parameters: the sending IP address,
the sending TCP port number, the receiving IP address, and the
receiving TCP port. Programmers refer to the set of four parameters
along with the protocol as a socket. These four values
(IP address A, port x) <--> (IP address B, port y)
uniquely identify the logical communications channel between the
client and the server.
client server
IP A IP B
Figure 20
APPLIC APPLIC APPLIC APPLIC APPLIC APPLIC APPLIC APPLIC APPLIC APPLIC
IP Destination Address BIP Source Address ASource Port XDestination Port Y
Figure 20. Defining a Session
Fluke Networks 52 www.flukenetworks.com53
Guide to Troubleshooting Application Problems
For more resources: www.flukenetworks.com/content/edge
For example, in the three-way handshake, the client sends the SYN
packet from IP address A listing port x as the source port. In the
packet the client also lists the destination as IP address B (server)
and port y (the application). As we described previously, the
operating system in each device needs to allocate memory for the
operation of the session being established. These four values are
the tags used to identify the exchange. Note that a single server,
such as an email server, can use port 25 as part of a set of
thousands of different sessions, so long as the client port or
client address changes in each instance.
Occasionally, a client application will attempt to connect to a
port that is not available on a server. We say the port is not open.
If this happens, most TCP stacks will tell the source of this
occurrence by sending an ICMP packet indicating this. However,
most client devices will ignore the report and the user will not
make the connection. If someone or some device is attempting to
discover which ports are active on the server by scanning ports,
you may see a sudden increase in the amount of ICMP traffic on
your network. Scanning is a process in which a SYN packet is
sent to each possible port number in succession. For example, a
scanning utility might send successive SYN packets to 191.168.0.5:
1025, 191.168.0.5: 1026, 191.168.0.5: 1027, and so forth. Here
we have used the common notation to show the port number
behind the IP address separated by a colon.
There are generally two sources for scanning activities: good guys
and bad guys. Among the good guys are network troubleshooting
tools with functions built in that will scan the ports of a host in
order to see if the host has the correct ports open.
Application Flow
Most servers have several open ports which represent services it
will provide. For example, a server with ports 110, 25 and 80 open
would be available to provide email and web page serving. If the
server actively announces these services, we say it advertises the
services. So, often a network support tool will scan the network to
see which devices have open ports and then send a SYN to verify
the status of the port. Among the bad guys are hackers that are
attempting to do reconnaissance on your network. They also want
to know which devices are servers and which ports are open,
but for their own less honorable purposes.
Slow Responses from ServersIn the client-server relationship, when a client sends a request to
a server, it is usually represented by a packet that has a unique
format which is determined by the application program interface.
For example, with HTTP, when a client requests a home page or
part of a page from a web server, an HTTP GET packet is sent to the
server. It contains a significant number of parameters such as the
version of HTTP being used, the date and time, the file requested
and other values. The GET is sent only after the client and session
server has been established by the three-way handshake.
How quickly the service request is fulfilled may depend on several
factors. The server may be slow to respond because it needs to
compute something or search for the file. In the case of HTTP,
it may even send a response that indicates acknowledgement
of the request without supplying the file to fulfill the request.
It’s like saying, “I’m working on it.” The request may get lost or be
discarded by the network. The same thing can happen to the
Fluke Networks 54 www.flukenetworks.com55
Guide to Troubleshooting Application Problems
For more resources: www.flukenetworks.com/content/edge
response. Finding the cause of server slowness is beyond the
scope of this document. However, later we will consider how to
spot signs that a server is over worked.
Closing the ConnectionAs we pointed out before, when we considered the operation of
TCP, the session is ended with the four-way handshake. The client
sends a FIN and the server acknowledges it. Then the server
sends a FIN and the client acknowledges that FIN. Occasionally,
one of the four frames of data is lost or discarded by the network.
If the FIN is lost, the corresponding acknowledgement isn’t
received and eventually the station will send it again. If the
acknowledgement is lost, the sender likewise eventually decides it
must be sent again. It might seem that this would not affect the
application performance since it appears to happen after the data
has been transferred. But that is incorrect. As an example, consider
when a web page is requested. It will typically contain eight to
twenty components such as a logo, a banner, a copyright notice,
a list of options to click on and other information. HTTP generally
transfers the page in individual TCP sessions. So, if the session to
retrieve the banner doesn’t close properly, it may prevent the
retrieval of the list of items that the user can click on. It will
appear as if the application is responding slowly.
Finally, as we mentioned in our previous discussion of closing the
connection, some poorly constructed applications and some older
versions of protocols, use the RESET packet to close a session.
This may force the operating system to keep memory resources
and times active when they are no longer needed. Keeping the
resources viable will take additional computational cycles from
the server and decrease its overall performance.
Troubleshooting Applications
Troubleshooting ApplicationsOften troubleshooting is challenging and a “best” method isn’t
obvious. Some technicians use the few tools they are familiar with
to try to solve every problem. The adage, “When the only tool you
have is a hammer, everything begins to look like a nail, “ comes
to mind. In network troubleshooting, technicians who know the
physical level sometimes attempt to solve a problem with cable
testers and meters. Technicians who have an RF communications
background gravitate towards spectrum analyzers.
On the other hand, team members working on a problem may
each have a different view of the same problem. The systems
analyst will think of CPU performance, insufficient memory, and
fragmented disk space as the cause of the problem. The network
architect might see it as routing issues. Or, the manager of
network infrastructure might decide to test the WAN links for
throughput or replace copper links with fiber connections.
Good troubleshooting requires having a broad base of experience,
a solid knowledge of the technology involved, and the availability
of the proper tools.
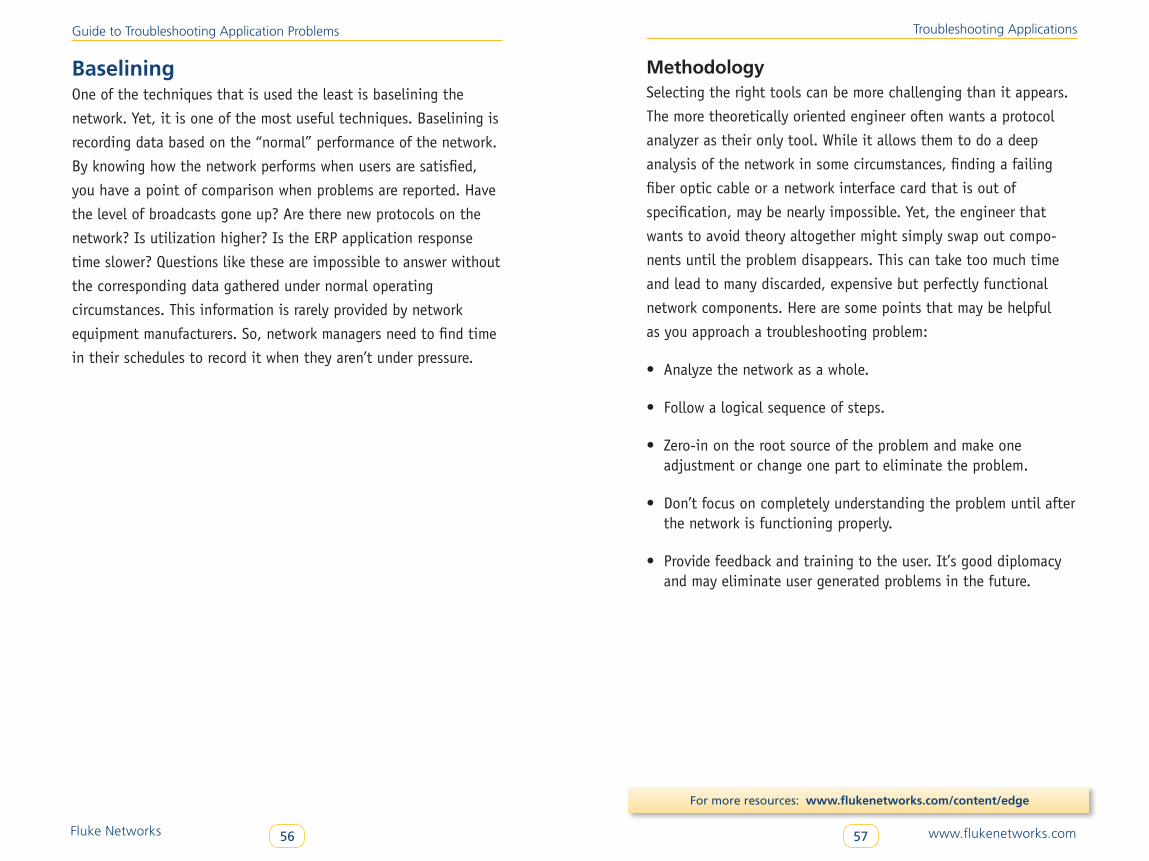
Fluke Networks 56 www.flukenetworks.com57
Guide to Troubleshooting Application Problems
For more resources: www.flukenetworks.com/content/edge
BaseliningOne of the techniques that is used the least is baselining the
network. Yet, it is one of the most useful techniques. Baselining is
recording data based on the “normal” performance of the network.
By knowing how the network performs when users are satisfied,
you have a point of comparison when problems are reported. Have
the level of broadcasts gone up? Are there new protocols on the
network? Is utilization higher? Is the ERP application response
time slower? Questions like these are impossible to answer without
the corresponding data gathered under normal operating
circumstances. This information is rarely provided by network
equipment manufacturers. So, network managers need to find time
in their schedules to record it when they aren’t under pressure.
Troubleshooting Applications
MethodologySelecting the right tools can be more challenging than it appears.
The more theoretically oriented engineer often wants a protocol
analyzer as their only tool. While it allows them to do a deep
analysis of the network in some circumstances, finding a failing
fiber optic cable or a network interface card that is out of
specification, may be nearly impossible. Yet, the engineer that
wants to avoid theory altogether might simply swap out compo-
nents until the problem disappears. This can take too much time
and lead to many discarded, expensive but perfectly functional
network components. Here are some points that may be helpful
as you approach a troubleshooting problem:
• Analyze the network as a whole.
• Follow a logical sequence of steps.
• Zero-in on the root source of the problem and make one adjustment or change one part to eliminate the problem.
• Don’t focus on completely understanding the problem until after the network is functioning properly.
• Provide feedback and training to the user. It’s good diplomacy and may eliminate user generated problems in the future.
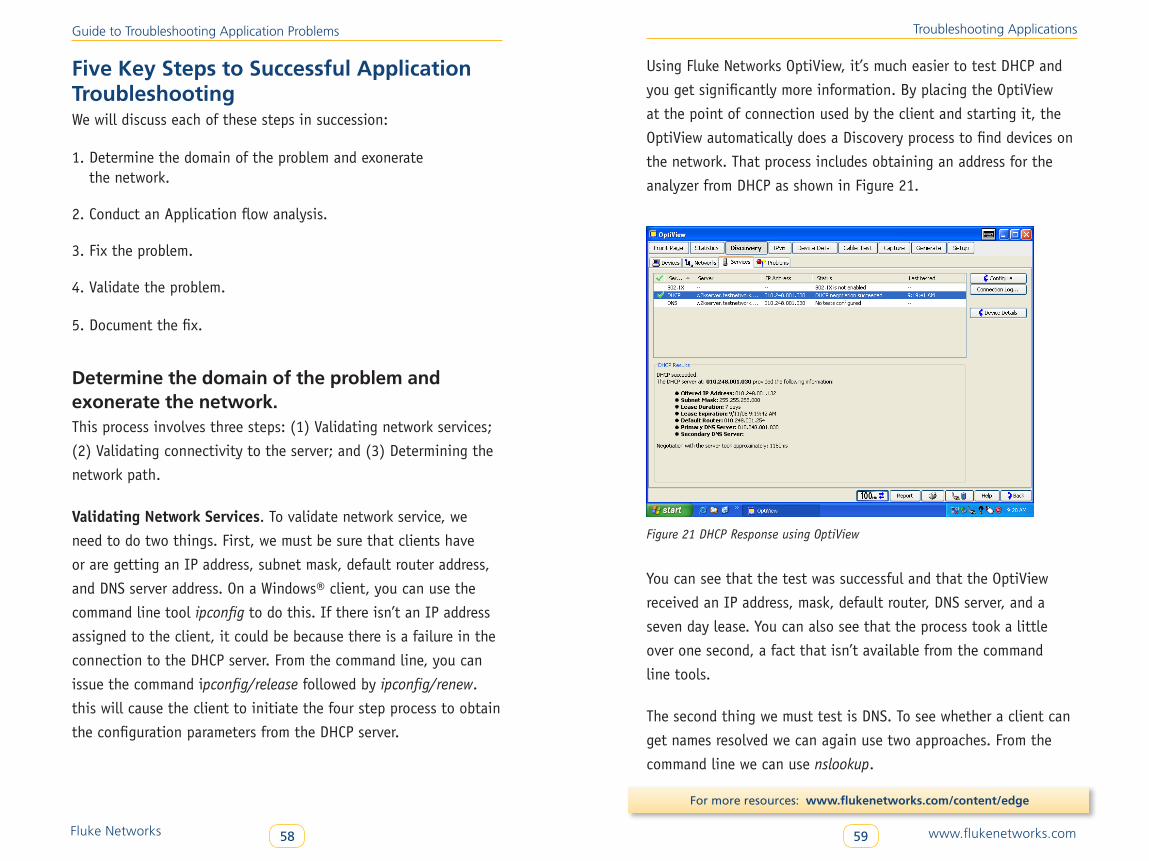
Fluke Networks 58 www.flukenetworks.com59
Guide to Troubleshooting Application Problems
For more resources: www.flukenetworks.com/content/edge
Five Key Steps to Successful Application TroubleshootingWe will discuss each of these steps in succession:
1. Determine the domain of the problem and exonerate the network.
2. Conduct an Application flow analysis.
3. Fix the problem.
4. Validate the problem.
5. Document the fix.
Determine the domain of the problem and exonerate the network .This process involves three steps: (1) Validating network services;
(2) Validating connectivity to the server; and (3) Determining the
network path.
Validating Network Services. To validate network service, we
need to do two things. First, we must be sure that clients have
or are getting an IP address, subnet mask, default router address,
and DNS server address. On a Windows® client, you can use the
command line tool ipconfig to do this. If there isn’t an IP address
assigned to the client, it could be because there is a failure in the
connection to the DHCP server. From the command line, you can
issue the command ipconfig/release followed by ipconfig/renew.
this will cause the client to initiate the four step process to obtain
the configuration parameters from the DHCP server.
Troubleshooting Applications
Using Fluke Networks OptiView, it’s much easier to test DHCP and
you get significantly more information. By placing the OptiView
at the point of connection used by the client and starting it, the
OptiView automatically does a Discovery process to find devices on
the network. That process includes obtaining an address for the
analyzer from DHCP as shown in Figure 21.
Figure 21 DHCP Response using OptiView
You can see that the test was successful and that the OptiView
received an IP address, mask, default router, DNS server, and a
seven day lease. You can also see that the process took a little
over one second, a fact that isn’t available from the command
line tools.
The second thing we must test is DNS. To see whether a client can
get names resolved we can again use two approaches. From the
command line we can use nslookup.
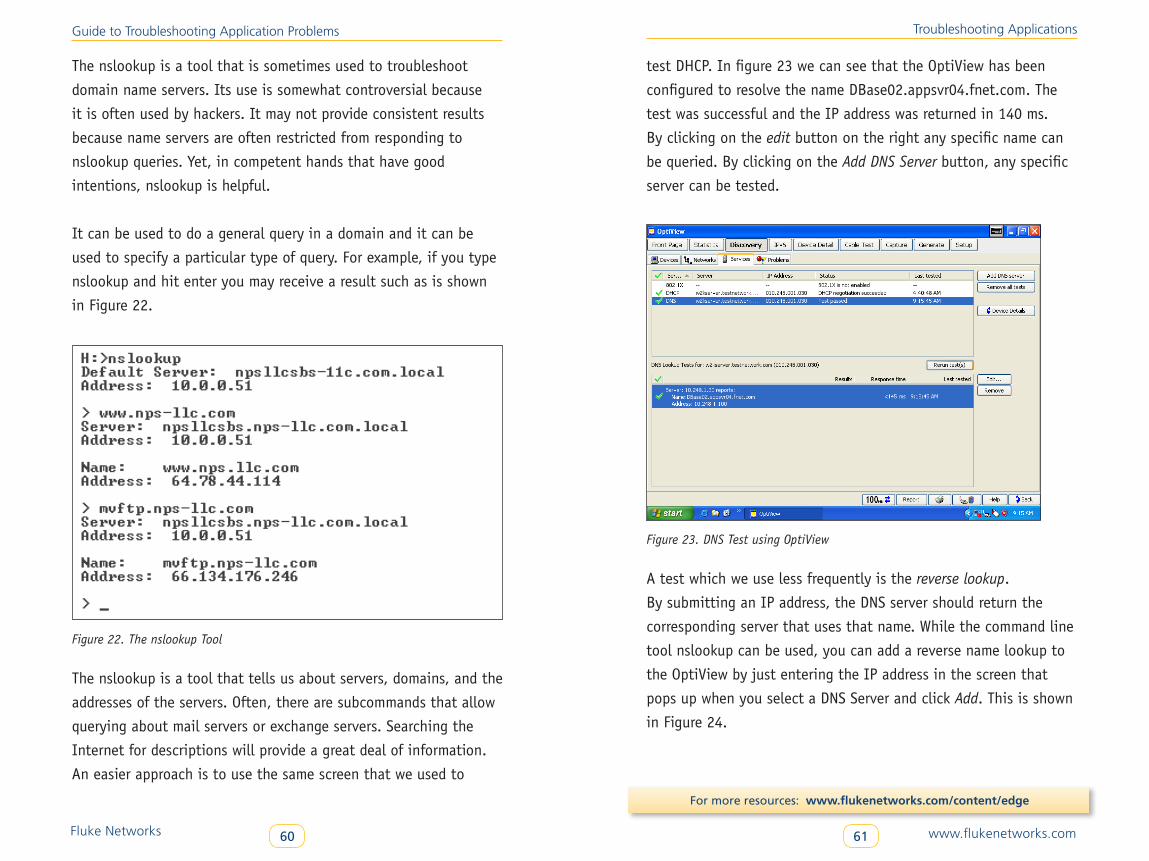
Fluke Networks 60 www.flukenetworks.com61
Guide to Troubleshooting Application Problems
For more resources: www.flukenetworks.com/content/edge
The nslookup is a tool that is sometimes used to troubleshoot
domain name servers. Its use is somewhat controversial because
it is often used by hackers. It may not provide consistent results
because name servers are often restricted from responding to
nslookup queries. Yet, in competent hands that have good
intentions, nslookup is helpful.
It can be used to do a general query in a domain and it can be
used to specify a particular type of query. For example, if you type
nslookup and hit enter you may receive a result such as is shown
in Figure 22.
Figure 22. The nslookup Tool
The nslookup is a tool that tells us about servers, domains, and the
addresses of the servers. Often, there are subcommands that allow
querying about mail servers or exchange servers. Searching the
Internet for descriptions will provide a great deal of information.
An easier approach is to use the same screen that we used to
Troubleshooting Applications
test DHCP. In figure 23 we can see that the OptiView has been
configured to resolve the name DBase02.appsvr04.fnet.com. The
test was successful and the IP address was returned in 140 ms.
By clicking on the edit button on the right any specific name can
be queried. By clicking on the Add DNS Server button, any specific
server can be tested.
Figure 23. DNS Test using OptiView
A test which we use less frequently is the reverse lookup.
By submitting an IP address, the DNS server should return the
corresponding server that uses that name. While the command line
tool nslookup can be used, you can add a reverse name lookup to
the OptiView by just entering the IP address in the screen that
pops up when you select a DNS Server and click Add. This is shown
in Figure 24.
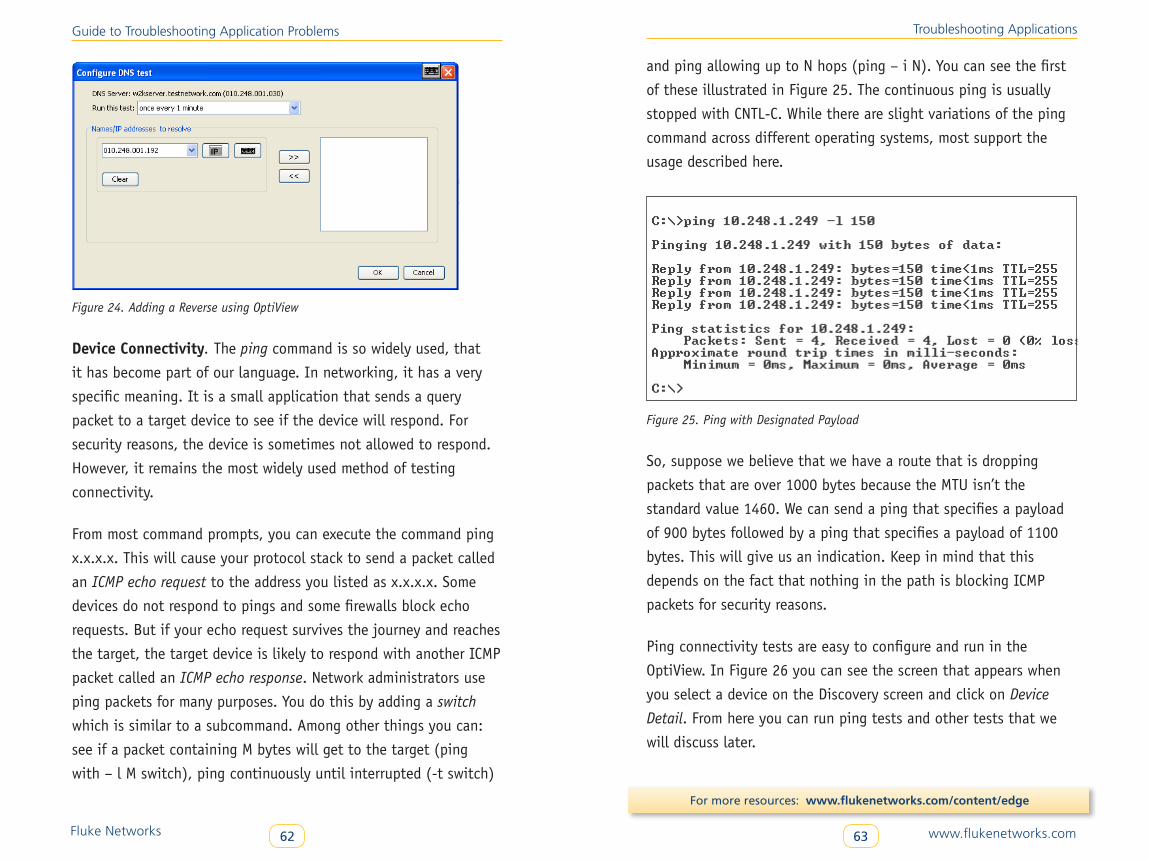
Fluke Networks 62 www.flukenetworks.com63
Guide to Troubleshooting Application Problems
For more resources: www.flukenetworks.com/content/edge
Figure 24. Adding a Reverse using OptiView
Device Connectivity. The ping command is so widely used, that
it has become part of our language. In networking, it has a very
specific meaning. It is a small application that sends a query
packet to a target device to see if the device will respond. For
security reasons, the device is sometimes not allowed to respond.
However, it remains the most widely used method of testing
connectivity.
From most command prompts, you can execute the command ping
x.x.x.x. This will cause your protocol stack to send a packet called
an ICMP echo request to the address you listed as x.x.x.x. Some
devices do not respond to pings and some firewalls block echo
requests. But if your echo request survives the journey and reaches
the target, the target device is likely to respond with another ICMP
packet called an ICMP echo response. Network administrators use
ping packets for many purposes. You do this by adding a switch
which is similar to a subcommand. Among other things you can:
see if a packet containing M bytes will get to the target (ping
with – l M switch), ping continuously until interrupted (-t switch)
Troubleshooting Applications
and ping allowing up to N hops (ping – i N). You can see the first
of these illustrated in Figure 25. The continuous ping is usually
stopped with CNTL-C. While there are slight variations of the ping
command across different operating systems, most support the
usage described here.
Figure 25. Ping with Designated Payload
So, suppose we believe that we have a route that is dropping
packets that are over 1000 bytes because the MTU isn’t the
standard value 1460. We can send a ping that specifies a payload
of 900 bytes followed by a ping that specifies a payload of 1100
bytes. This will give us an indication. Keep in mind that this
depends on the fact that nothing in the path is blocking ICMP
packets for security reasons.
Ping connectivity tests are easy to configure and run in the
OptiView. In Figure 26 you can see the screen that appears when
you select a device on the Discovery screen and click on Device
Detail. From here you can run ping tests and other tests that we
will discuss later.
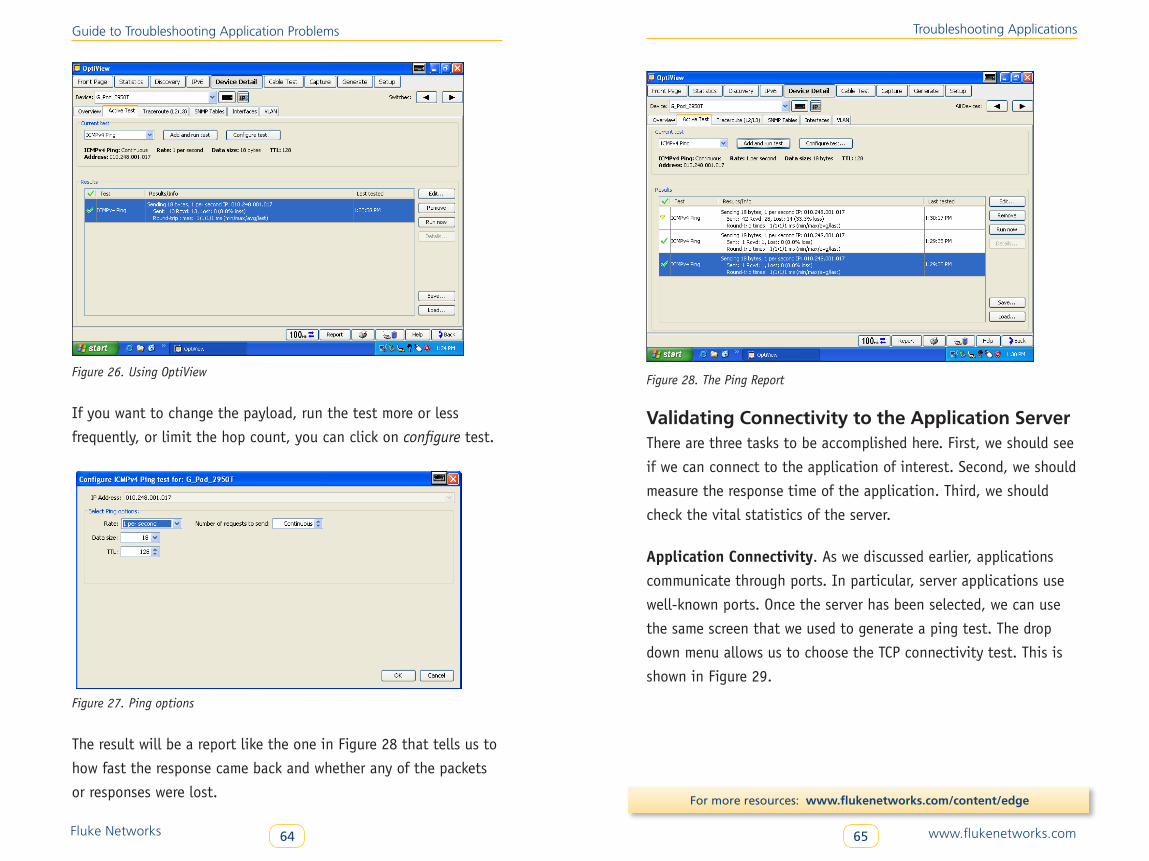
Fluke Networks 64 www.flukenetworks.com65
Guide to Troubleshooting Application Problems
For more resources: www.flukenetworks.com/content/edge
Figure 26. Using OptiView
If you want to change the payload, run the test more or less
frequently, or limit the hop count, you can click on configure test.
Figure 27. Ping options
The result will be a report like the one in Figure 28 that tells us to
how fast the response came back and whether any of the packets
or responses were lost.
Troubleshooting Applications
Figure 28. The Ping Report
Validating Connectivity to the Application Server There are three tasks to be accomplished here. First, we should see
if we can connect to the application of interest. Second, we should
measure the response time of the application. Third, we should
check the vital statistics of the server.
Application Connectivity. As we discussed earlier, applications
communicate through ports. In particular, server applications use
well-known ports. Once the server has been selected, we can use
the same screen that we used to generate a ping test. The drop
down menu allows us to choose the TCP connectivity test. This is
shown in Figure 29.
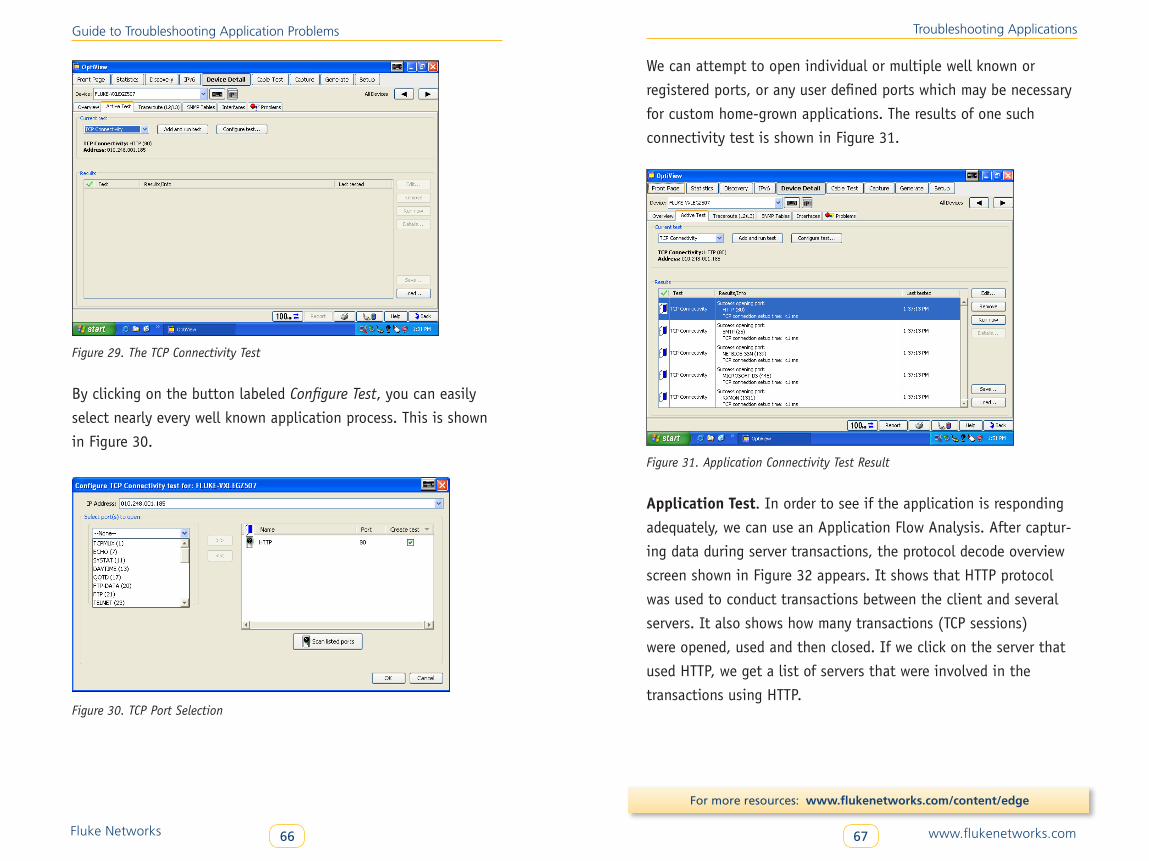
Fluke Networks 66 www.flukenetworks.com67
Guide to Troubleshooting Application Problems
For more resources: www.flukenetworks.com/content/edge
Figure 29. The TCP Connectivity Test
By clicking on the button labeled Configure Test, you can easily
select nearly every well known application process. This is shown
in Figure 30.
Figure 30. TCP Port Selection
Troubleshooting Applications
We can attempt to open individual or multiple well known or
registered ports, or any user defined ports which may be necessary
for custom home-grown applications. The results of one such
connectivity test is shown in Figure 31.
Figure 31. Application Connectivity Test Result
Application Test. In order to see if the application is responding
adequately, we can use an Application Flow Analysis. After captur-
ing data during server transactions, the protocol decode overview
screen shown in Figure 32 appears. It shows that HTTP protocol
was used to conduct transactions between the client and several
servers. It also shows how many transactions (TCP sessions)
were opened, used and then closed. If we click on the server that
used HTTP, we get a list of servers that were involved in the
transactions using HTTP.
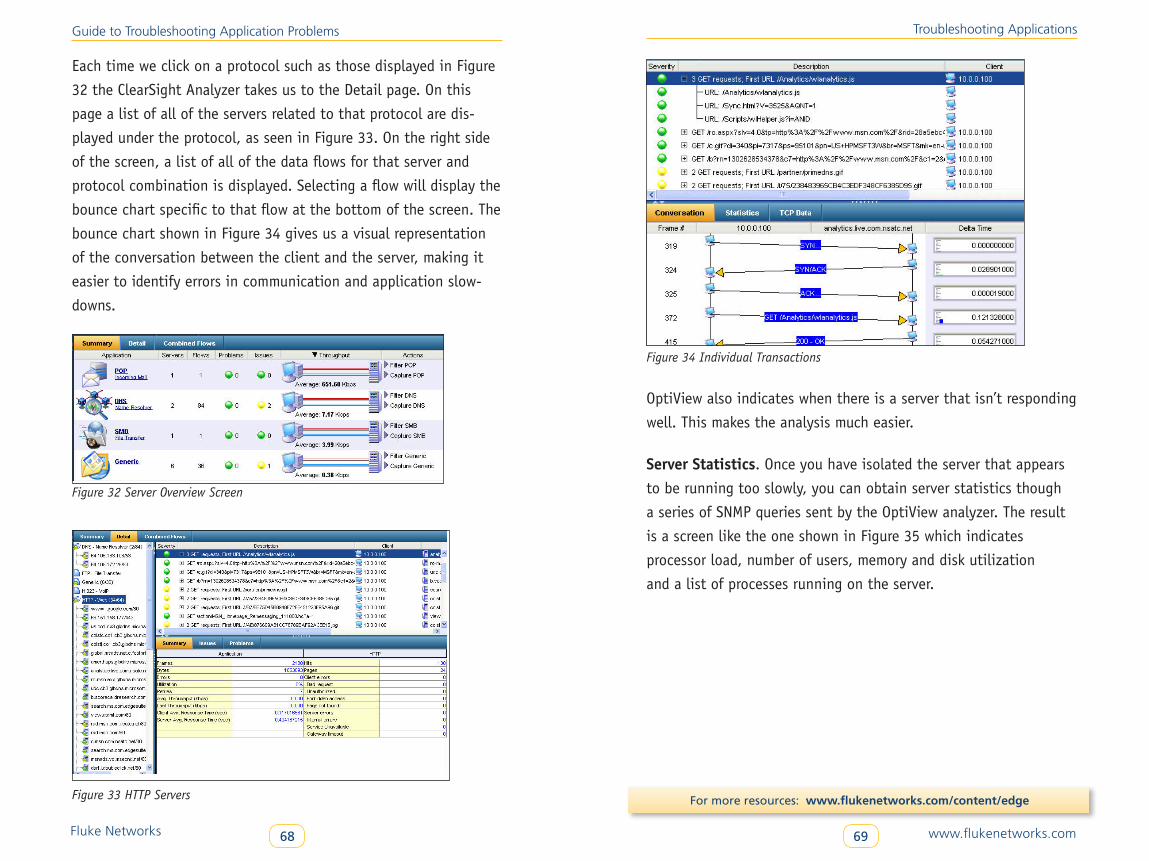
Fluke Networks 68 www.flukenetworks.com69
Guide to Troubleshooting Application Problems
For more resources: www.flukenetworks.com/content/edge
Each time we click on a protocol such as those displayed in Figure
32 the ClearSight Analyzer takes us to the Detail page. On this
page a list of all of the servers related to that protocol are dis-
played under the protocol, as seen in Figure 33. On the right side
of the screen, a list of all of the data flows for that server and
protocol combination is displayed. Selecting a flow will display the
bounce chart specific to that flow at the bottom of the screen. The
bounce chart shown in Figure 34 gives us a visual representation
of the conversation between the client and the server, making it
easier to identify errors in communication and application slow-
downs.
Figure 32 Server Overview Screen
Figure 33 HTTP Servers
Troubleshooting Applications
Figure 34 Individual Transactions
OptiView also indicates when there is a server that isn’t responding
well. This makes the analysis much easier.
Server Statistics. Once you have isolated the server that appears
to be running too slowly, you can obtain server statistics though
a series of SNMP queries sent by the OptiView analyzer. The result
is a screen like the one shown in Figure 35 which indicates
processor load, number of users, memory and disk utilization
and a list of processes running on the server.
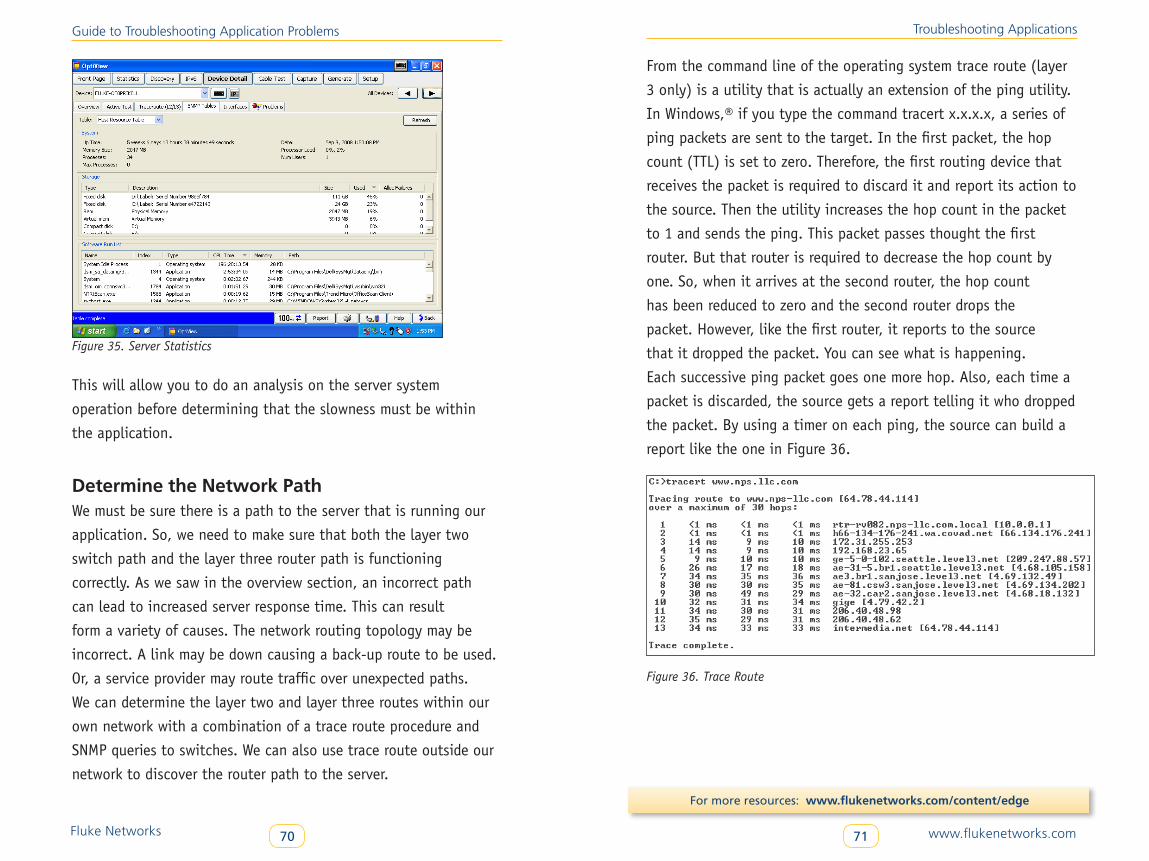
Fluke Networks 70 www.flukenetworks.com71
Guide to Troubleshooting Application Problems
For more resources: www.flukenetworks.com/content/edge
Figure 35. Server Statistics
This will allow you to do an analysis on the server system
operation before determining that the slowness must be within
the application.
Determine the Network PathWe must be sure there is a path to the server that is running our
application. So, we need to make sure that both the layer two
switch path and the layer three router path is functioning
correctly. As we saw in the overview section, an incorrect path
can lead to increased server response time. This can result
form a variety of causes. The network routing topology may be
incorrect. A link may be down causing a back-up route to be used.
Or, a service provider may route traffic over unexpected paths.
We can determine the layer two and layer three routes within our
own network with a combination of a trace route procedure and
SNMP queries to switches. We can also use trace route outside our
network to discover the router path to the server.
Troubleshooting Applications
From the command line of the operating system trace route (layer
3 only) is a utility that is actually an extension of the ping utility.
In Windows,® if you type the command tracert x.x.x.x, a series of
ping packets are sent to the target. In the first packet, the hop
count (TTL) is set to zero. Therefore, the first routing device that
receives the packet is required to discard it and report its action to
the source. Then the utility increases the hop count in the packet
to 1 and sends the ping. This packet passes thought the first
router. But that router is required to decrease the hop count by
one. So, when it arrives at the second router, the hop count
has been reduced to zero and the second router drops the
packet. However, like the first router, it reports to the source
that it dropped the packet. You can see what is happening.
Each successive ping packet goes one more hop. Also, each time a
packet is discarded, the source gets a report telling it who dropped
the packet. By using a timer on each ping, the source can build a
report like the one in Figure 36.
Figure 36. Trace Route
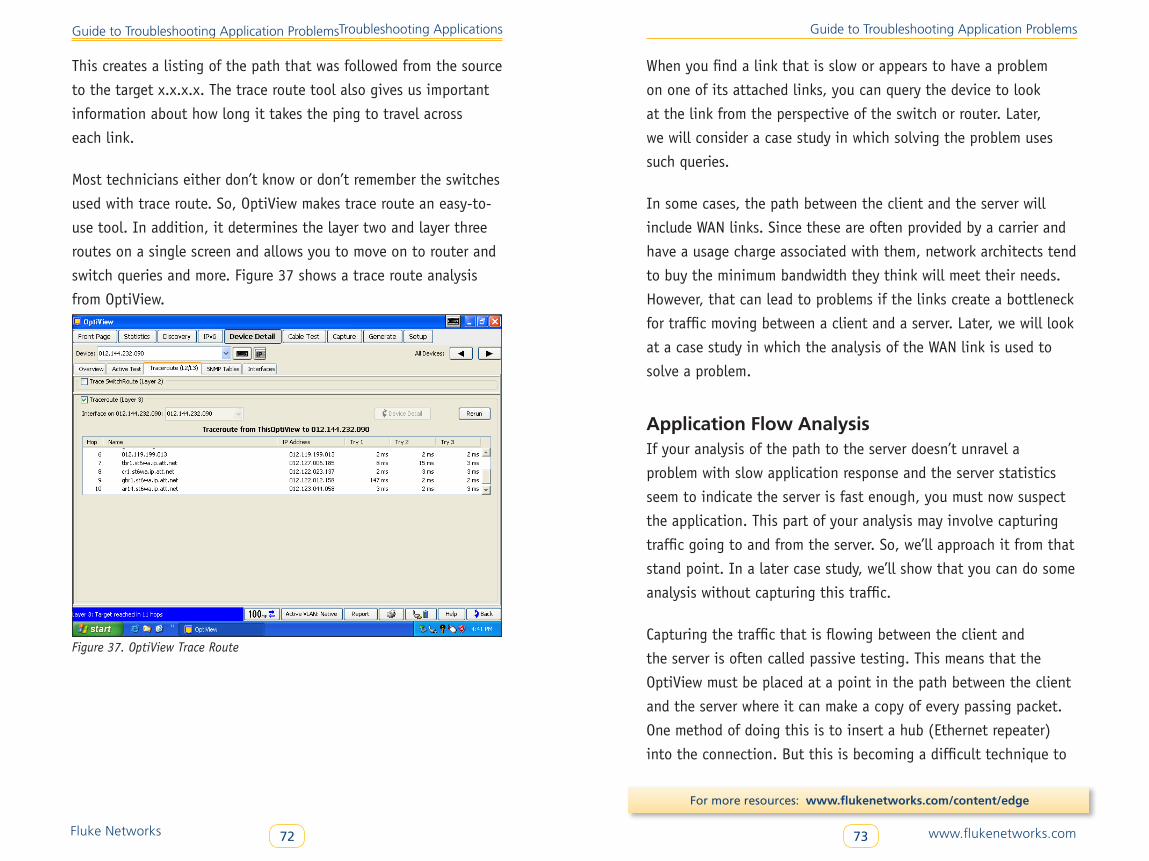
Fluke Networks 72 www.flukenetworks.com73
Guide to Troubleshooting Application Problems Guide to Troubleshooting Application Problems
For more resources: www.flukenetworks.com/content/edge
Troubleshooting Applications
This creates a listing of the path that was followed from the source
to the target x.x.x.x. The trace route tool also gives us important
information about how long it takes the ping to travel across
each link.
Most technicians either don’t know or don’t remember the switches
used with trace route. So, OptiView makes trace route an easy-to-
use tool. In addition, it determines the layer two and layer three
routes on a single screen and allows you to move on to router and
switch queries and more. Figure 37 shows a trace route analysis
from OptiView.
Figure 37. OptiView Trace Route
When you find a link that is slow or appears to have a problem
on one of its attached links, you can query the device to look
at the link from the perspective of the switch or router. Later,
we will consider a case study in which solving the problem uses
such queries.
In some cases, the path between the client and the server will
include WAN links. Since these are often provided by a carrier and
have a usage charge associated with them, network architects tend
to buy the minimum bandwidth they think will meet their needs.
However, that can lead to problems if the links create a bottleneck
for traffic moving between a client and a server. Later, we will look
at a case study in which the analysis of the WAN link is used to
solve a problem.
Application Flow AnalysisIf your analysis of the path to the server doesn’t unravel a
problem with slow application response and the server statistics
seem to indicate the server is fast enough, you must now suspect
the application. This part of your analysis may involve capturing
traffic going to and from the server. So, we’ll approach it from that
stand point. In a later case study, we’ll show that you can do some
analysis without capturing this traffic.
Capturing the traffic that is flowing between the client and
the server is often called passive testing. This means that the
OptiView must be placed at a point in the path between the client
and the server where it can make a copy of every passing packet.
One method of doing this is to insert a hub (Ethernet repeater)
into the connection. But this is becoming a difficult technique to
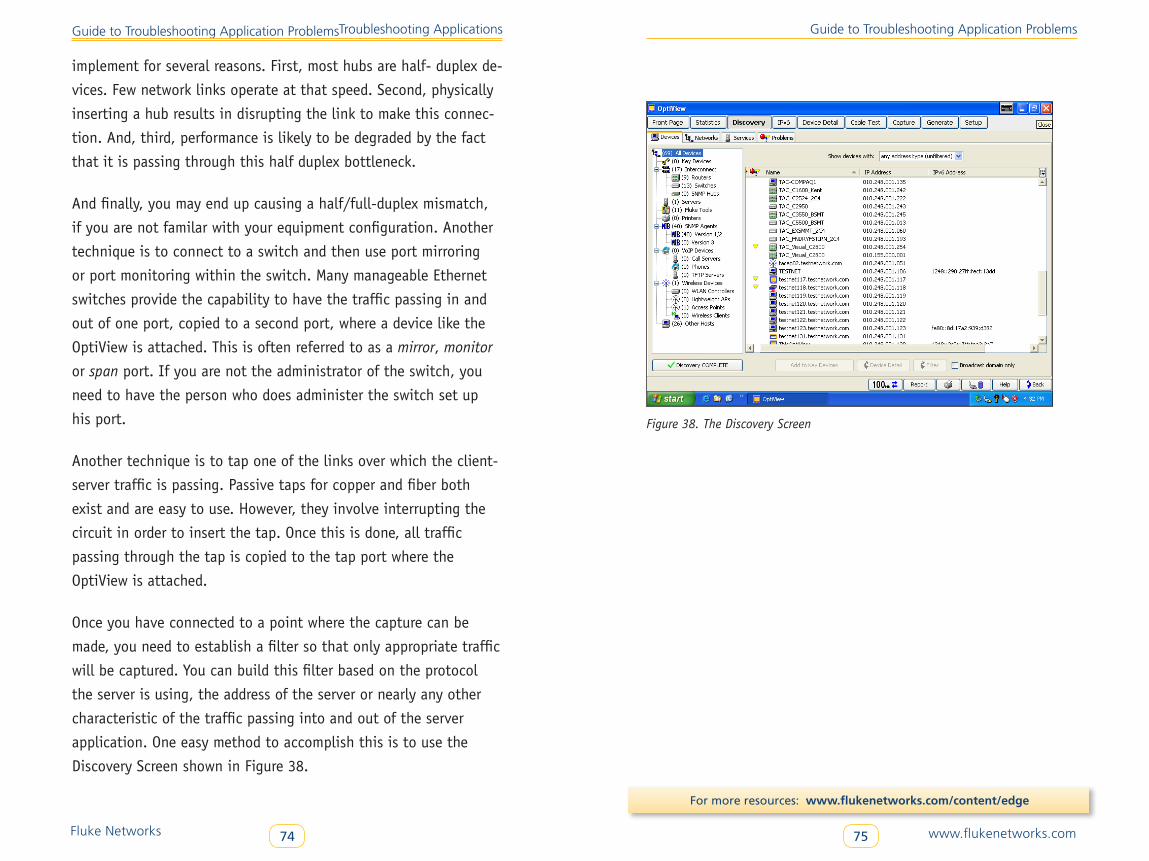
Fluke Networks 74 www.flukenetworks.com75
Guide to Troubleshooting Application Problems Guide to Troubleshooting Application Problems
For more resources: www.flukenetworks.com/content/edge
Troubleshooting Applications
implement for several reasons. First, most hubs are half- duplex de-
vices. Few network links operate at that speed. Second, physically
inserting a hub results in disrupting the link to make this connec-
tion. And, third, performance is likely to be degraded by the fact
that it is passing through this half duplex bottleneck.
And finally, you may end up causing a half/full-duplex mismatch,
if you are not familar with your equipment configuration. Another
technique is to connect to a switch and then use port mirroring
or port monitoring within the switch. Many manageable Ethernet
switches provide the capability to have the traffic passing in and
out of one port, copied to a second port, where a device like the
OptiView is attached. This is often referred to as a mirror, monitor
or span port. If you are not the administrator of the switch, you
need to have the person who does administer the switch set up
his port.
Another technique is to tap one of the links over which the client-
server traffic is passing. Passive taps for copper and fiber both
exist and are easy to use. However, they involve interrupting the
circuit in order to insert the tap. Once this is done, all traffic
passing through the tap is copied to the tap port where the
OptiView is attached.
Once you have connected to a point where the capture can be
made, you need to establish a filter so that only appropriate traffic
will be captured. You can build this filter based on the protocol
the server is using, the address of the server or nearly any other
characteristic of the traffic passing into and out of the server
application. One easy method to accomplish this is to use the
Discovery Screen shown in Figure 38.
Figure 38. The Discovery Screen
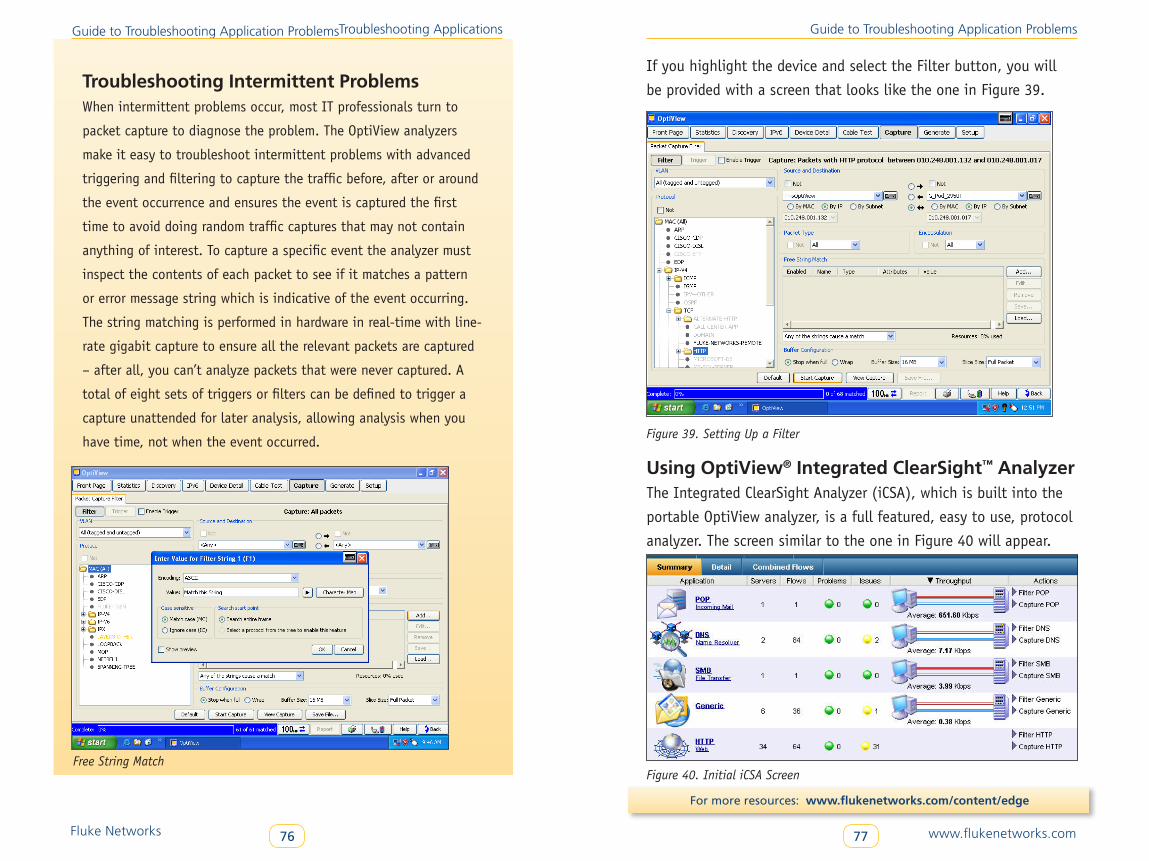
Fluke Networks 76 www.flukenetworks.com77
Guide to Troubleshooting Application Problems Guide to Troubleshooting Application Problems
For more resources: www.flukenetworks.com/content/edge
Troubleshooting Applications
Troubleshooting Intermittent Problems When intermittent problems occur, most IT professionals turn to
packet capture to diagnose the problem. The OptiView analyzers
make it easy to troubleshoot intermittent problems with advanced
triggering and filtering to capture the traffic before, after or around
the event occurrence and ensures the event is captured the first
time to avoid doing random traffic captures that may not contain
anything of interest. To capture a specific event the analyzer must
inspect the contents of each packet to see if it matches a pattern
or error message string which is indicative of the event occurring.
The string matching is performed in hardware in real-time with line-
rate gigabit capture to ensure all the relevant packets are captured
– after all, you can’t analyze packets that were never captured. A
total of eight sets of triggers or filters can be defined to trigger a
capture unattended for later analysis, allowing analysis when you
have time, not when the event occurred.
Free String Match
If you highlight the device and select the Filter button, you will
be provided with a screen that looks like the one in Figure 39.
Figure 39. Setting Up a Filter
Using OptiView® Integrated ClearSight™ AnalyzerThe Integrated ClearSight Analyzer (iCSA), which is built into the
portable OptiView analyzer, is a full featured, easy to use, protocol
analyzer. The screen similar to the one in Figure 40 will appear.
Figure 40. Initial iCSA Screen
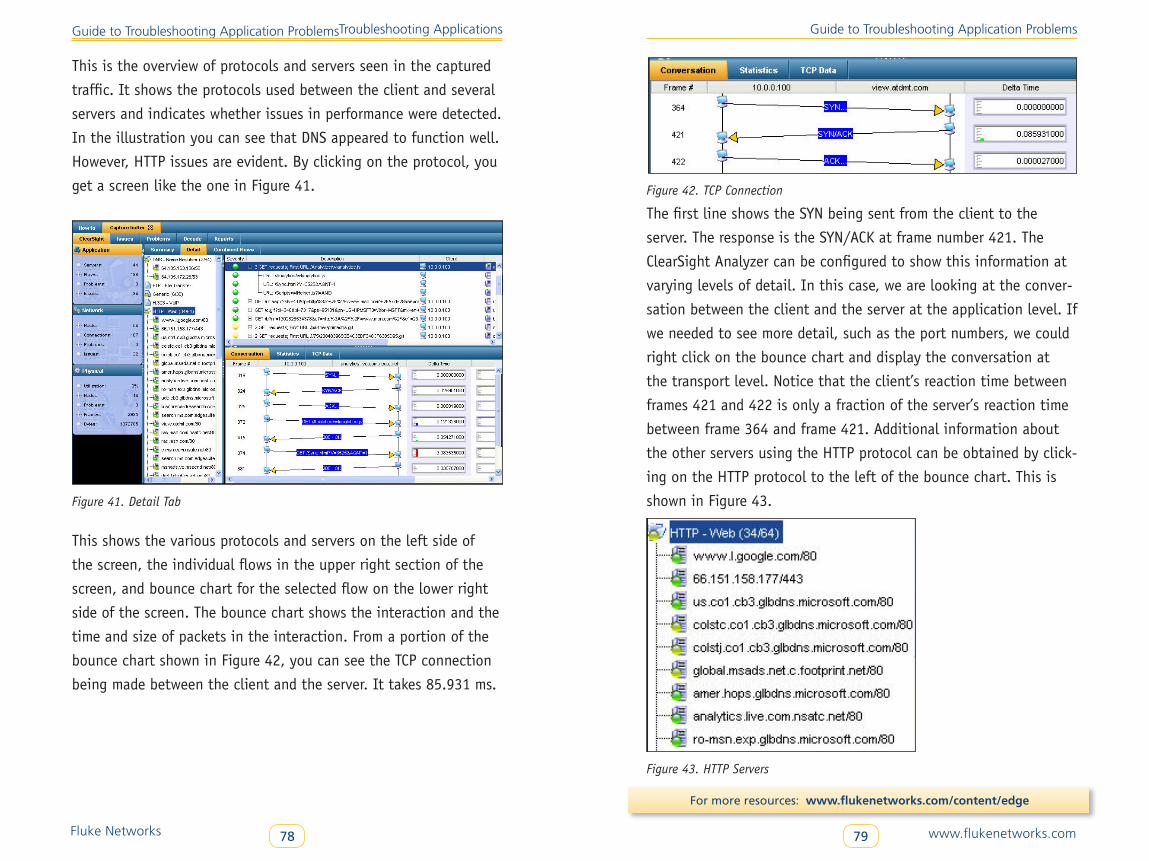
Fluke Networks 78 www.flukenetworks.com79
Guide to Troubleshooting Application Problems Guide to Troubleshooting Application Problems
For more resources: www.flukenetworks.com/content/edge
Troubleshooting Applications
This is the overview of protocols and servers seen in the captured
traffic. It shows the protocols used between the client and several
servers and indicates whether issues in performance were detected.
In the illustration you can see that DNS appeared to function well.
However, HTTP issues are evident. By clicking on the protocol, you
get a screen like the one in Figure 41.
Figure 41. Detail Tab
This shows the various protocols and servers on the left side of
the screen, the individual flows in the upper right section of the
screen, and bounce chart for the selected flow on the lower right
side of the screen. The bounce chart shows the interaction and the
time and size of packets in the interaction. From a portion of the
bounce chart shown in Figure 42, you can see the TCP connection
being made between the client and the server. It takes 85.931 ms.
Figure 42. TCP Connection
The first line shows the SYN being sent from the client to the
server. The response is the SYN/ACK at frame number 421. The
ClearSight Analyzer can be configured to show this information at
varying levels of detail. In this case, we are looking at the conver-
sation between the client and the server at the application level. If
we needed to see more detail, such as the port numbers, we could
right click on the bounce chart and display the conversation at
the transport level. Notice that the client’s reaction time between
frames 421 and 422 is only a fraction of the server’s reaction time
between frame 364 and frame 421. Additional information about
the other servers using the HTTP protocol can be obtained by click-
ing on the HTTP protocol to the left of the bounce chart. This is
shown in Figure 43.
Figure 43. HTTP Servers
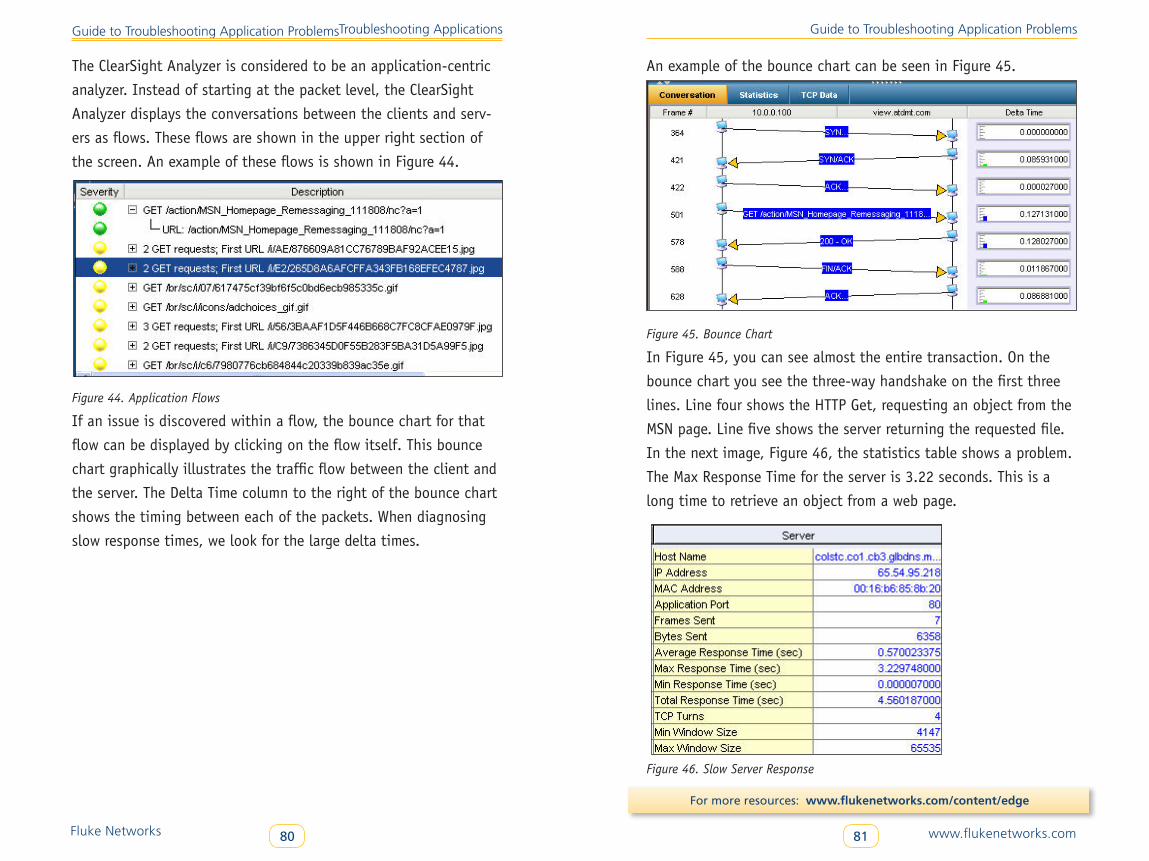
Fluke Networks 80 www.flukenetworks.com81
Guide to Troubleshooting Application Problems Guide to Troubleshooting Application Problems
For more resources: www.flukenetworks.com/content/edge
Troubleshooting Applications
The ClearSight Analyzer is considered to be an application-centric
analyzer. Instead of starting at the packet level, the ClearSight
Analyzer displays the conversations between the clients and serv-
ers as flows. These flows are shown in the upper right section of
the screen. An example of these flows is shown in Figure 44.
Figure 44. Application Flows
If an issue is discovered within a flow, the bounce chart for that
flow can be displayed by clicking on the flow itself. This bounce
chart graphically illustrates the traffic flow between the client and
the server. The Delta Time column to the right of the bounce chart
shows the timing between each of the packets. When diagnosing
slow response times, we look for the large delta times.
An example of the bounce chart can be seen in Figure 45.
Figure 45. Bounce Chart
In Figure 45, you can see almost the entire transaction. On the
bounce chart you see the three-way handshake on the first three
lines. Line four shows the HTTP Get, requesting an object from the
MSN page. Line five shows the server returning the requested file.
In the next image, Figure 46, the statistics table shows a problem.
The Max Response Time for the server is 3.22 seconds. This is a
long time to retrieve an object from a web page.
Figure 46. Slow Server Response
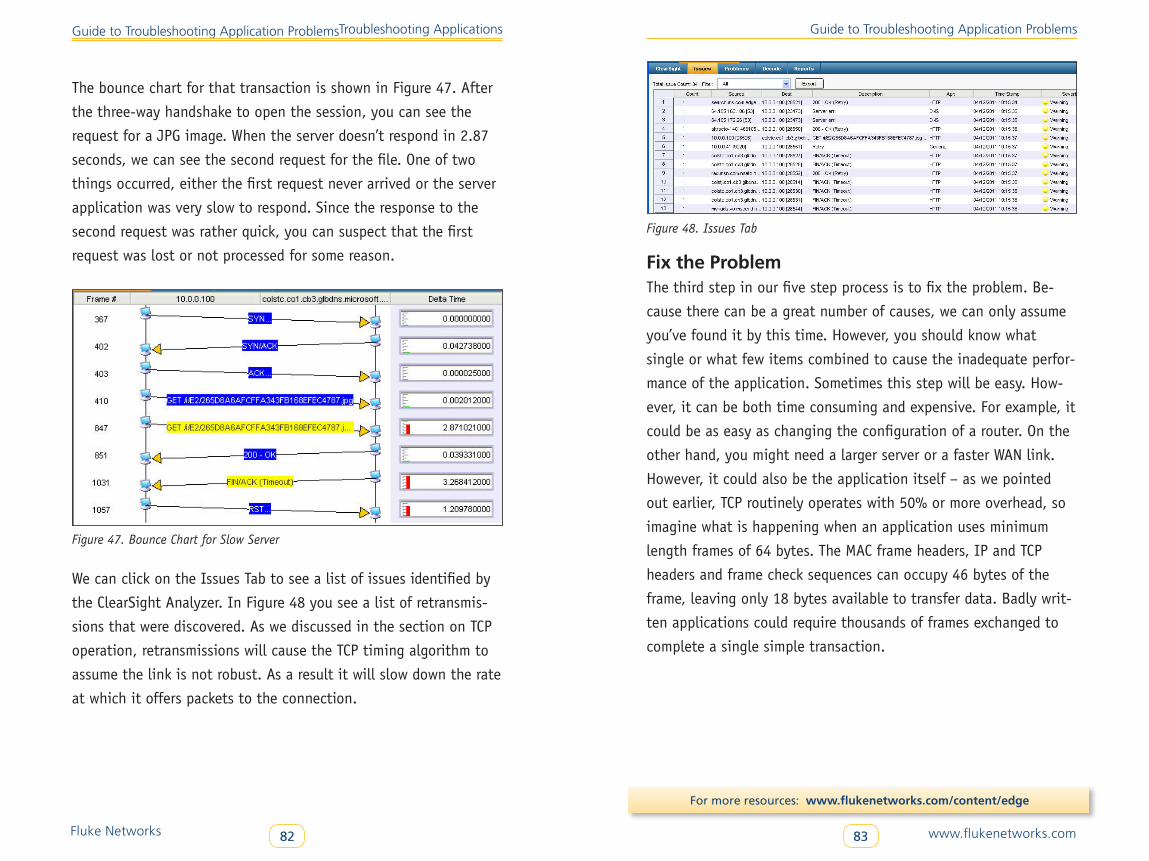
Fluke Networks 82 www.flukenetworks.com83
Guide to Troubleshooting Application Problems Guide to Troubleshooting Application Problems
For more resources: www.flukenetworks.com/content/edge
Troubleshooting Applications
The bounce chart for that transaction is shown in Figure 47. After
the three-way handshake to open the session, you can see the
request for a JPG image. When the server doesn’t respond in 2.87
seconds, we can see the second request for the file. One of two
things occurred, either the first request never arrived or the server
application was very slow to respond. Since the response to the
second request was rather quick, you can suspect that the first
request was lost or not processed for some reason.
Figure 47. Bounce Chart for Slow Server
We can click on the Issues Tab to see a list of issues identified by
the ClearSight Analyzer. In Figure 48 you see a list of retransmis-
sions that were discovered. As we discussed in the section on TCP
operation, retransmissions will cause the TCP timing algorithm to
assume the link is not robust. As a result it will slow down the rate
at which it offers packets to the connection.
Figure 48. Issues Tab
Fix the ProblemThe third step in our five step process is to fix the problem. Be-
cause there can be a great number of causes, we can only assume
you’ve found it by this time. However, you should know what
single or what few items combined to cause the inadequate perfor-
mance of the application. Sometimes this step will be easy. How-
ever, it can be both time consuming and expensive. For example, it
could be as easy as changing the configuration of a router. On the
other hand, you might need a larger server or a faster WAN link.
However, it could also be the application itself – as we pointed
out earlier, TCP routinely operates with 50% or more overhead, so
imagine what is happening when an application uses minimum
length frames of 64 bytes. The MAC frame headers, IP and TCP
headers and frame check sequences can occupy 46 bytes of the
frame, leaving only 18 bytes available to transfer data. Badly writ-
ten applications could require thousands of frames exchanged to
complete a single simple transaction.
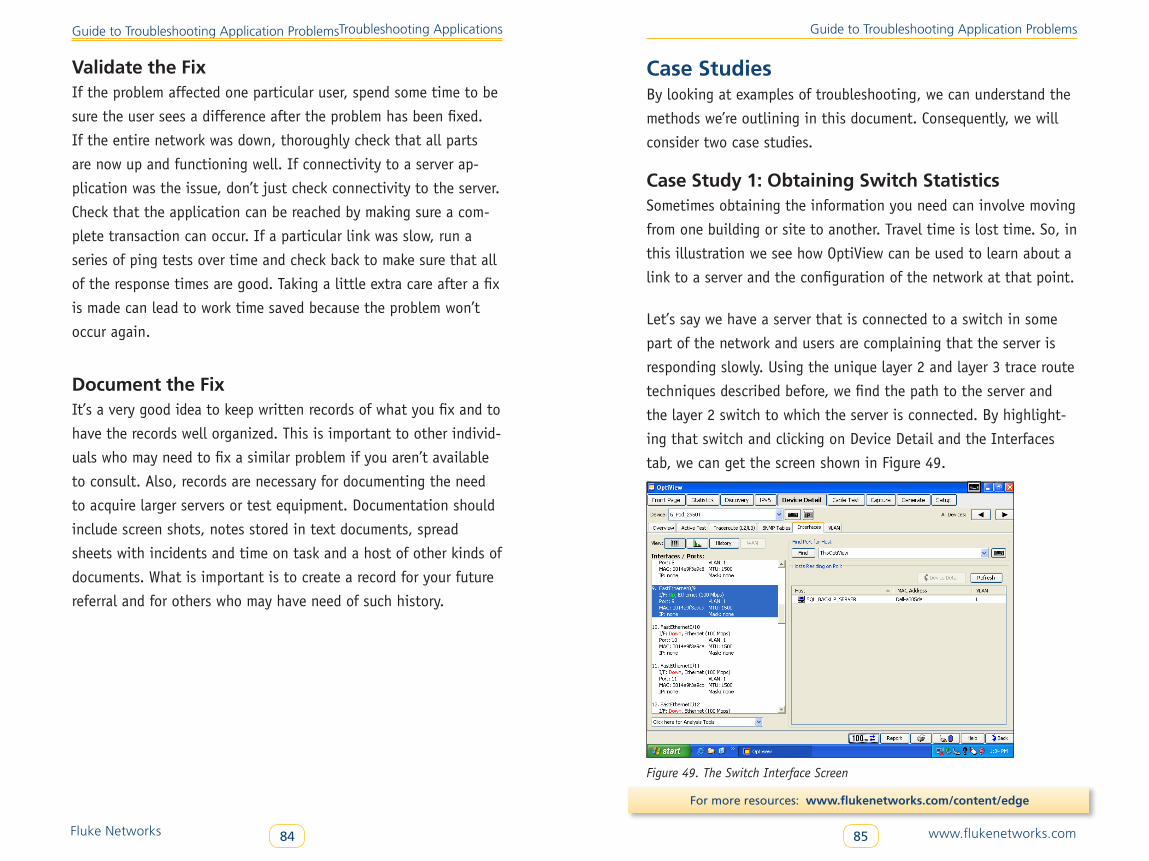
Fluke Networks 84 www.flukenetworks.com85
Guide to Troubleshooting Application Problems Guide to Troubleshooting Application Problems
For more resources: www.flukenetworks.com/content/edge
Troubleshooting Applications
Validate the FixIf the problem affected one particular user, spend some time to be
sure the user sees a difference after the problem has been fixed.
If the entire network was down, thoroughly check that all parts
are now up and functioning well. If connectivity to a server ap-
plication was the issue, don’t just check connectivity to the server.
Check that the application can be reached by making sure a com-
plete transaction can occur. If a particular link was slow, run a
series of ping tests over time and check back to make sure that all
of the response times are good. Taking a little extra care after a fix
is made can lead to work time saved because the problem won’t
occur again.
Document the FixIt’s a very good idea to keep written records of what you fix and to
have the records well organized. This is important to other individ-
uals who may need to fix a similar problem if you aren’t available
to consult. Also, records are necessary for documenting the need
to acquire larger servers or test equipment. Documentation should
include screen shots, notes stored in text documents, spread
sheets with incidents and time on task and a host of other kinds of
documents. What is important is to create a record for your future
referral and for others who may have need of such history.
Case StudiesBy looking at examples of troubleshooting, we can understand the
methods we’re outlining in this document. Consequently, we will
consider two case studies.
Case Study 1: Obtaining Switch StatisticsSometimes obtaining the information you need can involve moving
from one building or site to another. Travel time is lost time. So, in
this illustration we see how OptiView can be used to learn about a
link to a server and the configuration of the network at that point.
Let’s say we have a server that is connected to a switch in some
part of the network and users are complaining that the server is
responding slowly. Using the unique layer 2 and layer 3 trace route
techniques described before, we find the path to the server and
the layer 2 switch to which the server is connected. By highlight-
ing that switch and clicking on Device Detail and the Interfaces
tab, we can get the screen shown in Figure 49.
Figure 49. The Switch Interface Screen
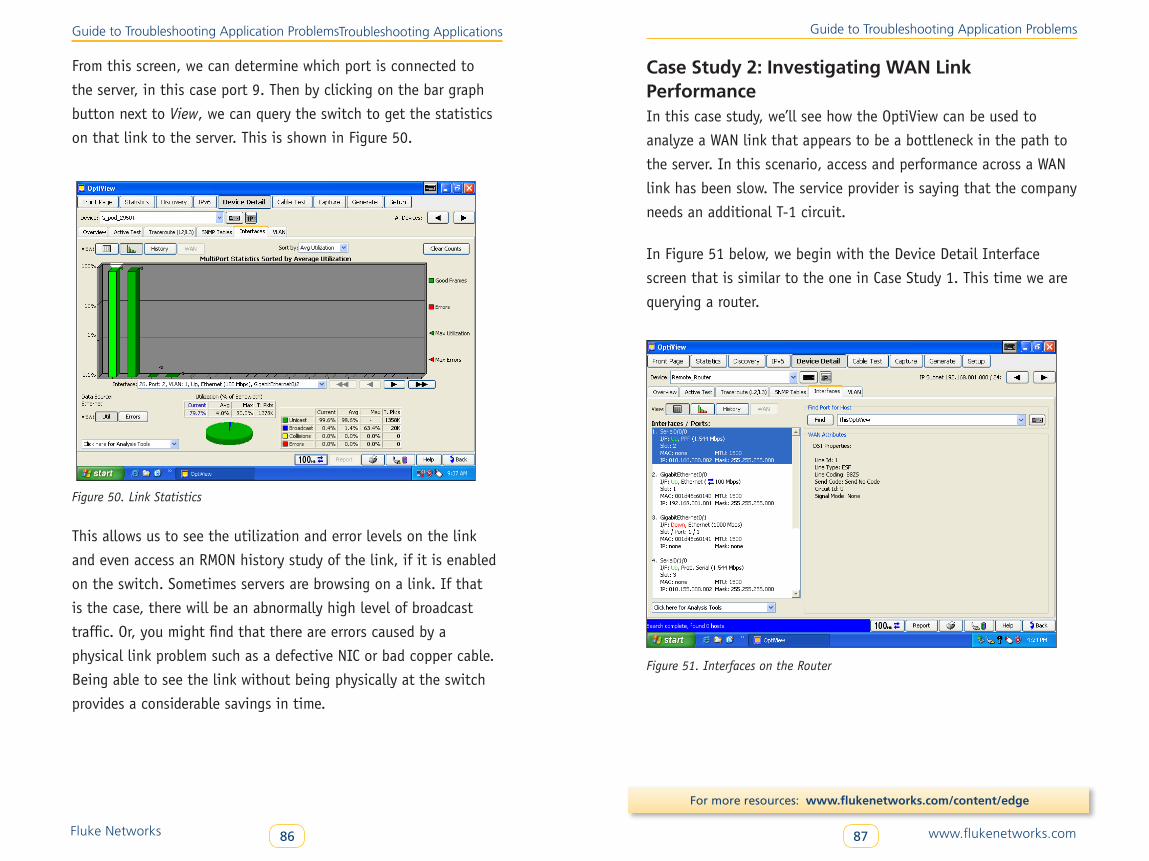
Fluke Networks 86 www.flukenetworks.com87
Guide to Troubleshooting Application Problems Guide to Troubleshooting Application Problems
For more resources: www.flukenetworks.com/content/edge
Troubleshooting Applications
From this screen, we can determine which port is connected to
the server, in this case port 9. Then by clicking on the bar graph
button next to View, we can query the switch to get the statistics
on that link to the server. This is shown in Figure 50.
Figure 50. Link Statistics
This allows us to see the utilization and error levels on the link
and even access an RMON history study of the link, if it is enabled
on the switch. Sometimes servers are browsing on a link. If that
is the case, there will be an abnormally high level of broadcast
traffic. Or, you might find that there are errors caused by a
physical link problem such as a defective NIC or bad copper cable.
Being able to see the link without being physically at the switch
provides a considerable savings in time.
Case Study 2: Investigating WAN Link Performance In this case study, we’ll see how the OptiView can be used to
analyze a WAN link that appears to be a bottleneck in the path to
the server. In this scenario, access and performance across a WAN
link has been slow. The service provider is saying that the company
needs an additional T-1 circuit.
In Figure 51 below, we begin with the Device Detail Interface
screen that is similar to the one in Case Study 1. This time we are
querying a router.
Figure 51. Interfaces on the Router
Fluke Networks 88 www.flukenetworks.com89
Guide to Troubleshooting Application Problems Guide to Troubleshooting Application Problems
For more resources: www.flukenetworks.com/content/edge
By highlighting the interface with the suspected WAN link, we can
see some of the interface statistics and see that it is, in fact at T-1
circuit running at 1.544 Mbps and that the MTU is 1500 bytes.
This means that IP packets with the standard maximum size of
1500 bytes will not be fragmented in order to traverse the link.
By clicking on the bar graph button next to View. the screen in
Figure 52 is produced.
Figure 52. Utilization of the WAN Link
This screen makes it obvious that the utilization of the WAN link
is only slightly under 50%. This screen is periodically updated,
so you could study it over a period of time to be sure about your
conclusion. As we mentioned before, it would be wise to move
on to an analysis of the server or the application running on
the server.
Troubleshooting Applications
SummaryIn this document, we have provided information on how network
applications work. We have discussed the typical sequence for a
client to use when it makes a connection to a server and asks for
a service to be provided. As part of that analysis we considered the
DNS lookup, the role of ARP, how the TCP connection is opened,
how the request is sent and the response is received, and how
the connection is closed. We considered the major categories of
applications such as web applications, database applications and
transaction processing systems. During that explanation we noted
that 90% of the applications are based on the TCP protocol.
In analyzing how the client interacts with the server, we consid-
ered the route to the server and how it can hide problems that
affect performance. We also did a brief tutorial on the operation
of TCP since its operation has such a significant influence on how
well the application appears to perform. We discovered that when
packets are lost in the network, the impact on TCP performance is
significant. This led us to the conclusion that the quality of the
network is very important.
In considering TCP operation, we described the three-way
handshake that is used to create the connection, the method
of assuring reliability of the transfer of data and the four-way
handshake that closes the connection.
Fluke Networks 90 www.flukenetworks.com91
Guide to Troubleshooting Application Problems Guide to Troubleshooting Application Problems
For more resources: www.flukenetworks.com/content/edge
We moved on to a discussion of a Five Step Process to troubleshoot
applications. We stress that a logical approach would include:
(1) determining the domain of the problem; (2) performing an
application flow analysis; (3) fixing the problem; (4) validating
that the problem is fixed; and (5) documenting that was fixed and
how it was fixed.
Using the techniques suggested in this paper should reduce finger
pointing between your application developers and your network
staff. And, it will increase your success in solving network
problems, reducing costs to your company.
Solutions from Fluke Networks
Fluke Networks offers a range of complementary network and
performance management solutions: TruView and OptiView. These
are dedicated custom hardware with support and interfaces that
provide both 1Gbps and 10Gbps connectivity
Visual TruView™ Appliance
TruView provides the ability to track, baseline, trend and monitor
individual application performance of every end user experience,
enterprise wide through a highly customizable dashboard. It also
provides high volume packet archival at 10Gbps line rate and com-
prehensive VoIP/Video monitoring and troubleshooting.
More information at www.flukenetworks.com/truview
OptiView XG® – Automated network and application analysis
The OptiView XG is the first tablet specifically designed for the
Network Engineer. It automates root cause analysis of network
and application problems allowing the user to spend less time on
troubleshooting and more time on other initiatives. It is designed
to support deployment of new technologies, including unified
communications, virtualization, wireless and 10 Gbps Ethernet.
The result is that new initiatives get up and running faster and
network stay productive even in these days of smaller teams.
More information at www.flukenetworks.com/xg

Fluke NetworksP.O. Box 777, Everett, WA USA 98206-0777
Fluke Networks operates in more than 50 countries worldwide. To find your local office contact details, go to www.flukenetworks.com/contact.
©2011-2015 Fluke Corporation. All rights reserved. Printed in U.S.A. 5/2015 3364967D