Embed Size (px)
Citation preview

OVERVIEW OF PRESCRIPTIONDRUG BENEFITS INMANAGED CARE
ROBERT P. NAVARRO ANDRUS T Y HA I L E Y
2
17
Chapter
INTRODUCTION
A prescription drug program is a vital component of comprehensive healthcare benefitsoffered by managed care organizations. Virtually all managed care organizations offerpharmacy benefits, and over 92% of commercial managed care customers purchase phar-macy benefits for their employees. In addition to commercial health plans, Medicaid pro-grams include a pharmacy benefit, and as of 2006, Medicare Part D offers an outpatientprescription drug benefit to the 41 million Medicare beneficiaries. Therefore, other thanthe 46 million uninsured, the vast majority—approximately 85%—of the U.S. popula-tion may obtain prescription coverage through a private or public third-party managedpharmacy benefit program. Correspondingly, as a result of the Medicare Part D drug ben-efit, the Centers for Medicare and Medicare Services (CMS) projects that by 2008, 80%of prescription drug expenditures will be paid by a public or private third-party prescrip-tion program.1 The 2004 to 2008 change in prescription drug expenditures by payersource is illustrated in Figure 2-1.
Prescription drug benefits are a highly coveted and a highly utilized benefit by plan spon-sors as well as members. Plan sponsors should understand that offering all health plan mem-bers comprehensive pharmacy benefits makes clinical as well as economic sense. Clearly,prescription drugs are a management linchpin of many high-cost and high-prevalence med-ical conditions, including hypertension, outpatient infections, hyperlipidemia, congestiveheart failure, diabetes, cancer, seizure disorders, migraine headache, asthma, allergic rhinitis,depression, psychosis, gastroesophogeal reflux disease (GERD), seizure disorders, and manyothers. Effective outpatient treatment with a pharmaceutical may obviate the need for moreexpensive and less benign medical resources, such as hospitalization and surgery.
32400_CH02_Pass2.qxd 10/11/08 11:39 AM Page 17
© Jones and Bartlett Publishers, LLC. NOT FOR SALE OR DISTRIBUTION.

GOALS OF PHARMACY BENEFIT MANAGEMENT
Health Care in the United States is a highly competitive market-driven business. Public(Medicaid and Medicare) and private (employer groups) plan sponsors have many com-petitive alternative sources for prescription drug benefits. As a result, providers of phar-
18 Chapter 2 Overview of Prescription Drug Benefits
Medicaid19%
Medicaid12%
Medicare2%
Medicare28%
Out of Pocket25%
Out of Pocket16%
Private Insurance48%
Private Insurance38%
Other Public(incl. SCHIP)
6%
Other Public(incl. SCHIP)
6%
2004 Prescription Drug Expenditures by Payer ($188.5B)
Projected Prescription Drug Expenditures by Payer ($255.8B)
FIGURE 2-1 Change in Payer Source of Prescription Drug Expenditures (2004 and 2008).Data obtained from National Healthcare Expenditure Projections: 2005–2015. Prescription Drug Expenditures (Table 11). Available at:http://www.cms.hhs.gov/NationalHealthExpendData/03_NationalHealthAccountsProjected.asp. Accessed 30 May 2008.
32400_CH02_Pass2.qxd 10/11/08 11:39 AM Page 18
© Jones and Bartlett Publishers, LLC. NOT FOR SALE OR DISTRIBUTION.

macy benefits must understand and anticipate the varied expectations and demands ofpurchasers, who are quite willing to switch to another pharmacy benefit provider on anannual basis if they are dissatisfied with their current provider. Generally, payers are inter-ested in pharmacy benefit providers who are able to manage program costs, provide rea-sonable access to necessary medications, and provide excellent customer supportprograms. However, payers are different in their demands, and whereas one plan sponsormay place greater importance on cost containment and accept very limited benefits,another group, such as a union trust, may desire a broad range of drug coverage with verylow copayments, and still another employer may be more interested in providing greaterdrug coverage supported by disease management programs. Pharmacy program providerscounsel their clients on how they may achieve their desired outcomes by crafting theirown customized pharmacy benefit management program.
Pharmacy directors attempt to manage the supply cost as well as the utilizationdemand of pharmaceuticals. This is accomplished by influencing the behavior of all indi-viduals and entities that can control the supply and demand of pharmaceuticals by shar-ing with them the program financial risk. From a pharmacy benefit perspective, managedcare implements supply side contracts with pharmaceutical manufacturers and dispensingpharmacies that essentially extract discounts on the drug ingredient cost (through manu-facturer rebates and pharmacy reimbursement discounts) and a discounted pharmacydispensing fee. Demand-side controls involve member prescription copayments or coin-surances paid by patient-members when they access and obtain pharmacy services. Mem-ber cost sharing is designed to encourage use of the most cost-effective products. Somemanaged care organizations (MCOs) also share a portion of the pharmacy benefit finan-cial risk with prescribing physicians. The theory behind this strategy is that physicians willprescribe more cost-efficiently if they share in the cost of the drugs they prescribe. Despitethe fact that this practice has been criticized for appearing to pay physicians for prescrib-ing certain drugs, physicians with shared financial risk generally prefer generic or lessexpensive brand products, which also benefit patients through a lower copayment. Insummary, pharmacy program managers attempt to obtain discounts on the drug ingredi-ent cost as well as encourage the use of the least expensive yet therapeutically effectiveproducts to optimize pharmacy budget expenditures, which benefits plan sponsors as wellas members.
As a result, pharmacy benefit managers (PBMs) must offer a broad range of programbenefit design options to meet varied plan sponsor desires, while involving all stakehold-ers financially to achieve program objectives for each unique customer. The relationshipsand the flow of money among various stakeholders involved in medical and pharmacybenefits are shown in Figure 2-2. A general rule in identifying entities that may influencesupply and demand is to “follow the money” trail. This model includes an MCO thatcontracts with a PBM for certain pharmacy benefit services (e.g., pharmacy distributionnetwork and to contract with pharmaceutical manufacturers). However, large MCOs canprovide complete pharmacy benefits directly without using a PBM. The relationships
Goals of Pharmacy Benefit Management 19
32400_CH02_Pass2.qxd 10/11/08 11:39 AM Page 19
© Jones and Bartlett Publishers, LLC. NOT FOR SALE OR DISTRIBUTION.

involved in medical benefit delivery in Figure 2-2 are de-emphasized to highlight thepharmacy benefit delivery.
Both public and private MCOs continue to aggressively manage pharmacy benefits in anattempt to promote the appropriate level of prescription utilization rate as well as optimizethe drug expenditure spend. This focus on pharmacy benefit management may seem anti-thetical to the cost-effectiveness value of pharmaceuticals. However, health care in the UnitedStates is a market-driven business. Since the inception of managed healthcare concepts in theearly part of the 20th century, purchasers of care have demanded cost-containment as well asa broad spectrum of healthcare benefits. Although managed care has aggressively managed allhealthcare products and services, pharmaceutical benefits continue to be aggressively man-aged for three primary reasons:
1. Although pharmacy benefits are the third largest healthcare benefit expenditure ofmanaged care plans (after hospital and outpatient medical benefits), the annual trend
20 Chapter 2 Overview of Prescription Drug Benefits
Plan Sponsor(private or public)
RetailPharmacy
Pharmaceutical Company
Mail OrderPharmacy
Premium Payment from Plan SponsorDiscounted Reimbursement to ProviderPatient Copayment or CoinsuranceRebate from Pharmaceutical Company
SpecialtyPharmacy
MCO
Medical benefit
premiums
Pharmacy benefit
premiums
Rebates
Discounted reimbursement
Discounted reimbursement
Copaymentor coinsurance
Hospital Physician
Key to Arrows:
Patient
PBM
FIGURE 2-2 Relationships Among Stakeholders in Managed Prescription Drug Benefits(PBM model; medical benefit delivery de-emphasized).
32400_CH02_Pass2.qxd 10/11/08 11:39 AM Page 20
© Jones and Bartlett Publishers, LLC. NOT FOR SALE OR DISTRIBUTION.
rate of prescription drug benefits had been rising faster than the other two major ben-efits for the past several years. Today, pharmacy benefits consume approximately 20%of total managed care healthcare costs, compared with approximately 5% twodecades ago. This trend seems to be slowing a bit since 2005, and may be reducedmore by the loss of patent protection of a number of important high cost and highutilization drugs over the next three years.
2. Pharmacy benefits are highly visible to government and private plan sponsors andaccessed more than hospital or outpatient medical benefits. The average commercialMCO members uses approximately 8 to 11 prescriptions per year, and the averageMedicare Part D member uses approximately 17 to 23 prescriptions per year, whereasthe average commercial member consults a physician 5 to 6 times per year, and manyof these encounters are pediatric visits.
3. Pharmacy benefits can be easily managed. The recipe for managing prescription drugcosts and utilization is well known and can be implemented within months with ade-quate resources, and if payers and members are willing to accept benefit limitations.The management strategies used today were initiated almost 25 years ago, and usedby every pharmacy benefit manager to manage pharmacy benefits. However, whilethe strategies are well known, successful implementation is challenging.
Rather than severely restrict or eliminate pharmacy benefits, MCOs and PBMs attemptto counsel their customers to purchase a cost-effective benefit. That is, an intelligentlymanaged pharmacy benefit will provide easy access to necessary drugs, even encourage theappropriate use of cost-effective pharmaceuticals, and guard against inappropriate use ofunnecessary, ineffective, or overly expensive drugs.
Pharmacy benefit management has been successful in reducing pharmacy benefitcosts by 25% to 45%, compared to unmanaged drug costs, depending upon the aggres-siveness of the managed program. As pharmacy benefits evolve, and outcomes datademonstrate the comparative value of competitive pharmaceuticals, PBMs and purchasersof health care will be in a better position to develop and implement an intelligent phar-macy benefit that optimizes the appropriate use of the most cost-effective pharmaceuticalsto achieve the best clinical, economic, and humanistic outcomes.
Pharmacists managing prescription drug benefits must provide high quality pharmacybenefits while managing program costs. The quest to manage costs, rather than merelyminimize costs, remains the challenge. As pharmacy program costs continue to escalate atan annual trend rate of approximately 10% to 15%, it is tempting to merely restrict expen-sive drugs, require the use of only generic drugs, and to significantly increase the patent co-patient tier amounts. However, simply focusing on cost-minimization may be myopic andultimately cost-ineffective in several therapeutic categories. High cost drugs may producesuperior clinical and economic outcomes compared with less expensive alternatives. Also,very high member copayments may be a barrier to drug utilization and adherence, andmay result in drug failure, which may require more expensive medical treatment. Thus,
Goals of Pharmacy Benefit Management 21
32400_CH02_Pass2.qxd 10/11/08 11:39 AM Page 21
© Jones and Bartlett Publishers, LLC. NOT FOR SALE OR DISTRIBUTION.

pharmacy directors must consider the cost as well as outcomes associated with competingdrug products when developing and managing their pharmacy benefit.
Health plan administrators as well as commercial and government payers oftenconsider pharmacy benefits only as a cost center, and do not appreciate the value that awell-managed pharmacy benefit can bring to clinical, economic, and humanistic out-comes. In fact, a successfully managed pharmacy benefit should be considered aninvestment in cost-effective health care, rather than only a necessary expense. Healthoutcomes research in health plans, addressed below, provides the linkage betweenappropriate use of cost-effective drugs and positive outcomes, and helps administratorsand payers migrate from cost-minimization to optimizing value. To achieve this goal,pharmacy benefit managers attempt to select the most cost-effective drugs for formu-lary inclusion, implement programs to promote the appropriate use and adherence, anddocument value by measuring outcomes. These goals are no different than those of hos-pital pharmacists, but are more difficult to control as the MCO pharmacy director isoften managing prescription benefits for hundreds of thousands, or even millions ofpatients, from pediatric patients to Medicare beneficiaries, with literally every knowndisease for a prolonged period of time.
NOVEL CHALLENGES AND EFFECTIVE MANAGEMENT STRATEGIES
Pharmacy benefit management has evolved over the past 25 years to meet and—if possible—anticipate the clinical and financial market challenges threatening effective prescription drugbenefit management. The events of the years leading up to 2010 and beyond provide someunique market trends not seen in the past two decades. The three most important concernsand challenges managed care pharmacy directors face include:
• Successful implementation of the Medicare Modernization Act Part D Medicare phar-macy benefit. Although some health plans have had experience in Medicare healthbenefits, very few have offered a comprehensive pharmacy benefit. Medicare Advan-tage plans (formerly Medicare + Choice) will hold financial risk for medical as well aspharmacy benefits in this population subgroup with 40 million elderly beneficiaries,which typically have more diseases, comorbidities, and consume more medications.
• Management of injectable biological medications, which are generally extremelyexpensive and often used in severe or life-threatening medical conditions (e.g.,rheumatoid arthritis and other autoimmune disorders, HIV-AIDS, Crohn’s disease,end-stage renal disease, and a variety of cancers). Many health plans and PBMs areusing specialty pharmacies to provide and manage injectable biologicals, as these prod-ucts require specialized distribution systems and patient management strategies.Injectable products may not be a component of the pharmacy budget, and are oftenpart of the medical budget. However, even if injectables are not a financial responsibil-ity of the pharmacy budget, often the pharmacy department is involved in managinginjectable drug selection and utilization.
22 Chapter 2 Overview of Prescription Drug Benefits
32400_CH02_Pass2.qxd 10/11/08 11:39 AM Page 22
© Jones and Bartlett Publishers, LLC. NOT FOR SALE OR DISTRIBUTION.

• Successfully implementing consumer-driven healthcare (CDH) initiatives thatinclude health spending accounts (HSAs), and higher and more complicated copay-ments and coinsurance schemes. CDH initiatives should motivate and reward theconsumer for self-management and include financial incentives and cost-sharing,without the unintended consequence of inadvertently building in financial disincen-tives to delay preventive care.
In addition to these novel challenges, health plans and PBMs continue to face the dailychallenge of developing and implementing cost-effective pharmacy benefit programs cus-tomized for each of their customers. To meet the long-term and unique pharmacy benefitmanagement challenges, pharmacy and medical directors routinely consider the followingstrategies as most effective (these strategies are discussed in depth later in this chapter)2:
1. Increasing the use of generic drugs. Health plans and PBMs frequently report that50% to 60% of the prescriptions they reimburse are dispensed with lower pricedgeneric alternatives. Some closed-model plans estimate they may be able to increasethis rate to 70% or even 80%, especially in upcoming years when some importanthigh-cost and highly utilized drugs lose patent protection (e.g., statins, calcium chan-nel blockers, antidepressants, inhaled and nasal corticosteroids).
2. Raising patient prescriptions copayments and coinsurance amounts. Health plansand PBMs continue to increase copayments and coinsurance levels to encourage theuse of lower cost preferred formulary products and to share the cost of medicationswith members who use them. The impact of copayments will be discussed below inthe Drug Formulary Development and Management section.
3. Health plans and PBMs will more aggressively limit open access to the use of certainexpensive drugs, or drugs with a misuse or abuse potential, through the use of priorauthorization (physician and/or pharmacist must obtain approval to prescribe or dis-pense certain drugs), step-care edits (a lower priced drug must be used before a simi-lar expensive drug is reimbursed), and other limits (e.g., quantity of units dispensedat one time, and the duration of use).
4. Health plans and PBMs may again promote more closed drug formularies. Closed for-mularies (a limited of drugs are reimbursed) were more common in the late 1980s andearly 1990s, but formularies became more open (increased number of drugs reimbursedusing expanded tiered copayments) by the late 1990s. However, with increasing drugprogram costs, and demands from plan sponsors for greater cost containment, phar-macy directors may again encourage the use of closed formularies. This reoccurringtrend may be reinforced by the recent implementation of Medicare Part D formularies,which were generally more restrictive or closed.
Pharmacy directors will continue to use these and other strategies in the future, but willuse them more aggressively and with more therapeutic categories. The following sectionsdiscuss important information systems, and commonly used prescription drug programmanagement strategies in greater depth and detail.
Novel Challenges and Effective Management Strategies 23
32400_CH02_Pass2.qxd 10/11/08 11:39 AM Page 23
© Jones and Bartlett Publishers, LLC. NOT FOR SALE OR DISTRIBUTION.

PHARMACY INFORMATION SYSTEMS AND HEALTH INFORMATICS
Similar to other healthcare delivery components, pharmacy benefit administration is crit-ically dependent on efficient data and information systems. The basic information sys-tems involved in pharmacy benefit management include the following:
• Internal health plan administrative data systems that include member eligibility files,group benefit claims adjudication files, provider files, and drug files that are used foraccurate claims adjudication.
• In-pharmacy, point-of-service (POS) third party claims adjudication systems that dis-pensing pharmacists use to verify member, provider, and drug eligibility, and obtaincopayment and reimbursement information in an online, real-time environment.
• Health plan or PBM pharmacy administrative claims file, used for drug utilizationreview, pharmacy program performance analysis, research, patient and physicianintervention programs, and financial report generation. Drug files are often mergedwith medical files to generate an integrated claims database suitable for research.
The presence of a universally accepted electronic data interchange standard for pharmacyclaims transmission and adjudication has accelerated the adoption of pharmacy e-commerce.This standard, maintained by the National Council for Prescription Drug Programs(NCPDP), “creates and promotes standards for the transfer of data to and from the pharmacyservices sector of the healthcare industry.”3 This universal standard has allowed the pharmacyclaims systems to be suitable for electronic commerce.
PHARMACY CLAIMS ADJUDICATION
Observation of the NCPDP data standards allows 99% percent of all managed care pre-scription claims to be processed electronically online and usually in real-time. Pharmacistsrely on the third-party prescription drug program benefit design and coverage informationprovided to them through the in-pharmacy POS system. Pharmacy benefits programs,even within a single MCO or PBM, may be highly variable, may change frequently, andmay have complex benefit design elements, so dispensing pharmacists simply must rely onelectronic messaging to efficiently process prescriptions. When a pharmacist fills a man-aged care prescription, the required patient, drug, and prescriber data are input into thepharmacy POS system. Within seconds, the pharmacist is informed if the patient and drugare eligible for coverage, is informed of the copayment to be collected, and is provided anypertinent clinical information (e.g., drug interactions or clinical edits). If correct, the phar-macist completes the transaction and within seconds the claim is adjudicated online,informing the pharmacist of the reimbursement amount. The online pharmacy manage-ment systems provide patient-specific information at the point-of-dispensing that willidentify adherence problems, drug interactions, dispensing errors, and print a patientinformation document. Pharmacy claims data are also used to identify members that maybenefit from disease or case management, such as patients who appear to be misusing or
24 Chapter 2 Overview of Prescription Drug Benefits
32400_CH02_Pass2.qxd 10/11/08 11:39 AM Page 24
© Jones and Bartlett Publishers, LLC. NOT FOR SALE OR DISTRIBUTION.

abusing redundant prescriptions from multiple providers, or displaying other inappropri-ate or excessive drug use patterns.
PHARMACY AND MEDICAL CLAIMS INTEGRATION AND CLINICAL PROGRAM SUPPORT
Over the past decade, healthcare information system standards have allowed easier integra-tion of medical, administrative, and pharmacy claims datasets. Merging of these databasesis accomplished through linking the common shared dimensions, such as identifiers formember, physician, and employer group benefit level. Health plans and PBMs compete onprice as well as quality of care and services. Thus, health plans in particular are interested inmeasuring clinical and economic outcomes, and use comparative health plan data for mar-keting to potential customers. For example, a population of case-mix–adjusted patientswith a specific medical condition can be stratified according to severity, age, comorbidities,and other characteristics, to compare the clinical and economic outcomes of each cohort.Similarly, physician drug prescribing patterns also may be evaluated and compared. A well-constructed merged database may be used to identify clinical “best practices” that are asso-ciated with the most cost-effective outcomes.
Most health plans participate in the National Commission for Quality Assurance(NCQA) accreditation process, and allow their performance metrics to be comparedagainst competitive plans using the NCQA Health Plan Report Card.4 The NCQA hasalso established many “effectiveness of care” indicators through its Health Plan EmployerData and Information Set (HEDIS®) program. The NCQA HEDIS are a list of almost70 measures designed to collect data about the quality of care and services provided by thehealth plans.5 Approximately one-half of these measures relate to appropriate pharmaceu-tical or immunization use, and can be used to measure pharmacy benefit contributions ata high level. Health plan quality initiatives are addressed elsewhere in this book.
ELECTRONIC PRESCRIBING
The rapid expansion of information technology applications in health care presentsnovel opportunities and challenges for pharmacists. Although electronic prescribing isnot universal, many MCOs are experimenting with real-time electronic data transfer ofprescription-related information among trading partners: the health plan, physician,and pharmacy. Electronic prescribing refers to the use of computing devices to enter,modify, review, and output or communicate drug prescriptions. For inpatient care, elec-tronic medication ordering increases prescribing accuracy, dispensing efficiency, andreduces the number of adverse drug events and redundant medications. A number ofoutpatient pilot projects and initiatives in electronic prescribing are proliferating withinmanaged care organizations to achieve the same goals, and also providing medicationhistory, drug formulary options, drug hypersensitivities, and other clinically relevantdata to the prescriber at the point of prescribing.
Electronic prescribing is an electronic data interchange application that provideselectronic connectivity among all trading partners involved in prescription generation,
Pharmacy Information Systems and Health Informatics 25
32400_CH02_Pass2.qxd 10/11/08 11:39 AM Page 25
© Jones and Bartlett Publishers, LLC. NOT FOR SALE OR DISTRIBUTION.

adjudication, and analysis.6 E-prescribing links the health plan or PBM, with the physi-cian and pharmacy. E-prescribing allows the physician, using a desktop or handhelddevice to access a patient’s medication history, drug allergies, pharmacy benefits, anddrug formulary drugs covered, and transmits a “clean” prescription to the patient’s pre-ferred pharmacy: all online and in real-time. Figure 2-3 illustrates the electronic connec-tivity among trading partners.
There are several potential financial and patient care advantages to the physician,health plan, pharmacy, and patient. Point-of-prescribing medication information helpsenforce drug formulary conformance, informs the physician of the member copaymentimpact of selected drugs, and prevents rejected prescriptions at the pharmacy. Priorauthorization or step-care protocols may be enforced through e-prescribing, and the sys-tem can alert physicians of any drug interactions, history of adverse events, redundantprescriptions from other physicians, and incorrect dosages before the patient leaves thephysician’s office. The potential cost savings from e-prescribing result from reducedadministrative costs and less physician and pharmacist time involved in the prescriptionprocess, reduction in drug interactions and adverse effects, improved safety and reducedmedication errors, and improved medication compliance.
In the ambulatory environment, recent research shows that adverse events are com-mon and can be serious. The Center for Information Technology Leadership reports thatmore than 8.8 million adverse drug events occur each year in ambulatory care, of whichover 3 million are preventable, many resulting in deaths. In addition to reducing adverse
26 Chapter 2 Overview of Prescription Drug Benefits
Health Plan or PBM
Data Interchange Hub
Patient
Physician Pharmacy
Sends: benefit design andreimbursement information
Receives: adjudicated claims
Receives: drug history and drug fo mularyrinformation
Sends: cleanprescription to pharmacy
Can check on prescription status
Receives: prescriptionfrom physician
Sends:prescriptiondata to health plan or PBM
FIGURE 2-3 E-Prescribing Connectivity Among Managed Care Trading Partners.
32400_CH02_Pass2.qxd 10/11/08 11:39 AM Page 26
© Jones and Bartlett Publishers, LLC. NOT FOR SALE OR DISTRIBUTION.

drug effects, electronic prescribing can improve quality, efficiency, and reduce coststhrough other benefits, including7:
• Actively promoting appropriate prescription use and adherence.• Providing information about formulary options and copay information.• Improving dispensing efficiency and accuracy by providing instant electronic connec-
tivity between the physician, pharmacy, health plans and PBMs.
More than 3 billion prescriptions are written annually.6 Given this volume, even a smallimprovement in quality attributable to electronic prescribing would translate into signifi-cant healthcare cost and safety benefits if electronic prescribing is broadly adopted. Stud-ies suggest that the national savings from universal adoption of electronic prescribingsystems could be as high as $27 billion, including $4 per-member-per-year (PMPY) sav-ings from reducing preventable adverse drug events, and $35 to $70 PMPY savings frommore appropriate use of medications, for a total savings of $39 to $74 PMPY.6 Electronicprescribing has significant benefits for pharmacists as well. The Institute for Safe Medica-tion Practices estimates that pharmacists spend a significant amount of their time eachday on clarifying prescription orders, and make 150 million phone calls to physiciansannually on prescription accuracy related issues.8
RxHub® provides a universal portal that supports prescription electronic data inter-change among trading partners.9 Originally formed in 2001 by three PBMs, the enter-prise now enjoys participation of PBMs, health plans, and numerous e-prescribingsolution venders, for the purpose of:
“. . . creating a single point of communication for all participants in the prescrip-tion creation and delivery process the founders formed a neutral organization,whose primary mission is to accelerate the adoption of electronic prescribingresulting in better medicine and lower administrative costs.”9
All advantages of e-prescribing can lead to improved clinical, economic, and quality of lifeoutcomes. E-prescribing will unquestionably increase, especially as it is an eventualrequirement in the Medicare Modernization Act.
COMPONENTS OF A MANAGED PRESCRIPTION DRUG BENEFIT
Prescription drug benefits are provided through an internal pharmacy department withinan MCO* or by a stand-alone pharmacy benefit manager (PBM; the role of PBMs will beaddressed below and in Chapter 4). Regardless of the source (e.g., MCO or PBM), thereis great consistency in the management strategies used to develop and manage a prescrip-tion drug program. Pharmacists operating health plan pharmacy benefits have borrowedmany management strategies from hospital pharmacy programs, including the Pharmacy
Components of a Managed Prescription Drug Benefit 27
* In this context, the term managed care organization refers to HMO, PPO, POS, and other health plans;Medicaid programs; Medicare Part D plans.
32400_CH02_Pass2.qxd 10/11/08 11:39 AM Page 27
© Jones and Bartlett Publishers, LLC. NOT FOR SALE OR DISTRIBUTION.

& Therapeutics (P & T) Committee, the drug formulary, pharmaceutical company con-tracting, physician academic counter detailing, utilization review, and health outcomesresearch. However, MCOs have had to include additional capabilities, such as develop-ment of a pharmacy distribution network, innovative pharmacy benefit design, membercopayment schemes, member communication and education, and massive computer sys-tems to process millions of claims in a real-time environment. This section will list andillustrate the components of a successful managed care prescription drug benefit program.
LEGAL BASIS FOR PHARMACY BENEFIT PROGRAMS
All states have regulatory bodies that control health-related benefit plans as well as licens-ing boards that control the practice of specific healthcare providers. The Employee Retire-ment Income Security Act of 1974 (ERISA) is a federal law that sets minimum standardsfor most voluntarily established pension and health plans in private industry to provideprotection for individuals. The ERISA act has been supplemented by two importantamendments. The Consolidated Omnibus Budget Reconciliation Act (COBRA) providesworkers and their families the ability to continue their health coverage after loss ofemployment, and the Health Insurance Portability and Accountability Act (HIPAA) pro-vides protection for patients from discrimination related to pre-existing medical condi-tions as well as enhanced confidentiality of medical information.10
MCOs and PBMs, as corporate entities, do not practice medicine or pharmacy, anddo not claim to provide any and all desired pharmacy products and services. Rather, theyarrange for defined medical and pharmacy benefits to be provided by licensed healthcareprofessionals within a defined structure and process. Healthcare professionals participat-ing with an MCO or PBM provide pharmacy benefits that are specified and defined in astate regulated contract (e.g., Certificate of Coverage or other similar legal document)between the MCO or PBM and the purchaser of pharmacy benefits. Physicians and phar-macists agree to participate according to policies outlined in their respective providermanuals and contracts, which are generally filed with a state regulatory agency. The con-tract defines included and excluded benefits as well as the access rules through whichmembers must obtain benefits. Drugs eligible for reimbursement are normally thoseincluded in the drug formulary (a list of reimbursed drugs) that is reviewed and updatedfrom time to time. Drugs typically excluded from reimbursement include the following:
• Experimental or investigational drugs (drugs not approved by the U.S. Food andDrug Administration for commercial sale in the United States).
• FDA approved drugs when prescribed for unapproved indications (“off-label” indica-tions). This is generally unenforceable through community pharmacies, as pharma-cists are generally unaware of the prescribed indication or medical diagnosis for mostprescriptions dispensed. The approved indication may be enforced if the pharmacistmust obtain a prior authorization from the MCO or PBM prior to receiving reim-bursement for the drug product.
28 Chapter 2 Overview of Prescription Drug Benefits
32400_CH02_Pass2.qxd 10/11/08 11:39 AM Page 28
© Jones and Bartlett Publishers, LLC. NOT FOR SALE OR DISTRIBUTION.
• Drugs used for cosmetic purposes (e.g., Botox® for wrinkles) or possibly life enhance-ment drugs (e.g., PDE-5 inhibitors).
• A brand name drug for which there is an identical generic equivalent that is subject tomandatory generic substitution (e.g., drugs subject to a maximum allowable cost[MAC] reimbursement).
• Drug available without a prescription (or over-the-counter [OTC] drugs), includingbrand name drugs for which there is an identical OTC equivalent. Insulin is anexception, as it is a non-prescription drug in most states but remains covered byhealth plan pharmacy benefits.
It is important to note that all health plans and PBMs allow for medical exceptions todefined benefits. That is, a physician may appeal to a health plan or PBM for coverageand reimbursement for a non-covered benefit based upon an individual patient’s medicalneeds. Additionally, patients have the ability to directly purchase any non-covered benefitoutside of the pharmacy benefit, on a cash basis, with a physician’s prescription. Pharmacybenefit design does not limit what a physician may prescribe; benefit design only limitswhat an MCO or PBM will reimburse.
CHANGES IN PHARMACY BENEFIT DESIGN
There are two principal changes occurring in benefit design. The first is greater use of formu-lary prescription copayment and coinsurance tiers as well as higher copayment tier dollar andcoinsurance percent amounts, especially for non-preferred and injectable medications. Thesecond major benefit design change is the growth of CDH and HSAs, which are encouragedby state and federal regulatory agencies as well as employer groups and health plans.2,11 HSAsusually have lower monthly premiums and higher annual deductibles (often $2,500 for indi-viduals and $5,000 for families), and give members more latitude and freedom in using HSAfunds for health-related expenditures. A potential downside is that HSA members, used tonear first-dollar coverage for medical and pharmacy benefits, will now have to spend $2,500or more in out-of-pocket deductible expenses before benefits are covered 100% by the healthplan. Early experiences of a few employer groups have found some members are reluctant tospend their own out-of-pocket money, and may delay preventive care, thus resulting in a needfor delayed and more expensive acute medical treatment.12 HSAs are most effectively used byinformed members who are educated and motivated to optimize their health care, and aregiven appropriate information to make intelligent healthcare access decisions. HSA membersare important targets for pharmaceutical companies with direct-to-consumer advertising forboth prescription and over-the-counter medications.
DISTRIBUTION CHANNELS FOR OUTPATIENT PHARMACEUTICALS
Managed care organizations and PBMs must develop a pharmaceutical distribution sys-tem that meets member needs for easy access to prescription services as well as controllingdrug ingredient and dispensing costs. Closed model health plans (e.g., staff or group
Components of a Managed Prescription Drug Benefit 29
32400_CH02_Pass2.qxd 10/11/08 11:39 AM Page 29
© Jones and Bartlett Publishers, LLC. NOT FOR SALE OR DISTRIBUTION.

model MCOs) or large employer groups may have in-house, owned pharmacies for mem-ber convenience, supplemented with community pharmacies, often with mail service.Open model plans (e.g., independent practice associations [IPA] and network MCOs)will use a community-based pharmacy network including chain pharmacies, independentpharmacies, and often mail service pharmacy. Today, a pure MCO rarely exists, and moststaff and group model plans now offer a hybrid distribution network consistent of in-house pharmacists supplemented by community and mail service pharmacies.
Generally 80% to 90% of third party outpatient prescriptions are dispensed throughcommunity pharmacies (pharmacy chains, independent pharmacies, supermarkets, ormass merchandise stores such as WalMart and Target). Most of the remaining prescrip-tions are dispensing through mail services pharmacies, often owned or associated withPBMs or chain pharmacies. A small percent of prescriptions, mostly generic drugs andoften in rural areas, are dispensed in physician offices, which may not be reimbursed byMCOs or health plans. Of the $221 billion spent on outpatient prescription drugs in2004, the National Association of Chain Drug Stores (NACDS) reports that 42.2% weredispensed through chain pharmacies, 18.7% through community independent pharma-cies, 18.3% through mail service pharmacies, 12.2% through supermarkets, and 9.6%were dispensed through mass merchandise stores.13 As a result, the basis of a managedcare outpatient prescription network is often chain pharmacies, supplemented by othertypes of pharmacies. However, the NACDS reports that the largest annual growth in pre-scription sales from 2002 to 2003 occurred in mail service pharmacies, which grew byalmost 18%, in contrast with all other pharmacy types, which grew between 5% and 8%.
Pharmacies participating in the pharmacy provider network agree, by contract, to dis-pense drugs prescribed by participating physicians to eligible members according to thedrug formulary and other benefit design requirements. Open-access of POS plans mayreimburse prescriptions from any licensed physician. Pharmacists participate in many dif-ferent managed pharmacy programs, and by contract must use an online, real-time POScomputer system to verify coverage information (eligible drug, member, and physician),learn any dispensing limitations or requirements (e.g., quantity limits, step-care proto-cols), obtain copayment information, and know the level of reimbursement from thehealth plan or PBM. Busy pharmacists dispensing 200 prescriptions per day simply mustrely on an accurate and efficient online system to verify and adjudicate claims.
All participating pharmacies are bound by a provider agreement that stipulates theywill provide approved prescriptions dispensed to their members in accordance with drugbenefit and coverage policies, and for a specified discounted reimbursement. These poli-cies are usually detailed in a Participating Pharmacy Policy and Procedure Manual that isupdated from time to time by the MCO or PBM. Participating pharmacies agree to fol-low the drug formulary and dispensing requirements, use the POS system to adjudicateclaims online and in real-time whenever possible, promote the use of generics, discouragethe use of “dispense as written” prescriptions that encourage the use of brand drugs, andagree to participate in on-site audits of third party prescription records.
30 Chapter 2 Overview of Prescription Drug Benefits
32400_CH02_Pass2.qxd 10/11/08 11:39 AM Page 30
© Jones and Bartlett Publishers, LLC. NOT FOR SALE OR DISTRIBUTION.

Pharmacists receive a discounted ingredient cost reimbursement based upon a dis-count off the drug average wholesale price (AWP) plus a discounted dispensing fee. Theelements and calculations involved in determining pharmacy reimbursement of a branddrug in formulary copayment Tier II (brand preferred) is illustrated in Table 2-1. Whole-sale acquisition cost (WAC) is the published drug list price, but is not used in determin-ing pharmacy reimbursement from health plans or PBMs (WAC is de-emphasized inTable 2-1).
As shown in the example, the drug AWP is generally used to determine drug ingredi-ent reimbursement. In Table 2-1, the AWP is discounted by 15%. This level of discount isused to approximate the actual acquisition price (AAC) by the pharmacy. It is actuallyquite difficult to positively identify the AAC for a particular prescription, as the pharmacyinventory is based upon volume discounts, special offers, and early payment discounts.Thus, rather than burden pharmacies with the requirement to identify the exact AAC of aprescription, MCOs and PBMs approximate this amount using a discounted AWP. Branddrug AWP discounts may be 15% to 18%, and generic drug discounts are often in theAWP less 40% to 60% range. Other payments may exist, such as for special incentives forgeneric substitution or member clinical consultation, and medication therapy manage-ment (MTM) program activities, as mandated by the Medicare Part D regulations.
SPECIALTY PHARMACY DISTRIBUTION
The increasing use of high-cost injectable biological products is identified as the greatestthreat to pharmacy benefit management. However, despite the challenge in managing costand utilization of expensive products, injectable biologicals present unique, advanced therapyfor many severely debilitating and life-threatening illnesses. Thus, as much as health planswelcome the launch of life-saving drugs, they are faced with the reality that uncontrolled
Components of a Managed Prescription Drug Benefit 31
TABLE 2-1 Calculations Involved in Determining Pharmacy Reimbursement from aManaged Care Plan
Preferred Brand DrugTier II
Wholesale Acquisition Cost (WAC)* $80.00Average Wholesale Price (AWP) $100.00Drug Reimbursement (AWP—15% Discount) $85.00Dispensing Fee (+) $2.50Subtotal $87.50Member Tier II Copayment (–) $25.00
MCO Reimbursement to Pharmacy $62.50* WAC is not used in pharmacy reimbursement.Source: RP Navarro, 2006.
32400_CH02_Pass2.qxd 10/11/08 11:39 AM Page 31
© Jones and Bartlett Publishers, LLC. NOT FOR SALE OR DISTRIBUTION.
utilization may place a plan in financial peril. Health plans support the use of evidence-basedtreatment guidelines and protocols, and usually implement prior authorization edits onexpensive biological injectables to encourage appropriate use for Food and Drug Administra-tion (FDA)-approved indications. A large Blue Cross and Blue Shield plan found that 37%of injectable expenses were for oncology and related products, 11% were for inflammatorydiseases of the colon, 9% of injectables were for leucocyte stimulants, and 2% was spent onanti-inflammatory and anti-arthritis injectable products.14
The unique distribution, storage, and utilization consideration of injectables hascaused the development of carve-out specialty pharmacy distributors (SPDs). Specialtypharmacy services may also be offered internally through PBMs and health plans. Spe-cialty pharmacies manage the distribution and use of self- and physician-administeredinjectable products. SPDs may send injectables directly to a physician’s office or infu-sion center specifically for a patient appointment, or self-injectable drugs may bemailed directly to a member’s home. Volume purchasing by SPDs introduces cost effi-ciencies into the system that are passed on to payers and members. SPDs also userebates, formulary-style product steerage, copayments and coinsurance, and providerdiscounts as other methods of controlling injectable drug costs. Chapter 6 contains fur-ther discussions about specialty pharmacy distribution.
Health plans also may use SPDs to buy and store inventory on behalf of physicians,which prevents physicians from stocking and storing expensive mediations, and removesthem from the flow of dollars. In this scheme, the SPD bills the health plan and/or mem-ber directly, and the physician is paid an infusion and/or administration fee by the healthplan. The growing availability to biotechnology pharmaceuticals will likely increase therole and importance of SPDs in the future. Traditional discounted reimbursement ofinjectable products as a Part B Medicare Benefit will be altered through the use of a CMSaverage selling price (ASP) plus 6% method. Many plans are adopting this Medicare-stylecost-plus reimbursement for injectables in their commercial plans as well. The implemen-tation of the CMS competitive acquisition program (CAP) for injectable has beendelayed, and the impact of the CAP is unknown at this time.
INTERNET PHARMACY ACCESS
Internet pharmacies developed in the late 1900s, and were thought to be a future threat tocommunity and mail service pharmacies. However, this has not occurred, and althoughsome Internet pharmacies remain in existence (e.g., http://www.drugstore.com), othershave ceased business. In reality, Internet pharmacies were simply an online method toaccess traditional pharmacy services with mail delivery. Internet pharmacy access allowspatients to refill prescriptions and purchase non-prescription drugs, vitamins, and otherhealth products online. However, rather than Internet pharmacies threatening mail ser-vice pharmacies, we have seen chain and mail service pharmacies develop patient-friendlyInternet portals, and have developed their own Internet pharmacy capabilities. Managedcare supports Internet access to pharmacy services of U.S. licensed participating pharma-
32 Chapter 2 Overview of Prescription Drug Benefits
32400_CH02_Pass2.qxd 10/11/08 11:39 AM Page 32
© Jones and Bartlett Publishers, LLC. NOT FOR SALE OR DISTRIBUTION.

cies because Internet access increases the use of the mail service pharmacy component,which is considered a growing source of pharmacy budget savings.
While Internet access to licensed U.S. chain and mail service pharmacies is a patientconvenience, there remains a safety concern about unregulated Internet pharmacies out-side of the United States. Counterfeit and inert drugs from international sources havebeen distributed through Internet pharmacies, and international commerce through theInternet is impossible to control.
In response, the National Association of Boards of Pharmacy® (NABP) developedthe Verified Internet Pharmacy Practice Sites(tm) (VIPPS) program in 1999.15 To beVIPPS certified, a pharmacy must comply with the licensing and inspection require-ments of each state to which they dispense pharmaceuticals. In addition, pharmaciesdisplaying the VIPPS seal have demonstrated to NABP compliance with VIPPS criteria.According to the NABP Web site, twelve Internet pharmacies have satisfied VIPPScriteria,15 including the mails service pharmacies of PBMs (e.g., Caremark, Medco HealthSolutions, Prescription Solutions), health plans (e.g., CIGNA, Coventry), pharmacy chains (e.g., CVS, Walgreens), and Internet pharmacies (e.g., http://www.Familymeds.com,http://www.Drugstore.com).
PHYSICIAN DISPENSING
Some health plans may reimburse physicians for dispensing drugs directly from theiroffice, but this is an uncommon practice and most often occurs only in rural areas with-out adequate coverage of community pharmacies. Health plans will often not reimbursephysicians for dispensing drugs unless the physician’s office agrees to accept the same levelof reimbursement as is paid to pharmacies and if the physician’s office submits pharmacyclaims through a POS terminal. Physician dispensing units often contain a limitedamount of acute care drugs and generally promote the use of generics. Some applicationslink in-office physician dispensing units for acute care drugs with mail order for chroniccare medications. The American Academy of Family Practice supports the right of physi-cians to dispense,16 but thus far most medical groups have not focused on developing in-house dispensing activities, other than through a co-located and usually independentcommunity pharmacy (state law may allow the medical group to own the pharmacyspace, and obtain rent, but may prevent the medical group from owning the licensedpharmacy practice itself ).
PHARMACY AND THERAPEUTICS COMMITTEE MANAGEMENT
Managed care has borrowed the P & T Committee concept from hospitals as a source forformulary development and drug coverage decisions. In addition to the clinical drugreview, the Committee must make recommendations on drug formulary coverage andcopayment tier, and other dispensing limitations or restrictions. A managed care P & TCommittee typically consist of 10 to 15 physicians and pharmacists who meet quarterly.
Pharmacy and Therapeutics Committee Management 33
32400_CH02_Pass2.qxd 10/11/08 11:39 AM Page 33
© Jones and Bartlett Publishers, LLC. NOT FOR SALE OR DISTRIBUTION.

Clinical pharmacists with the health plan or PBM conduct a review of available data andinformation, and prepare a drug monograph for distribution to members of the P & TCommittee that contains a recommendation for formulary inclusion or exclusion. Chap-ter 13 provides an in-depth discussion on P & T Committees.
The data and information reviewed by clinical pharmacists includes the following:
• Peer-reviewed published clinical efficacy and effectiveness studies• Safety and toxicity data• Published health outcomes and economic data• Data on file and economic models submitted by the pharmaceutical manufacturer
that is usually organized according to the Academy of Managed Care Pharmacy For-mat for Formulary Submissions17 (see also Chapter 11)
• Plan-specific expected utilization patterns• The positioning and impact on other formulary drugs• Manufacturer contracts
Due to concerns about drug safety and utilization patterns, a new drug is usually not for-mally reviewed for formulary consideration for at least three to six months after its launch.During that time, the drug may be available for reimbursement as a non-formulary or non-preferred drug, usually on the copayment Tier III. The Medicare Part D regulationsrequire that a drug be reviewed within 90 days, and a formulary decision must be madewithin 180 days. Medicare Part D regulations also require a separate Medicare P & TCommittee and members appropriate to evaluate drugs for the elderly. Many health plansshare members between commercial and Part D P & T Committees, and often hold theirmeetings sequentially.
Clinical data (efficacy, effectiveness, and safety) are the two primary formulary deci-sion criteria, but net cost ranks quite high as a decision consideration as well. Increasingly,credible health outcomes and economic data are available and considered by managedcare P & T Committees, and formulary decisions are becoming more based upon clinical,and economic outcomes, rather than solely on pharmacy budget cost minimization.Humanistic or quality of life outcomes remain less important for most drugs, but qualityof life data are used subjectively when appropriate and convincing. The Academy of Man-aged Care Pharmacy Format for Formulary Submissions17 has made a significant and posi-tive impact on improving the quality and quantity of data available for reviews, as well asthe ability of clinical pharmacists to review the body of existing data.
DRUG FORMULARY DEVELOPMENT AND MANAGEMENT
Health plans and PBMs have used drug formularies for the same reasons they are used inhospitals: to identify and promote the most cost-effective pharmaceuticals in the mostappropriate manner. A drug formulary is a preferred list of medications developed by thehealth plan or PBM P & T Committee to guide physician prescribing and pharmacy dis-
34 Chapter 2 Overview of Prescription Drug Benefits
32400_CH02_Pass2.qxd 10/11/08 11:39 AM Page 34
© Jones and Bartlett Publishers, LLC. NOT FOR SALE OR DISTRIBUTION.

pensing. Formularies are not novel but have been used for decades by hospitals, healthplans, and other healthcare institutions as a method of inventory control and to promotethe use of the most cost-effective products.19 Early formularies in the United States wereprimarily compilations of formulas and recipes used to prepare medicines. The first hospi-tal formulary, the Lititz Pharmacopoeia (1778), attempted to standardize compoundingand dispensing of medicines in military hospitals that were set up during the Revolution-ary War.19 A formulary system is the method and process used that continually updatesthe formulary’s content of prescription medications. The formulary system is a uniquelydynamic system that represents the current body of pharmaceutical knowledge and med-ical community practice standards resident in the healthcare setting it serves (see alsoChapter 9).
The benefit design is enforced through the formulary, which is the basis for the drugand reimbursement information used by the pharmacist to process eligible claims usingthe POS system. Formulary booklets are mailed to participating physicians and oftenabridged formulary documents are provided to members. However, paper documents areoften discarded, and many plans and PBMs provide pharmacy benefit and formularyinformation for physicians and members online. This allows for more frequent changes,and efficiency in communicating formulary matters to providers and members.
Some formularies are “open,” signifying that most drugs are eligible for reimbursementalthough the level of member copayment varies with formulary position. Some drugs are“on formulary” but available only if the patient satisfies certain prior authorization (PA)criteria. Drugs may be subject to a PA based upon cost or safety issues, to attempt to con-trol use for labeled indications only, or to limit use for certain types of patients.
Other formularies may be “closed,” indicating a select number of drugs are eligible forreimbursement, while others are not. Closed formularies do not allow for reimbursementof non-formulary products, and if one is prescribed, the pharmacist must contact the pre-scribing physician to request a change to a formulary product, or the patient must pay cashfor a non-formulary product. The open and closed nature of formularies is cyclical. Sincethe mid-1990s, formularies were often more open and inclusive, with non-preferred oreven non-formulary products covered on Tier III. However, due to rising costs and therecent development of Medicare formularies, many MCOs are returning to more restric-tive, closed formularies as well as including higher and tiered copayments.
Physician and member formulary conformance may be enforced using differentmechanisms depending upon if the formulary is inclusive or exclusive. Closed and openformularies both use a tiered copayment structure, described below, to encourage physi-cian prescribing and member use of generic or preferred formulary products. Some healthplans and PBMs use pharmacists to “academically detail” directly to physicians who con-tinuously disregard the formulary. Many health plans and PBMs provide physicians “for-mulary conformance report cards” and indicate opportunities for prescribing changes thatfavor formulary products. Some plans and PBMs offer financial incentives to physiciansfor high levels of formulary conformance.
Drug Formulary Development and Management 35
32400_CH02_Pass2.qxd 10/11/08 11:39 AM Page 35
© Jones and Bartlett Publishers, LLC. NOT FOR SALE OR DISTRIBUTION.
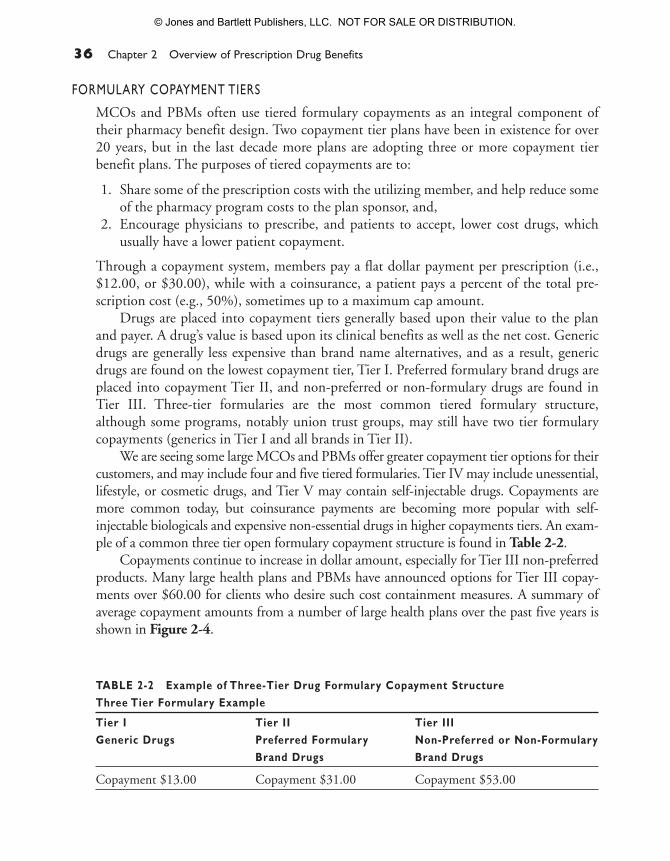
FORMULARY COPAYMENT TIERS
MCOs and PBMs often use tiered formulary copayments as an integral component oftheir pharmacy benefit design. Two copayment tier plans have been in existence for over20 years, but in the last decade more plans are adopting three or more copayment tierbenefit plans. The purposes of tiered copayments are to:
1. Share some of the prescription costs with the utilizing member, and help reduce someof the pharmacy program costs to the plan sponsor, and,
2. Encourage physicians to prescribe, and patients to accept, lower cost drugs, whichusually have a lower patient copayment.
Through a copayment system, members pay a flat dollar payment per prescription (i.e.,$12.00, or $30.00), while with a coinsurance, a patient pays a percent of the total pre-scription cost (e.g., 50%), sometimes up to a maximum cap amount.
Drugs are placed into copayment tiers generally based upon their value to the planand payer. A drug’s value is based upon its clinical benefits as well as the net cost. Genericdrugs are generally less expensive than brand name alternatives, and as a result, genericdrugs are found on the lowest copayment tier, Tier I. Preferred formulary brand drugs areplaced into copayment Tier II, and non-preferred or non-formulary drugs are found inTier III. Three-tier formularies are the most common tiered formulary structure,although some programs, notably union trust groups, may still have two tier formularycopayments (generics in Tier I and all brands in Tier II).
We are seeing some large MCOs and PBMs offer greater copayment tier options for theircustomers, and may include four and five tiered formularies. Tier IV may include unessential,lifestyle, or cosmetic drugs, and Tier V may contain self-injectable drugs. Copayments aremore common today, but coinsurance payments are becoming more popular with self-injectable biologicals and expensive non-essential drugs in higher copayments tiers. An exam-ple of a common three tier open formulary copayment structure is found in Table 2-2.
Copayments continue to increase in dollar amount, especially for Tier III non-preferredproducts. Many large health plans and PBMs have announced options for Tier III copay-ments over $60.00 for clients who desire such cost containment measures. A summary ofaverage copayment amounts from a number of large health plans over the past five years isshown in Figure 2-4.
36 Chapter 2 Overview of Prescription Drug Benefits
TABLE 2-2 Example of Three-Tier Drug Formulary Copayment StructureThree Tier Formulary Example
Tier I Tier II Tier IIIGeneric Drugs Preferred Formulary Non-Preferred or Non-Formulary
Brand Drugs Brand Drugs
Copayment $13.00 Copayment $31.00 Copayment $53.00
32400_CH02_Pass2.qxd 10/11/08 11:39 AM Page 36
© Jones and Bartlett Publishers, LLC. NOT FOR SALE OR DISTRIBUTION.

Examples of formularies and copayment tiers used to encourage the use of lowerpriced medications are found in Table 2-3. This table shows possible entries for thehydroxymethylglutaryl-coenzyme A (HMG Co-A) reductase inhibitor therapeutic cate-gory (e.g., statins), a high cost and high utilization category, for 2006 and for 2008(before and after simvastatin and pravastatin lose patent protection). The number of dol-lar signs ($) is a graphic indication of the relative price of the products within the thera-peutic category.
The 2006 statin formulary category includes one generic statin in Tier I, two pre-ferred formulary brand drugs in Tier II, and two non-preferred brand drugs in Tier III.The 2008 formulary includes three generic statins in Tier I, one high potency statin inTier II, and the two remaining non-preferred brand statins in Tier III. This copaymentstructure will encourage physicians to prescribe, and members to prefer, generic statinsfirst, and, if necessary, Lipitor® on Tier II, before the non-preferred Tier III statins.
The formulary position of a drug, and the resulting prescription copayment, can havea significant impact on the cost of the drug to a health plan and the member. Table 2-4illustrates the impact of a Tier II and Tier III copayment on the health plan payment to apharmacy as well as to the member. The WAC is a realistic price that approximates theactual acquisition cost of a drug. The AWP is an artificial calculated number, somewhatarchaic, which often remains used in pharmacy reimbursement calculations.
Drug Formulary Development and Management 37
$70
$60
$50
$40
$30
$20
$10
$02002 2003 2004 2005 2006 (est)
Tier I GenericTier II Preferred BrandTier III Non-Preferred Brand
FIGURE 2-4 Examples of Average Copayment Amounts for Various Tiers 2002–2006.Source: Average health plan copayments were compiled from a variety of research projects and personal communications with pharmacyand medical directors, 2002–2006.
32400_CH02_Pass2.qxd 10/11/08 11:39 AM Page 37
© Jones and Bartlett Publishers, LLC. NOT FOR SALE OR DISTRIBUTION.

38 Chapter 2 Overview of Prescription Drug Benefits
TABLE 2-3 Examples of potential HMG Co-A Reductase Inhibitor Therapeutic CategoryDrugs (Statins) in a Commercial Formulary in 2006 and 2008HMG Co-Reductase Inhibitor Formulary (single entity statins)—2006
Tier I Tier II Tier III
Type of Drugs Generic Preferred Formulary Non-Preferred or Brand Non-Formulary Brand
Drugs Included $ lovastatin $$$ Pravachol $$$$$ Crestor(pravastatin) (resuvastaton)
$$$ Lipitor $$$$$ Zocor(atorvastaton) (simvastatin)
Copayment Amount $12.00 $25.00 $45.00
HMG Co-Reductase Inhibitor Formulary (single entity statins)—2008
Tier I Tier II Tier III
Type of Drugs Generic Preferred Formulary Non-Preferred Brand Non-Formulary Brand
Drugs Included $ lovastatin $$$ Lipitor $$$$$ Crestor$ simvastatin (atorvastaton) (resuvastaton)$ pravastatin
Copayment Amount $18.00 $35.00 $65.00
Non-reimbursed drugs: Pravachol (brand of pravastatin) and Zocor (brand of simvastatin)
TABLE 2-4 Impact of a Tier II and Tier III Copayments on the Cost of a Drug to a HealthPlan and Member
Preferred Non-PreferredBrand BrandTier II Tier III
Wholesale Acquisition Cost (WAC) $80.00 $80.00Average Wholesale Price (AWP) $100.00 $100.00Drug Reimbursement (AWP—15%) $85.00 $85.00Dispensing Fee (+) $2.50 $2.50Subtotal $87.50 $87.50Member Tier II Copayment (–) $25.00 $45.00MCO Reimbursement to Pharmacy $62.50 $42.50
32400_CH02_Pass2.qxd 10/11/08 11:39 AM Page 38
© Jones and Bartlett Publishers, LLC. NOT FOR SALE OR DISTRIBUTION.

In this example, drugs with identical AWPs ($100.00) are put in Tier II and Tier III. InTier II, the patient pays a $25.00 prescription copayment, and the MCO payment to thepharmacy is $62.50. In the Tier III example, the patient pays a greater portion of the drugcost ($45.00 copayment), and as a result, the payment from the MCO to the pharmacy isless ($42.50). This illustrates how a health plan or PBM can reduce costs, which are passedon to the plan sponsor, by increasing the member copayment cost. When on Tier II, theMCO pays approximately 60% of the AWP to the pharmacy, whereas when on Tier III, theMCO pays approximately 40% of the AWP to the pharmacy, over a 30% savings, althoughthe patient must pay a copayment that is 180% of the Tier II copayment.
Generic drugs are one of the most important cost containment components of aneffective drug formulary. Members are well accepting of generics, and most often ask for ageneric drug. Generic drugs generally cost a fraction of the brand costs, and AB-ratedproducts (considered to be bioequivalent and generically substitutable), are increasing inimportance, as several high cost and high utilization drugs will soon lose their patent pro-tection. In addition to encouraging the use of generics through lower copayments, healthplans and PBMs also have a mandatory generic reimbursement program, often referred toas a MAC program.
Through a mandatory generic program, the generic form of drug is assigned a MAC,which is the upper level of pharmacy reimbursement by the MCO or PBM. This meansthat if a pharmacist dispenses a brand name equivalent to a drug with a MAC, the phar-macist will only be reimbursed at the MAC level, which approximates the acquisition costof the generic. This almost guarantees a generic drug will be dispensed if the drug is sub-ject to a MAC, unless the patient is willing to pay cash for the brand drug, or the physi-cian demands the brand drug through a “dispense as written” order. Pharmacists areadvised of drugs subject to a MAC as well as the MAC level of reimbursement throughthe POS pharmacy claims adjudication system.
Health plans and PBMs often develop their own proprietary MAC programs and listof drugs subject to a MAC, and the mechanism they use to establish a MAC level mayvary. However, in general, a product is assigned a MAC if there are three or more genericproducts available from reputable generic manufacturers, and the AAC is significantlylower than the AAC or WAC of brand drugs. The level of significance varies with differ-ent health plans and PBMs, but generally if the AAC of a generic product if more than50% less than the AAC or WAC of a brand drug, and the generic AAC has stabilized, aMAC will be assigned.
The use and impact of high tiered copayments on pharmacy program costs and pre-scription adherence are controversial topics. Certainly copayments can reduce the cost ofdrugs by 20% to 40% or more, depending upon the copayment amount. However, criticsof high dollar copayments claim the high copayment amounts are financial deterrents tomembers obtaining, and remaining on, prescribed drugs, and high copayments results inpoor adherence and failed outcomes. Such negative outcomes may occur, but critics must
Drug Formulary Development and Management 39
32400_CH02_Pass2.qxd 10/11/08 11:39 AM Page 39
© Jones and Bartlett Publishers, LLC. NOT FOR SALE OR DISTRIBUTION.

also realize that lack of adherence is caused by a number of other factors, such as lack ofmember understanding, forgetfulness, belief that mediations are unnecessary, adverseeffects or fear of adverse effects, and cultural barriers to medication use.20–23 Someemployer groups have adopted novel copayment structures, and have reduced the copay-ment for chronic medications for several high cost and high prevalence medical condi-tions, such as diabetes, asthma, hypercholesterolemia.24,25
PHARMACEUTICAL MANUFACTURERS’ REBATE CONTRACTS
Borrowed from hospitals and other industries, health plans sought—and received—afinancial incentive (rebate) to more favorably position contracted drug products. It isimportant to note that the price or rebate are not the most important drivers in formularypositioning; clinical efficacy and safety appropriately remain the most important decisioncriteria. However, in the absence of statistically and clinically significant differentiationamong similar drugs, the net cost (which may be reduced by a rebate) can have an impor-tant impact on ultimate formulary positioning. This is especially true in crowded, relativelyundifferentiated therapeutic categories, such as angiotensin converting enzyme (ACE)inhibitors, angiotensin II receptor blockers (ARBs), and proton pump inhibitors as well asexpensive, competitive categories with clinical product differentiation, such as antidepres-sants, statins, and inhaled corticosteroids. Rebates are also discussed in Chapter 15.
However, a rebate may make a drug more attractive by making it less expensive thancompetitors, and a rebate may result in a preferred formulary position if the clinical fea-tures and benefits of the rebated drug are somewhat similar to non-rebated, more expen-sive alternatives. The rebate savings obtained reduce the net price of contracted drugs,which in turn reduces the overall prescription drug program expenses. A reduced net pricewill result in a more favorable cost-effectiveness ratio, and may result in more positiveeconomic outcomes. These savings are passed on to plan sponsors through lower premi-ums (or, lower than would be without rebates) and to patients through a lower prescrip-tion copayment (rebated products are usually in Tier II, which has a lower prescriptioncopayment than Tier III).
The effect of rebates is similar to discounts. Health plans and PBMs that contractwith community pharmacies, and do not take possession of drug products, are usuallyoffered rebates. In contrast, health plans with in-house, owned pharmacies that take pos-session of drug products may qualify for a discount (often a wholesale chargeback). Thenet result is similar, although the administration and flow of money of rebates and dis-counts are dissimilar.
Rebates’ contract terms are varied and somewhat complex. However, in simplestterms, rebates provide health plans with incentives to position contracted products in afavorable position because rebates reduce the net cost of the product. The favorable for-mulary position helps pharmaceutical manufacturers, because physicians and membersgenerally prefer drugs with lower copayments, such as those found in Tier II. Rebate con-
40 Chapter 2 Overview of Prescription Drug Benefits
32400_CH02_Pass2.qxd 10/11/08 11:39 AM Page 40
© Jones and Bartlett Publishers, LLC. NOT FOR SALE OR DISTRIBUTION.

tracts often contain two components, an access rebate and a performance component.The flat, access rebate (the smaller of the two contract components) is offered for a Tier IIpreferred formulary status. The value of the access rebate may vary based upon the num-ber of competitive products sharing Tier II. For example, if a product has an exclusive TierII position, the access rebate may be higher, but if the product shares Tier II with one ormore other products, the access rebate may be lower. Traditionally with three-tier openformularies, rebates were not offered for Tier III positioning. However, with closed for-mularies, commonly seen in Medicare Part D, rebates are offered for Tier III status,because if a product is not covered on Tier I, II, or III, it is not reimbursed in a closed for-mulary. Thus, manufacturers pay for access to Tier III, which is preferable than theirproduct not being reimbursed at all.
The performance rebate component, greater than the access component, may bebased upon market share (in plan or national), volume growth, or other similar metric.Although a rebate contract may allow a health plan or PBM to include more than oneproduct on a formulary tier, there is a better chance of achieving performance tiers if thereare a limited number of products in a tier. There is a trend away from two componentcontracts (access and performance) to only a flat access rebate.
Rebates are additive, and highly variable based on the therapeutic category, numberof similar products, competitive nature of the category, and the clinical and safety differ-entiation among products. Frequently, the ceiling on total rebate income for a specificdrug will be capped at 15.1%, the “best price” limit required in Medicaid statutes (dis-cussed below). If this amount is exceeded in commercial plans, the pharmaceutical com-panies must provide the same amount to all Medicaid plans under contract. Products incrowded and undifferentiated therapeutic categories may be associated with total rebatepotential of 20% to 30% or more. Conversely, unique, highly differentiated productsmay have no rebate offered or a very low rebate (e.g., 5% total rebate). Products and cate-gories associated with no, or very low rebates include many unique injectable biologicalproducts, HIV/AIDS drugs, and atypical antipsychotics.
Health plans and PBMs are relatively transparent regarding sharing rebates with theirclients, although the exact terms of rebate contracts remains confidential. However, rebatesare generally passed on to clients, or used to reduce pharmacy program cost. An example ofhow a rebate may reduce the net cost of a contracted drug is shown in Table 2-5. In theillustration, the drugs of the same WAC have significantly different net costs based uponformulary tier, member copayment, and rebate (paid for Tier II positioning). As statedabove, WAC is a realistic price that approximates the actual acquisition cost of a drug.AWP is an artificial, calculated number that is often approximately 20% higher than theWAC, is somewhat archaic, but often remains used in pharmacy reimbursement calcula-tions. Rebate calculations are usually based on the WAC.
In this example, the net cost of two drugs with identical WACs is shown. The drugon the preferred Tier II position is associated with a 20% rebate off the WAC. The rebatevalue is $32.00, which results in a net cost $12.00 less than the Tier III product, despite
Pharmaceutical Manufacturers’ Rebate Contracts 41
32400_CH02_Pass2.qxd 10/11/08 11:39 AM Page 41
© Jones and Bartlett Publishers, LLC. NOT FOR SALE OR DISTRIBUTION.

the higher member copayment associated with the Tier III drug. Rebates will remain animportant cost containment strategy to manage the net cost of brand drugs.
Although the regulation is somewhat more complex, the primary impact of theOmnibus Budget Reconciliation Act of 1990 (OBRA ‘90) required pharmaceutical man-ufacturers to extend commercial drug rebates 15.1% or greater to State Medicaid pro-grams. As a result, the rebate on many drugs would not exceed this percentage, althoughin competitive therapeutic categories, rebates could reach the 20% to 45% range, which isextended to Medicaid programs. Additionally, some state Medicaid programs mandatepayment of a “supplementary rebate” to assist in reducing program costs. Other novelrebate contracts, including outcomes-based rebates, adherence-based rebates, and drugexpense guarantees are interesting, but often difficult to administer.
CLINICAL PHARMACY AND DISEASE MANAGEMENT SERVICES
Health plans and PBMs offer an array of clinical pharmacy services, many of which areonline and real-time edits provided to the dispensing pharmacist. Others include prospec-tive or retrospective utilization monitoring, adherence intervention, and disease manage-ment program support.
Online, real-time point-of-dispensing edits provide commonly used guidance regard-ing drug interactions, early refill prevention, duplicate medications, age and gender edits,and step-care edits. Health plans and PBMs also provide computerized drug use review(DUR), screening for drug misuse and abuse, polypharmacy, and non-adherence, andother dangerous or inappropriate drug use patterns. Interventions may include patient andor physician communications requesting clarification of the potential dangerous pattern.
42 Chapter 2 Overview of Prescription Drug Benefits
TABLE 2-5 Impact of Copayment and Rebate on Drug Net Cost to an MCO or PBM
Preferred Non-PreferredBrand BrandTier II Tier III
WAC $128.00 $128.00AWP $160.00 $160.00Drug Reimbursement (AWP – 15%) $108.80 $108.80Dispensing Fee (+) $2.50 $2.50Subtotal $111.30 $111.30Member Copayment (–) $25.00 $45.00MCO Reimbursement to Pharmacy $86.30 $66.30Rebate (15% of WAC) 20% 0%Rebate Amount (–) $32.00 $ 0.00Net MCO Cost $54.30 $66.30
32400_CH02_Pass2.qxd 10/11/08 11:39 AM Page 42
© Jones and Bartlett Publishers, LLC. NOT FOR SALE OR DISTRIBUTION.
Health plans may offer disease-specific management programs to augment healthcareservices provided by plan physicians that may include general disease education, diagnos-tic screening events, and case management. Most common diseases included in clinicalprograms include diabetes, asthma, cardiovascular disease (hypertension and lipid disor-ders), chronic obstructive pulmonary disease (COPD), congestive heart failure (CHF),and behavioral health. Disease management programs in managed care are addressed else-where in this book.
MCO pharmacy departments and PBMs often play a supportive role in health planand employer disease management programs. Pharmacy program drug utilization data areoften used to identify patients with poorly controlled medical conditions (identified bythe number and type of medications used) or have drug adherence problems (throughinconsistent prescription refills records). Pharmacy departments may obtain resource sup-port from pharmaceutical manufacturers that often provide unbranded disease manage-ment resources (e.g., physician or patient education materials or educational grants) tosupplement health plan efforts. Disease management offering from pharmaceutical man-ufacturers will not influence formulary decisions, and in fact the reverse influence exists.That is, health plans and MCOs may seek clinical program support from manufacturerswhose drugs have been previously selected for preferred formulary positions.
Clinical pharmacy programs are important in supporting health plan quality of careinitiatives, such as NCQA accreditation and improvement of NCQA HEDIS measures.This was previously discussed in the Pharmacy and Medical Claims Integration and Clin-ical Program Support section.
PHARMACY BENEFIT MANAGERS
Pharmacy benefit managers, such as Medco Health Solutions, CVS Caremark, ExpressScripts, Inc., Prime Therapeutics, MedImpact, WellPoint Pharmacy Management, andmany others, are stand-alone companies that specialize in all aspects of pharmacy benefitmanagement. They sell their services to private or public purchasers, including MCOs,self-insured employers, Medicaid programs, and Medicare Advantage Part D plans, as wellas directly to Medicare members, and other purchasers of pharmacy benefits. Table 2-6provides a list of the largest PBMs.
Pharmacy benefit managers have evolved as specialized experts in pharmacy benefit man-agement. Many large health plans, such as Aetna, Humana, CIGNA, and Coventry, managetheir pharmacy benefit programs through an internal “captive” PBM. Although many largeMCOs manage their pharmacy benefit through an internal pharmacy department, they mayuse a PBM for claims processing, pharmaceutical manufacturer contracting, and other “backend” commodity services. Other small MCOs, large self-insured employers, and state Medic-aid agencies may use a PBM for full-service, turn-key prescription drug benefits.
Although PBMs do not offer any services a health plan could not develop through aninternal pharmacy department, they manage many millions of lives, and offer economies
Pharmacy Benefit Managers 43
32400_CH02_Pass2.qxd 10/11/08 11:39 AM Page 43
© Jones and Bartlett Publishers, LLC. NOT FOR SALE OR DISTRIBUTION.

of scale to MCOs regarding computer services, patient call centers, contracting with phar-macies and with pharmaceutical manufacturers, and other services. The PBM may offersuch services less expensively than could be developed by an MCO.
The amount of PBM services purchased by MCOs, Medicaid plans, and self-insuredemployers depends entirely on the needs of the PBMs’ customer. Some of the offered ser-vices include the following:
• Pharmacy distribution network (community, mail, and possibly specialty products)• Drug formulary development and management• P & T Committee support services• Pharmaceutical manufacturer contracting• Physician and member communications• Member service help line support• Health plan pharmacy benefit Web site development and maintenance• Clinical pharmacy services (utilization review, adherence monitoring, clinical edit
development) and disease management program support• Claims processing and report generation
The PBM market is very competitive, and most large PBMs offer similar services. Deci-sions on PBM selection usually come down to aligned interests (e.g., cost containment,member services, and clinical programs), transparency, quality of service, and cost.
MEASURING PHARMACY BENEFIT MANAGEMENT PROGRAM PERFORMANCE
The competitive managed care environment requires that health plan and PBM pharmacyprograms are effectively managed to achieve desired clinical, economic, and quality of lifeobjectives. Health plans have been criticized for managing pharmacy costs separate frommedical costs, when the use of resources—and outcomes—of both may be inextricablylinked for many medical conditions. As discussed earlier, appropriate use of cost-effectivepharmaceuticals may result in higher pharmacy program costs, but may prevent use of moreexpensive medical resources, such as hospitalizations and emergency department visits.
44 Chapter 2 Overview of Prescription Drug Benefits
TABLE 2-6 Membership of Largest U.S. PBMs
Approximate Membership of the Largest U.S. PBMs
CVS Caremark 82 millionMedco Health Solutions 71Express Scripts, Inc. 51WellPoint Pharmacy Management 36MedImpact 21Prime Therapeutics 13
Source: Compiled by RP Navarro from PBM Web sites and marketing material, 2006–2007.
32400_CH02_Pass2.qxd 10/11/08 11:39 AM Page 44
© Jones and Bartlett Publishers, LLC. NOT FOR SALE OR DISTRIBUTION.

However, despite the awareness that the pharmacy program must be managed tooptimize the drug spend, the pharmacy director must focus on pharmacy program perfor-mance metrics as well. The pharmacy program director will monitor specific performancemetrics on a monthly basis and attempt to modify controllable factors if performancemeasures suggest costs are rising more than forecast, member satisfaction is declining,drug-related clinical outcomes are being achieved, or other markers of poor pharmacyprogram performance are indicated.
Some of the basic performance benchmarks monitored (monthly, quarterly, or annu-ally) will include the following financial and quality of care metrics:
• Total prescription program costs as well as costs and trends of selected therapeuticcategories and specific high cost and/or highly utilized drugs
• Monthly per-member-per-month (PMPM) and annual per-member-per-year (PMPY)program costs, PMPM and PMPY or high cost therapeutic categories, and cost trends
• Prescription utilization (PMPM and PMPY) overall and for selected highly utilizedtherapeutic categories
• Administrative and claims processing fees (overall and per prescription)• Prescription discount or rebate (total amount, per prescription, PMPM, and PMPY)• Generic dispensing rate (overall, by pharmacy, by group, by therapeutic class, and by
physician), and missed generic substitution opportunities• Drug formulary conformance rate (overall, by physician, and by pharmacy)• Patient satisfaction and member complaints related to the pharmacy program• Number of drug formulary prior authorization exception requests and approvals, and
review of authorization trend• NCQA HEDIS measure scores related to pharmacy (e.g., percent of post-myocardial
infarction patients receiving a beta blocker)• Trend of all the preceding performance measurements measured monthly, quarterly,
or annually.
There are many more performance measurements that pharmacy directors routinelymonitor, especially with more sophisticated programs that may include drug formularyconversion, compliance, and persistence activities. However, with the preceding basic per-formance measurements, a pharmacy director can evaluate the effectiveness of his or herprescription drug management program.
CONCLUSION
Pharmacy benefits are an important component in comprehensive healthcare benefits and,when optimized, can contribute to clinical, economic, and quality-of-life outcomes of benefitto plan sponsors as well as members. Purchasers of pharmacy benefits have many options forobtaining a customized pharmacy program, and must identify their objectives clearly to theirpharmacy benefit provider to make certain the benefit is appropriately designed. Primary
Conclusion 45
32400_CH02_Pass2.qxd 10/11/08 11:39 AM Page 45
© Jones and Bartlett Publishers, LLC. NOT FOR SALE OR DISTRIBUTION.

REFERENCES
1. National Health Care Expenditure Projections:2005–2015. Prescription Drug Expenditures(Table 11). Available at http://www.cms.hhs.gov/NationalHealthExpendData/downloads/proj2005.pdf. Accessed 30 May 2008.
2. Navarro R.P., personal communication withpharmacy and medical directors, 2005–2006.
3. National Council for Prescription Drug Pro-grams (NCPDP) homepage. Available at http://www.ncpdp.com. Accessed 30 May 2008.
4. NCQA homepage. Available at http://hprc.ncqa.org/. Accessed 30 May 2008.
5. NCQA HEDIS® homepage. Available at http://www.ncqa.org/tabid/59/Default.aspx. Accessed 30May 2008.
6. eHealth Initiative: Electronic prescribing: towardmaximum value and rapid adoption. Recommen-dations for optimal design and implementationto improve care, increase efficiency and reducecosts in ambulatory care. Available at http://ccbh.ehealthinitiative.org/communities/community.aspx?Section=97&Category=250&Document=269. 2004:11, 32 Accessed 30 May 2008.
7. Medical Expenditure Panel Survey (MEPS). From:Justification for Budget Estimates for Appropria-tions Committees, Fiscal Year 2003. February2002. Agency for Healthcare Research and Quality,Rockville, MD. Available at http://www.ahrq.gov/about/cj2003/meps03.htm. Accessed 9 July 2008.
8. Institute for Safe Medication Practices. A Call toAction: Eliminate Hand-Written PrescriptionsWithin 3 Years. Available at http://www.ismp.org/msaarticles/whitepaper.html, 2000. Accessed30 May 2008.
9. RxHub homepage. Available at http://www.rxhub.net. Accessed 30 May 2008.
10. U.S. Department of Labor in the 21st century.Health Plans & Benefits. Employee RetirementIncome Security Act—ERISA. Available at http://www.dol.gov/dol/topic/health-plans/erisa.htm. Ac-cessed 30 May 2008.
11. “States Consider Encouraging Increased Use ofHSAs,” California Healthline, 13 February 2006.Available at http://www.californiahealthline.org/articles/2006/2/13/States-Consider-Encouraging-Increased-Use-of-HSAs.aspx?topicID=37. Accessed30 May 2008.
12. The Consumer Driven Health Care Institutehomepage. Available at http://www.cdhci.org/.Accessed 30 May 2008.
13. National Association of Chain Drug Stores.Available at http://www.nacds.org/user-assets/PDF_files/2004results.PDF. Accessed 2 June 2006.
14. “Minnesota Blues Injectable Drug Cost July2003–June 2004,” Specialty Pharmacy News, Jan-uary 2006, 3(1): p. 11.
15. National Association of Boards of Pharmacy. Veri-fied Information and Verification Pharmacy Prac-tice Sites™ (VIPPS®). Available at http://www.nabp.net/. Accessed 30 May 2008.
16. American Academy of Family Physicians (AAFP).Available at http://www.aafp.org/online/en/home/publications/news/news-now/practice-management/20080306getconnected.html. Accessed 30 May2008.
17. Academy of Managed Care Pharmacy (AMCP).Professional Resources. AMCP Format for Formu-lary Submissions, Version 2.1. Available at http://www.amcp.org/amcp.ark?c=pr&sc=link. Accessed30 May 2008.
46 Chapter 2 Overview of Prescription Drug Benefits
future challenges will be control of expensive biologicals, and implementing a successfulconsumer-driver healthcare benefit, such as through a health savings account.
Pharmacy directors see increased use of generics and higher member copayments astwo important methods to help contain costs. However, the pharmacy benefit must beintegrated in the broad medical benefit to demonstrate the contribution of appropriatelyused, cost-effective pharmaceuticals.
32400_CH02_Pass2.qxd 10/11/08 11:39 AM Page 46
© Jones and Bartlett Publishers, LLC. NOT FOR SALE OR DISTRIBUTION.

18. Goldberg R.B., Managing the pharmacy benefit:the formulary system, J Managed Care Pharmacy.1997; 3(5): 565–573.
19. King N.M., Pharmacopoeias and Formularies: ASelection of Primary Sources for the History ofPharmacy in the United States. Madison, WI:American Institute of the History of Pharmacy;1985, p. 9–11.
20. Rector T.S., Finch M.D., Danzon P.M., et al.,Effect of tiered prescription copayments on theuse of preferred brand medications. Medical Care.2003; 41(3): 398–406.
21. Sokol M.C., McGuigan K.A., Verbrugge R.R.,Epstein R.S., Impact of medication adherence onhospitalization risk and healthcare cost. MedicalCare. 2005; 43(6): 521–530.
22. Landsman P.B., Yu W., Liu X., Teutsch S.M.,Berger M.L., Impact of 3-tier pharmacy benefitdesign and increased consumer cost-sharing on
drug utilization. Am J Manag Care. 2005; 11(10):621–628.
23. Gibson T.B., Ozminkowsk R.J., Goetzel R.Z.The effects of prescription drug cost sharing: areview of the evidence. Am J Manag Care. 2005;11(11): 730–740.
24. The Rand Corporation news releases. Cuttingdrug copayments for sicker patients can cut hos-pitalizations and save money. 11 January 2006.Available at http://www.rand.org/news/press.06/01.11.html. Accessed 30 May 2008.
25. “Total Value/Total Return(TM) Tells the PitneyBowes Experience: Healthier Employees Trans-late into a Healthier Bottom Line,” PRNewswire,17 April 2006. Available at http://media.prnewswire.com/en/jsp/tradeshows/events.jsp?option=tradeshow&beat=BEAT_ALL&eventid=1001951&view=LATEST&resourceid=3187226. Accessed30 May 2008.
References 47
32400_CH02_Pass2.qxd 10/11/08 11:39 AM Page 47
© Jones and Bartlett Publishers, LLC. NOT FOR SALE OR DISTRIBUTION.

32400_CH02_Pass2.qxd 10/11/08 11:39 AM Page 48
© Jones and Bartlett Publishers, LLC. NOT FOR SALE OR DISTRIBUTION.

AAC actual acquisition price
ACE angiotensin converting enzyme
ARB angiotensin receptor blocker
ASP average selling price
AWP average wholesale price (drug)
CAP competitive acquisition program
CDH consumer-driver healthcare
CHF congestive heart failure
CMS Centers for Medicare and Medicare Services
COBRA Consolidated Omnibus Budget Reconciliation Act
COPD chronic obstructive pulmonary disease
DUR drug use review
ERISA Employee Retirement Income Security Act of 1974
FDA Food and Drug Administration
GERD gastroesophageal disease
HEDIS Health Plan Employer Data and Information Set
HIPAA Health Insurance Portability and Accountability Act
HSAs health spending accounts
MAC maximum allowable cost
MCOs managed care organizations
ACRONYMS
2-1
49
Appendix
32400_CH02_Pass2.qxd 10/11/08 11:39 AM Page 49
© Jones and Bartlett Publishers, LLC. NOT FOR SALE OR DISTRIBUTION.

MTM medication therapy management
NACDS National Association of Chain Drug Stores
NABP National Association of Boards of Pharmacy
NCPDP National Council for Prescription Drug Programs
NCQA National Commission for Quality Assurance
OBRA ’90 Omnibus Budget Reconciliation Act of 1990
OTC over-the-counter (drugs)
PA prior authorization
PBMs pharmacy benefit managers
PMPM per-member-per-month
PMPY per-member-per-year
POS point-of-service (pharmacy)
P & T Pharmacy & Therapeutics (Committee)
SPD specialty pharmacy distributor
VIPPS Verified Internet Pharmacy Practice Sites™
WAC wholesale acquisition cost
50 Chapter 2 Overview of Prescription Drug Benefits
32400_CH02_Pass2.qxd 10/11/08 11:39 AM Page 50
© Jones and Bartlett Publishers, LLC. NOT FOR SALE OR DISTRIBUTION.