Embed Size (px)
Citation preview
104 Chapter 3 Proportions and Variation
STATE STANDARDS
MA.7.A.1.4
S
Slope3.2
How can you compare two rates graphically?
Work with a partner. The table shows the maximum speeds of several animals.
a. Find the missing speeds. Round your answers to the nearest tenth.
b. Which animal is fastest? Which animal is slowest?
c. Explain how you convert between the two units of speed.
ACTIVITY: Comparing Unit Rates11
AnimalSpeed
(miles per hour)Speed
(feet per second)
Antelope 61.0
Black Mamba Snake 29.3
Cheetah 102.6
Chicken 13.2
Coyote 43.0
Domestic Pig 16.0
Elephant 36.6
Elk 66.0
Giant Tortoise 0.2
Giraffe 32.0
Gray Fox 61.6
Greyhound 39.4
Grizzly Bear 44.0
Human 41.0
Hyena 40.0
Jackal 35.0
Lion 73.3
Peregrine Falcon 200.0
Quarter Horse 47.5
Spider 1.76
Squirrel 12.0
Thomson’s Gazelle 50.0
Three-Toed Sloth 0.2
Tuna 47.0
ke
Section 3.2 Slope 105
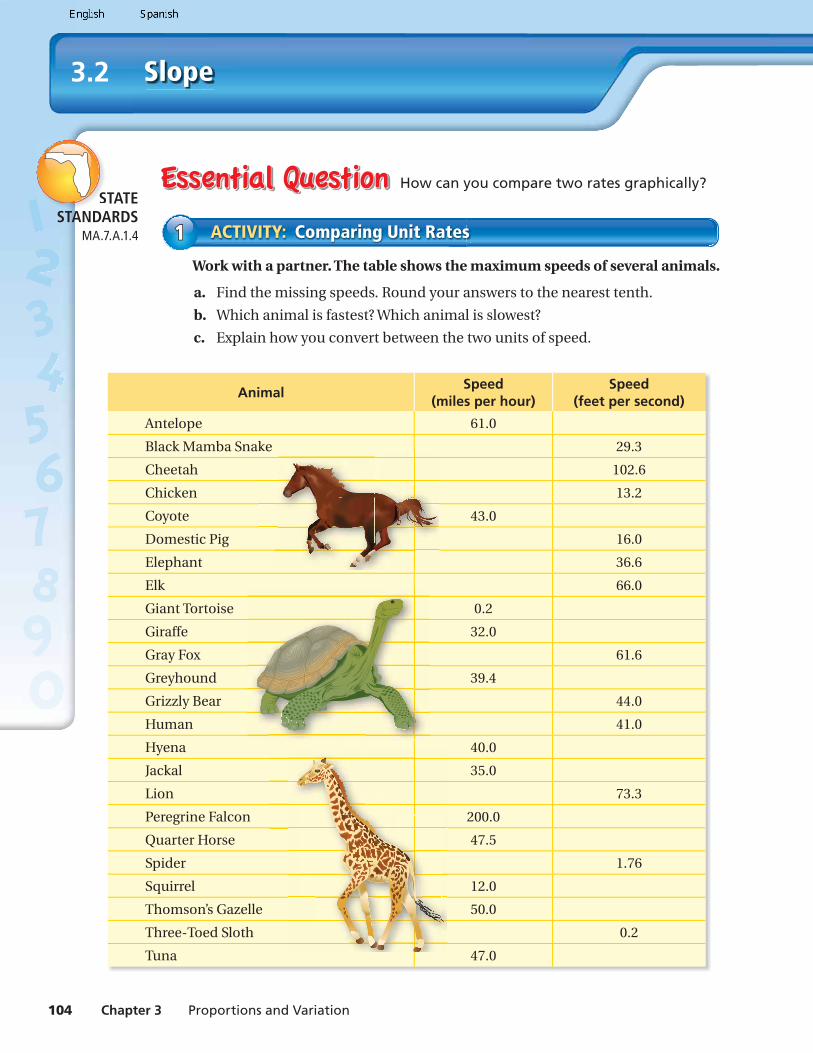
Work with a partner. A cheetah and a Thomson’s gazelle are running at constant speeds.
a. Find the missing distances.
Cheetah Gazelle
Time (seconds) Distance (feet) Distance (feet)
0 0 0
1 102.6
2
3
4
5
6
7
b. Use the table to complete the line graph for each animal.
00
100
200
300
400
500
600
700
1 2
Time (seconds)
Dis
tan
ce (
feet
)
3 4 5 6 7 x
y
c. Which graph is steeper? The speed of which animal is greater?
ACTIVITY: Comparing Two Rates Graphically22
3. IN YOUR OWN WORDS How can you compare two rates graphically? Explain your reasoning. Give some examples with your answer.
4. Choose 10 animals from Activity 1.
a. Make a table for each animal similar to the table in Activity 2.
b. Sketch a graph of the distances for each animal.
c. Compare the steepness of the 10 graphs. What can you conclude?
106 Chapter 3 Proportions and Variation
Lesson3.2
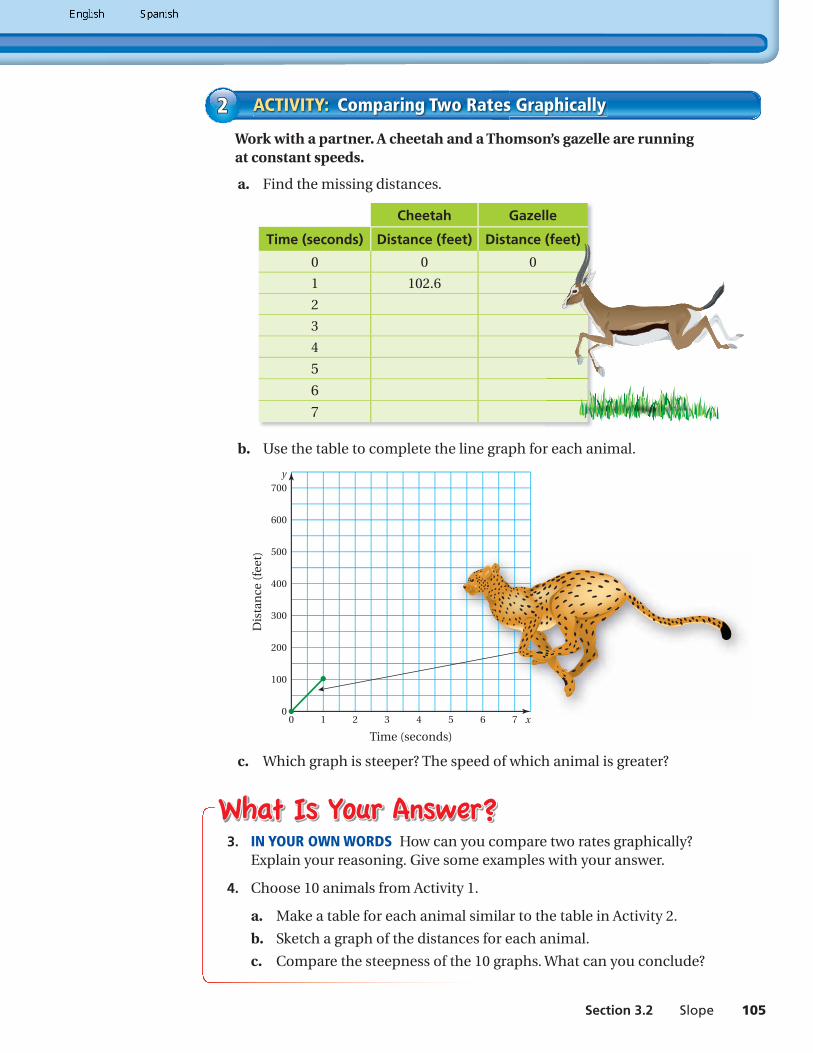
Key Vocabularyslope, p. 106
Slope
Slope is the rate of change between any
x
y
1 2 3 4 5 6 7
1
2
3
4
5
6
7
Slope =
3
2 32
two points on a line. It is a measure of the steepness of a line.
To fi nd the slope of a line, fi nd the ratio of the change in y (vertical change) to the change in x (horizontal change).
slope = change in y
— change in x
Find the slope of each line.
a.
x
y
43 5
(0, 0)
(3, 4)
3
4
5
2
3
4
b.
x
y
2
−2
3
4
1 2 3
(−2, −1)
(4, 2)
3
6
slope = change in y
— change in x
slope = change in y
— change in x
= 4
— 3
= 3
— 6
= 1
— 2
The slope of the line is 4
— 3
. The slope of the line is 1
— 2
.
Find the slope of the line.
1.
x
y
1
2
3
4
3 4 5−1
−2
(0, 0)
(5, 2)
2.
x
y
1 2 3 4 5
2
4
6
8
10
(1, 3)
(2, 6)
EXAMPLE Finding Slopes11
Exercises 4 – 9
Lesson Tutorials
Section 3.2 Slope 107
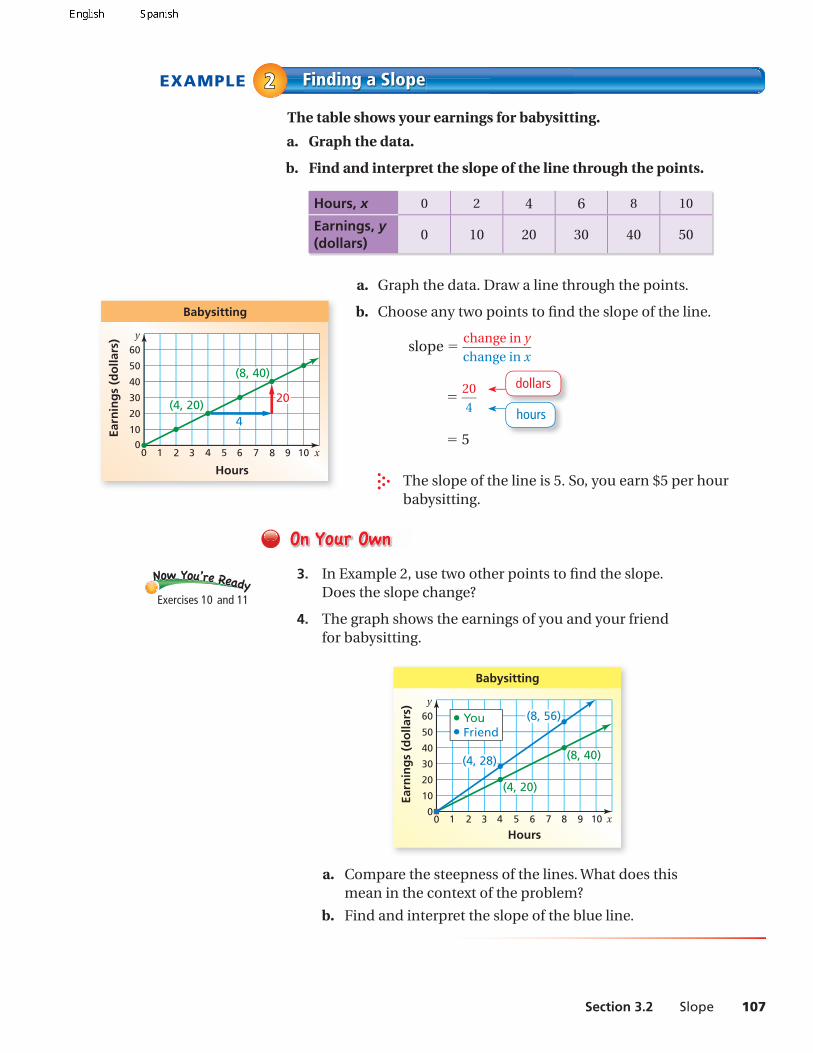
The table shows your earnings for babysitting.
a. Graph the data.
b. Find and interpret the slope of the line through the points.
Hours, x 0 2 4 6 8 10
Earnings, y (dollars)
0 10 20 30 40 50
a. Graph the data. Draw a line through the points.
b. Choose any two points to fi nd the slope of the line.
slope = change in y
— change in x
= 20
— 4
= 5
The slope of the line is 5. So, you earn $5 per hour babysitting.
3. In Example 2, use two other points to fi nd the slope. Does the slope change?
4. The graph shows the earnings of you and your friend for babysitting.
x
y
10
20
30
40
50
60
2 4 6 8 10
Earn
ing
s (d
olla
rs)
Hours
Babysitting
YouFriend
(4, 28)
(8, 56)
(4, 20)
(8, 40)
1 3 5 7 90
0
a. Compare the steepness of the lines. What does this mean in the context of the problem?
b. Find and interpret the slope of the blue line.
EXAMPLE Finding a Slope22
dollars
hours
Exercises 10 and 11
x
y
10
20
30
40
50
60
2 4 6 8 10
Earn
ing
s (d
olla
rs)
Hours
Babysitting
(8, 40)
(4, 20)4
20
1 3 5 7 900
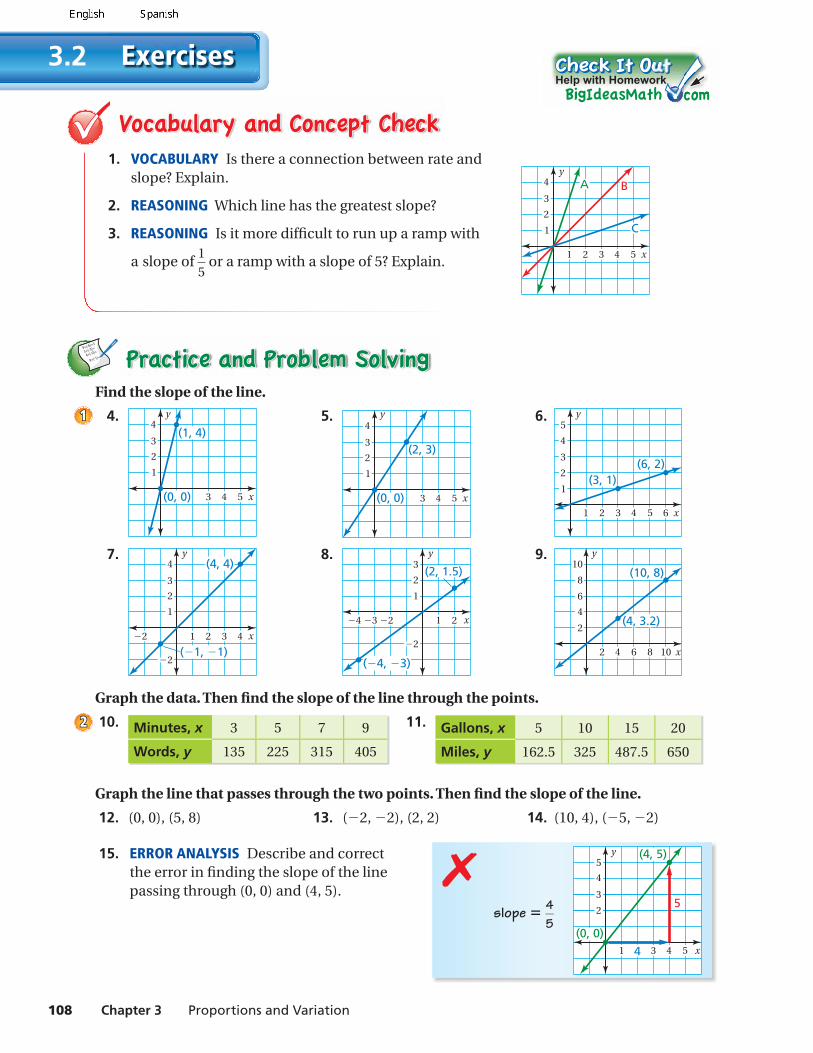
Exercises3.2
108 Chapter 3 Proportions and Variation
1. VOCABULARY Is there a connection between rate and slope? Explain.
2. REASONING Which line has the greatest slope?
x
y
1
2
3
4
1 2 3 4 5
A B
C 3. REASONING Is it more diffi cult to run up a ramp with
a slope of 1
— 5
or a ramp with a slope of 5? Explain.
9+(-6)=3
3+(-3)=
4+(-9)=
9+(-1)=
Find the slope of the line.
4.
x
y
3 4
4
3
2
1
5
(1, 4)
(0, 0)
5.
x
y
3 4
4
3
2
1
5
(2, 3)
(0, 0)
6.
x
y
3
4
2
1
4321 5 6
5
(3, 1)(6, 2)
7.
x
y
3
4
2
1
−2
4321−2
(4, 4)
(−1, −1)
8.
x
y3
2
1
21−2−3−4
(2, 1.5)
(−4, −3)
−2
9.
x
y
2
2 4 6 8 10
4
6
8
10
(4, 3.2)
(10, 8)
Graph the data. Then fi nd the slope of the line through the points.
10. Minutes, x 3 5 7 9
Words, y 135 225 315 405
11. Gallons, x 5 10 15 20
Miles, y 162.5 325 487.5 650
Graph the line that passes through the two points. Then fi nd the slope of the line.
12. (0, 0), (5, 8) 13. (−2, −2), (2, 2) 14. (10, 4), (−5, −2)
15. ERROR ANALYSIS Describe and correct the error in fi nding the slope of the line passing through (0, 0) and (4, 5).
11
22
slope = 4 — 5
✗
x
y
431 5
2
35
4
4
5(4, 5)
(0, 0)
Help with Homework
Section 3.2 Slope 109
Copy and complete the statement using <, >, or =.
20. 9
— 2
8
— 3
21. − 8
— 15
10
— 18
22. −6
— 24
−2
— 8
Multiply.
23. − 3
— 5
× 8
— 6
24. 1 1
— 2
× ( − 6
— 15
) 25. − 2 1
— 4
× − 1 1
— 3
26. MULTIPLE CHOICE You have 18 stamps from Mexico in your stamp collection.
These stamps are 3
— 8
of your collection. The rest of the stamps are from the
United States. How many stamps are from the United States?
○A 12 ○B 24 ○C 30 ○D 48
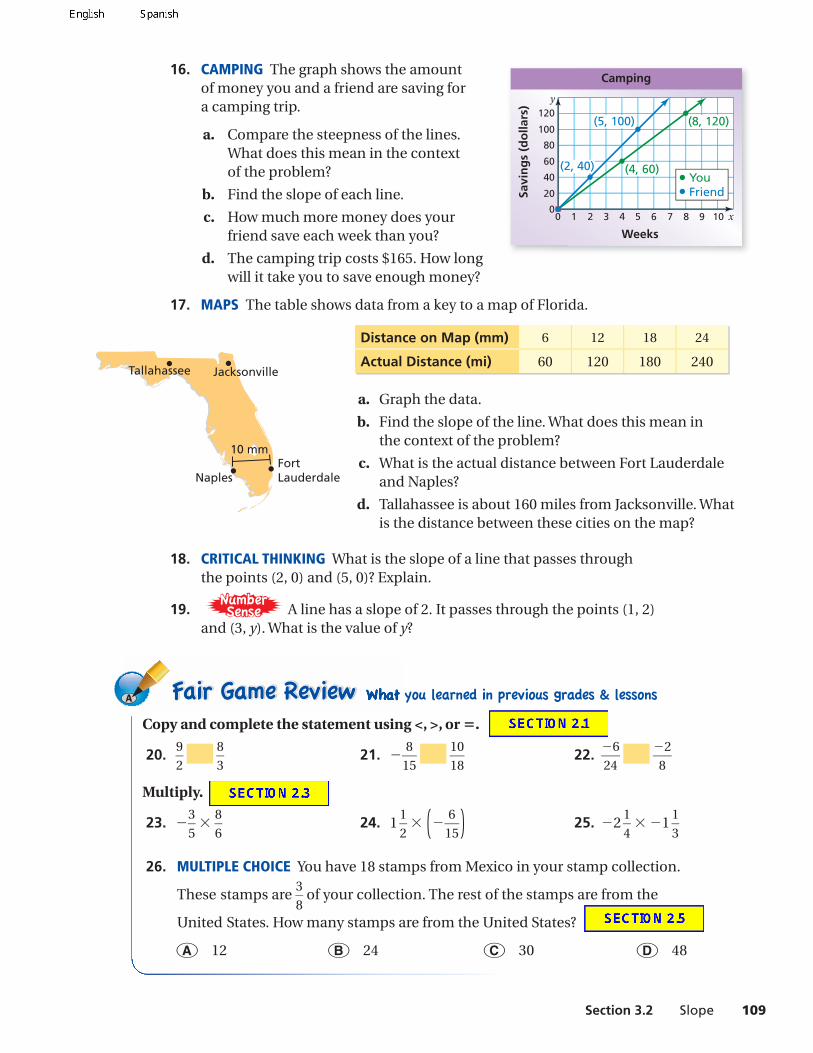
16. CAMPING The graph shows the amount
x
y
2 4 6 8 10
Savi
ng
s (d
olla
rs)
Weeks
Camping
40
80
120(5, 100)
(2, 40) (4, 60)
(8, 120)
20
60
100
1 3 5 7 90
0
YouFriend
of money you and a friend are saving for a camping trip.
a. Compare the steepness of the lines. What does this mean in the context of the problem?
b. Find the slope of each line.
c. How much more money does your friend save each week than you?
d. The camping trip costs $165. How long will it take you to save enough money?
17. MAPS The table shows data from a key to a map of Florida.
Distance on Map (mm) 6 12 18 24
Actual Distance (mi) 60 120 180 240
a. Graph the data.
b. Find the slope of the line. What does this mean in the context of the problem?
c. What is the actual distance between Fort Lauderdale and Naples?
d. Tallahassee is about 160 miles from Jacksonville. What is the distance between these cities on the map?
18. CRITICAL THINKING What is the slope of a line that passes through the points (2, 0) and (5, 0)? Explain.
19. A line has a slope of 2. It passes through the points (1, 2) and (3, y). What is the value of y?
JacksonvilleTallahassee
NaplesFortLauderdale
10 mm