Embed Size (px)
Citation preview
Chapter 3—Environmental Analysis, Impacts, and Mitigation Section 3.11—Noise and Vibration
Metro Gold Line Foothill Extension—Azusa to Montclair Draft Environmental Impact Report 3.11-1 August 2012
3.11 NOISE AND VIBRATION
This section examines potential noise and vibration impacts of the project. The analysis addresses existing conditions, predicts noise and vibration levels during operation, and evaluates measures to minimize potential significant noise and vibration impacts.
The project limits for the impact assessment extend from Citrus Avenue border of the City of Glendora to Central Avenue in the City of Montclair.
The noise and vibration analysis considers a “worst case” scenario for potential project impacts based on the train maximum design speeds of up to 65 miles per hour. Trains operating at high speeds would result in high predicted noise and vibration levels, while trains operating at lower speeds would result in lower predicted noise and vibration levels.
3.11.1 Background on Noise
Noise is typically defined as unwanted or undesirable sound, where sound is characterized by small air pressure fluctuations above and below the atmospheric pressure. The basic parameters of environmental noise that affect human response to sound are:
• Intensity or level
• Frequency content
• Variation with time
Intensity is determined by how greatly the sound pressure fluctuates above and below the atmospheric pressure, and is expressed on a logarithmic scale in units of decibels (dB). By using this scale, the range of normally encountered sound can be expressed by values between 0 and 120 dB. In addition, the dB scale corresponds to how humans perceive sound loudness. On a relative basis, a 3-dB change in sound level generally represents a noticeable change in loudness, whereas a 10-dB change is typically perceived as a doubling (or halving) in the loudness of a sound.
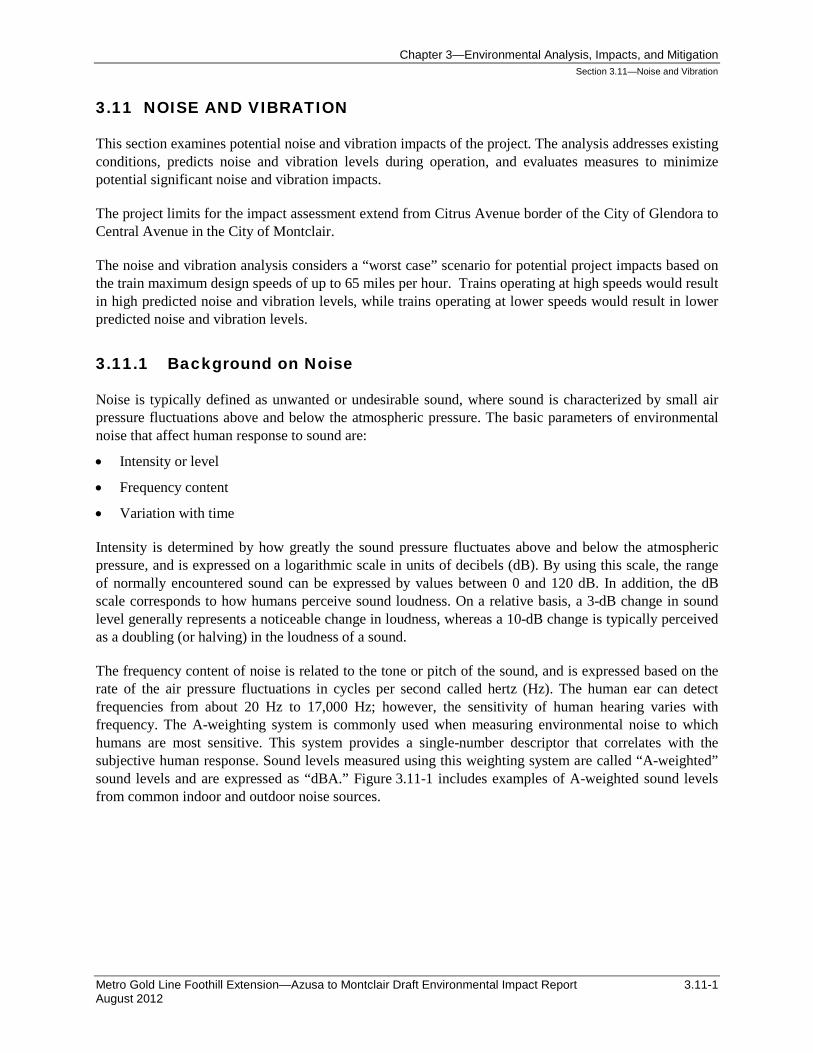
The frequency content of noise is related to the tone or pitch of the sound, and is expressed based on the rate of the air pressure fluctuations in cycles per second called hertz (Hz). The human ear can detect frequencies from about 20 Hz to 17,000 Hz; however, the sensitivity of human hearing varies with frequency. The A-weighting system is commonly used when measuring environmental noise to which humans are most sensitive. This system provides a single-number descriptor that correlates with the subjective human response. Sound levels measured using this weighting system are called “A-weighted” sound levels and are expressed as “dBA.” Figure 3.11-1 includes examples of A-weighted sound levels from common indoor and outdoor noise sources.

Chapter 3—Environmental Analysis, Impacts, and Mitigation Section 3.11—Noise and Vibration
3.11-2 Metro Gold Line Foothill Extension—Azusa to Montclair Draft Environmental Impact Report August 2012
Source: FTA 2006
Figure 3.11-1. Sound Levels of Typical Indoor and Outdoor Sources
Chapter 3—Environmental Analysis, Impacts, and Mitigation Section 3.11—Noise and Vibration
Metro Gold Line Foothill Extension—Azusa to Montclair Draft Environmental Impact Report 3.11-3 August 2012
Environmental sound constantly fluctuates. The metrics used in this report to characterize varying sound environments are:
• Maximum Sound Level (Lmax) is the maximum sound level that occurs during an event such as a train passing. Lmax is the maximum sound level using the slow setting on a standard sound level meter.
• Equivalent Sound Level (Leq) is the most common means of characterizing fluctuating community noise. Leq represents a constant sound that, over a specified period of time, has the same sound energy as the time-varying sound. Leq is used by the Federal Transit Administration (FTA) to evaluate noise effects at institutional land uses—such as schools, churches, and libraries—from proposed transit projects.
• Day-Night Sound Level (Ldn) is a 24-hour Leq with an adjustment to reflect the greater sensitivity to nighttime noise experienced of most people. The adjustment is a 10 dB penalty for all sound that occurs between the hours of 10:00 p.m. to 7:00 a.m., which means that any event occurring during the nighttime is equivalent to 10 occurrences of the same event during the daytime. Ldn is the most common measure of total community noise over a 24-hour period and is used by the FTA to evaluate residential noise effects from proposed transit projects.
• Percent Exceedance Level (LXX) is the sound level that is exceeded for a certain percentage of the measurement period (e.g., L99 is the sound level exceeded during 99 percent of the measurement period). For a 1-hour period, L99 is the sound level exceeded for all except 36 seconds of the hour. L1 represents typical maximum sound levels, L33 is approximately equal to Leq when free-flowing traffic is the dominant noise source, L50 is the median sound level, and L99 is close to the minimum sound level.
• Sound Exposure Level (SEL) is a measure of the acoustic energy of an event such as a train passing. The acoustic energy of the event is compressed into a 1-second period. SEL increases as the sound level of the event increases and as the duration of the event increases. It is often used as an intermediate value in calculating overall metrics such as Leq and Ldn.
3.11.2 Background on Vibration
Groundborne vibration travels from the train through the soil and may cause perceptible shaking or vibration inside buildings. Groundborne vibration can be measured in terms of displacement, velocity, or acceleration. Velocity is the preferred measure for evaluating groundborne vibration from transit projects because it is typically considered to correspond best with human sensitivity to vibration. In this report, groundborne vibration is expressed in terms of the root-mean-square (rms) vibration velocity level in decibels (VdB). The abbreviation VdB is used in place of dB to avoid confusing vibration decibels with sound decibels.
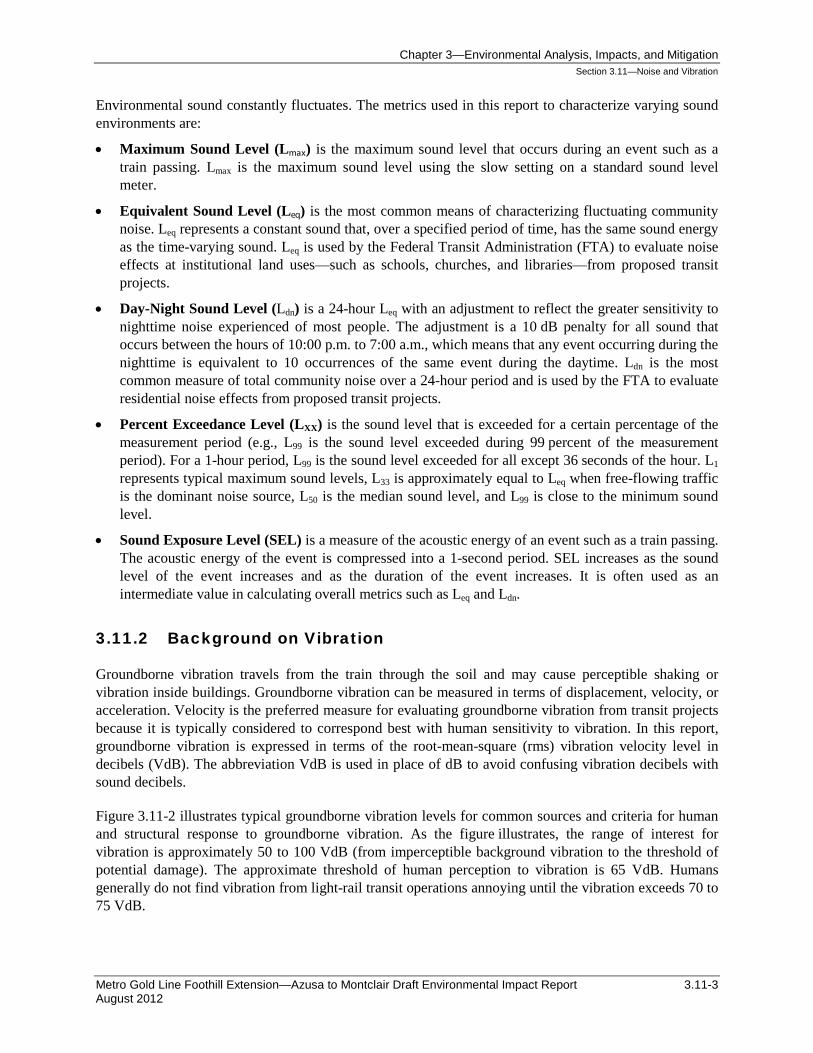
Figure 3.11-2 illustrates typical groundborne vibration levels for common sources and criteria for human and structural response to groundborne vibration. As the figure illustrates, the range of interest for vibration is approximately 50 to 100 VdB (from imperceptible background vibration to the threshold of potential damage). The approximate threshold of human perception to vibration is 65 VdB. Humans generally do not find vibration from light-rail transit operations annoying until the vibration exceeds 70 to 75 VdB.

Chapter 3—Environmental Analysis, Impacts, and Mitigation Section 3.11—Noise and Vibration
3.11-4 Metro Gold Line Foothill Extension—Azusa to Montclair Draft Environmental Impact Report August 2012
Source: FTA 2006
Figure 3.11-2. Typical Groundborne Vibration Levels and Criteria

Chapter 3—Environmental Analysis, Impacts, and Mitigation Section 3.11—Noise and Vibration
Metro Gold Line Foothill Extension—Azusa to Montclair Draft Environmental Impact Report 3.11-5 August 2012
3.11.3 Noise and Vibration Sources Associated with Light-Rail Transit Systems
The following noise and vibration sources have been evaluated:
• Light-Rail Vehicle Operations—This is the normal noise from the operation of light-rail vehicles. It includes noise from steel wheels rolling on steel rails (wheel/rail noise) and from propulsion motors, air-conditioning, and other auxiliary equipment on the vehicles. As expected, the wheel/rail noise increases with speed. At speeds greater than 20 to 30 mph, the wheel/rail noise usually dominates noise from the vehicle auxiliary equipment. Train operations also create groundborne vibration that may be intrusive to occupants of buildings when the tracks are approximately 100 feet or closer to buildings. However, the vibration from light-rail transit (LRT) operations is almost never sufficient to cause minor cosmetic damage to buildings.
• Traffic Noise—The project would result in changes in traffic patterns and volumes near the proposed stations and at-grade crossings. In all cases, the forecasted change in traffic volume is insufficient to cause more than a 1 dB change in sound levels; therefore, a detailed assessment of noise impacts from traffic noise has not been performed.
• Audible Warnings—Audible warnings are required by the California Public Utilities Commission at all gate-protected at-grade LRT/roadway crossings. The required audible warnings are ringing bells that are located on the masts of the crossing gates and the sounding of horns located on the lead vehicle of the trains.
• Special Trackwork—Turnouts and crossovers require special trackwork where two rails cross. The special fixture used where two rails cross is referred to as a “frog.” Standard frogs have gaps, and the train wheels must “jump” across the gap. The wheels striking the ends of the gap increase noise levels near the ”frog” by approximately 6 dB and increase groundborne vibration levels by approximately 10 VdB.
• Ancillary Equipment—Traction power supply substations (TPSS) are the only ancillary equipment associated with the project that could create noise impacts. The ventilation fans provided at each substation would be the dominant noise source of most TPSS units.
• BNSF and Metrolink Operations—The tracks for the Burlington Northern Santa Fe Railway (BNSF) and Metrolink trains operating in the project right-of-way would be relocated within the existing right-of-way to accommodate the light-rail tracks. In some cases, the tracks would be relocated closer to residences, which would increase noise and vibration levels at those locations. The noise and vibration from BNSF and Metrolink operations, including the wheel/rail noise, groundborne vibration, and noise from audible warnings, is included in the noise and vibration assessments.
• Construction Noise and Vibration—All the sources discussed previously are associated with operation of the project. Similar to any other major transportation infrastructure project, construction would require use of heavy equipment that generates relatively high noise and vibration levels.
Chapter 3—Environmental Analysis, Impacts, and Mitigation Section 3.11—Noise and Vibration
3.11-6 Metro Gold Line Foothill Extension—Azusa to Montclair Draft Environmental Impact Report August 2012
3.11.4 Regulatory Setting
The Federal Transit Authority (FTA) established specific noise and vibration criteria for light-rail transit; therefore, these criteria and analytical methodologies are applied. The analysis follows the procedures and criteria in the FTA’s Transit Noise and Vibration Impact Assessment, also referred to as the FTA Guidance Manual (FTA 2006).
3.11.5 Existing Conditions
3.11.5.1 Noise Measurements The existing noise test procedures follow the detailed noise analysis procedure described in the FTA Guidance Manual. Noise-sensitive land uses in the first row of buildings along the project alignment were identified within a screening distance of 250 feet based on preliminary alignment drawings, aerial photographs, and visual surveys. Areas adjacent to the project alignment include single- and multi-family residences, non-residential (commercial) uses, and institutional land uses. The adjacent areas are exposed to noise from traffic on local streets, freight trains, and, east of the La Verne Station, Metrolink commuter trains.
Existing ambient noise levels were characterized through measurements at a total of 25 sites along the alignment. The measurements consisted of long-term (24-hour) and short-term (1-hour) monitoring of the A-weighted sound levels at representative noise-sensitive locations. These measurements were conducted at 15 sites along the proposed alignment in 2003. Further measurements were carried out at 10 sites in February and March of 2011 with the dual purpose of identifying whether there have been any changes to the noise environment since 2003 and gathering data in areas that were not included in the 2003 measurement program.
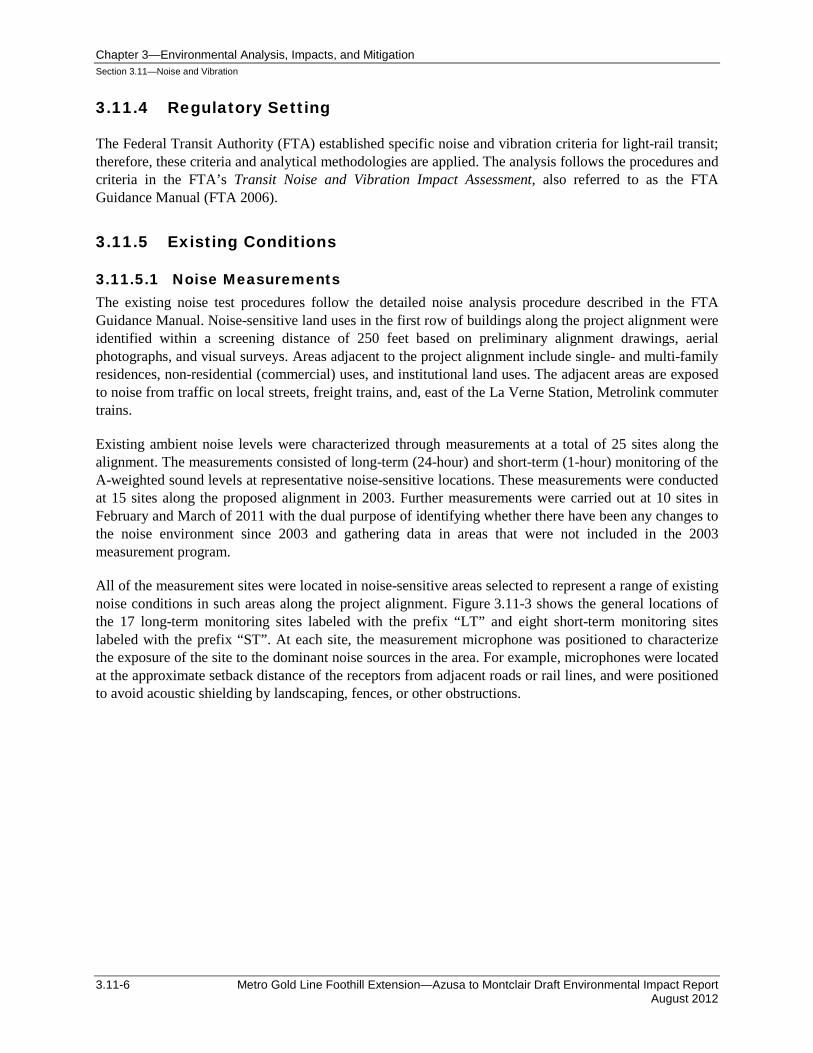
All of the measurement sites were located in noise-sensitive areas selected to represent a range of existing noise conditions in such areas along the project alignment. Figure 3.11-3 shows the general locations of the 17 long-term monitoring sites labeled with the prefix “LT” and eight short-term monitoring sites labeled with the prefix “ST”. At each site, the measurement microphone was positioned to characterize the exposure of the site to the dominant noise sources in the area. For example, microphones were located at the approximate setback distance of the receptors from adjacent roads or rail lines, and were positioned to avoid acoustic shielding by landscaping, fences, or other obstructions.
Chapter 3—Environmental Analysis, Impacts, and Mitigation Section 3.11—Noise and Vibration
Metro Gold Line Foothill Extension—Azusa to Montclair Draft Environmental Impact Report 3.11-7 August 2012
Source: ATS Consulting 2011
Figure 3.11-3. Locations of Long-Term (LT) and Short-Term (ST) Noise Measurements

Chapter 3—Environmental Analysis, Impacts, and Mitigation Section 3.11—Noise and Vibration
3.11-8 Metro Gold Line Foothill Extension—Azusa to Montclair Draft Environmental Impact Report August 2012
3.11.5.2 City of Glendora Existing ambient noise levels in Glendora were characterized through seven 24-hour noise measurements at residential sites and four one-hour measurements at institutional sites. The dominant existing noise levels in the area were traffic from local roads and two daily BNSF freight trains traversing the area. The results for measurement sites in the City of Glendora are presented in Table 3.11-1. As shown, the Ldn for residences in the City of Glendora ranges from 55 to 60 dBA.
Table 3.11-1. City of Glendora—Existing Noise Levels
Site Number
Measurement Location Description
Start of Measurement Measurement Time (hours)
Noise Exposure Ldn
(dBA) Date Time LT-8 167 Lowell Avenue 10/7/03 11:00 24 55 LT-9 Presbyterian Hospital 10/7/03 15:00 24 58
LT-10 948 Lemon Avenue 10/7/03 13:00 24 55 LT-11 655 Remuda Drive 10/7/03 13:00 24 60 LT-21 166 Marcile Avenue 2/23/11 11:00 24 55 LT-22 520 Lemon Avenue 2/22/11 12:00 24 56 LT-23 1544 Compromise Line Road 3/2/11 15:00 24 58
Short-Term Measurements
Noise Exposure Leq
(dBA) ST-5 Calvary Lutheran Church 10/9/03 16:43 1 51 ST-6 Foothill Christian Preschool 10/9/03 15:32 1 52 ST-9 Calvary Lutheran Church 3/2/211 10:17 1 50 ST-10 Foothill Christian Preschool 3/2/11 12:10 1 50
Source: ATS Consulting 2011 Note: “Time” category is represented using the 24-hour clock.

Chapter 3—Environmental Analysis, Impacts, and Mitigation Section 3.11—Noise and Vibration
Metro Gold Line Foothill Extension—Azusa to Montclair Draft Environmental Impact Report 3.11-9 August 2012
3.11.5.3 City of San Dimas Existing ambient noise levels were characterized through three 24-hour noise measurements at residential sites and two one-hour measurements at institutional sites that were identified as sensitive receptors in the City of San Dimas. The dominant existing noise levels in the area were traffic from local roads and highways, plus two daily BNSF freight trains through the area. The measured Ldn at residences in the City of San Dimas ranged from 60 to 65 dBA. The results for measurement sites are presented in Table 3.11-2.
Table 3.11-2. City of San Dimas—Existing Noise Levels
Site Number
Measurement Location Description
Start of Measurement Measurement Time (hours)
Noise Exposure, Ldn (dBA) Date Time
LT-12 The Lakes at Raintree Village Apartments
10/7/03 15:00 24 60
LT-13 Sunnyside Senior Apartments 10/8/03 12:00 24 65 LT-24 566 Pearlanna Drive 2/28/11 15:30 24 64
Short-Term Measurements
Noise Exposure Leq (dBA)
ST-7 Pioneer Park 10/9/03 16:23 1 56 ST-11 Pioneer Park 3/1/11 14:43 1 58
Source: ATS Consulting 2011 Note: “Time” category is represented using the 24-hour clock.
3.11.5.4 City of La Verne Existing ambient noise levels in the City of La Verne were characterized through two 24-hour noise measurements at residential sites which were the sensitive receptors identified in the City of La Verne. The dominant existing noise levels in the area were traffic from local roads and Arrow Highway, plus two daily BNSF freight trains through the area. The noise measurement details and results are shown in Table 3.11-3.
Table 3.11-3. City of La Verne—Existing Noise Levels
Site Number
Measurement Location Description
Start of Measurement Measurement Time (hours)
Noise Exposure Ldn (dBA) Date Time
LT-14 1638 1st Street 10/8/03 14:00 24 65 LT-25 1736 1st Street 3/2/11 14:00 24 64
Source: ATS Consulting 2011 Note: “Time” category is represented using the 24-hour clock.
Chapter 3—Environmental Analysis, Impacts, and Mitigation Section 3.11—Noise and Vibration
3.11-10 Metro Gold Line Foothill Extension—Azusa to Montclair Draft Environmental Impact Report August 2012
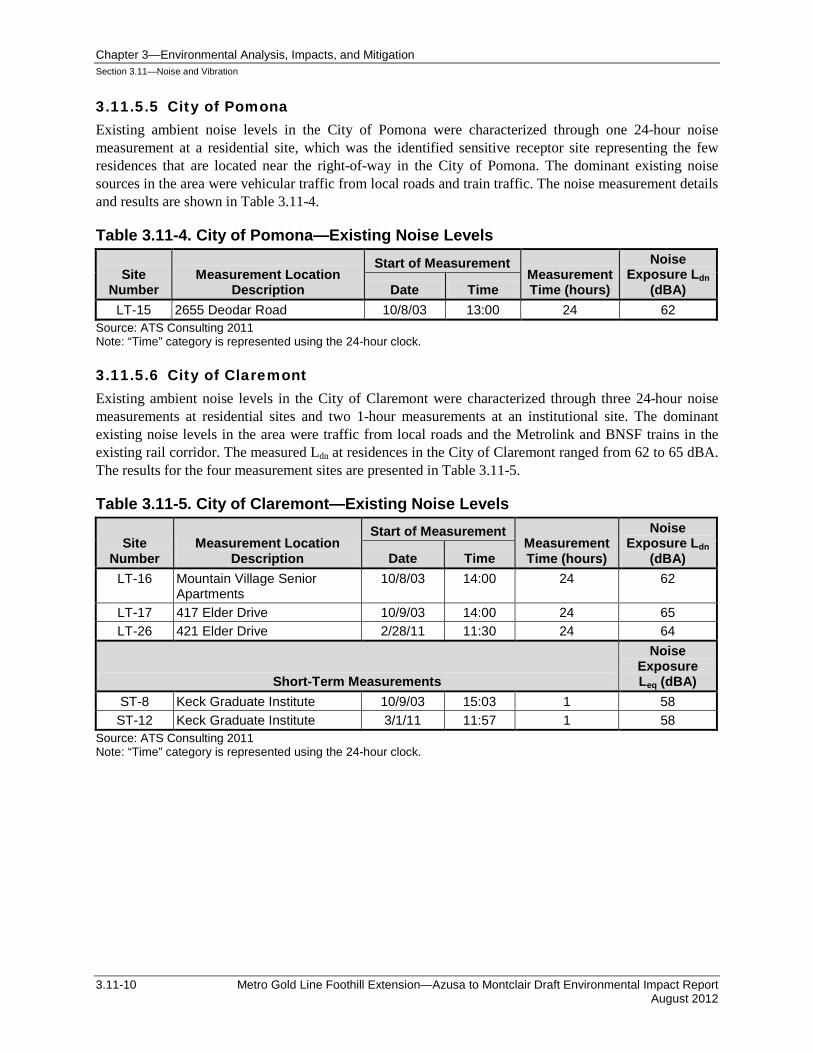
3.11.5.5 City of Pomona Existing ambient noise levels in the City of Pomona were characterized through one 24-hour noise measurement at a residential site, which was the identified sensitive receptor site representing the few residences that are located near the right-of-way in the City of Pomona. The dominant existing noise sources in the area were vehicular traffic from local roads and train traffic. The noise measurement details and results are shown in Table 3.11-4.
Table 3.11-4. City of Pomona—Existing Noise Levels
Site Number
Measurement Location Description
Start of Measurement Measurement Time (hours)
Noise Exposure Ldn
(dBA) Date Time LT-15 2655 Deodar Road 10/8/03 13:00 24 62
Source: ATS Consulting 2011 Note: “Time” category is represented using the 24-hour clock.
3.11.5.6 City of Claremont Existing ambient noise levels in the City of Claremont were characterized through three 24-hour noise measurements at residential sites and two 1-hour measurements at an institutional site. The dominant existing noise levels in the area were traffic from local roads and the Metrolink and BNSF trains in the existing rail corridor. The measured Ldn at residences in the City of Claremont ranged from 62 to 65 dBA. The results for the four measurement sites are presented in Table 3.11-5.
Table 3.11-5. City of Claremont—Existing Noise Levels
Site Number
Measurement Location Description
Start of Measurement Measurement Time (hours)
Noise Exposure Ldn
(dBA) Date Time LT-16 Mountain Village Senior
Apartments 10/8/03 14:00 24 62
LT-17 417 Elder Drive 10/9/03 14:00 24 65 LT-26 421 Elder Drive 2/28/11 11:30 24 64
Short-Term Measurements
Noise Exposure Leq (dBA)
ST-8 Keck Graduate Institute 10/9/03 15:03 1 58 ST-12 Keck Graduate Institute 3/1/11 11:57 1 58
Source: ATS Consulting 2011 Note: “Time” category is represented using the 24-hour clock.

Chapter 3—Environmental Analysis, Impacts, and Mitigation Section 3.11—Noise and Vibration
Metro Gold Line Foothill Extension—Azusa to Montclair Draft Environmental Impact Report 3.11-11 August 2012
3.11.5.7 City of Montclair Existing ambient noise levels in the City of Montclair were characterized through one 24-hour noise measurement at Montclair Metrolink Station Park-n-Ride site, which is not a sensitive receptor. No sensitive receptors were identified in this segment of the project alignment. The dominant existing noise levels in the area were traffic from local roads and the Metrolink and BNSF trains in the existing rail corridor. The noise measurement details and results are shown in Table 3.11-6.
Table 3.11-6. City of Montclair—Existing Noise Levels
Site Number
Measurement Location Description
Start of Measurement Measurement Time (hours)
Noise Exposure Ldn
(dBA) Date Time LT-18 Montclair Park-n-Ride 10/9/03 14:00 24 63
Source: ATS Consulting 2011 Note: “Time” category is represented using the 24-hour clock.
3.11.6 Environmental Impacts
3.11.6.1 Evaluation Methodology
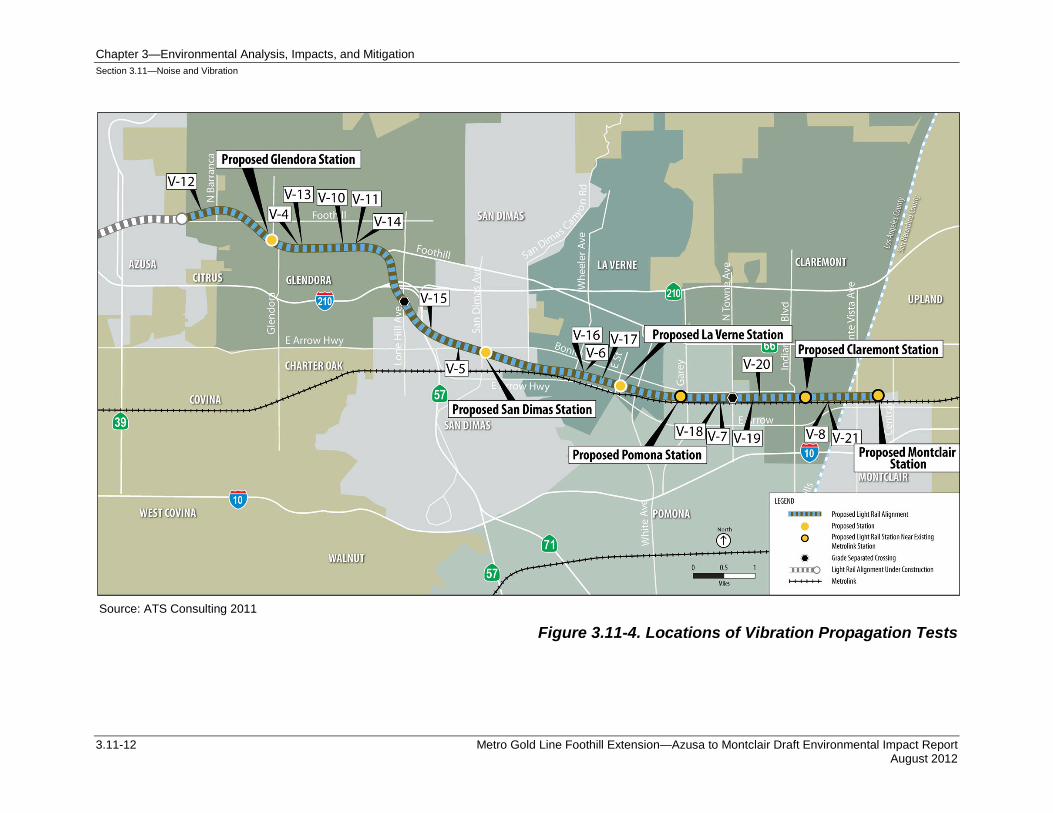
Vibration Propagation Measurement Procedures Vibration propagation tests were performed to determine how vibration would propagate or travel from the tracks through the soil to vibration-sensitive receptors. The tests followed the detailed assessment approach recommended in the FTA Guidance Manual. The test characterizes how vibration travels through the soil by imparting vibration into the ground using a drop hammer as a vibration input force and measuring the input force and measuring the corresponding ground vibration response at several distances. The vibration propagation tests were performed at 20 locations, as shown in Figure 3.11-4.
Existing vibration sources along the project alignment are freight trains and, east of the La Verne Station, Metrolink trains. Vehicular traffic does not generally cause perceptible vibration, and if it does, the source can be traced usually to potholes, wide expansion joints, or other “bumps” in the roadway surface. The FTA Guidance Manual does not require measurements of existing vibration levels from traffic. At-grade crossings may generate noise and vibration from vehicles traveling along the “rumble strip” used at the transition of the tracks and the roadway surface. The noise and vibration levels from the addition of an at-grade crossing would not significantly increase the overall noise and vibration of the existing traffic.
Because of the infrequency of service, measurements of existing vibration levels from freight trains west of where the Metrolink and Gold Line alignments join (just past the La Verne Station) are not required for the vibration assessment. East of the La Verne Station, Metrolink operates approximately 36 daily trips within or close to the project right-of-way. The existing vibration levels from the Metrolink and freight service east of La Verne Station were characterized through a measurement conducted in Claremont and are included in Section 3.11.5.6.
Chapter 3—Environmental Analysis, Impacts, and Mitigation Section 3.11—Noise and Vibration
3.11-12 Metro Gold Line Foothill Extension—Azusa to Montclair Draft Environmental Impact Report August 2012
Source: ATS Consulting 2011
Figure 3.11-4. Locations of Vibration Propagation Tests
Chapter 3—Environmental Analysis, Impacts, and Mitigation Section 3.11—Noise and Vibration
Metro Gold Line Foothill Extension—Azusa to Montclair Draft Environmental Impact Report 3.11-13 August 2012
Analytic Methodology Data used in the analysis were taken from various sources, including the FHWA guidance manual, FHWA Roadway Construction Noise Model User’s Guide (FHWA 2006), noise and vibration studies prepared for other LRT projects, and previous environmental studies prepared for the project.
Separate models are used to predict noise from light-rail vehicle operation, audible warnings at at-grade crossings, ancillary equipment, BNSF and Metrolink operation, and construction noise.
The predictions of groundborne vibration follow the Detailed Vibration Assessment procedure of the FTA Guidance Manual. This method is based on testing vibration characteristics in the project corridor and measurements of light-rail vehicles.
The first step of the noise and vibration analyses was identifying sensitive receptors. Then, the sensitive receptors are grouped into clusters based on their location relative to the tracks and on other operational factors that affect noise and vibration levels, such as train speed. There are usually several dwelling units within each cluster. A noise and vibration prediction is made for each cluster based on the distance from the closest sensitive receptor in the cluster to the project. The predicted noise and vibration levels for these clusters are presented in the following sections. The predicted levels include: noise from light-rail trains running on both the eastbound and westbound tracks; noise from the BNSF trains and their horns at-grade crossings for the proposed relocated track positions; and, in Claremont, noise from the Metrolink trains and horns for the proposed relocated track positions.
The clusters used for assessment are addressed for each city and are labeled numerically in ascending order from west to east. Clusters north of the right-of-way are considered westbound (WB) clusters – as they are closer to the westbound tracks – and clusters south of the right-of-way are considered eastbound (EB) clusters.
3.11.6.2 Impact Criteria Noise and vibration impacts are considered significant if the project would result in:
• Exposure of persons to or generation of noise levels in excess of standards established in the local general plan or noise ordinance, or applicable standards of other agencies
• Exposure of persons to or generation of excessive groundborne vibration or groundborne noise levels
• A substantial permanent increase in ambient noise levels in the project vicinity above levels existing without the project
• A substantial temporary or periodic increase in ambient noise levels in the project vicinity above levels existing without the project
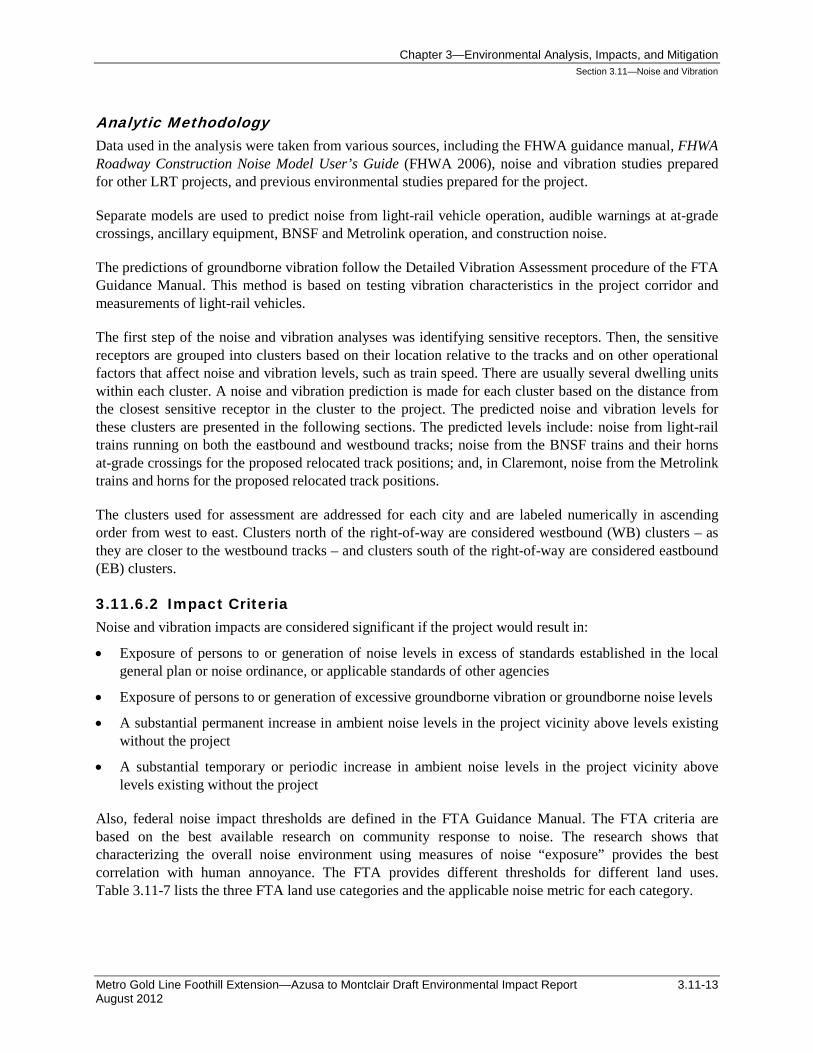
Also, federal noise impact thresholds are defined in the FTA Guidance Manual. The FTA criteria are based on the best available research on community response to noise. The research shows that characterizing the overall noise environment using measures of noise “exposure” provides the best correlation with human annoyance. The FTA provides different thresholds for different land uses. Table 3.11-7 lists the three FTA land use categories and the applicable noise metric for each category.
Chapter 3—Environmental Analysis, Impacts, and Mitigation Section 3.11—Noise and Vibration
3.11-14 Metro Gold Line Foothill Extension—Azusa to Montclair Draft Environmental Impact Report August 2012
Table 3.11-7. FTA Land Use Categories and Noise Metrics
Land Use Category
Noise Metric (dBA) Description of Land Use Category
1 Outdoor Leq(h)1
Tracts of land where a quiet environment is an essential element of their intended purpose. This category includes lands set aside for serenity and quiet and such land uses as outdoor amphitheaters and concert pavilions, as well as National Historic Landmarks with significant outdoor use. Also included are recording studios and concert halls.
2 Outdoor Ldn Residences and buildings where people normally sleep. This category includes homes, hospitals, and hotels where a nighttime sensitivity to noise is assumed to be of utmost importance.
3 Outdoor Leq(h)1
Institutional land uses with primarily daytime and evening use. This category includes schools, libraries, and churches, where it is important to avoid interference with such activities as speech, meditation, and concentration on reading material. Places for meditation or study associated with cemeteries, monuments, museums, campgrounds and recreational facilities can be considered to be in this category. Certain historical sites and parks are also included.
Source: FTA 2006 1 Leq for the noisiest hour of transit related activity during hours of noise sensitivity.
For Category 2 land uses (residential areas where people sleep), the noise exposure is characterized using Ldn. In calculating Ldn, noise created during the nighttime hours is more heavily weighted than daytime noise to reflect residents’ greater sensitivity to noise during these hours. For Category 1 and Category 3 land uses (areas with primarily daytime use), noise exposure is characterized using the 1-hour Leq, which is a time-averaged sound level over a 1-hour period.
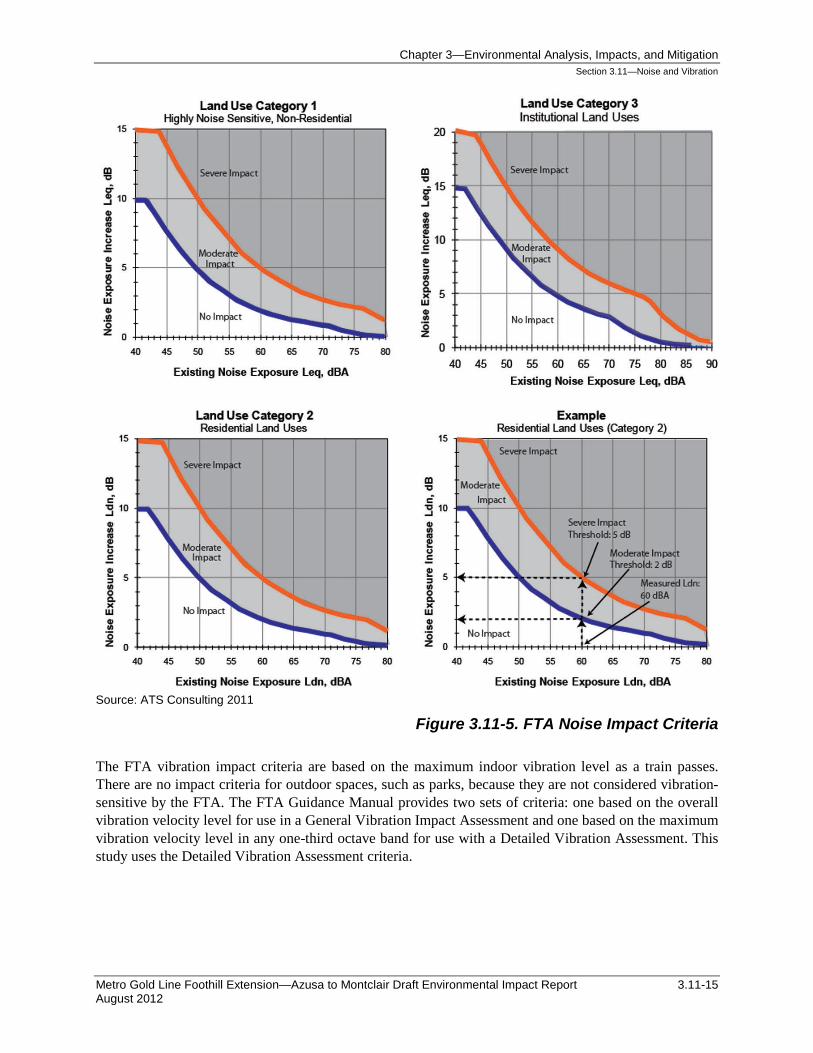
The FTA noise impact threshold is a sliding scale based on the existing noise exposure. Noise exposure characterizes noise levels over a period of time. The basic concept of the FTA impact thresholds is that more project noise exposure is allowed in areas where existing noise exposure is higher, but the allowable increase above the existing noise exposure decreases in areas where existing noise exposure is higher. The criteria are shown graphically in Figure 3.11-5 for the three land use categories, along with an example of how the criteria are applied. The top two graphs show the Category 1 and 3 thresholds (for non-residential land uses) where Leq is used. The bottom left graph shows Category 2 thresholds (residential land uses) where Ldn is used.
The curves in Figure 3.11-5 are defined in terms of the increase of cumulative noise over the existing noise. The cumulative noise is the combination of the existing noise and noise introduced into the area from the project. The allowable noise increase accounts for both the noise introduced from the light-rail operations and the change in noise exposure from relocating the BNSF or Metrolink tracks within the right-of-way.
The FTA defines two levels of impact: Moderate and Severe. The lower curve in Figure 3.11-5 (shown in blue) defines the threshold for a Moderate Impact, and the upper curve (shown in red) defines the threshold for Severe Impact. FTA guidance is to consider mitigation if the predicted increase in noise exposure exceeds the moderate threshold. If the predicted increase exceeds the severe threshold, FTA guidance is to include noise mitigation in the project unless there are compelling reasons why mitigation is not feasible. Both of these levels are considered significant impacts in this EIR.
Chapter 3—Environmental Analysis, Impacts, and Mitigation Section 3.11—Noise and Vibration
Metro Gold Line Foothill Extension—Azusa to Montclair Draft Environmental Impact Report 3.11-15 August 2012
Source: ATS Consulting 2011
Figure 3.11-5. FTA Noise Impact Criteria
The FTA vibration impact criteria are based on the maximum indoor vibration level as a train passes. There are no impact criteria for outdoor spaces, such as parks, because they are not considered vibration-sensitive by the FTA. The FTA Guidance Manual provides two sets of criteria: one based on the overall vibration velocity level for use in a General Vibration Impact Assessment and one based on the maximum vibration velocity level in any one-third octave band for use with a Detailed Vibration Assessment. This study uses the Detailed Vibration Assessment criteria.

Chapter 3—Environmental Analysis, Impacts, and Mitigation Section 3.11—Noise and Vibration
3.11-16 Metro Gold Line Foothill Extension—Azusa to Montclair Draft Environmental Impact Report August 2012
The thresholds for use with the Detailed Vibration Assessments are shown in Figure 3.11-6. The one-third octave band spectra of the predicted vibration are compared to the curves shown in Figure 3.11-6 to determine whether there is impact and the frequency range over which vibration mitigation is required. A one-third octave band is a range of frequencies. A prediction of vibration level is made for each one-third octave band, rather than for each frequency. Each one-third octave band is referred to by the center frequency in that band. Impact occurs when the predicted vibration velocity in any one-third octave band exceeds the applicable curve. Predicting vibration on a one-third octave band basis allows vibration mitigation to be designed for the frequency range in which it will be most effective. The VC-A through VC-E curves are used to specify acceptable vibration limits for sensitive equipment, such as electron microscopes.
Source: FTA 2006
Figure 3.11-6. FTA Thresholds for a Detailed Vibration Assessment
The “Residential (Night)” curve is applied to residential land uses in this study. When this curve is used, impact occurs when the predicted vibration velocity (shown on the vertical axis) exceeds 72 VdB in at least one one-third octave band (shown on the horizontal axis) between eight and 80 Hz. The use of the criteria is illustrated by the example vibration levels (the dashed blue line) shown in Figure 3.11-6. The maximum example level exceeds the “Residential (Night)” curve in the 50 and 63 Hz one-third octave bands. For this example, impact would be predicted for residential land uses and vibration mitigation would be evaluated.

Chapter 3—Environmental Analysis, Impacts, and Mitigation Section 3.11—Noise and Vibration
Metro Gold Line Foothill Extension—Azusa to Montclair Draft Environmental Impact Report 3.11-17 August 2012
The FTA vibration thresholds do not specifically account for existing vibration because it is rare that even substantial volumes of vehicular traffic, including trucks and buses, generate perceptible ground vibration unless there are irregularities in the roadway surface, such as potholes or wide expansion joints. However, it is necessary to take into account existing conditions because the project would be located in an existing rail corridor.
The project would share the right-of-way with BNSF freight traffic from Glendora through Pomona. In Claremont, the light-rail system would share the corridor with BNSF freight traffic and Metrolink (commuter rail) traffic. To accommodate two new light-rail tracks, the existing BNSF and Metrolink tracks would be relocated within the existing right-of-way. In some instances, the tracks would be relocated closer to residences, resulting in an increase in vibration levels. FTA guidance for assessing vibration impact from a relocation of existing tracks is:
• A new impact will be assessed only if the predicted vibration from the relocated tracks exceeds the FTA vibration criteria and if the relocation results in more than a three VdB increase in the vibration level.
• The criteria are meant for rail transit systems and should be applied with caution to freight rail.
• Rail lines with infrequent traffic should disregard the criteria altogether.
Because the BNSF freight traffic is infrequent (the FTA Guidance Manual suggests fewer than five trains per day as the limit for infrequent), consistent with the FTA guidance vibration impact from relocating the track in Glendora, San Dimas, La Verne, and Pomona does not merit evaluation. Metrolink service is more frequent, running approximately 36 trains per weekday. The vibration from Metrolink trains in Claremont has been evaluated. Vibration impact occurs where the predicted vibration from Metrolink trains exceeds the FTA vibration impact threshold and the relocation results in more than a 3-VdB increase over the existing vibration level.
3.11.6.3 Short-Term Construction Impacts
No Build Alternative Under the No Build Alternative, no new infrastructure would be built within the Study Area, aside from projects currently under construction or projects funded for construction, environmentally-cleared, planned to be in operation by 2035, and identified in the Southern California Association of Governments (SCAG) 2012-2035 Regional Transportation Plan/Sustainable Communities Strategy (RTP/SCS). Noise and vibration that would result from this alternative would be a continuation of the current Study Area levels.
Transportation Systems Management (TSM) Alternative The TSM Alternative’s rapid bus transit system would include providing new bus stops that involve minimal construction. Thus, the use of general good-practice noise control methods for construction would result in no significant noise impacts. These general noise control methods include:
• Avoiding nighttime construction
• Locating equipment and staging areas as far from noise-sensitive receivers as possible
• Limiting unnecessary idling of equipment

Chapter 3—Environmental Analysis, Impacts, and Mitigation Section 3.11—Noise and Vibration
3.11-18 Metro Gold Line Foothill Extension—Azusa to Montclair Draft Environmental Impact Report August 2012
The TSM Alternative is unlikely to require activities resulting in groundborne vibration that approaches the vibration limits for damage for even the most fragile buildings. No adverse construction vibration impacts are identified for the TSM Alternative.
Build Alternative Construction of the project’s LRT alignment and support facilities requires the use of heavy earth-moving machinery, pneumatic tools, generators, concrete pumps, and similar standard equipment used for the LRT projects. Table 3.11-8 shows the equipment likely to be used during the noisiest periods of track construction, the typical noise generated by these pieces of equipment, the usage factors (or percent of time equipment operates under full load), and the estimated Leq for an eight-hour work shift. The work-shift Leq for the generic construction scenario presented in Table 3.11-8 is 84 dBA at 50 feet.
Table 3.11-8. General Construction Scenario Noise Prediction
Equipment
Sound Level at 50 feet Under
Load
Usage Factor (Percentage of Time
under Full Load)
Leq (8-hour
Workshift) Earthmover (bulldozer, front-end loader, etc.) 82 dBA 40% 78 dBA Mobile Crane 81 dBA 20% 74 dBA Dump Truck 76 dBA 40% 72 dBA Pneumatic Tools 85 dBA 30% 80 dBA Generator 78 dBA 40% 74 dBA Compressor 81 dBA 40% 77 dBA Combined Leq 84 dBA Source: Federal Highway Administration, 2006.
The FTA Guidance Manual provides guidance on appropriate impact thresholds for construction noise, but it states that the limits should not be considered “standardized criteria.” The manual recommends a reasonable threshold for construction noise as an eight-hour Leq of 80 dBA at residential land uses.
Based on the predicted construction activities generating a work-shift Leq of 84 dBA at 50 feet, construction noise is likely to exceed the 80 dBA Leq impact threshold in areas near residences at some location. Significant construction noise impacts are likely and, therefore, noise control measures when working near residences would be required.
In compliance with the Construction Authority’s policy, construction of the project would conform to the noise requirements of each City. These requirements generally limit construction activities to daytime hours and certain days of the week (e.g., construction is often precluded on Sundays and national holidays without a variance from the local jurisdiction). Some local noise requirements may also include equipment or property line limits.
Limiting construction activities to weekday daytime hours (typically from 7 a.m. to 6 p.m.) and employing typical measures for minimizing noise during construction requirement, combined with the mitigation described in Section 3.11.5, would mitigate construction impacts to a less than significant level.

Chapter 3—Environmental Analysis, Impacts, and Mitigation Section 3.11—Noise and Vibration
Metro Gold Line Foothill Extension—Azusa to Montclair Draft Environmental Impact Report 3.11-19 August 2012
Construction Vibration Some activities, such as pile driving, pavement breaking, and the use of tracked vehicles (e.g., bulldozers), could result in perceptible levels of groundborne vibration. However, these activities would be limited in duration, and associated vibration levels would likely be well below thresholds for minor cosmetic building damage. Typical vibration levels at which damage occurs are shown in Table 3.11-9. Planned construction would include a limited number of activities expected to generate vibration that approaches the lowest level in Table 3.11-9; none of those activities will be performed close enough to structures to approach that level. Therefore, no special mitigation measures are required to avoid vibration impact during construction.
Table 3.11-9. Vibration Velocity Levels at Which Building Damage Occurs Building Type PPV1 (in/sec) Source
Typical Modern Construction 2.0 Building of Mines Bulletin 656, 1971 Extremely fragile buildings 0.2 FTA, 2006 Historic and ancient buildings 0.12 German Standard DIN 4150 Source: Federal Highway Administration. 2006. FHWA Roadway Construction Noise Model User’s Guide 1 Peak particle velocity
The noise and vibration control plan would include measures to minimize vibration impacts during construction.
3.11.7 Long-term Impacts
There are no Category 1 land uses within the Study Area (Category 1 land uses are tracts of land where quiet is an essential element of their intended purpose, such as concert halls). Therefore, there are no long-term impacts to Category 1 land uses under any alternative.
No Build Alternative Noise from motor vehicles traveling on the existing surface road network dominates the Study Area noise environment. The traffic study for the project suggests that because traffic-carrying capacity is already at or near saturation, there is almost no opportunity for any substantial increase in traffic volumes on the existing network. Any slight traffic volume increase would be accompanied by vehicle speeds being reduced, thus the net effect on Ldn is neutral with a slight bias toward a non-perceptible (<1 dBA) traffic noise increase, if any change at all. The No Build Alternative would not result in an adverse noise impact.
There would be no operational vibration associated with the No Build Alternative, and thus no associated vibration impacts.
Transportation Systems Management (TSM) Alternative The TSM Alternative is a rapid bus system. Although the number of buses per day would increase within the Study Area, the relative change in the overall number of buses is small compared to the large existing and future volumes of automobiles and trucks using the area’s local and regional highways. Thus, the effect on the noise environment would be minimal and likely would not be perceptible (<1 dBA) on an Ldn basis. The TSM Alternative would result in no impact.
There would be no operational vibration associated with the TSM Alternative and, therefore, no vibration impacts.
Chapter 3—Environmental Analysis, Impacts, and Mitigation Section 3.11—Noise and Vibration
3.11-20 Metro Gold Line Foothill Extension—Azusa to Montclair Draft Environmental Impact Report August 2012
Build Alternative The evaluation of the Build Alternative project’s long-term noise and vibration impacts represents a “worst case” scenario based on the train maximum design speeds of up to 65 miles per hour. Trains operating at high speeds would result in high predicted noise and vibration levels, while trains operating at lower speeds would result in lower predicted noise and vibration levels.
City of Glendora In the City of Glendora, the light-rail tracks run in the northern portion of the right-of-way, closer to the westbound clusters (clusters north of the right-of-way). The predicted noise levels are presented in Table 3.11-10. Moderate noise impacts are predicted at clusters WB1 through 1d and WB3a, and severe noise impacts are predicted at clusters WB2 and WB4 through WB20. The severe impacts are a result of relatively low existing noise levels and the short distances between the tracks and the residences. Moderate impacts are predicted at clusters EB6 through EB8, EB10, and EB11; and severe impacts are predicted at clusters EB1 through EB5a and EB9. The eastbound clusters also have relatively low existing noise levels and short distances between the proposed tracks and residences. In some cases, the predicted impact is due to the increase in freight train and horn noise levels that would result from relocating the BNSF tracks closer to eastbound clusters.
The highest predicted noise level is at clusters WB14 and WB15. The higher predicted noise level at these clusters is due to a crossover that would be located adjacent to the clusters; crossovers increase the levels of LRT noise by approximately six dB.
The predicted vibration levels are presented in Table 3.11-11. Vibration impacts are predicted at clusters WB2, WB4 through WB20, EB1 through EB5, EB7, and EB9 through EB12. Vibration impact is predicted at 236 dwelling units in Glendora. Impacts are identified at the majority of clusters in Glendora because the tracks are located relatively close to residences, and the vibration propagation tests showed relatively efficient vibration propagation (meaning vibration levels remain higher over a longer distance). The clusters where impact is predicted are a mix of multi- and single-family residences and include one hotel (20th Century Motor Lodge, cluster EB9).

Chapter 3—Environmental Analysis, Impacts, and Mitigation Section 3.11—Noise and Vibration
3.11-21 Metro Gold Line Foothill Extension—Azusa to Montclair Draft Environmental Impact Report August 2012
Table 3.11-10. Glendora—Predicted Noise Levels for Residential (Category 2) Land Uses
Cluster Number1 Cross Streets Direction
Distance (feet)2
Train Speed (mph)
Existing Ldn
(dBA)
Predicted Ldn
(dBA)
Threshold3
Impact
Number of
Impacts4 Moderate Severe Westbound
WB1 Citrus Ave/Barranca Ave North 156 65 55 58.8 3.2 7.1 Moderate — WB1a Barranca Ave/Grand Ave North 162 65 55 59.4 3.2 7.1 Moderate — WB1b Barranca Ave/Grand Ave North 156 65 55 58.5 3.2 7.1 Moderate — WB1c Barranca Ave/Grand Ave North 150 65 55 58.6 3.2 7.1 Moderate — WB1d Barranca Ave/Grand Ave North 114 65 55 61.1 3.2 7.1 Moderate 5 WB2 Grand Ave/Carroll Ave North 54 65 58 64.1 2.4 5.8 Severe 5 WB3 Carroll Ave/Vermont Ave North 198 65 58 57.5 2.4 5.8 -- —
WB3a5 Vermont Ave/Glendora Ave North 95 55 58 61.9 2.4 5.8 Moderate 19 WB4 Glendora Ave/Pasadena
Ave North 34 55 56 66.1 2.9 6.6 Severe 12
WB5 Glendora Ave/Pasadena Ave
North 22 55 56 67.3 2.9 6.6 Severe 8
WB6 Pasadena Ave/Glenwood Ave
North 12 65 56 70.4 2.9 6.6 Severe 20
WB7 Pasadena Ave/Glenwood Ave
North 28 65 56 66.9 2.9 6.6 Severe 20
WB8 Pasadena Ave/Glenwood Ave
North 34 65 56 67.0 2.9 6.6 Severe 9
WB9 Glenwood Ave/Elwood Ave North 30 65 56 67.4 2.9 6.6 Severe 4 WB10 Glenwood Ave/Elwood Ave North 34 65 56 67.0 2.9 6.6 Severe 4 WB11 Elwood Ave/Lorraine Ave North 16 65 56 69.5 2.9 6.6 Severe 5 WB12 Elwood Ave/Lorraine Ave North 50 65 56 64.6 2.9 6.6 Severe 6 WB13 Elwood Ave/Lorraine Ave North 46 65 56 66.0 2.9 6.6 Severe 4 WB14 Lorraine Ave/Route 66 North 46 65 56 71.1 2.9 6.6 Severe 6 WB15 Lorraine Ave/Route 66 North 44 65 56 71.0 2.9 6.6 Severe 7 WB16 Lorraine Ave/Route 66 North 52 65 58 64.7 2.4 5.8 Severe 12 WB17 Lorraine Ave/Route 66 North 50 65 58 64.9 2.4 5.8 Severe 5

Chapter 3—Environmental Analysis, Impacts, and Mitigation Section 3.11—Noise and Vibration
3.11-22 Metro Gold Line Foothill Extension—Azusa to Montclair Draft Environmental Impact Report August 2012
Cluster Number1 Cross Streets Direction
Distance (feet)2
Train Speed (mph)
Existing Ldn
(dBA)
Predicted Ldn
(dBA)
Threshold3
Impact
Number of
Impacts4 Moderate Severe WB18 Lorraine Ave/Route 66 North 44 65 58 65.6 2.4 5.8 Severe 7 WB19 Route 66/210 Fway North 50 65 58 64.9 2.4 5.8 Severe 17 WB20 Route 66/210 Fway North 54 65 58 64.5 2.4 5.8 Severe 10
Eastbound EB1 Citrus Ave/Barranca Ave South 66 65 55 63.2 3.2 7.1 Severe 26 EB2 Citrus Ave/Barranca Ave South 50 65 55 64.9 3.2 7.1 Severe 11 EB3 Citrus Ave/Barranca Ave South 68 65 55 66.6 3.2 7.1 Severe 6 EB4 Barranca Ave/Grand Ave South 54 65 55 68.9 3.2 7.1 Severe 5 EB5 Barranca Ave/Valencia St South 58 65 55 64.0 3.2 7.1 Severe 7
EB5a5 Valencia St/Grand Ave South 75 65 55 65.6 3.2 7.1 Severe 13 EB6 Ada Ave/Vermont Ave South 110 45 58 61.1 2.4 5.8 Moderate — EB7 Pasadena Ave/Glenwood
Ave South 86 65 56 61.6 2.9 6.6 Moderate 4
EB8 Pasadena Ave/Glenwood Ave
South 112 65 56 60.1 2.9 6.6 Moderate —
EB9 Lorraine Ave/Route 66 South 52 65 58 65.0 2.4 5.8 Severe 6 EB10 Route 66/210 Freeway South 94 65 58 61.8 2.4 5.8 Moderate — EB11 Route 66/210 Freeway South 84 65 58 62.4 2.4 5.8 Moderate 4 EB12 Lone Hill Ave/Gladstone St South 94 65 64 65.5 1.5 3.9 — —
Total Moderate Impacts 76 Total Severe Impacts 235 Source: ATS Consulting 2011 1 The cluster numbers correspond to the labels in Figure 3.11–7 through Figure 3.11–15. The clusters are labeled from west to east in ascending order.
Westbound (WB) clusters are located north of the right-of-way and Eastbound (EB) clusters are located south of the right-of-way. 2 The distance in feet from the closest sensitive receptor in the cluster to the nearest proposed light-rail track. 3 The threshold is the allowable increase in noise from the existing Ldn. The FTA designates two threshold levels: moderate and severe. 4 Number of dwelling units in the cluster. 5 This cluster is a proposed development.