Embed Size (px)
Citation preview

1
Presentation to MERCon
Long Term Capacity Planning
by
MSEDCLAugust 09, 2005
2
Objectives
Bring to focus MSEDCL’s demand-supply projections and MSEDCL’s
plans to bridge the future demand-supply gap.
Highlight various measures undertaken by MSEDCL to bridge the
demand-supply gap.
To share demand projection methodology for long term power purchase.
2
3
Structure of Presentation
Demand-Supply position
Analysis of Demand-Supply position
Demand-Def icit projections upto 2011-12, Without Capacity Addition
Factors considered for preparing the Capacity Addition Options
Projected Availability during 10th and 11th Plan Period
Projected Shortfall
MSEDCL’s Demand Projection Methodology
Options for MSEDCL for Bridging Future Demand-Supply Gap
MSEDCL’s Proposal for Purchase of Power on Long Term Basis
Conclusion
4
Demand Supply Position

3
5
Overview of Demand-Supply position
Total shortfall of around 3045 MW in the year 2004-05.
Ye ar 2000-01 2001-02 2002-03 2003-04 2004-05*P ea kin g Req uirem ent 10473 10119 11425 11357 12749MSEB’s total Generation 7097 7323 6431 6661 6899
Cent ral Sectors, Purchase from Ot hers Sources & Exch. With TPCL 1554 1780 2573 2654 2805
Peaking Availability 8651 9103 9004 9315 9704Deficit -1822 -1016 -2421 -2042 -3045
6
Overview of Demand-Supply position (contd)
MSEB In stalled H YD RO-TH ERMAL -GAS M IX
THERMAL66%
HYDRO25%
GAS9%
THERMAL HYDRO GAS
Thermal-h ydro-gas mix is in the ratio 66:25: 9.

4
7
Overview of Demand-Supply position (contd)
CAGR of 5.04% for the peak demand,
The reasons for shortages are:Tremendous increase in demandZero availability from Dhabol power project andMSEB did not make any capacity addition to its installed capacity inthe last several years.
This widening gap between demand and supply gives the possibility of going for LTPP agreements wi th IPP’s, Public sector units, traders etc.
8
Analysis of Demand-Supply position

5
9
Analysis of Demand-Supply positionDemand in 2004-05 (Jun-Sep)
6 00 0
6 50 0
7 00 0
7 50 0
8 00 0
8 50 0
9 00 0
9 50 0
1 2 3 4 5 6 7 8 9 1 0 1 1 1 2 1 3 1 4 1 5 1 6 1 7 1 8 1 9 2 0 2 1 2 2 2 3 2 4
Ho u rs
MW
Pea k Pea k
Base
Availabil ity
Load Curve
10
Analysis of Demand-Supply positionDemand in 2004-05 (Oct-May)
6000
7000
8000
9000
10000
11000
12000
1 2 3 4 5 6 7 8 9 10 11 12 13 14 15 16 17 18 19 20 21 22 23 24Hours
MW
Peak Peak
BaseAvailabil ity
Load Curve

6
11
Analysis of Demand and Supply Position
Demand Comparison between Year 03-04 & Year 04-05
9000
9500
10000
10500
11000
11500
12000
12500
13000
Dem
and
in M
W
Demand 03- 04 10838 10744 10532 9314 9637 10477 10994 11076 11292 10925 10837 11357Demand 04- 05 11707 10796 9919 10685 10676 11274 12103 12435 12454 12250 12440 12749
Apr May Ju n Jul Aug Sep Oct Nov Dec Jan Feb Mar
Demand
Increase in demand attributable to new agricultural connections(≈579 MW ) and increase in HT demand
12
Analysis of Demand and Supply Position
MSEB Availability in Year 03-04 & 04-05
7 00 0
7 50 0
8 00 0
8 50 0
9 00 0
9 50 0
10 0 00
10 5 00
Av a ila bility 0 3 -0 4 8 7 2 8 8 6 9 3 8 4 9 5 8 2 7 3 8 0 2 3 9 16 0 9 6 10 8 8 5 0 9 9 2 6 9 15 1 9 6 5 1 9 3 15
Av a ila bility 0 4 -0 5 9 2 3 1 9 15 7 8 5 6 0 8 8 4 7 9 2 4 5 8 7 70 9 9 0 4 9 4 9 9 9 4 15 9 5 0 7 10 1 2 0 9 7 0 4
Apr Ma y J un J ul Aug Se p Oc t No v De c J an Fe b Ma r
Marginal in crease in availabilit y b y 389 MW
Availability

7
13
Analysis of Demand and Supply Position
MSEB ST Power Purc ha se 03-04 & 04-0 5
-50
100150200250
300350400
450500
Apr-03
May-03
Jun-03Jul-0
3
Aug-03
Sep-03
Oct-03
Nov-03
Dec-03
Jan-04
Feb-04
Mar-04
Apr-04
May-04
Jun-04Jul-0
4
Aug-04
Sep-04
Oct-04
Nov-04
Dec-04
Jan-05
Feb-05
Mar-05
MW
-
0.50
1.00
1.50
2.00
2.50
3.00
3.50
Rs
/kW
h
MSEDCL purchasing po wer on short term basis from po wer Trading corporation, Adani Energ y ltd., NTPC Vid yut Vapar Nig am Ltd etc.
Short Term Power Purchase
14
Analysis of Demand and Supply Position (Contd)
Shortfall in Year 03-04 & Year 04-05
500
1000
1500
2000
2500
3000
3500
Shor
tfall i
n MW
Shortfall 03-04 2110 2051 2037 1041 1614 1317 1384 2226 1366 1774 1186 2042
Shortfall 04-05 2476 1639 1359 1838 1431 2504 2199 2936 3039 2743 2320 3045
Apr May Jun Jul Aug Sep Oct Nov Dec Jan Feb Mar
The increase in demand do es not commensurate with increase in availabilit y
Short fall

8
15
Analysis of Demand and Supply Position (Contd)
Sr. No . Area Lo ad (M W ) Pe rcen tag e
1
Express Feeders for Industrial MIDC and waterworks 3108 27%
2 Urban 3311 28%3 Rural 5329 49%
MSEDCL’S load prof ile
16
Analysis of Demand and Supply Position (Contd)
MS EB S uccessor ent ities load curve
8000
9000
10000
11000
12000
13000
1 3 5 7 9 11 13 15 17 19 21 23
Time(hrs)
MW
B A S E
I n t e r m e d i a t e
Observations:
• Morning peak during 7-11 hrs and evening peak during 18-22 hrs
• Peak Demand @ 20.00 hrs
Load curve for MSEDCL
9
17
Demand-Deficit projections upto 2011-12, if no Capacity Addition is undertaken
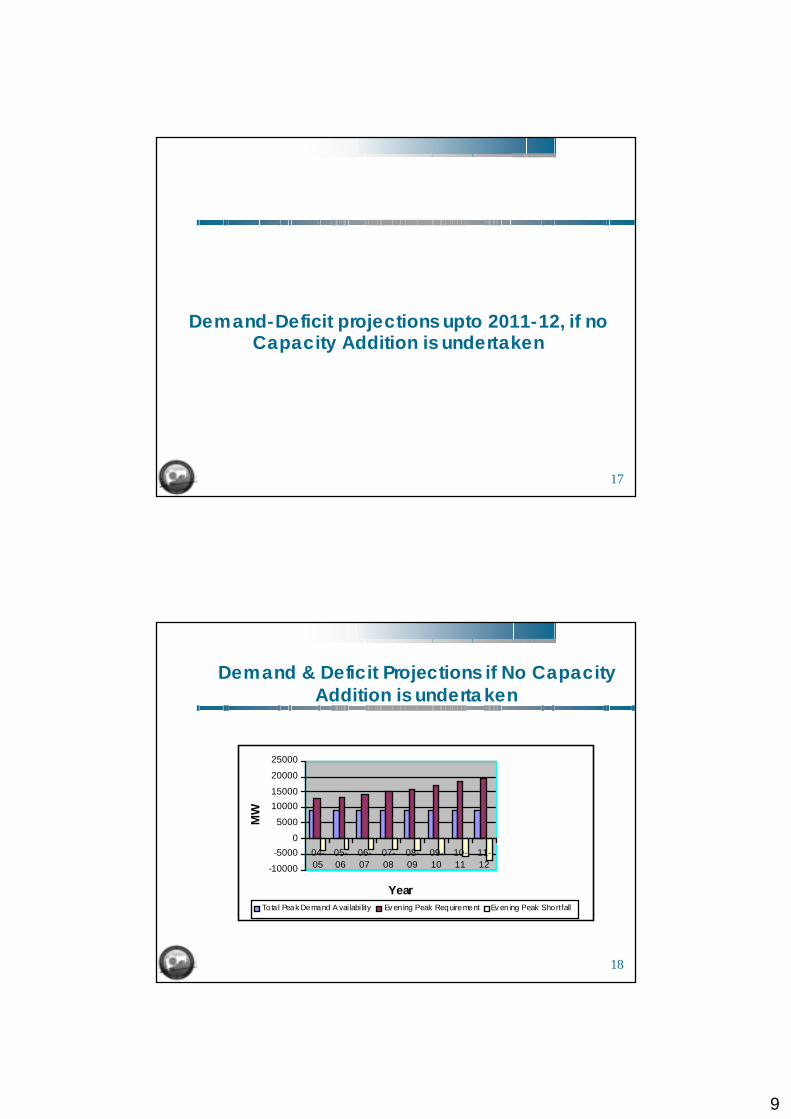
18
Demand & Deficit Projections if No Capacity Addition is undertaken
-10000
-50000
5000
1000015000
20000
25000
04-05
05-06
06-07
07-08
08-09
09-10
10-11
11-12
Year
MW
Tota l Peak Demand A vai labi lity Ev ening Peak Requirement Ev ening Peak Shortfall

10
19
Demand & Deficit Projections if No Capacity Addition is undertaken(contd)
2004-05 2005-06 2006-07 2007-08 2008-09 2009-10 2010-11 2011-12Total P eak Demand Availability
9704* 9158** 9158 9158 9158 9158 9158 9158
Evening Peak Requirement 12749 13274 14161 15105 16110 17179 18318 19530Evening Peak Shortfall -3045 -4116 -5003 -5947 -6952 -8021 -9160 -10372
Demand projections expected to increase at CAGR 6.53%
Current peak deficit to escalate to 7140 MW by 2011-12
Ideally capacity addition plan of about 10890 MW to bridge demand supply gap and bring
load shedding to NIL level by 2011-12.
Huge capital investment, around Rs. 43562 crs.
Capacity addition plan to cater to such demand deficit would require certain provisions on
building up spinning reserves in the system of the order of 5%.
*Incl ST power purchase
** Excl ST power purchase
20
Factors considered by MSEDCL for preparing capacity addition options
11
21
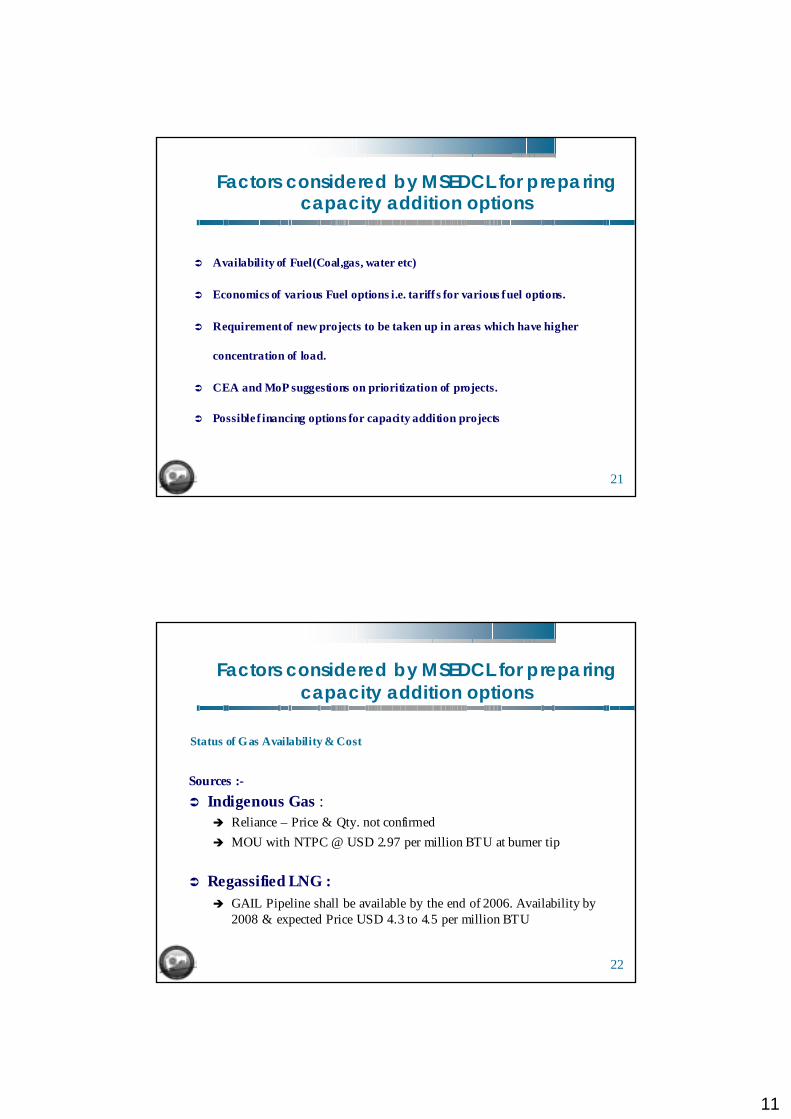
Factors considered by MSEDCL for preparing capacity addition options
Availability of Fuel(Coal,gas, water etc)
Economics of various Fuel options i.e. tariff s for various fuel options.
Requirement of new projects to be taken up in areas which have higher
concentration of load.
CEA and MoP suggestions on prioritization of projects.
Possible f inancing options for capacity addition projects
22
Factors considered by MSEDCL for preparing capacity addition options
Sources :-Indigenous Gas :
Reliance – Price & Qty. not confirmedMOU with NTPC @ USD 2.97 per million BTU at burner tip
Regassified LNG :GAIL Pipeline shall be available by the end of 2006. Availability by 2008 & expected Price USD 4.3 to 4.5 per million BTU
Status of Gas Availability & Cost

12
23
Factors considered by MSEDCL for preparing capacity addition options (contd)
Pit Head Projects in Maharashtra
WCL indicated no further coal available for expansion.
Efforts are made with Ministry of Coal for reallocation of more coal
to MSEDCL.
Status of Availability of Coal
24
Factors considered by MSEDCL for preparing capacity addition options (contd)
Pit Head projects in JV with Chhattisgarh :CSEB has requested MoP for Coal linkage(most probably from nearby SECL Mines.)
Transportation based Coal ProjectsApplied for Captive mines in Mahanadi coal fields inOrissa
Imported CoalEconomically unviable option

13
25
Factors considered by MSEDCL for preparing capacity addition options (contd)
Sr. No . T yp e of Pro je ct Pro ject Na me
Pro ject Co st in Rs .
Cr s. /M W (T en tativ e)
T ari ff R ate in Rs ./Un i t
(T en tativ e)
1P i t h ead co al b as ed
Pro jects aV ind h ya ch al
S tag e II I 4.2 1.83
b Sipa t-I I(N T PC) 4.04 1.5
c Ka h alg a on II (NT PC )
3.73 1.72
d . Ka h alg a on (NT PC )
4 1.78
e Ba rh (NT PC ) 3.93 1.89
a Par li -I(M SEB ) 4.2 2.22
b Par as-I (M SEB) 4.48 2.13
a Ka w as(N T PC) 2.47 1.9b Ga n dh ar (NT PC) 3.85 1.9c Ha zi ra(ESS AR) 2.7 2.82
3.89 2.24Im po rte d Co a l Bas ed
Pro ject T PC Pro je ct
3 Ga s ba se d Pro je cts
2In d ig e no u s Co al b as ed
Pro jects (w ith tran s po rta tio n o f C oa l)
Economics of coal based & gas based Projects
26
Factors considered by MSEDCL for preparing capacity addition options (contd))
W ES T E RN ARE A
CE NT RAL ARE A
E AS T ER N ARE A
Generat ion withCent ral assist ance 6100 1200 5800Local Lo ad 8500 2100 2500Surplu s(+ )/shortfall (-) (-)2400 (-)900 (+ )330 0
Load concentration in western region(shortfall of 2400 MW )
Areawisegeneration-Load(MW) Scenario -Maharashtra System

14
27
Factors considered by MSEDCL for preparing capacity addition options (contd)
CEA and MoP’s suggestions on prioritization of projectsPit head power plants
Min size: 800 MW or multipleCost to be Rs.3 Cr. To 4 Cr. Per MWTariff: In the range of Rs. 1.50-Rs. 1.90/unitProjects of 3200 MW or above should be taken up
Imported Coal power plantsProjects to be preferably located in the coastal areas near load centers
Gas based power plantsLowest capital cost and to be located near load centers
28
Factors considered by MSEDCL for preparing capacity addition options (contd)
Purchase of power from private IPPs:
MSEDCLPrivate sector
players
PPA
Co mpeti tive Bidding guidel ines
L C, Escro w to be used fo r p ayment and security
Possible f inancing

15
29
Factors considered by MSEDCL for preparing capacity addition options (contd)
Purchase of power from NTPCNTPC has inherent advantage of being able to set up large scale pit head based thermal projects
Joint ventures
MSEDCL IPP’s
Joint Vent ure
To set up new generatio n plants.M SEDCL to attach sui table distributio n
ci rcles to these JV fo r o btaining finances
30
Factors considered by MSEDCL for preparing capacity addition options (contd)
Subsidiary Plants
MSEDCL to separate some existing plants under its new subsidiary . The new
company on strength of its equity to set up new plants with lending from PFC/REC

16
31
MSEDCL’S Projected Availability during 10th Plan and 11th plan period
32
MSEDCL’S Projected Availability during 10th Plan and 11th plan period
AP P RO VED P R OJEC TS YEAR OF CA P . AX.C . P . L.F .
AVA ILB . IN MW IN % IN %
Exis ti ng Ca pa cit y 915 8 915 8 915 8 915 8 915 8 915 8 915 8 915 8
a) MS EB P ro je ct s i) Uti lis at io n o f exis ti ng Ca p. Of GTP S
20 06 - 07 79 2 3 27 20 8 20 8 20 8 20 8 20 8 20 8
ii) P a rli TP S Extn . S t - I 20 06 - 07 25 0 9 80 182 182 182 182 182 182iii ) P a ras TP S Exp n. S ta ge - I 20 06 - 07 25 0 9 80 182 182 182 182 182 182b) Cen t ra l S e ct o r P roj ec ts
I) Ta ra pu r Un it - 4 20 05 - 06 196 80 157 157 157 157 157 157 157ii) Ta ra pu r Un it - 3 20 05 - 06 197 80 158 158 158 158 158 158 158
iii ) Vi ndh ya ch al S t a ge - 3 20 06 - 07 32 6 80 26 1 26 1 26 1 26 1 26 1 26 1
iv ) Ka ha lga o n 20 07 - 08 100 80 80 80 80 80 80v) S i pat S t ag e - II 20 07 - 08 319 80 25 5 25 5 25 5 25 5 25 5
vi ) S i pat S t ag e- I Unit - 1 20 08 - 09 115 80 92 92 92 92
vi ) S i pat S t ag e- I Un it - 2 20 09 - 10 115 80 92 92 92vi i) S i pat S t ag e- I Un it - 3 20 09 - 10 115 80 92 92 92
vi ii) Ka wa s Expa ns io n P ro j ec t 20 07 - 08 50 0 80 40 0 40 0 40 0 40 0 40 0
ix) G an dha r Expa ns io n P ro jec t 20 07 - 08 50 0 80 40 0 40 0 40 0 40 0 40 0x) Ba rh 20 08 - 09 100 80 80 80 80 80
xi) N ort h Karan pu ra 20 09 - 10 100 80 80 80 80c) In te r S ta te P ro je ct s
I) S arda r Sa rov ar P ro je ct 20 04 - 05 39 1.5 80 313 313 313 313 313 313 313
Irriga ti o n p ro j ec t G ha tg ha r P S S 20 06 - 07 25 0 80 20 0 20 0 20 0 20 0 20 0 20 0P e ak De m an d A via la bil ity wit h f irme d pro jec ts
915 8 97 86 108 18 119 54 12126 123 90 123 90 123 90
08 - 09 09 - 10 20 10- 11 20 11- 1204 - 05 05 - 06 06 - 07 07 - 08
Firmed Up Projects

17
33
MSEDCL’S Projected Availability during 10th Plan and 11th plan period(Contd)
YEAR OF CAP. AX.CS. PL FAVAI LB. IN M W IN % IN %
Pe a k de m an d a va ila b ilit y w ith f irme d p ro jec t s
91 58 97 86 10 818 11 954 12 126 12 390 12 390
Pro p os e d Pro je c ts1 ) Dab h o l Po w e r Co mp a n y ` 06- 07 22 10 80 17 68 17 68 17 68 17 68 17 682 )U ra n Ex p an .Pro je c t Ad di tio n a l ` 07- 08 10 40 3 80 80 7 80 7 80 7 80 73 )T a le g ao n Ga s Pro je c t ` 09- 10 14 00 3 80 10 86 10 866 )K ha p e rkh e d a TP S ( 1x 5 0 0 M W) ` 09- 10 50 0 9 80 36 4 36 4 Ad d it io n to Pe a k L oa d Av ai lab il ity w it h p ro po s e d pro je c ts
17 68 25 75 25 75 40 25 40 25
T o ta l Pe a k De ma n d Ava ila b ilit y 91 58 97 86 12 586 14 529 14 701 16 415 16 415
10 -1 1` 06- 07 PR OJ ECT S ` 07- 08 ` 08- 09 ` 09- 10` 04- 05 ` 05- 06
Proposed Projects
34
MSEDCL’s Projected Shortfall

18
35
MSEDCL’s Projected Shortfall
Year 04-05 05-06 06-07 07-08 08-09 09-10 10-11 11-12Total Peak Demand Availibilty w it h firm ed u p and proposed projects 9158 9786 12586 14529 14701 16415 16415 16415P eak Requirement 12441 13274 14161 15105 16110 17179 18318 19530P eak S hortfa ll -3283 -3488 -1575 -576 -1409 -764 -1903 -3115
MSEDCL’s projected shortfall with all firmed up and proposed projects
36
MSEDCL’s Demand Projection Methodology

19
37
Methodology
Base data for 2004-05: Kalwa LDCAggregation of Typical monthly load Curves (2004-05)
Monsoon period (Jun-Sep)Non Monsoon period (Oct-May)
Projections for non-monsoon periodHourly Ratio (for 2004-05 ) = Demand during any hrs / Peak demand at 20.00 hrsPeak load projection till 2011-12 (I.e. @ 20.00 hrs): Based on 16th EPS peak load projectionsProjected hourly demand=Hourly Ratio (for 2004-05) * Projected monsoon peak load
38
Methodology(Contd)
Projections during Monsoon PeriodMonsoon to non-monsoon peak load data from 04-05 data.16th EPS projections- for non-monsoon periodProjected monsoon peak load=monsoon/non-monsoon peak load*16 EPS projectionsHourly ratio for monsoon projections from 04-05 dataProjected hourly demand=Hour ly ratio* Projected monsoon peak load

20
39
Methodology(Contd)
Projected Availability ti ll 2011-12: Provided by MSEDCL (excluding Hydro, which is proposed to be utilized for unmet peak load demand)Accordingly, hourly shortfalls have been worked out for 2011-12
40
Projections for 2011-12 (Oct-May)Demand Availabi li ty Chart for 2011-12
13500
14000
14500
15000
15500
16000
16500
17000
17500
18000
18500
19000
19500
1 2 3 4 5 6 7 8 9 10 11 12 13 14 15 16 17 18 19 20 21 22 23 24
Time
MW
Intermediate load: 1324 MW (over and above projected availability)Availability :15165 MW
Peak load: 700 MW
Peak load: 700 MW
Balance demand to be met through hydro resources

21
41
Results
Hourly Shortfall projections for 2011-12Hour 1 2 3 4 5 6Tota l De ma nd 14 302 14 090 14 068 14 141 14 581 16 489Availability 15 165 15 165 15 165 15 165 15 165 15 165Sh ort fall 0 0 0 0 0 13 24
Hour 7 8 9 10 11 12Tota l De ma nd 17 243 17 701 17 731 17 789 17 185 16 449Availability 15 165 15 165 15 165 15 165 15 165 15 165Sh ort fall 20 78 25 36 25 66 26 24 20 20 12 84
Hour 13 14 15 16 17 18Tota l De ma nd 17 073 16 736 16 592 16 717 17 239 17 291Availability 15 165 15 165 15 165 15 165 15 165 15 165Sh ort fall 19 08 15 71 14 27 15 52 20 74 21 26
Hour 19 20 21 22 23 24Tota l De ma nd 17 788 18 830 18 106 17 201 16 289 14 877Availability 15 165 15 165 15 165 15 165 15 165 15 165Sh ort fall 26 23 36 65 29 41 20 36 11 24 0
42
Options for MSEDCL for Bridging Future Demand-Supply Gap

22
43
Options for MSEDCL for Bridging Future Demand-Supply Gap
Various options other than capacity addition considered by MSEDCL to
bridge demand supply gap:
Loss reduction
Single phasing scheme
Demand side management (incl Ag feeder separation, HVDS,installation
of capacitors, Akshay Prakash Yojana)
Above measures are expected to give some load relief, but not sufficient to
meet the entire demand-supply gap
Hence, power purchase on long tem basis through competitive bidding
44
MSEDCL’s Proposal for Purchase of Power on Long Term Basis

23
45
MSEDCL’s Proposal for Purchase of Power on Long Term Basis
Y ear T im e No n -m o n so o n
0 to 6 H rs Ni l6 to 23 H rs 1324 M W
7 to 11 &
18 to 22 H rs
2011-12
700 M W
46
Conclusion
24
47
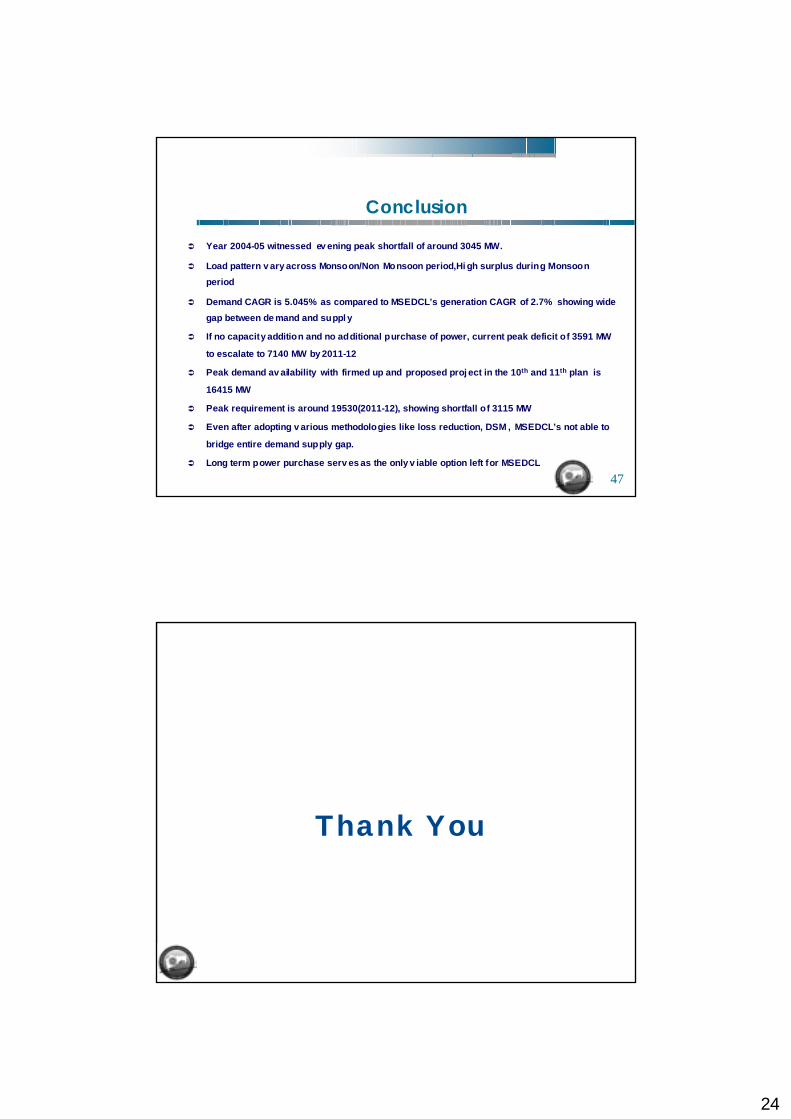
Conclusion
Year 2004-05 witnessed ev ening peak shortfall of around 3045 MW.
Load pattern v ary across Monsoon/Non Monsoon period,Hi gh surplus during Monsoon period
Demand CAGR is 5.045% as compared to MSEDCL’s generation CAGR of 2.7% showing wide gap between de mand and suppl y
If no capacity addition and no additional purchase of power, current peak deficit of 3591 MW
to escalate to 7140 MW by 2011-12
Peak demand av ailability with firmed up and proposed proj ect in the 10th and 11th plan is
16415 MW
Peak requirement is around 19530(2011-12), showing shortfall of 3115 MW
Even after adopting v arious methodologies like loss reduction, DSM , MSEDCL’s not able to
bridge entire demand supply gap.
Long term power purchase serv es as the only v iable option left for MSEDCL
Thank You


![[XLS]purbamedinipur.gov.inpurbamedinipur.gov.in/SRER 2014/Annx IIA_List of... · Web viewRupatan Bibi, Sk. Azad, Rupsana Begam Sahapur Mandar para ICDS Probhati Bera Sahapur Madarpara](https://img.pdfslide.us/doc/110x75/5aa5880f7f8b9ac8748d4144/xls-2014annx-iialist-ofweb-viewrupatan-bibi-sk-azad-rupsana-begam-sahapur.jpg)