Embed Size (px)
Citation preview

Annual financial statements 31 March 2016

Annual Financial Statements | 31 March 2016 1
Contents
Statement of directors’ responsibilities and approval 2
Report of the audit and risk committee 3
Statement by company secretary 4
Directors’ report 5
Independent auditors’ report to Parliament
and the shareholder – Minister of Public Enterprises 11
Statements of financial position 14
Income statements 15
Statements of comprehensive income 15
Statements of changes in equity 16
Statements of cash flows 17
Notes to the financial statements:
Note
1. General information 18
2. Summary of significant accounting policies 18
3. Capital management and going concern 27
4. Critical accounting estimates and assumptions 29
5. Financial risk management 33
6. Accounting classification, fair value and
fair value hierarchy 50
7. Segment information 57
8. Property, plant and equipment 61
9. Intangible assets 63
10. Future fuel supplies 63
11. Investment in equity-accounted investees 64
12. Investment in subsidiaries 64
13. Deferred tax 66
14. Investment in securities and financial
trading instruments 67
15. Loans receivable 68
16. Derivatives held for risk management 69
17. Finance lease receivables 72
18. Payments made in advance 73
19. Trade and other receivables 73
20. Inventories 74
21. Cash and cash equivalents 74
22. Non-current assets and liabilities held-for-sale 75
23. Service concession arrangements 75
24. Share capital 76
25. Debt securities and borrowings 77
26. Embedded derivatives 79
27. Payments received in advance and deferred income 79
28. Employee benefit obligations 80
29. Provisions 82
30. Finance lease payables 84
31. Trade and other payables 84
32. Revenue 84
33. Other income 85
34. Primary energy 85
35. Employee benefit expense 85
36. Net impairment loss 85
37. Other expenses 86
38. Depreciation and amortisation expense 86
39. Net fair value loss on financial instruments, excluding
embedded derivatives 86
40. Finance income 86
41. Finance cost 87
42. Income tax 87
43. Cash generated from operations 88
44. Net debt reconciliation 89
45. Guarantees and contingent liabilities 90
46. Commitments 91
47. Related-party transactions 92
48. Events after the reporting date 94
49. Restatement of comparatives 94
50. Directors’ remuneration 95
51. New standards and interpretations 100
52. Information required by the
Public Finance Management Act 102
53. Pro forma revaluation of property, plant and
equipment (unaudited) 106
Appendix – Abbreviations and acronyms 107
The annual financial statements have been prepared under the supervision of the chief financial officer, A Singh CA(SA). The financial statements have been audited in compliance with section 30 of the Companies Act and approved by the board of directors on 31 May 2016. The audited financial statements of the group and Eskom as at and for the year ended 31 March 2016 are available for inspection at the company’s registered office and on the Eskom website at www.eskom.co.za and were published on 5 July 2016.

Eskom Holdings SOC Ltd2
Statement of directors’ responsibilities and approval
The board of directors (board) are responsible for the maintenance of adequate accounting records and appropriate systems of internal control as well as the preparation, integrity and fair presentation of the annual consolidated financial statements which includes financial results, performance against predetermined objectives and the financial position at the end of the year of Eskom Holdings SOC Ltd (Eskom), its subsidiaries, joint ventures, associates and structured entities (together, the group). The annual financial statements have been prepared in accordance with International Financial Reporting Standards (IFRS), the Public Finance Management Act (PFMA), and the South African Companies Act (Companies Act).
In preparing the annual financial statements, the directors are required to consistently apply appropriate accounting policies, make reasonable and prudent judgements and estimates, state whether applicable accounting standards have been followed and whether the annual financial statements for Eskom and the group will continue to be prepared on the going-concern basis in the foreseeable future.
To enable the Eskom board of directors to meet the above mentioned responsibilities, the board sets standards and management implements systems of internal control. The controls are designed to provide assurance that assets are safeguarded, and that liabilities and working capital are efficiently managed. Policies, procedures, structures and approval frameworks provide direction, accountability and division of responsibilities, and contain self-monitoring mechanisms. The controls throughout Eskom and the group focus on those critical risk areas identified by operational management and confirmed by executive management. Both management and the internal audit department closely monitor the controls, and actions are taken to correct deficiencies as they are identified.
Eskom’s audit and risk committee plays an integral role in risk management as well as in overseeing Eskom’s internal audit function (audit and forensic). The group’s internal audit function, which operates unimpeded and independently from operational management, and has unrestricted access to the group’s audit and risk committee, assesses and, when necessary, recommends improvements to the system of internal control and accounting policies, based on audit plans and outcomes that take cognisance of the relative degrees of risk of each function or aspect of the business.
Eskom’s audit and risk committee has reviewed the going-concern basis and the effectiveness of Eskom and the group’s internal controls. The committee has evaluated Eskom and the group’s annual financial statements and has recommended their approval to the board. The audit and risk committee’s approval is set out on page 3.
Based on the information and explanations given by management, the internal audit function and discussions held with the independent external auditors, the directors are of the opinion that the internal accounting controls of Eskom and the group are adequate to ensure that the financial records may be relied upon for preparing the annual financial statements, and that accountability for assets and liabilities is maintained.
The directors have made an assessment of the ability of Eskom and the group to continue as a going concern in the foreseeable future. The directors reviewed Eskom’s and the group’s performance for the year ended 31 March 2016 and the cash flow forecast for the 15 months ending 30 June 2017.
The board is pursuing funding options to implement the group’s borrowing programme. In assessing the ability to raise funds, the current economic climate as well as Eskom’s and the sovereign’s credit ratings have been taken into account.
Based on the above, the directors are satisfied that Eskom and the group have access to adequate resources and facilities to be able to continue its operations for the foreseeable future. Accordingly the board continued to adopt the going-concern basis in preparing the financial statements.
These annual financial statements are based on appropriate accounting policies, supported by reasonable and prudent judgements and estimates and are prepared on the going-concern basis.
In the opinion of the directors, based on the information available to date, the annual financial statements fairly present the financial position of Eskom and the group at 31 March 2016 and the results of its operations and cash flow information for the year then ended.
The independent external auditors are responsible for independently auditing the financial statements in accordance with International Standards of Auditing (ISA) and the Public Audit Act (PAA). The independent external auditors audited the Eskom and group annual financial statements in accordance with ISA and the PAA and their unqualified audit report is presented on page 11. The independent external auditors were given unrestricted access to all financial records and related data, including minutes of all meetings of the board of directors and committees of the board. The directors believe that all representations made to the independent external auditors during their audit are valid and appropriate.
The Eskom and group annual financial statements for the year ended 31 March 2016 have been prepared under the supervision of the chief financial officer A Singh CA(SA), and approved by the board of directors and signed on its behalf on 31 May 2016 by:
B Ngubane B Molefe A SinghChairman Group chief executive Chief financial officer
31 May 2016 31 May 2016 31 May 2016
Annual Financial Statements | 31 March 2016 3
Report of the audit and risk committee
Mandate and terms of reference The audit and risk committee (the committee) presents its report in terms of the requirements of the PFMA, the Companies Act (section 94(7)(f)) and in accordance with the King Code of Governance Principles for South Africa for the financial year ended 31 March 2016.
The role of the committee is defined in its mandate. It covers, amongst others, its statutory duties and the assistance to the board with the oversight of financial and non-financial reporting and disclosure, internal control system, risk management, internal and external audit functions and combined assurance, including information technology governance. Information on the membership and composition of the committee is set out in the 2016 integrated report and related information on the Eskom website.
The committee fulfilled all its statutory duties as required by section 94(7)(f) of the Companies Act. The committee reports that it has adopted an appropriate formal terms of reference as its audit and risk committee charter, has regulated its affairs in compliance with this charter and has discharged all of its responsibilities contained therein.
Eskom is applying a combined assurance model to ensure coordinated assurance activities. The committee oversees the assurance activities and the establishment of effective systems of internal control to provide reasonable assurance that Eskom’s financial and non-financial objectives are achieved and that the preparation of financial statements for external purposes is in accordance with IFRS.
Execution of functions In the conduct of its duties the committee has, inter alia, reviewed the following areas:
Going concern assumption The committee considered the following: • robustness of budgets and business results • cash flow projections for the 15 months ending 30 June 2017 • regulatory clearing account (RCA) mechanism Multi-Year Price Determination (MYPD) 3 • cost saving opportunities to reduce the revenue shortfall • the cost of the capital projects, including the capacity expansion programme • funding plan to finance the capacity expansion programme • going concern as the basis of preparation of the annual financial statements
Oversight of financial and non-financial reporting and disclosure The committee considered the following: • annual financial statements for fair presentation with the relevant requirements of the PFMA, Companies Act and IFRS • adequacy, reliability and accuracy of financial and non-financial information provided by management and risks that may impact the
integrity of the integrated report • the integrated report is presented in accordance with the International Integrated Reporting Framework • disclosure of sustainability information in the integrated report to ensure that it is reliable and it does not conflict with the financial
information • the expertise, resources and experience of the finance function
Internal control, management of risks and compliance with legal and regulatory requirements The committee considered the following: • effectiveness of internal control systems and governance processes • reviewed legal matters that could have a material impact on the group • effectiveness of the system and process of risk management including the following specific risks:
– financial reporting – internal financial controls – fraud risks relating to financial reporting – information technology risks relating to financial reporting – the effectiveness of the entity’s compliance with legal and regulatory requirements
Internal and external audit The committee considered the following: • charter, annual audit plan, independence, effectiveness, coordination with external auditors and performance of the assurance and
forensic department • appointment of the external auditors in terms of the Companies Act and other applicable requirements • external audit plan, audit budget, actual fee and terms of engagement of the external auditors • the independence and objectivity of the external auditors • accounting, sustainability and auditing concerns identified as a result of the internal and external audits, including reportable irregularities

Eskom Holdings SOC Ltd4
Report of the audit and risk committee (continued)
Opinion The committee is of the opinion, based on the information and explanations provided by management and the assurance and forensic department during the year and at year end and discussions with the independent external auditors, that: • the expertise, resources and experience of the finance function under the leadership of the chief financial officer are adequate • the system and process of risk management and compliance processes are adequate • the internal accounting controls are adequate to ensure that the financial records may be relied upon for preparing the financial
statements and accountability for assets and liabilities is maintained • the internal audit charter approved by the committee was adhered to• the expertise, resources and experience of the assurance and forensic department are adequate • the assurance and forensic department operated effectively • the information contained in the integrated report and related information on the Eskom website is reliable and does not contradict
the information in the annual financial statements • Eskom and the group have access to adequate resources and facilities to be able to continue their operations for the foreseeable future,
it supporting the going concern assumption • it is satisfied with the independence and objectivity of the external auditors having considered the matters set out in section 94(8) of
the Companies Act
The committee considered the restatement in the financial statements as a result of the improvement in the valuation technique of cross-currency swaps as well as the level of the valuation skills in the organisation to value derivatives held for risk management. It also considered the irregular and fruitless and wasteful expenditure reported in terms of the PFMA. Notwithstanding these aspects, the committee is satisfied that nothing significant has come to the attention of the committee to indicate any material breakdown in the functioning of the controls, procedures and systems during the year under review and that the controls are still appropriate to ensure compliance with the requirements of the Companies Act, the PFMA and IFRS.
Recommendation of the annual financial statements The committee has evaluated the financial statements of Eskom and the group for the year ended 31 March 2016 and based on the information provided to it, considers that they comply, in all material respects, with the requirements of the Companies Act, the PFMA and IFRS. The committee concurs with the board and management that the adoption of the going-concern premise in the preparation of the financial statements is appropriate.
The committee has therefore, at their meeting held on 23 May 2016, recommended the adoption of the financial statements by the board.
C Mabude Chairman
31 May 2016
Statement by company secretary
In terms of section 88(2)(e) of the Companies Act of South Africa, I certify that the company has filed with the Companies and Intellectual Property Commission all such returns and notices in terms of this Act, and all such returns appear to be true, correct and up to date.
SM Daniels Company secretary
31 May 2016
Annual Financial Statements | 31 March 2016 5
Directors’ reportfor the year ended 31 March 2016
The directors are pleased to present their report for the year ended 31 March 2016.
Nature of the businessEskom is South Africa’s primary electricity supplier and generates, transmits and distributes electricity to industrial, mining, commercial, agricultural and residential customers and to redistributors (metropolitan and other municipalities), who in turn distribute electricity to businesses and households within their areas of supply. The company’s head office is in Johannesburg. Eskom also purchases electricity from Independent Power Producers (IPPs), as well as buys and sells electricity in the Southern African Development Community region.
The company has several subsidiaries. The nature of the business of the significant operating subsidiaries is set out in note 12 in the annual financial statements.
Business strategyThere was a significant improvement in the performance of the business that was achieved through the stabilisation of:• executive management• generation plant performance • liquidity position
Eskom recognises the need for fundamental operational changes if it is to provide affordable, sustainable electricity supply, whilst delivering credibility and financial sustainability in the long term.
The corporate plan, approved by the board on 25 February 2016, is grounded in the design-to-cost (DTC) paradigm which is underpinned by two maxims, namely cost optimisation and moderate price increases. Achieving this paradigm shift will require Eskom to:• improve the generation energy availability factor (EAF) to 80% by 2021• complete the Ingula, Medupi and Kusile power stations by 2017, 2020 and 2022 respectively• optimise its capital expenditure portfolio through prioritisation and cost optimisation• ensure revenue certainty through the regulatory mechanism of RCAs and the submission of MYPD 4• drive cost containment by optimising primary energy, manpower and other external expenses • optimise the balance sheet in the short term for funding• ensure regulatory and legal compliance • deliver on government’s strategic objectives of transformation, IPPs and other key initiatives• improve Eskom’s credibility through improved performance in the short term
Financial reviewThe group achieved a net profit after tax of R4.6 billion (2015: R0.2 billion) for the year ended 31 March 2016. An earnings before interest, taxation, depreciation and amortisation (EBITDA) of R32.0 billion (2015: R23.3 billion) was achieved by the group, representing an increase of 37.3%.
Revenue amounted to R163.4 billion (2015: R147.7 billion), an increase of 10.6%. The electricity sales of 214 487GWh were 0.83% lower than the prior year. Eskom was a net exporter of electricity this year by 3 762GWh (2015: 1 180GWh) mainly due to the drought in southern Africa, providing opportunities during periods of surplus capacity. International revenue amounted to R8.1 billion (2015: R6.3 billion).
Primary energy costs were R84.7 billion (2015: R83.4 billion). Own generation costs of R57.6 billion (2015: R61.6 billion) include R8.7 billion (2015: R9.5 billion) which was spent on diesel for the open cycle gas turbines (OCGTs) to generate 3 936GWh (2015: 3 709GWh). The IPPs generated 9 033GWh (2015: 6 022GWh) at a cost of R15.1 billion (2015: R9.5 billion). Eskom spent R8.1 billion and R3.7 billion (2015: R8.4 billion and R3.7 billion) on environmental levy and international electricity purchases respectively.
Other operating expenditure in addition to primary energy amounted to R65.6 billion (2015: R59.6 billion) driven largely by increases in employee expenses, depreciation and repairs and maintenance. Eskom (company) spent R13.3 billion (2015: R12.4 billion) on repairs and maintenance during the year.
The capital expenditure cash flows on property, plant and equipment, intangible assets and future fuel, excluding capitalised borrowing costs, amounted to R55.9 billion (2015: R54.4 billion), mainly due to expenditure on the capital expansion programme and generation outages.
Operating performanceUnit 6 of the Medupi power station (720MW) has been in commercial operation since August 2015. Units 3 and 4 of the Ingula power station were synchronised on 3 and 25 March 2016 respectively.
There was no load shedding during the second half of the financial year, although load curtailment of key customers was initiated on 9 October 2015.
Unit 3 of Ingula power station was successfully synchronised to the national grid and performed excellently for over a month, but an unfortunate incident occurred on 6 April 2016 when the unit faulted and was damaged during the commissioning and optimisation of the unit by the contractor. A full investigation to evaluate the extent of the damage is underway. The unit will be repaired and put into commercial operation before the end of the 2017 financial year.
The generation EAF declined to 71.07% compared to 73.73% at 31 March 2015. The EAF improved considerably during the second half of the year and minimised the reliance on the OCGTs.
The water performance of 1.44l/kWhSO (2015: 1.38l/kWhSO) for the year is worse than the previous year, while the particulate emissions performance of 0.36kg/MWhSO (2015: 0.37kg/MWhSO) was better than the previous year.
The conversion of the OCGTs to dual fuel (gas or diesel) will be completed during the upcoming outages at the Gourikwa and Ankerlig power stations during 2017, considering that the conversion is outage dependent. Gas sourcing activities are underway.

Eskom Holdings SOC Ltd6
Directors’ report (continued)for the year ended 31 March 2016
Operating performance (continued)There was excellent transmission system minutes <1 and line fault performance, with a new best reported performance of 2.41 (2015: 2.85) system minutes <1 and 1.51 (2015: 2.01) faults per 100 km. The frequency and duration of distribution network incidents was better than target.
Eskom’s safety performance remains a concern, particularly in light of the number of fatalities and serious injuries suffered by employees, contractors and the public. Safety improvement initiatives focus on instilling responsible safety behaviour across the organisation, leading towards Eskom’s value of Zero Harm.
For more information on operating performance refer to page 34 of the integrated report.
Economic regulationEskom’s regulatory strategy aims to deliver a price path to support economic growth and improve its financial and business sustainability. Eskom needs long-term revenue certainty and stability to ensure its financial sustainability and to reassure lenders that they will earn a return on investment.
NERSA allowed Eskom additional revenue of R11.2 billion for the 2017 financial year in respect of the RCA application for 2014. However, this still leaves Eskom with an estimated revenue shortfall of R6 billion due to the lower determination by NERSA and the reduction in estimated sales volumes. This revenue shortfall will be made up by increasing sales across the country borders, reprioritising the capital expenditure portfolio and additional cost savings.
Eskom will apply through the MYPD methodology for RCA adjustments for the 2015 and 2016 financial years by July 2016.
NERSA is revising the methodology that will be applicable to the MYPD 4 regulatory cycle. Eskom submitted comments detailing the main concerns and proposals on the NERSA consultation paper. These include establishing a mechanism and criteria for the migration path towards cost-reflectivity. It should also include the price-path slope and timeframe within which cost-reflectivity will be achieved. The ring-fencing of revenue intended to cover the cost of power purchases from IPPs and the recovery of any variances between actual and estimated expenses should also be addressed.
Eskom will submit a new MYPD application once discussions with NERSA have been finalised regarding the revised regulatory methodology. Eskom aims to smooth the impact of potential price increases above inflation over a longer period, as opposed to creating shorter term price fluctuations.
Financial sustainability and liquidityEskom and the government are taking several steps to address the current and the future financial sustainability and liquidity of Eskom. These include:• the current liquidity position (cash and cash equivalents of R28.5 billion, plus investments in securities of R10.2 billion) was R38.7 billion
(2015: R17.4 billion) • the board approved a revised borrowing programme of R327 billion, covering the period 1 April 2016 to 31 March 2021. Committed
funding of R31.7 billion or 46% of the funding requirement of R68.5 billion for the 2017 financial year has already been secured at 31 March 2016. Potential funding sources have been identified and plans are in place to secure this funding
• the government injected equity of R23 billion into Eskom during the 2016 financial year• the government converted the R60 billion subordinated loan into equity during the financial year. The conversion did not result in any
cash inflows, but it alleviated the need to repay this loan in the future and removed the need to account for the unwinding of the interest thereon. The largest positive impact of the conversion is the strengthening of the debt/equity ratio and financial gearing of Eskom
• Eskom implemented the Business Productivity Programme (BPP)/DTC programme which aims to deliver cost saving opportunities to assist in closing the revenue shortfall. Savings of R17.5 billion (2015: R8.7 billion) were achieved against a target of R13.4 billion. The inception-to-date savings amounted to R29 billion against a target of R26 billion
• the credit rating of Standard and Poor’s remained unchanged. Moody's revised their outlook from stable to negative on 9 May 2016. Fitch downgraded the standalone credit rating of Eskom from B to B- during March 2016, but it remains at investment grade level
• Eskom continues to engage with municipalities as well as local and national government stakeholders, to find amicable business solutions for the payment defaults. The residential revenue management strategy focuses on energy protection through the installation of split metering and the conversion of meters of non-paying credit metering customers to prepaid meters
The concern raised by the external auditors in the prior year relating to the going concern is no longer considered relevant due to the above.
Governance and riskChanges in the board of directorsMr Norman Baloyi was removed as a director by the Minister of Public Enterprises on 22 April 2015 due to a breach of fiduciary duties in terms of section 76 of the Companies Act. Mr Tshediso Matona, chief executive, and Ms Tsholofelo Molefe, finance director, reached an agreement with Eskom that resulted in their resignations effective 31 May 2015 and 30 June 2015 respectively.
The shareholder approved the appointment of two new directors, Ms Mariam Cassim and Mr Giovanni Michele Leonardi, a Swiss national, on 25 May 2015. Dr Baldwin Ngubane was appointed as chairman of the board on 1 October 2015, after acting as chairman since March 2015. The minister appointed the group chief executive, Mr Brian Molefe, and the chief financial officer, Mr Anoj Singh, as members of the board effective from 1 October 2015.
Subsequent to year end, Mr Romeo Kumalo and Ms Mariam Cassim resigned as directors on 12 April 2016 and 14 April 2016 respectively.

Annual Financial Statements | 31 March 2016 7
Changes in the executive committee Mr Dan Marokane, group executive: group capital, reached an agreement with Eskom that resulted in his resignation effective 1 June 2015.
Mr Brian Molefe was appointed as group chief executive and Mr Anoj Singh as chief financial officer with effect from 25 September 2015, following their secondment from Transnet.
A new executive committee structure was announced on 22 October 2015 to stabilise and strengthen Eskom’s leadership to implement the turnaround strategy.
For more information on governance refer to page 99 of the integrated report.
Risks facing EskomEskom’s risk profile has changed significantly in recent years, driven by challenges associated with the shortage of electricity supply and financial constraints that are affecting the ability to sustain operations.
Eskom is on a sound operational and financial footing compared to a year ago. The organisation has been stabilised with new leadership and intensified staff engagements.
Liquidity and financial performanceThe group’s liquidity position has improved dramatically largely due to the equity injection of R23 billion from the shareholder.
Eskom is confident that its financial plan adequately addresses the concerns raised by rating agencies regarding profitability, liquidity and cost containment.
Eskom’s financial health is expected to improve slightly in the short term as it completes major investments in new and existing capacity and services debt commitments. The five-year plan will create a platform for Eskom to make a step-change in financial health over the last five years to 2026, while delivering an affordable electricity price path for South Africa.
Operational performance Plant availability improved during the year from a monthly average of 67.84% in April 2015 to 74.21% in March 2016, and as a result, the reliance on OCGTs reduced considerably. Operating challenges are being addressed by the addition of new capacity and the drive to improve plant availability (EAF) to 80% by 2021.
For more information on integrating risk and resilience refer to page 24 of the integrated report.
Internal control and combined assuranceThe board, through the audit and risk committee, ensures that internal controls are effective and adequately reported on for auditing and regulatory purposes. Eskom applies a combined assurance model in line with King III to ensure coordinated assurance activities. This model gives the audit and risk committee an overview of significant risks as well as the effectiveness of critical controls to mitigate these risks. The principles for the combined assurance model are embedded in the combined assurance framework. Eskom’s internal audit function is managed by the assurance and forensics department which reports directly to the audit and risk committee.
The directors considered the restatement in the annual financial statements as well as the irregular and fruitless and wasteful expenditure in terms of the Public Finance Management Act (PFMA). They are of the view that, despite these aspects, the control environment is adequate in relation to the preparation of the annual financial statements.
For further information regarding the restatement and irregular and fruitless and wasteful expenditure refer to notes 49 and 52 respectively in the annual financial statements.
Performance in terms of the shareholder compactThe Government of South Africa, represented by the Minister of Public Enterprises, is Eskom’s sole shareholder. Each year, in consultation with the shareholder and in line with the PFMA, Eskom agrees on its performance objectives, measures, indicators and targets. Quarterly reports are provided to the shareholder.
Eskom annually prepares a corporate plan to comply with the requirements of the PFMA and National Treasury Regulations. The consolidated corporate plan is submitted to the Department of Public Enterprises (DPE) and National Treasury in February annually. The latest plan covers the five-year period from 1 April 2016 to 31 March 2021.

Eskom Holdings SOC Ltd8
Directors’ report (continued)for the year ended 31 March 2016
Performance in terms of the shareholder compact (continued)The table below sets out Eskom's performance in terms of the key performance indicators (KPIs) in the shareholder compact that was reviewed by the external auditors.
The actual performance against the year end target is indicated as follows:
• Actual performance for the year is better than target
• Actual performance for the year is worse than target
• Actual performance for the year approximates target (within a 5% threshold)
Company
Key performance indicator Ref Unit Target Actual Actual Actual2016 2016 2015 2014
Focus on safetyEmployee lost-time injury rate (LTIR) index 0.31 • 0.30 0.33 0.31
Sustainable asset base whilst ensuring security of supplyInternal energy efficiency 11 GWh 1.20 • 1.70 10.40 19.40
Put customer at the centreEskom KeyCare index 102.00 • 104.30 108.70 108.70 Enhanced MaxiCare index 93.70 • 96.50 99.80 92.70
Improve operationsUnplanned capability loss factor (UCLF) 1 % 13.90 • 14.91 15.22 12.61 Energy availability factor (EAF) % 74.10 • 71.07 73.73 75.13 System average interruption duration index (SAIDI) 12 hours 41.00 • 38.60 36.20 37.00 System average interruption frequency index events 21.00 • 20.50 19.70 20.20 System minutes lost for events < 1 13 minutes 3.80 • 2.41 2.85 3.05
Deliver capital expansionGeneration capacity installed and commissioned (commercial operation)
MW 794 • 794 100 n/a
Generation capacity installed: Ingula Unit 3 and 4 first synchronisation in quarter 4
synchronised capacity
yes • yes n/a n/a
Transmission lines installed km 341.00 • 345.80 318.60 161.80 Transmission transformer capacity installed and commissioned 14 MVA 2 120 • 2 435 2 090 90
Reduce environmental footprint in existing fleetRelative particulate emissions kg/MWh
sent out 0.35 • 0.36 0.37 0.35
Specific water consumption l/kWh sent out
1.39 • 1.44 1.38 1.35
Implementing coal haulage and the road-to-rail migration planMigration of coal delivery from road to rail (additional tonnage transported on rail)
Mt 13.60 • 13.60 12.60 11.60
Ensure financial sustainabilityCost of electricity (excluding depreciation) R/MWh 647.66 • 640.03 610.43 541.92 Interest cover 15 ratio 0.26 • 0.46 0.25 0.52 Debt/equity (including long-term provisions) 16 ratio 2.05 • 1.73 2.70 2.21 Free funds from operations (FFO) as a % of gross debt 17 % 8.87 • 10.48 10.93 9.21 BPP savings 18 R billion 13.40 • 17.45 8.70 2.30
Human capitalTraining spend as % of gross employee benefit costs 2 % 5.00 • 4.45 6.18 7.87 Learner throughput or qualifying 3 number 1 200 • 1 108 424 n/aDisability equity in total workforce 19 % 2.50 • 2.97 3.12 2.99 Racial equity in senior management (black employees) % 63.00 • 60.90 61.58 59.50 Racial equity in professionals and middle management (black employees)
% 73.00 • 71.98 72.28 71.20
Gender equity in senior management (female employees) 4 % 32.00 • 28.07 29.83 28.90 Gender equity in professionals and middle management (female employees)
5 % 38.00 • 36.01 36.10 35.80

Annual Financial Statements | 31 March 2016 9
Company
Key performance indicator Ref Unit Target Actual Actual Actual2016 2016 2015 2014
Economic impactLocal content contracted (Eskom-wide) 20 % 65.00 • 75.22 25.13 40.80 Local content contracted (new build) 21 % 65.00 • 84.04 33.62 54.60 Percentage of broad-based black economic empowerment spend
% of TMPS 80.00 • 83.08 88.89 93.90
Procurement spend with black-owned suppliers 6 % of TMPS 40.00 • 30.98 34.91 32.70 Procurement spend with black women-owned suppliers
22 % of TMPS 12.00 • 17.72 6.61 7.20
Procurement spend with black youth-owned suppliers 7 % of TMPS 2.00 • 0.82 0.64 1.00 Procurement spend with suppliers owned by black people with disabilities
8 % of TMPS 1.00 • 0.01 – –
Procurement spend with qualifying small enterprises 9 % of TMPS 15.00 • 4.03 6.74 n/aProcurement spend with exempted enterprises 10 % of TMPS 15.00 • 4.81 5.12 n/a
Technology transferAcquisition of intellectual property 23 R million 40.00 • 54.00 n/a n/aSkills development 24 number of
people 20 • 29 n/a n/a
Job creation 25 number of people
30 • 54 n/a n/a
The reasons per indicator, where the performance per the shareholder compact is not within the tolerance threshold of 5%, are discussed below:
• Exceeded target by more than 5%
• Below target by more than 5%
Ref Key performance indicator Target 2016
Actual 2016
Reason for actual performance below target by more than 5% threshold
Improve operations1. Unplanned capability loss factor 13.90 • 14.91 Higher unplanned maintenance required due to partial load losses
and boiler tube failures
UCLF has improved from a monthly average of 16.15% in April 2015 to 11.48% in March 2016, due to a focus on reducing partial load losses and maintenance improvements
Human capital2. Training spend as % of gross
employee benefit costs5.00 • 4.45 Robust cost-savings drive through the DTC initiatives impacted
training spend
3. Learner throughput or qualifying 1 200 • 1 108
These indicators were negatively impacted by limited opportunities to recruit
4. Gender equity in senior management (female employees)
32.00 • 28.07
5. Gender equity in professionals and middle management (female employees)
38.00 • 36.01
Economic impact6. Procurement spend with
black-owned suppliers40.00 • 30.98 Some large black-owned suppliers delayed the renewing of their
B-BBEE certificates, resulting in less spend. Processes need to be enhanced to ensure that the B-BBEE administration is up to date. Eskom will focus on opportunities to increase the coal tonnages with the black-owned entities
7. Procurement spend with black youth-owned suppliers
2.00 • 0.82
The majority of these vendors have low-value contracts. The procurement spend from these suppliers is therefore small relative to Eskom’s total procurement spend. Strategies need to be established to assist these entities to meet the technical and SHEQ requirements. Processes need to be enhanced to ensure that the B-BBEE administration is up to date
8. Procurement spend with suppliers owned by black people with disabilities
1.00 • 0.01
9. Procurement spend with qualifying small enterprises
15.00 • 4.03
10. Procurement spend with exempted enterprises
15.00 • 4.81

Eskom Holdings SOC Ltd10
Performance in terms of the shareholder compact (continued)
Ref Key performance indicator Target 2016
Actual 2016
Reason for actual performance above target by more than 5% threshold
Sustainable asset base whilst ensuring security of supply
11. Internal energy efficiency 1.20 • 1.70 More effective results for projects than initially planned
Improve operations12. SAIDI 41.00 • 38.60 Continued managerial focus on maintenance and capital
investment resulted in a better than targeted performance
13. Total system minutes lost for events <1 minute
3.80 • 2.41 A new best-ever reported system minutes <1 result was achieved supported by excellent performances with various leading indicators such as the number of line faults, maintenance execution as well as improved plant availability and human performance
Deliver capital expansion14. Transmission transformer capacity
installed and commissioned2 120 • 2 435 Commissioning of the 315MVA transformer at Kookfontein
substation was accelerated due to the availability of an outage, which presented an opportunity to commission the transformer
Ensure financial sustainability15. Interest cover 0.26 • 0.46 Favourable due to higher earnings before tax and interest than
budgeted mainly due to lower primary energy costs, savings on operating costs, offset by reduced revenue. In addition the net finance costs were lower stemming from the changes to the phasing of foreign funding, cancellation of facilities and delays in drawdowns and conversion of subordinated loan from the shareholder to equity
16. Debt/equity (including long-term provisions)
2.05 • 1.73 Better than target mainly due to the conversion of the R60 billion subordinated loan from the shareholder and receipt of R23 billion equity injection from government
17. FFO as a % of gross debt 8.87 • 10.48 FFO is higher than the budget as a result of working capital adjustments and favourable cash from operations
18. BPP savings 13.40 • 17.45 Better performance mainly as a result of savings compared to budget for coal and water related costs
Human capital19. Disability equity in total workforce 2.50 • 2.97 Eskom initiated a programme to ensure that all facilities are
disabled friendly and where necessary reasonable accommodation implemented. As a result more people with disabilities could be employed
Economic impact20. Local content contracted
(Eskom-wide)65.00 • 75.22
The positive performance is because of management’s focus on procurement from local suppliers and improved reporting
21. Local content contracted (new build)
65.00 • 84.04
22. Procurement spend with black women-owned suppliers
12.00 • 17.72 The improvement is due to the new codes effective during the year which recognise spend with suppliers that are 30% owned by black women compared to 50% previously
Technology transfer23. Acquisition of intellectual property 40.00 • 54.00 These measures were included as a new initiative during the
current year. Target setting was problematic resulting in all three measures exceeding their target
24. Skills development 20 • 29
25. Job creation 30 • 54
Directors’ report (continued)for the year ended 31 March 2016

Annual Financial Statements | 31 March 2016 11
Independent auditors’ report to Parliament and the shareholder – Minister of Public Enterprises
Report on the financial statementsIntroductionWe have audited the consolidated and separate financial statements of Eskom Holdings SOC Ltd and its subsidiaries set out on pages 14 to 105, which comprise the consolidated and separate statements of financial position as at 31 March 2016, statements of comprehensive income, statements of changes in equity and statements of cash flows for the year then ended, as well as the notes, comprising a summary of significant accounting policies and other explanatory information.
Directors’ responsibility for the financial statementsThe board of directors, which constitutes the accounting authority, is responsible for the preparation and fair presentation of these consolidated and separate financial statements in accordance with International Financial Reporting Standards (IFRS) and the requirements of the Public Finance Management Act of South Africa (PFMA) and the Companies Act of South Africa (Companies Act) and for such internal control as the accounting authority determines is necessary to enable the preparation of consolidated and separate financial statements that are free from material misstatement, whether due to fraud or error.
Auditors’ responsibilityOur responsibility is to express an opinion on these consolidated and separate financial statements based on our audit. We conducted our audit in accordance with the Public Audit Act of South Africa (PAA), the general notice issued in terms thereof and International Standards on Auditing. Those standards require that we comply with ethical requirements, and plan and perform the audit to obtain reasonable assurance about whether the consolidated and separate financial statements are free from material misstatement.
An audit involves performing procedures to obtain audit evidence about the amounts and disclosures in the consolidated and separate financial statements. The procedures selected depend on the auditor’s judgement, including the assessment of the risks of material misstatement of the consolidated and separate financial statements, whether due to fraud or error. In making those risk assessments, the auditor considers internal control relevant to the entity’s preparation and fair presentation of the consolidated and separate financial statements in order to design audit procedures that are appropriate in the circumstances, but not for the purpose of expressing an opinion on the effectiveness of the entity’s internal control. An audit also includes evaluating the appropriateness of accounting policies used and the reasonableness of accounting estimates made by management, as well as evaluating the overall presentation of the consolidated and separate financial statements.
We believe that the audit evidence we have obtained is sufficient and appropriate to provide a basis for our audit opinion.
OpinionIn our opinion, the consolidated and separate financial statements present fairly, in all material respects, the financial position of Eskom Holdings SOC Ltd and its subsidiaries as at 31 March 2016 and their financial performance and cash flows for the year then ended, in accordance with IFRS and the requirements of the PFMA and the Companies Act.
Emphasis of matter We draw attention to the matter below. Our opinion is not modified in respect of this matter.
Restatement of corresponding figures As disclosed in note 49 to the financial statements, the corresponding figures for 31 March 2015 have been restated as a result of a review of the valuation techniques used to value the cross-currency swaps at 31 March 2016.
Other reports required by the Companies ActAs part of our audit of the financial statements for the year ended 31 March 2016, we have read the report by the audit and risk committee, the statement by the company secretary and the directors’ report for the purpose of identifying whether there are material inconsistencies between these reports and the audited financial statements. These reports are the responsibility of the respective preparers. Based on reading these reports we have not identified material inconsistencies between these reports and the audited financial statements in respect of which we have expressed an unqualified opinion. We have not audited these reports and accordingly do not express an opinion on them.
Report on other legal and regulatory requirements In accordance with the PAA and the general notice issued in terms thereof, we have a responsibility to report findings on the reported performance information against predetermined objectives of selected objectives presented in the annual report, compliance with legislation and internal control. We performed tests to identify reportable findings as described under each subheading but not to gather evidence to express assurance on these matters. Accordingly, we do not express an opinion or conclusion on these matters.

Eskom Holdings SOC Ltd12
Report on other legal and regulatory requirements (continued)Predetermined objectives We performed procedures to obtain evidence about the usefulness and reliability of the reported performance information of the following selected key performance areas presented in the performance in terms of the shareholder compact section in the directors’ report as set out on pages 7 to 10 of the financial statements for the year ended 31 March 2016:• improve operations • deliver capital expansion • reduce environmental footprint in existing fleet • ensure financial sustainability • economic impact
We evaluated the usefulness of the reported performance information to determine whether it was presented in accordance with the National Treasury's annual reporting principles and whether the reported performance was consistent with the planned key performance areas. We further performed tests to determine whether indicators and targets were well defined, verifiable, specific, measurable, time bound and relevant, as required by the National Treasury’s framework for managing programme performance information.
We assessed the reliability of the reported performance information to determine whether it was valid, accurate and complete.
We did not identify any material findings on the usefulness and reliability of the reported performance information for the selected key performance areas as reported in the Performance in terms of the shareholder compact section of the directors' report.
Additional matterAlthough we identified no material findings on the usefulness and reliability of the reported performance information for the selected objectives, we draw attention to the following matter:
Achievement of planned targetsRefer to the performance in terms of the shareholder compact section in the directors’ report as set out on pages 7 to 10 for information on the achievement of the planned targets for the year.
Compliance with legislationWe performed procedures to obtain evidence that the public entity had complied with legislation regarding financial matters, financial management and other related matters. Our material findings on compliance with specific matters in key legislation, as set out in the general notice issued in terms of the PAA, are as follows:
Expenditure managementEffective steps were not taken to prevent irregular expenditure amounting to R106 million as disclosed in note 52 to the financial statements, as required by section 51(1)(b)(ii) of the PFMA.
Effective steps were not taken to prevent fruitless and wasteful expenditure, amounting to R93 million as disclosed in note 52 to the financial statements, as required by section 51(1)(b)(ii) of the PFMA.
Procurement and contract managementEskom applied monetary thresholds contrary to the requirements of the Preterential Procurement Policy Framework Act (PPPFA). The amounts used in determining the appropriate bidding process applicable to specific transactions were exclusive of VAT whereas the requirement is that it should be determined using amounts inclusive of VAT.
Internal control We considered internal control relevant to our audit of the financial statements, Performance in terms of the Shareholder Compact section of the directors’ report and compliance with legislation. The matters reported below are limited to the significant internal control deficiencies that resulted in the findings on compliance with legislation included in this report.
LeadershipThe public entity’s executive management did not exercise adequate oversight responsibility regarding compliance with applicable laws and regulations which resulted in instances of irregular and fruitless and wasteful expenditure.
Financial and performance managementThe public entity’s financial statements contained material misstatements that were corrected. This was due to not assessing the reasonableness of valuation models applied on the valuation of financial instruments.
Independent auditors’ report to Parliament and the shareholder – Minister of Public Enterprises (continued)

Annual Financial Statements | 31 March 2016 13
Other reportsWe draw attention to the following engagements that could potentially impact on the public entity’s financial, performance and compliance related matters. Our opinion is not modified in respect of these engagements that are either in progress or have been completed.
InvestigationsDuring the financial year under review the group conducted investigations into alleged irregularities, fraud and corruption within the procurement environment. No material findings were identified relating to the investigations completed during the year. At the reporting date, certain investigations are still ongoing.
Audit related services and special auditsAs requested by Eskom, the following engagement was conducted for the period 1 April 2015 – 31 March 2016:• National Treasury Public Entity Consolidation Template
SizweNtsalubaGobodo IncRegistered auditor
Per A MthimunyeChartered Accountant (SA)Director
31 May 2016
Johannesburg

Eskom Holdings SOC Ltd14
Statements of financial positionat 31 March 2016
Group Company
Restated1 Restated1 Restated1 Restated1
2016 2015 2014 2016 2015 2014Note Rm Rm Rm Rm Rm Rm
AssetsNon-current 565 475 500 259 439 782 566 388 493 387 433 353
Property, plant and equipment 8 518 036 455 977 401 373 519 284 457 468 402 207 Intangible assets 9 3 138 2 904 3 016 2 944 2 746 2 810 Future fuel supplies 10 10 502 9 079 8 744 10 502 9 079 8 744 Investment in equity-accounted investees 11 360 348 318 95 95 95 Investment in subsidiaries 12 – – – 384 455 2 337 Deferred tax 13 174 230 339 – – – Loans receivable 15 70 8 646 8 654 – – – Derivatives held for risk management 16 27 600 14 303 9 274 27 600 14 303 9 274 Finance lease receivables 17 477 500 520 477 500 520 Payments made in advance 18 2 579 3 004 2 676 2 563 3 003 2 509 Trade and other receivables 19 54 2 787 27 54 3 257 16 Investment in securities 14 2 485 2 481 4 841 2 485 2 481 4 841
Current 86 268 57 686 64 977 87 644 59 442 66 862
Inventories 20 17 821 16 033 12 422 17 641 15 896 12 135 Taxation 93 94 47 – – – Loans receivable 15 10 269 329 6 352 6 553 6 665 Derivatives held for risk management 16 2 582 709 2 812 2 582 709 2 812 Finance lease receivables 17 22 20 18 22 20 18 Payments made in advance 18 3 891 2 505 2 764 3 732 2 261 2 761 Trade and other receivables 19 21 810 16 856 16 578 24 455 18 553 16 882 Investment in securities 14 7 741 6 015 6 066 2 067 2 321 3 319 Financial trading assets 14 3 844 6 322 4 265 2 657 5 143 3 226 Cash and cash equivalents 21 28 454 8 863 19 676 28 136 7 986 19 044
Non-current assets held-for-sale 22 8 942 – 147 148 – –
Total assets 660 685 557 945 504 906 654 180 552 829 500 215
EquityCapital and reserves attributable to owner of the company 180 563 117 164 118 119 172 314 110 957 113 006 LiabilitiesNon-current 404 343 366 146 312 493 403 569 364 164 310 294
Debt securities and borrowings 25 306 970 277 458 234 562 306 901 275 954 233 042 Embedded derivatives 26 5 410 6 647 7 871 5 410 6 646 7 870 Derivatives held for risk management 16 2 862 2 641 2 536 2 862 2 641 2 536 Deferred tax 13 21 000 18 154 18 813 20 621 17 848 18 194 Employee benefit obligations 28 12 405 11 960 9 922 12 094 11 665 9 674 Provisions 29 32 841 31 078 21 157 32 826 31 039 21 093 Finance lease payables 30 3 838 474 488 3 838 637 705 Trade and other payables 31 875 1 015 1 037 875 1 015 1 073 Payments received in advance 27 2 626 2 664 3 589 2 626 2 664 3 589 Deferred income 27 15 516 14 055 12 518 15 516 14 055 12 518
Current 73 971 74 635 74 181 78 297 77 708 76 915
Debt securities and borrowings 25 15 688 19 976 20 258 19 056 22 176 22 227 Embedded derivatives 26 1 615 1 375 1 461 1 615 1 375 1 461 Derivatives held for risk management 16 2 011 2 845 1 197 2 024 2 845 1 197 Employee benefit obligations 28 5 190 3 926 4 561 4 997 3 661 4 256 Provisions 29 11 415 9 972 9 601 11 198 9 807 9 102 Finance lease payables 30 90 14 12 90 70 64 Trade and other payables 31 32 319 27 984 28 531 33 739 29 267 30 062 Payments received in advance 27 3 376 2 157 2 127 3 371 2 145 2 114 Deferred income 27 957 863 774 957 863 774 Taxation 60 24 1 – – – Financial trading liabilities 14 1 250 5 499 5 658 1 250 5 499 5 658
Non-current liabilities held-for-sale 22 1 808 – 113 – – –
Total liabilities 480 122 440 781 386 787 481 866 441 872 387 209
Total equity and liabilities 660 685 557 945 504 906 654 180 552 829 500 215
1. Refer to note 49.

Annual Financial Statements | 31 March 2016 15
Income statementsfor the year ended 31 March 2016
Group Company
2016Restated1
2015 2016Restated1
2015
Note Rm Rm Rm Rm
Continuing operationsRevenue 32 163 395 147 691 163 395 147 691 Other income 33 2 390 4 444 2 471 6 645 Primary energy 34 (84 728) (83 425) (84 728) (83 425)Employee benefit expense 35 (29 257) (25 912) (24 721) (22 187)Net impairment loss 36 (1 170) (3 766) (1 159) (3 755)Other expenses 37 (18 663) (15 771) (25 170) (22 083)
Profit before depreciation and amortisation expense and net fair value loss (EBITDA) 31 967 23 261 30 088 22 886Depreciation and amortisation expense 38 (16 531) (14 115) (16 517) (14 001)Net fair value loss on financial instruments, excluding embedded derivatives 39 (1 452) (4 117) (1 492) (4 208)Net fair value gain on embedded derivatives 997 1 310 996 1 310
Profit before net finance cost 14 981 6 339 13 075 5 987 Net finance cost (7 919) (6 109) (8 776) (6 769)
Finance income 40 3 447 2 996 2 667 2 360 Finance cost 41 (11 366) (9 105) (11 443) (9 129)
Share of profit of equity-accounted investees after tax 11 43 49 – –
Profit/(loss) before tax 7 105 279 4 299 (782)Income tax 42 (2 488) (37) (1 697) 160
Profit/(loss) for the year from continuing operations 4 617 242 2 602 (622)Discontinued operationsLoss for the year from discontinued operations – (42) – –
Profit/(loss) for the year2 4 617 200 2 602 (622)
Statements of comprehensive incomefor the year ended 31 March 2016
Group Company
2016 2015 2016 2015Note Rm Rm Rm Rm
Profit/(loss) for the year2 4 617 200 2 602 (622)Other comprehensive income/(loss) 6 508 (1 155) 6 481 (1 162)
Items that may be reclassified subsequently to profit and loss 5 903 (501) 5 884 (525)
Available-for-sale financial assets – net change in fair value (57) (63) (54) (64)Cash flow hedges
Changes in fair value 16 8 955 628 8 955 628 Net amount transferred to profit or loss (126) (157) (126) (157)
Amortisation of effective portion of terminated cash flow hedges 39 (145) (100) (145) (100)Ineffective portion of cash flow hedges 39 19 (57) 19 (57)
Net amount transferred to initial carrying amount of hedged items (603) (1 136) (603) (1 136)
Foreign currency translation differences on foreign operations 21 24 – –Income tax thereon 42 (2 287) 203 (2 288) 204
Items that may not be reclassified subsequently to profit and loss 605 (654) 597 (637)
Re-measurement of post-employment medical benefits 28.1 840 (909) 830 (884)
Income tax thereon 42 (235) 255 (233) 247
Total comprehensive income/(loss) for the year2 11 125 (955) 9 083 (1 784)
1. Refer to note 49.2. A nominal amount is attributable to the non-controlling interest in the group. The remainder is attributable to the owner of the company.

Eskom Holdings SOC Ltd16
Statements of changes in equityfor the year ended 31 March 2016
Attributable to owner of the company
Share capital
Equity reserve
Cash flow
hedge reserve
Available-for-sale reserve
Unrealised fair value
reserve
Foreign currency
translation reserve
Accumulated profit
Total equity
Rm Rm Rm Rm Rm Rm Rm Rm
GroupRestated balance at 31 March 2014 – 30 520 6 178 50 (9 409) (6) 90 786 118 119
Previously reported – 30 520 6 178 50 (7 744) (6) 90 786 119 784 Prior year restatements, net of tax – – – – (1 665) – – (1 665)
Restated profit for the year – – – – – – 200 200 Other comprehensive (loss)/income, net of tax – – (479) (46) – 24 (654) (1 155)Transfer between reserves – – – – 555 – (555) –
Balance at 31 March 2015 – 30 520 5 699 4 (8 854) 18 89 777 117 164 Profit for the year – – – – – – 4 617 4 617 Other comprehensive income/(loss), net of tax – – 5 923 (41) – 21 605 6 508 Share capital issued 23 000 – – – – – – 23 000 Conversion of subordinated loan from the shareholder to share capital 60 000 (30 520) – – – – (206) 29 274 Transfer between reserves – – – – (7 858) – 7 858 –
Balance at 31 March 2016 83 000 – 11 622 (37) (16 712) 39 102 651 180 563
CompanyRestated balance at 31 March 2014 – 30 520 6 178 51 (9 409) – 85 666 113 006
Previously reported – 30 520 6 178 51 (7 744) – 85 666 114 671 Prior year restatements, net of tax – – – – (1 665) – – (1 665)
Restated loss for the year – – – – – – (622) (622)Other comprehensive loss, net of tax – – (479) (46) – – (637) (1 162)Transfer between reserves – – – – 555 – (555) – Common control transfer – – – – – – (265) (265)
Balance at 31 March 2015 – 30 520 5 699 5 (8 854) – 83 587 110 957 Profit for the year – – – – – – 2 602 2 602 Other comprehensive income/(loss), net of tax – – 5 923 (39) – – 597 6 481 Share capital issued 23 000 – – – – – – 23 000 Conversion of subordinated loan from the shareholder to share capital 60 000 (30 520) – – – – (206) 29 274 Transfer between reserves – – – – (7 858) – 7 858 –
Balance at 31 March 2016 83 000 – 11 622 (34) (16 712) – 94 438 172 314
Share capital and equity reserveRefer to note 24 for details regarding share capital. The equity reserve comprised the day-one gain on initial recognition of the subordinated loan from the shareholder. The loan was converted to share capital in the current financial year.
Cash flow hedge reserve The cash flow hedge reserve comprises the effective portion of the cumulative net change in the fair value of cash flow hedging instruments (forward exchange contracts and cross-currency swaps) related to hedged transactions that have not yet occurred. The cross-currency swap hedges foreign exchange rate risk of the future interest payments and the principal repayment on bonds and loans (denominated in US dollar, euro and yen).
Available-for-sale reserve The available-for-sale reserve comprises the cumulative net change in the fair value of available-for-sale financial assets until the investments are derecognised.
Unrealised fair value reserve The cumulative net change in the fair value of financial instruments that have not been designated as cash flow hedging instruments is recognised in profit or loss. The unrealised portion of the net change in fair value is not distributable and has been reallocated from a distributable reserve (accumulated profit) to a non-distributable reserve.
Foreign currency translation reserve The foreign currency translation reserve comprises exchange differences resulting from the translation of the results and financial position of foreign operations.
Accumulated profit Accumulated profit is the amount of cumulative profit retained in the business after tax. No dividend has been proposed in the current or prior year. There are no restrictions on the distribution of dividends.
Non-controlling interest The non-controlling interest in the group is a nominal amount.

Annual Financial Statements | 31 March 2016 17
Group Company
Note2016
Rm2015
Rm2016
Rm2015
Rm
Cash flows from operating activitiesCash generated from operations 43 34 808 27 528 32 716 25 450 Net cash flows from/(used in) derivatives held for risk management 643 (751) 622 (751)Interest received 2 322 697 2 322 696 Interest paid (11) (10) (11) (10)Income taxes paid (520) (153) – –
Net cash from operating activities 37 242 27 311 35 649 25 385
Cash flows used in investing activitiesProceeds from disposal of property, plant and equipment 360 139 302 136 Proceeds from disposal of intangible assets – 19 – 19 Acquisitions of property, plant and equipment (53 248) (51 578) (53 311) (50 409)Acquisitions of intangible assets (927) (846) (853) (795)Expenditure on future fuel supplies (1 754) (1 999) (1 754) (1 999)Increase in payments made in advance (274) (966) (274) (966)Expenditure incurred on provisions (3 054) (1 670) (3 054) (1 670)Net cash flows from derivatives held for risk management 771 253 771 253 Increase in investment in securities (1 862) (946) – – Net cash flows used in financial trading assets (24) (20) – – Decrease in loans receivable 134 77 210 135 Decrease in finance lease receivables 23 20 23 20 Net cash flows from non-current assets and liabilities held-for-sale – 1 – – Proceeds from disposal of subsidiaries and repayment of equity loan – 14 71 – Dividends received 32 29 32 19 Dividends received – investment in equity-accounted investees 11 31 19 – – Interest received 1 202 1 068 559 465
Net cash used in investing activities (58 590) (56 386) (57 278) (54 792)
Cash flows from financing activitiesDebt securities and borrowings raised 44 41 052 49 500 41 840 50 559 Payments made in advance to secure debt raised 44 (555) (187) (555) (187)Debt securities and borrowings repaid 44 (11 123) (14 429) (11 013) (15 251)Share capital issued 23 000 – 23 000 – Net cash flows from/(used in) derivatives held for risk management 44 11 847 (1 982) 11 847 (1 982)Decrease in investment in securities 44 92 3 071 92 3 071 Decrease in finance lease payables 44 (157) (111) (99) (163)Net cash flows from/(used in) financial trading assets 44 2 544 (2 534) 2 544 (2 534)Net cash flows (used in)/from financial trading liabilities 44 (4 257) 241 (4 257) 241 Interest received 1 275 1 449 1 250 1 417 Interest paid (22 791) (17 064) (22 944) (17 106)
Net cash from financing activities 40 927 17 954 41 705 18 065
Net increase/(decrease) in cash and cash equivalents 19 579 (11 121) 20 076 (11 342)Cash and cash equivalents at beginning of the year 8 863 19 676 7 986 19 044 Foreign currency translation 21 24 – – Effect of movements in exchange rates on cash held 75 284 74 284 Cash and cash equivalents transferred to non-current assets and liabilities held-for-sale (84) – – –
Cash and cash equivalents at end of the year 21 28 454 8 863 28 136 7 986
Statements of cash flowsfor the year ended 31 March 2016

Eskom Holdings SOC Ltd18
Notes to the financial statementsfor the year ended 31 March 2016
1. General information Eskom Holdings SOC Ltd (Eskom), a state-owned company and holding company of the group, is incorporated and domiciled in the Republic of South Africa. Eskom is a vertically integrated operation that generates, transmits and distributes electricity to industrial, mining, commercial, agricultural, redistributors (metropolitan and other municipalities), and residential customers and to international customers in southern Africa. Eskom also purchases electricity from Independent Power Producers (IPPs) and international suppliers in southern Africa. These represent the significant activities of the group. The business focus of the subsidiaries is to primarily support the electricity business. The nature of the businesses of the significant operating subsidiaries is set out in note 12.
2. Summary of significant accounting policies The principal accounting policies applied in the preparation of these separate and consolidated financial statements are set out below.
2.1 Basis of preparation and measurement Statement of compliance The consolidated financial statements of Eskom at and for the year ended 31 March 2016 comprise the company, its subsidiaries, joint ventures, associates and structured entities (together the group). The separate and consolidated financial statements have been prepared in accordance with IFRS and in the manner required by the PFMA and the Companies Act. The financial statements have been prepared on the going-concern basis.
Basis of measurement The separate and consolidated financial statements are prepared on the historical-cost basis except for the following items which are measured at fair value: • investment in securities • derivatives held for risk management • financial trading assets • financial trading liabilities • embedded derivatives • non-current assets and liabilities held-for-sale
Estimates and underlying assumptions are reviewed on an ongoing basis and are based on historical experience and other factors, including expectations of future events that are believed to be reasonable under the circumstances. Revisions to accounting estimates are recognised in the period in which the estimates are revised. The areas involving a higher degree of judgement or complexity, or areas where assumptions and estimates are significant to the consolidated financial statements, are disclosed in note 4.
Functional and presentation currency The consolidated financial statements are presented in South African rand (rounded to the nearest million unless otherwise stated), which is the company’s functional currency and the presentation currency of the group.
Changes in accounting policies and comparability The group has consistently applied the accounting policies to all periods presented in these consolidated financial statements except for new or revised statements and interpretations implemented during the year. The nature and effect of new standards and interpretations are discussed in note 51.2.
2.2 Consolidation Subsidiaries Subsidiaries are consolidated from the date on which control is transferred to the group until the date that control ceases. Investments in subsidiaries are accounted for at cost less impairment losses in the separate financial statements of the company. When the group ceases to have control of an entity, it derecognises the assets and liabilities of the subsidiary and any components of equity. Any resulting gain or loss is recognised in profit or loss. Any interest retained in the former subsidiary is measured at fair value when control is lost.
The group treats transactions with non-controlling interests that do not result in a loss of control as transactions with equity owners of the group. For such purchases from non-controlling interests, the difference between any consideration paid and the relevant share acquired of the carrying value of net assets of the subsidiary is recorded in equity. Gains or losses on disposals of non-controlling interests are also recorded in equity.
The group accounts for common control transactions using the book value (predecessor) method of accounting. In applying the book value method, the acquirer in a common control transaction recognises the assets and liabilities acquired using the book values in the financial statements of the relevant entity. Any difference between the consideration paid and the book values of the assets and liabilities acquired is recognised directly in equity. Common control transactions, in which the company is the ultimate parent entity both before and after the transaction, are accounted for at book value in the company’s annual financial statements with no gain or loss recognised in profit or loss.
Investment in equity-accounted investees Investments in equity-accounted investees (associates and joint ventures) are accounted for at cost less impairment losses in the separate financial statements of the company and on the equity method of accounting in the financial statements of the group. The group’s share of post-acquisition profits or losses of these investments is recognised in profit or loss within share of profit of equity-accounted investees, and its share of post-acquisition movements in other comprehensive income is recognised directly in other comprehensive income. The cumulative post-acquisition movements are adjusted against the carrying amount of the investment. When the group’s share of losses in an associate or joint venture equals or exceeds its interest in the associate or joint venture, including any other unsecured receivables, the group does not recognise further losses, unless it has incurred obligations or made payments on behalf of the associate or joint venture.

Annual Financial Statements | 31 March 2016 19
Accounting policies of associates or joint ventures have been adjusted where necessary to ensure consistency with the policies adopted by the group. If the financial statements of the associate or joint venture are prepared as of a different date to that of the group (maximum of three months difference), adjustments are made to the group financial statements for significant transactions and events that occur between the date of the financial statements of the associate or joint venture and the date of the financial statements of the group.
2.3 Foreign currency translation Transactions and balances Foreign currency transactions are translated into the functional currency using the exchange rates prevailing at the dates of the transactions. Foreign exchange gains and losses resulting from the settlement of such transactions and from the translation at year end exchange rates of monetary assets and liabilities denominated in foreign currencies are recognised in profit or loss, except when recognised in other comprehensive income for qualifying cash flow hedges.
Changes in the fair value of monetary securities denominated in foreign currency classified as available-for-sale are analysed between translation differences resulting from changes in the amortised cost of the security, and other changes in the carrying amount of the security. Translation differences relating to changes in the amortised cost are recognised in profit or loss and other changes in the carrying amount are recognised in other comprehensive income within available-for-sale financial assets.
Non-monetary items are measured at historical cost. Translation differences on non-monetary financial assets and liabilities, such as equities held at fair value through profit or loss, are recognised in profit or loss as part of the fair value gain or loss. Translation differences on non-monetary financial assets, such as equities classified as available-for-sale, are recognised in other comprehensive income within available-for-sale financial assets.
Foreign loans are initially recognised at the exchange rate prevailing at transaction date and are translated at spot rate at every reporting date. Foreign exchange gains and losses that relate to loans and receivables, debt securities and borrowings are presented in profit or loss within net fair value gain/loss on financial instruments, excluding embedded derivatives.
Foreign operations The assets and liabilities of foreign operations (including fair value adjustments arising on acquisition) are translated to rand at the prevailing exchange rates at the reporting date. The income and expenses of foreign operations are translated to rands at the average exchange rate. Foreign currency differences arising as a result of these transactions are recognised in other comprehensive income within the foreign currency translation reserve.
2.4 Property, plant and equipment Property, plant and equipment is stated at cost less accumulated depreciation and impairment losses. Cost includes environmental rehabilitation costs, borrowing costs and transfers from equity of any gains or losses on qualifying cash flow hedges of foreign currency transactions. Works under construction includes cost of materials and direct labour and any other directly attributable costs incurred in bringing an item of property, plant and equipment to its present location and condition. Significant parts of an item of property, plant and equipment that have different useful lives are accounted for as separate items (major components). Spare parts classified as strategic and critical spares are recognised as property, plant and equipment.
Subsequent costs are capitalised only when it is probable that future economic benefits associated with the item will flow to the group and the cost of the item can be measured reliably. When part of an asset is being replaced, the carrying amount of the replaced part is derecognised. Repairs and maintenance are charged to profit or loss during the financial period in which they are incurred.
If an item of property, plant and equipment is received from customers, an assessment is made to whether that item of property, plant and equipment can be recognised in accordance with IAS 16 Property, plant and equipment. Any related revenue is recognised in accordance with IAS 18 Revenue.
Land is not depreciated. Depreciation on other assets is calculated using the straight-line method to allocate cost over the estimated useful lives (limited to residual values), as follows:
Years
Buildings and facilities 10 to 40Plant• Generating 6 to 80• Transmitting 5 to 40• Distributing 10 to 35• Test, telecommunication and other plant 3 to 20Equipment and vehicles 1 to 10
The depreciation method, residual values and useful lives of assets are reviewed, and adjusted if appropriate, at each reporting date.
Gains or losses on disposal of an item of property, plant and equipment is recognised in profit or loss within other income or other expenses. Projects in works under construction that have been discontinued are written off and included in other expenses.

Notes to the financial statements (continued)for the year ended 31 March 2016
Eskom Holdings SOC Ltd20
2. Summary of significant accounting policies (continued)2.5 Intangible assets
Research and development Research expenditure is recognised as an expense as incurred.
Development expenditure (relating to the design and testing of new or improved products) is capitalised only if the expenditure can be measured reliably, the product or process is technically and commercially feasible, future economic benefits are probable and the group intends to and has sufficient resources to complete development and to use or sell the asset. Otherwise, it is recognised in profit or loss within other expenses. Subsequent to initial recognition, development expenditure is measured at cost less accumulated amortisation and any accumulated impairment losses.
Development costs previously recognised as an expense are not recognised as an asset in a subsequent period. Development costs previously capitalised that have been discontinued are written off and included in other expenses.
Rights Rights consist mainly of servitudes and rights of way under power lines. A servitude right is granted to Eskom for an indefinite period (useful life) and is therefore not amortised. The life of the servitude will remain in force as long as the transmission or distribution line is used to transmit electricity. Normally a servitude will only become impaired if the line to which the servitude is linked is derecognised. In practice, a derecognised line will be refurbished or replaced by a new line and therefore the likelihood of an impairment of a servitude right is remote.
Computer software Computer software and licences that are acquired have a finite useful life and are measured at cost less accumulated amortisation and impairment losses. If software is integral to the functionality of related equipment, then it is capitalised as part of the equipment. Costs associated with maintaining computer software programs are recognised as an expense as incurred.
Amortisation is calculated using the straight-line method to allocate costs over the estimated useful lives, as follows:
Years
Computer software 2 to 5Licences 2 to 5
Amortisation methods, useful lives and residual values are reviewed at each reporting date and adjusted if appropriate.
Concession assets Concession assets consist of the right to charge for the usage of the infrastructure under service concession arrangements. The capital expenditure incurred in respect of the service concession arrangements (fair value at initial recognition), including borrowing costs on qualifying capital expenditures is capitalised (refer to note 2.7) and amortised over their estimated useful life, which is the concession period during which they are available for use (refer to note 23).
2.6 Impairment of non-financial assets The carrying amounts of non-financial assets, other than inventories, deferred tax assets and tax, are reviewed at each reporting date to determine whether there is any indication of impairment. These assets are also reviewed for impairment whenever events or changes in circumstances indicate that the carrying amount may not be recoverable. Assets that have an indefinite useful life (servitude rights) are tested annually for impairment.
Assets are grouped at the lowest levels for which there are separately identifiable cash flows (cash-generating units) when assessing for impairment. If any indication of impairment exists the asset’s recoverable amount is estimated. The recoverable amount is the higher of an asset’s fair value less costs to sell and value in use. Value in use is based on the estimated future cash flows, discounted to their present value using a pre-tax discount rate that reflects current market assessments of the time value of money and the risks specific to the asset or cash-generating units. An impairment loss is recognised for the amount by which the asset’s carrying amount exceeds its recoverable amount. Non-financial assets that were subject to impairment are reviewed for possible reversal of the impairment at each reporting date. Impairment losses or reversals are recognised in profit or loss within net impairment loss.
2.7 Capitalisation of borrowing costs Borrowing costs attributable to the construction of qualifying assets are capitalised as part of the cost of these assets over the period of construction, until the asset is substantially ready for its intended use, to the extent that the assets are financed by borrowings. The capitalisation rate applied is the weighted average of the borrowing costs applicable to the borrowings of the entities in the group unless an asset is financed by a specific loan, in which case the specific rate is used.
2.8 Leases Finance leases – where the group is the lessee Finance lease payables comprise mainly of arrangements that contain finance leases in terms of IFRIC 4 Determining whether an arrangement contains a lease. The leased assets include plant, mining assets and equipment and vehicles.
Finance leases are capitalised on commencement of the lease at the lower of the fair value of the leased asset and the present value of the minimum lease payments. The finance cost is charged to profit or loss over the lease period to produce a constant periodic rate of interest on the remaining balance of the liability for each period. Property, plant and equipment acquired under finance leases are depreciated over the shorter of the useful life of the asset and the lease term. Finance lease payables are derecognised in accordance with the derecognition requirements for financial liabilities.

Annual Financial Statements | 31 March 2016 21
Finance leases – where the group is the lessor Finance lease receivables mainly comprise premium power supply equipment contracts.
The present value of the lease payments is recognised as a receivable when property, plant and equipment are leased out under a finance lease. The difference between the gross receivable and the present value of the receivable is disclosed as unearned finance income within finance lease receivables. Lease income is recognised over the term of the lease using the net investment method, which reflects a constant periodic rate of return. Finance lease receivables are assessed for impairment and derecognised in accordance with the requirements for financial assets.
Operating leases Leases where substantially all of the risks and rewards of ownership are not transferred are classified as operating leases. Payments made under operating leases (net of any incentives received from the lessor) are charged to profit or loss within other expenses on a straight-line basis over the period of the lease. Payments received under operating leases are recognised in profit or loss within other income on a straight-line basis over the period of the lease.
2.9 Payments made in advance Securing debt raised Prepayments made to lenders for the commitment and issuing fees incurred in raising debt.
Environmental rehabilitation trust fund Contributions are made by Eskom to environmental rehabilitation trust funds that were established to fund the financial obligation in respect of the rehabilitation of certain coal mines from which Eskom sources its coal for the generation of electricity. The trust funds are controlled by third parties and will be solely used for the environmental rehabilitation of the relevant coal mines. The contributions made to the trust funds has been recognised separately from the environmental rehabilitation provision in accordance with the requirements of IFRIC 5 Rights to Interests arising from Decommissioning, Restoration and Environmental Rehabilitation Funds.
Other Other payments made in advance comprise mainly of payments made to suppliers to reserve manufacturing capacity for the future construction of assets. These amounts will be used as partial settlement towards the future amounts payable to the suppliers. There is no contractual right to receive a refund in cash or another financial instrument from the suppliers. In the event of default or non-performance, there are performance bonds in place that can be used to recover outstanding payments in advance.
2.10 Financial instruments 2.10.1 Non-derivative financial instruments
Recognition, measurement and derecognition of financial assets Non-derivative financial assets comprise investment in securities, financial trading assets, loans receivable, trade and other receivables, finance lease receivables and cash and cash equivalents.
All non-derivative financial assets are recognised on the date of commitment to purchase (trade date). Non-derivative financial assets net of any directly attributable transaction costs are recognised initially at fair value. Directly attributable transaction costs related to financial assets at fair value through profit or loss are recognised in profit or loss on initial recognition when incurred.
When entering into a transaction, the financial instrument is recognised initially at the transaction price which is generally the best indicator of fair value. Where fair value of the financial instrument is different from the transaction price a day-one gain or loss may arise. The day-one gain or loss is immediately recognised in profit or loss (except for embedded derivatives) within net fair value gain/(loss) on financial instruments, excluding embedded derivatives, provided that the fair value has been determined based on market-observable data. If the fair value has not been determined solely based on market-observable data, the day-one gain or loss is deferred in the statement of financial position and amortised over the term of the instrument in profit or loss.
Subsequent to initial recognition, non-derivative financial assets are measured per asset category (as stated below). The appropriate classification of the financial asset is determined at the time of commitment to acquire the financial asset.
Financial assets are derecognised when the rights to receive cash flows from the investments have expired or the group has transferred substantially all the risks and rewards of ownership. Realised gains or losses on derecognition are determined using the last-in-first-out (LIFO) method.
Financial assets at fair value through profit or loss (held-for-trading) Held-for-trading assets comprise financial trading assets. Subsequent to initial recognition, changes in the fair value of these financial assets are recognised in profit or loss within net fair value gain/(loss) on financial instruments, excluding embedded derivatives. The group did not designate any financial assets at fair value through profit or loss.
Loans and receivables Loans and receivables comprise trade and other receivables, loans receivable and cash and cash equivalents.
The group’s main business activity is the sale of electricity in its licensed areas of supply. Receivables arising from these sales are classified as trade receivables. All other receivables are classified as other receivables.
Cash and cash equivalents comprise balances with local and international banks, monies in call accounts, unsettled deals, short-term assets and money market assets with an original maturity of less than 90 days. Bank overdrafts are included within debt securities and borrowings in current liabilities on the statement of financial position.

Notes to the financial statements (continued)for the year ended 31 March 2016
Eskom Holdings SOC Ltd22
2. Summary of significant accounting policies (continued)2.10 Financial instruments (continued)2.10.1 Non-derivative financial instruments (continued)
Recognition, measurement and derecognition of financial assets (continued)Loans and receivables (continued)Subsequent to initial recognition, loans and receivables are measured at amortised cost using the effective interest method, less any accumulated impairment losses.
Loans and receivables are assessed for indicators of impairment at the reporting date to determine whether there is any objective evidence of impairment. Individually significant financial assets are tested for impairment on an individual basis. The remaining financial assets are assessed collectively in groups that share similar credit risk characteristics.
An impairment loss is calculated as the difference between its carrying amount and the present value of the estimated future cash flows discounted at the original effective interest rate. Where an asset has been impaired, the carrying amount of the asset is reduced through an allowance account.
The group has an allowance for impairment that represents its estimate of incurred losses. This allowance consists of a specific loss component that relates to individual exposures, and a collective loss component established for groups of similar receivables in respect of losses that have been incurred but not yet identified.
Loans and receivables that would otherwise have been impaired but have been renegotiated are initially accounted for as impaired receivables immediately after having been renegotiated. Once a payment history in terms of the renegotiated agreement is established the same impairment assessment as applicable to receivables that have not been renegotiated is applied to assess whether the receivable should be impaired or not. Impairment losses are recognised in profit or loss within net impairment loss. An impairment loss is reversed if the reversal can be related objectively to an event occurring after the impairment loss was recognised.
Available-for-sale f inancial assets Available-for-sale assets comprise investment in securities. Subsequent to initial recognition, available-for-sale financial assets are measured at fair value and changes therein, other than foreign exchange gains and losses (for monetary items), are recognised in other comprehensive income within available-for-sale financial assets. When the asset is derecognised, the cumulative gain or loss in equity is transferred to profit or loss.
Recognition, measurement and derecognition of financial liabilities Non-derivative financial liabilities comprise debt securities and borrowings, financial trading liabilities, finance lease payables and trade and other payables.
Non-derivative financial liabilities are recognised initially at fair value net of any directly attributable transaction costs except for financial liabilities at fair value through profit or loss. Directly attributable transaction costs related to liabilities recognised at fair value through profit or loss are recognised in profit or loss on initial recognition when incurred. Subsequent to initial recognition, non-derivative financial liabilities are measured at amortised cost or fair value as per the relevant liability category.
All non-derivative financial liabilities are recognised on the date of commitment (trade date) and are derecognised when the obligation expires, is discharged or cancelled, or there is a substantial modification to the terms of the liability. Realised gains and losses are determined using the LIFO method.
Fees paid on the establishment of loan facilities are recognised as transaction costs of the loan and are recorded as a prepayment where it is probable that some or all of the facility will be drawdown. The fee paid is deferred until the drawdown occurs and upon drawdown the fee is transferred to the loan facility and then is amortised from the date of first drawdown to final maturity of each facility.
Financial liabilities at fair value through profit or loss (held-for-trading) Held-for-trading liabilities comprise financial trading liabilities. Subsequent to initial recognition, financial liabilities at fair value through profit or loss continue to be measured at fair value. The group did not designate any financial liabilities at fair value through profit or loss.
Financial liabilities at amortised cost Financial liabilities at amortised cost comprise debt securities and borrowings (that are not held for trading) and trade and other payables. Subsequent to initial recognition, these liabilities are measured at amortised cost using the effective interest method.
Eskom partakes in market-making activities in a bid to reduce the funding cost of the company. Most investors place a premium on the liquidity of bonds and are therefore prepared to accept a lower yield (relative to alternative bonds) to invest in bonds where the issue sizes are large and deemed to be liquid. Eskom bonds used for market-making are accounted for as financial liabilities at amortised cost. The risks of market-making include the anticipated loss on turnover, typically the bid/offer spread thereon, which is partially mitigated through repurchase agreement opportunities. In addition there is the potential negative impact on liquidity which Eskom believes is limited due to the strategy of holding sufficient liquidity buffers as well as a portfolio of liquid government bonds.
2.10.2 Financial guarantees Financial guarantee liabilities are initially recognised at fair value, and the initial fair value is amortised over the life of the financial guarantee. The guarantee liability is subsequently carried at the higher of this amortised cost and the present value of any expected payment (when a payment under the guarantee has become probable). Financial guarantees are included within other liabilities. Financial guarantees are valued initially by taking into account discounted future cash flows adjusted according to the probability of occurrence of the trigger event. The resultant guarantee is raised as a liability, with the costs being charged to profit or loss. The unprovided portion is disclosed as a contingent liability. As a result of using discounted cash flows, interest rate risk may arise due to the possibility of the actual yields on assets being different from the rates assumed in the discounting process.

Annual Financial Statements | 31 March 2016 23
2.10.3 Derivative financial instruments and hedging activities Recognition Derivative instruments are included in the statement of financial position as derivatives held for risk management. Derivatives are classified as held-for-trading instruments, unless they meet the criteria for hedge accounting and have been designated for purposes of applying hedge accounting. Derivatives are initially recognised at fair value and re-measured subsequently at fair value.
Cash flow hedges The relationship between hedging instruments and hedged items, as well as risk management objectives and the strategy for undertaking various hedging transactions are documented at the inception of a transaction. The group also documents its assessment, both at hedge inception and on an ongoing basis, of whether the derivatives that are used in hedging transactions are highly effective in offsetting changes in fair values or cash flows of hedged items.
Realised and unrealised gains or losses on derivatives used for hedge accounting (cash flow hedging) are recognised in other comprehensive income within cash flow hedges.
A hedging derivative is classified as a non-current asset or liability when the remaining period of the hedged item is more than 12 months; and as a current asset or liability when the remaining period of the hedged item is less than 12 months.
Significant day-one gains and losses are deferred in the statement of financial position (derivatives held for risk management) and amortised over the term of the hedging instrument to profit or loss. Day-one gains and losses on hedging instruments are predominantly a function of the inclusion of credit, liquidity and risk in the terms of the trading instrument. These risks are not included in the determination of a hypothetical derivative used to measure fair value movements in a hedged item and are therefore excluded from any hedge accounting relationships. The effective portion of the changes in the fair value of derivatives that are designated and qualify as cash flow hedges is recognised in other comprehensive income within cash flow hedges. The gain or loss relating to the ineffective portion is recognised immediately in profit or loss within net fair value gain/(loss) on financial instruments, excluding embedded derivatives.
Any cumulative gain or loss existing in other comprehensive income is included in the initial cost of the carrying amount of the asset or liability when the forecast transaction results in the recognition of a non-financial asset or non-financial liability. Gains and losses recognised in the hedging reserve in other comprehensive income will therefore affect profit or loss in the periods during which the relevant non-financial assets are depreciated or finance cost is recognised for the relevant financial liability.
When a hedging instrument expires, is sold or a hedge no longer meets the criteria for hedge accounting, any cumulative gain or loss existing in equity at that time remains in other comprehensive income until the forecast transaction occurs. When a forecast transaction is no longer expected to occur, the cumulative gain or loss that was reported in other comprehensive income is immediately transferred to profit or loss within net fair value gain/(loss) on financial instruments, excluding embedded derivatives.
Economic hedging Certain derivative instruments do not qualify for hedge accounting and are used for economic hedging. Changes in the fair value of these derivative instruments (realised and unrealised gains or losses) are recognised in profit or loss within net fair value gain/(loss) on financial instruments, excluding embedded derivatives.
2.10.4 Repurchase and resale agreements Securities sold subject to repurchase agreements are disclosed in the financial statements as financial trading assets. The liability to the counterparty is recorded as repurchase agreements and is included in financial trading liabilities. Securities purchased under agreements to resell are recorded as repurchase agreements and are included in financial trading assets or in investments in securities. The difference between the sale and repurchase price or purchase and resale price is treated as interest accrued over the life of the repurchase or resale agreement using the effective-yield method.
2.10.5 Embedded derivativesRecognition Embedded derivatives that are not separated from the host contract are effectively accounted for as part of the hybrid instrument. Non-option based derivatives are separated on terms that result in a fair value of zero at the date of inception. Option-based derivatives are separated on the terms stated in the contracts and will not necessarily have a fair value equal to zero at the initial recognition of the embedded derivative resulting in day-one gains or losses. These day-one gains or losses are recognised over the period of the agreement. The fair value will depend on the strike price at inception.
The determination of the host contract of an electricity contract (which includes an embedded derivative) is based on the standard electricity tariff specified in the contract and where no standard tariff is specified, the tariff that would best fit the profile of such a customer.
The changes in fair value of embedded derivatives are included in net fair value gain/(loss) on embedded derivatives in profit or loss. The impact of the fair value gains or losses is taken into account in the calculation of current and deferred taxation.
For details regarding measurement of embedded derivatives refer to note 4.1.

Notes to the financial statements (continued)for the year ended 31 March 2016
Eskom Holdings SOC Ltd24
2. Summary of significant accounting policies (continued)2.11 Future fuel supplies
Coal Non-refundable advances to suppliers, together with related borrowing costs thereon, are deferred in the statement of financial position within future fuel supplies and amortised against the cost of coal supplied on the basis of the estimated life of the asset procured by the suppliers. Repayable advances to suppliers are capitalised and the related interest earned is credited to profit or loss within finance income. Refunds are repaid in terms of the agreements.
Nuclear Fuel assemblies in the process of fabrication are stated at cost within future fuel supplies. Hedge accounting is applied to foreign exchange contracts entered into with respect to the purchase of nuclear fuel, with the effective portion being capitalised during the fabrication period.
2.12 Inventories Coal, liquid fuel, maintenance spares and consumables Inventories are stated at the lower of cost and net realisable value. Cost is determined on the weighted average basis and includes expenditure incurred in acquiring inventories, production and conversion costs and other costs incurred in bringing inventory to its present location and condition.
Nuclear fuel Nuclear fuel is stated at the lower of cost and net realisable value. Cost is determined on the first-in-first-out (FIFO) basis. Nuclear fuel consists of raw materials, fabricated fuel assemblies and fuel in reactors. Costs of inventories include the transfer from equity of any gains/losses on qualifying cash flow hedges relating to purchases of raw materials.
2.13 Share capital Ordinary shares are classified as equity. Incremental costs directly attributable to the issue of ordinary shares, net of any tax effects, are recognised as a deduction from equity.
2.14 Income tax Income tax expense is recognised in profit or loss except to the extent that it relates to items recognised in other comprehensive income or equity, in which case it is recognised on that basis.
2.15 Deferred tax Deferred tax is recognised on temporary differences arising between the carrying amounts of assets and liabilities for financial reporting purposes and the amounts used for taxation purposes. Deferred tax is determined using tax rates (and laws) enacted or substantively enacted at the reporting date and that are expected to apply when the related deferred tax asset is realised or the deferred tax liability is settled. Deferred tax assets are reviewed at each reporting date and reversed if it is no longer probable that the related tax benefits will be realised. The measurement of deferred tax reflects the tax consequences that would follow from the manner in which the group expects, at the reporting date, to recover or settle the carrying amount of its assets and liabilities.
Deferred tax is not recognised for: • temporary differences on the initial recognition of assets or liabilities in a transaction other than a business combination that
at the time of the transaction affects neither accounting nor taxable profit or loss and • temporary differences relating to investments in subsidiaries and associates to the extent that the group is able to control the
timing of the reversal of the temporary differences and it is probable that they will not reverse in the foreseeable future
Deferred tax assets are recognised for unused tax losses, unused tax credits and deductible temporary differences to the extent that it is probable that future taxable profit will be available against which the temporary differences can be utilised. Deferred tax is also recognised in respect of temporary differences arising on the assets and provisions created in respect of decommissioning and nuclear waste management and closure, pollution control and rehabilitation. Future taxable profits are determined based on business plans for individual subsidiaries in the group.
2.16 Payments received in advance Payments received in advance consist mainly of capital contributions received from customers for the construction of assets and government grants received for electrification and energy efficiency initiatives.
Capital contributions received for the construction of regular distribution and transmission assets (with a standard supply) after 30 June 2009 are recognised in profit or loss within other revenue immediately when the customer is connected to the electricity network. Capital contributions received before 30 June 2009 are allocated to deferred income when the customer is connected to the electricity network (refer to note 2.17).
Government grants for energy efficiency initiatives are recognised in profit or loss within other expenses when the related expenses are incurred. Government grants for electrification are recognised in deferred income when the related asset has been connected to the electricity network (refer to note 2.17).

Annual Financial Statements | 31 March 2016 25
2.17 Deferred income Capital contributions received from customers Contributions received in advance from electricity customers up to 30 June 2009 for the construction of regular distribution and transmission assets (with a standard supply) and allocated to deferred income when the related asset has been connected to the electricity network, are credited to profit or loss within other revenue on a straight-line basis over the expected useful lives of the related assets (refer to note 2.16).
Grants Government grants received relating to the creation of electrification assets are included in liabilities as deferred income and are credited to profit or loss within depreciation and amortisation expense on a straight-line basis over the expected useful lives of the related assets.
2.18 Employee benefit obligations Annual and performance bonus The annual and performance bonus is a short-term employee benefit which is expensed as the related services are provided. A liability is recognised for the amount expected to be paid if the group has a present legal or constructive obligation to pay this amount as a result of past service provided by the employee and the obligation can be estimated reliably. A liability for annual bonuses is accrued on a proportionate basis as services are rendered. A liability for performance bonus is raised on the estimated amount payable in terms of the incentive scheme which is based on the business and employees’ performance in the applicable year.
Occasional and service leave The liability for occasional and service leave is of a long-term nature in terms of IAS 19 Employee benefits as it is not expected to be settled wholly within 12 months after the reporting period but there is no unconditional right to defer settlement for at least 12 months after the reporting period resulting in the full provision being presented as current in the statement of financial position.
An actuarial valuation is performed on an annual basis for occasional and service leave. The accrued liabilities are determined by valuing all future leave expected to be taken and payments expected to be made in respect of benefits up to the valuation date. Allowance has been made in the calculations for the assumed benefit options employees will exercise, as well as salary increases and investment returns up to the date the benefit is received. All actuarial gains or losses and past service costs are recognised in profit or loss within employee benefit expense. The present values of the benefit are determined by using government bonds which have maturities similar to the liability.
Pension benefits Pension benefits are provided for employees through the Eskom Pension and Provident Fund. Contributions to the fund are based on a percentage of pensionable emoluments and are expensed in the period in which they are incurred. The group accounts for its pension obligations as a defined contribution plan in line with IAS 19 Employee benefits. Additional disclosures relating to the pension benefits have been included in note 28.4 to enable users of financial statements to understand the impact of the particular transaction.
Post-employment medical benefits The liability for post-employment medical benefits is the present value of the obligation determined by using government bonds which have maturities similar to the liability. Provision is made by accounting for the estimated cost over the expected period to retirement of the employees. The cost to the employer, in the form of employer contributions, is determined by using the projected unit credit method, with actuarial valuations being carried out at reporting date. Actuarial gains or losses are recognised in other comprehensive income within re-measurements of post-employment medical benefits. Interest expense and other expenses related to these benefits are recognised in profit or loss.
The entitlement to these benefits is usually conditional on the employee remaining in-service up to retirement. All employees qualify for post-employment medical benefits, except for new employees appointed on or after 1 June 2003 at a managerial level. The group accounts for its post-employment medical benefits obligation as a defined benefit plan in line with IAS 19 Employee benefits.
If the benefits are changed or curtailed, the resulting change in benefits that relates to past service or the gain or loss on curtailment is recognised immediately in profit or loss. The group recognises gains or losses on the settlement of a defined benefit plan when the settlement occurs. A settlement occurs when payments are made to employees to eliminate any further liabilities.
A curtailment will occur when the group significantly reduces the number of employees covered by a termination plan. Curtailment gains and losses are accounted for as past service costs, which are recognised in profit or loss immediately in the period when the termination plan is amended.
Termination benefits A liability and expense for termination benefits is recognised by the group when the group can no longer withdraw the offer of those benefits.

Notes to the financial statements (continued)for the year ended 31 March 2016
Eskom Holdings SOC Ltd26
2. Summary of significant accounting policies (continued)2.19 Provisions
Provisions are recognised when the group has a present legal or constructive obligation as a result of a past event, when it is probable that an outflow of resources will be required to settle the obligation and when the amount can be reliably estimated. Provisions are not recognised for future operating losses.
Provisions are determined by discounting the expected future cash flows using a pre-tax discount rate that reflects current market assessments of the time value of money and, where appropriate, the risks specific to the liability. The increase in the provision due to the passage of time is recognised as finance cost.
A provision is raised for the estimated decommissioning cost of nuclear and other generation plant and capitalised to the cost of the plant when it is commissioned. The estimated cost of decommissioning at the end of the productive life of plant is based on engineering and technical estimates and reports from independent experts. Decommissioning costs capitalised to the cost of nuclear or other generation plant are written off on a straight-line basis over the estimated useful life of the plant.
A provision is raised for the estimated cost of closure, pollution control and rehabilitation during and at the end of the life of the mines where a legal or constructive obligation exists to reimburse coal suppliers. Closure, pollution control and rehabilitation costs capitalised are written off over the estimated useful life of the related asset. The cost of current ongoing programmes to prevent and control pollution and to rehabilitate the environment is charged to profit or loss within primary energy as incurred, unless a present legal or constructive obligation exists to recognise such expenditure, in which case a provision is created based on the best estimates available.
A provision is raised for the management of spent nuclear fuel assemblies and radioactive waste which is recognised and measured based on the latest available cost information and is charged to profit or loss within primary energy.
A provision is raised for coal-related obligations which arise out of contractual obligations as a result of delays in commissioning of the related power stations which is recognised and measured based on the best estimate of the expenditure that would be required to settle the present obligation at the end of the reporting period and is charged to profit or loss within primary energy.
Other provisions are raised based on contractual obligations and are recognised and measured based on the best estimate of the expenditure that would be required to settle the present obligation at the end of the reporting period and are charged to profit or loss within other expenses.
Provisions are updated on an annual basis for changes in the estimated timing or amount of the outflow of resources embodying economic benefits required to settle the obligation, or changes in discount rate. Changes in the liability for capitalised provisions are added to, or deducted from, the cost of the related asset. Any amount exceeding the cost of the related asset is allocated to profit and loss.
2.20 Revenue recognition Eskom’s main revenue activity is the sale of electricity which is recognised when electricity is consumed by the user. The businesses of the subsidiaries support this main activity but are not considered to be part of the main revenue activity. The activities of the subsidiaries include providing home loans, insurance, maintenance and construction services.
Revenue is recognised when significant risks and rewards of ownership have passed, the amount of revenue can be reliably measured and it is probable that future economic benefits will flow to the group.
Where it is assessed that there is a high probability that the economic benefits related to sales will not materialise, such sales are not recognised.
2.21 Finance income Finance income comprises interest receivable on loans, advances, trade receivables, finance lease receivables and income from financial market investments. Interest income is recognised as it accrues in profit or loss, using the effective interest method.
2.22 Finance cost Finance cost comprises interest payable on debt securities and borrowings and finance lease payables, interest resulting from derivatives held for risk management and interest from the unwinding of discount on liabilities. Borrowing costs which are not capitalised are recognised in profit or loss (refer to note 2.7).
2.23 Non-current assets and liabilities held-for-sale Non-current assets and liabilities (or disposal groups) which meet the definition of held-for-sale under IFRS 5 Non-current assets held-for-sale and discontinued operations are stated at the lower of their carrying amount and fair value less costs to sell if their carrying amount will be recovered principally through a sale transaction.
2.24 Related-party transactions IAS 24 Related party disclosures provides government-related entities an exemption which eliminates the requirements to disclose information that is costly to gather and of less value to users. The group applies the exemption in respect of its relationship with government-related entities at local levels of government where the transactions and related outstanding balances are not individually or collectively significant.
2.25 Net debt Gross debt is the aggregate of debt securities and borrowings and finance lease payables. To calculate net debt, gross debt is adjusted for related payments made in advance, derivatives held for risk management and financial trading instruments. Cash and cash equivalents and the investing portfolio of investment in securities are deducted.

Annual Financial Statements | 31 March 2016 27
3. Capital management and going concern 3.1 Capital management
The objective of capital management is to ensure that Eskom is sustainable over the long term.
Eskom’s funding consists of equity investments by the shareholder, funds generated from operations and funds borrowed on local and foreign debt markets with strong government support.
The government as the sole shareholder and the board have the responsibility to ensure that the group is adequately capitalised to ensure continuity of supply and that the business is attractive to investors to enable Eskom to fund the capacity expansion programme.
There were no changes to Eskom’s approach to capital management during the financial year. Eskom manages the following capital reserves:
Group Company
2016 2015 2016 2015Rm Rm Rm Rm
Share capital and equity reserve 83 000 30 520 83 000 30 520 Cash flow hedge reserve 11 622 5 699 11 622 5 699 Unrealised fair value reserve (16 712) (8 854) (16 712) (8 854)Accumulated profit 102 651 89 777 94 438 83 587
180 561 117 142 172 348 110 952
The following ratios are monitored and managed:
Group Company
Unit 2016 2015 2016 2015
Income statementEBITDA Rm 31 967 23 261 30 088 22 886 Electricity revenue per kWh c/kWh 76.53 68.52 76.53 68.52
At standard tariffs c/kWh 76.07 67.91 76.07 67.91 Adjusted for impact of embedded derivatives c/kWh 0.46 0.61 0.46 0.61
Costs per kWh c/kWh 73.24 68.40 74.54 68.87
Primary energy c/kWh 39.50 38.57 39.50 38.57 Employee benefit expense c/kWh 13.64 11.98 11.53 10.26 Net impairment loss c/kWh 1.23 2.02 1.23 2.01 Net other expenses (including other revenue and other income) c/kWh 6.79 4.58 9.78 6.48 Depreciation and amortisation expense c/kWh 7.71 6.53 7.70 6.47 Net fair value loss on financial instruments, excluding embedded derivatives c/kWh 0.68 1.90 0.70 1.95 Net finance cost c/kWh 3.69 2.82 4.10 3.13
Statement of financial positionGross debt1 Rm 359 163 328 909 362 227 329 584 Net debt Rm 266 772 272 399 270 389 274 191 Gross debt1: EBITDA ratio 11.40 16.08 12.24 16.49 Net debt: equity ratio 1.48 2.32 1.57 2.47
Statement of cash flowsFFO Rm 39 443 36 179 37 954 36 032 FFO as percentage of gross debt % 10.98 11.00 10.48 10.93 Debt service cover ratio ratio 1.03 0.87 0.96 0.79 Cash interest cover ratio 1.83 1.88 1.69 1.67
(a) Share capital and equity reserve Share capital increased by R60 billion during the year because of the conversion of the subordinated loan from the shareholder to share capital (with a reduction of R30.5 billion in the equity reserve) and with the R23 billion equity injection received from the shareholder. Refer to note 24.
(b) Cash flow hedge reserve The group applies cash flow hedge accounting on derivatives that meet the criteria for hedge accounting to align the gains and losses of the derivative with the gains and losses of the underlying hedged transactions.
1. Adjusted to also include the after tax, non-current portions of provisions and employee benef it obligations.

Notes to the financial statements (continued)for the year ended 31 March 2016
Eskom Holdings SOC Ltd28
3. Capital management and going concern (continued) 3.1 Capital management (continued)(c) Unrealised fair value reserve
The unrealised portion of the net change in fair value financial instruments that have not been designated as cash flow hedging instruments is not distributable and has been reallocated from a distributable reserve (accumulated profit) to a non-distributable reserve.
(d) Accumulated profit The major items that impact the accumulated profit of Eskom include: • the revenue received from electricity sales (which is a function of price and sales volumes) • the cost of operating the electricity business • the cost of funding the net debt of the business • the cost of expanding the business to ensure that capacity growth is in line with electricity sales demand (cost of funding and
additional depreciation)
Revenue Eskom uses the Integrated Strategic Electricity Planning process which forecasts the growth in electricity demand for the long term and evaluates the alternative means to meet and manage that demand. This information flows into the planning process. A forward electricity price curve is derived which is an indication of the size of the price increases which Eskom requires to be sustainable over the long term.
The tariff increases for the electricity business are subject to the process laid down by the National Energy Regulator of South Africa (NERSA). The current regulatory framework applicable to Eskom is the multi-year five year determination ending in 31 March 2018.
Eskom did not receive a cost reflective price in the NERSA Multi-Year Price Determination (MYPD) 3 decision which created a revenue shortfall over the MYPD 3 period which has placed strain on the financial and operating sustainability of the group.
Eskom submitted the regulatory clearing account (RCA) application for 2014 (year 1 of MYPD 3) to NERSA in 2015. NERSA announced on 1 March 2016 that the average tariff for standard tariff customers would be increased by 9.4% for the 2017 financial year.
Eskom will submit the RCA applications for the second (2015) and third years (2016) of the MYPD 3 period by July 2016, in accordance with the prevailing MYPD methodology.
Eskom will diversify its revenue in the long term by increasing the amount generated from other markets and activities.
Operating cost Eskom has implemented the BPP/DTC programmes which aims to deliver cost saving opportunities to assist in closing the revenue shortfall that resulted mainly from the NERSA MYPD 3 price determination.
Savings of R17.5 billion (2015: R8.7 billion) were achieved against a target of R13.4 billion for the year.
Cost of funding the net debt The board approved a revised borrowing programme of R327 billion for the period 1 April 2016 to 31 March 2021. A total of R31.7 billion or 46% of the funding requirement of R68.5 billion for the 2017 financial year has already been secured at 31 March 2016. Potential funding sources have been identified and plans are in place to secure these funding sources.
Eskom’s credit rating is affected by its own financial position as well as the credit rating of the sovereign, which is under threat of a downgrade.
The FFO to gross debt and gross debt to EBITDA ratios play an important role in the credit ratings given to Eskom which in turn influences the cost of funding.
Eskom’s credit ratings were as follows:
Rating Outlook
2016 2015 2016 2015
Standard and Poor’sForeign currency BB+ BB+ Negative NegativeLocal currency BB+ BB+ Negative NegativeMoody’sForeign currency Ba1 Ba1 Negative StableLocal currency Ba1 Ba1 Negative StableFitch RatingsLocal currency BBB BBB+ Stable Stable
Net debt is sourced globally to ensure the lowest cost of funding. Where funds are received and have not yet been spent, they are invested to provide the maximum possible return whilst ensuring minimal capital risk and matching the maturity term requirements of the spending of the amount. Additionally, market-making activities are undertaken to reduce the cost of issued bonds.
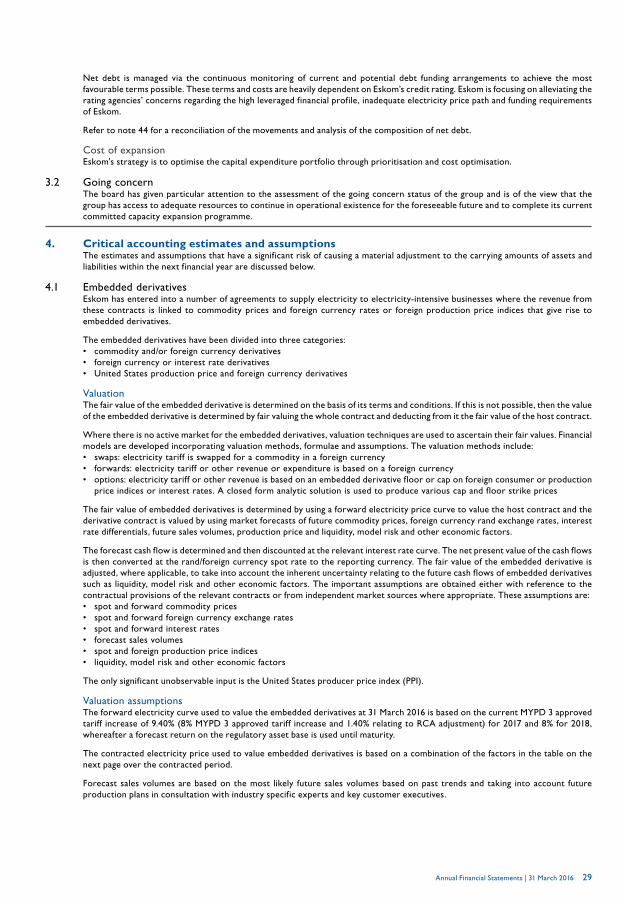
Annual Financial Statements | 31 March 2016 29
Net debt is managed via the continuous monitoring of current and potential debt funding arrangements to achieve the most favourable terms possible. These terms and costs are heavily dependent on Eskom’s credit rating. Eskom is focusing on alleviating the rating agencies’ concerns regarding the high leveraged financial profile, inadequate electricity price path and funding requirements of Eskom.
Refer to note 44 for a reconciliation of the movements and analysis of the composition of net debt.
Cost of expansion Eskom's strategy is to optimise the capital expenditure portfolio through prioritisation and cost optimisation.
3.2 Going concern The board has given particular attention to the assessment of the going concern status of the group and is of the view that the group has access to adequate resources to continue in operational existence for the foreseeable future and to complete its current committed capacity expansion programme.
4. Critical accounting estimates and assumptions The estimates and assumptions that have a significant risk of causing a material adjustment to the carrying amounts of assets and liabilities within the next financial year are discussed below.
4.1 Embedded derivatives Eskom has entered into a number of agreements to supply electricity to electricity-intensive businesses where the revenue from these contracts is linked to commodity prices and foreign currency rates or foreign production price indices that give rise to embedded derivatives.
The embedded derivatives have been divided into three categories: • commodity and/or foreign currency derivatives • foreign currency or interest rate derivatives • United States production price and foreign currency derivatives
Valuation The fair value of the embedded derivative is determined on the basis of its terms and conditions. If this is not possible, then the value of the embedded derivative is determined by fair valuing the whole contract and deducting from it the fair value of the host contract.
Where there is no active market for the embedded derivatives, valuation techniques are used to ascertain their fair values. Financial models are developed incorporating valuation methods, formulae and assumptions. The valuation methods include: • swaps: electricity tariff is swapped for a commodity in a foreign currency • forwards: electricity tariff or other revenue or expenditure is based on a foreign currency • options: electricity tariff or other revenue is based on an embedded derivative floor or cap on foreign consumer or production
price indices or interest rates. A closed form analytic solution is used to produce various cap and floor strike prices
The fair value of embedded derivatives is determined by using a forward electricity price curve to value the host contract and the derivative contract is valued by using market forecasts of future commodity prices, foreign currency rand exchange rates, interest rate differentials, future sales volumes, production price and liquidity, model risk and other economic factors.
The forecast cash flow is determined and then discounted at the relevant interest rate curve. The net present value of the cash flows is then converted at the rand/foreign currency spot rate to the reporting currency. The fair value of the embedded derivative is adjusted, where applicable, to take into account the inherent uncertainty relating to the future cash flows of embedded derivatives such as liquidity, model risk and other economic factors. The important assumptions are obtained either with reference to the contractual provisions of the relevant contracts or from independent market sources where appropriate. These assumptions are: • spot and forward commodity prices • spot and forward foreign currency exchange rates • spot and forward interest rates • forecast sales volumes • spot and foreign production price indices • liquidity, model risk and other economic factors
The only significant unobservable input is the United States producer price index (PPI).
Valuation assumptions The forward electricity curve used to value the embedded derivatives at 31 March 2016 is based on the current MYPD 3 approved tariff increase of 9.40% (8% MYPD 3 approved tariff increase and 1.40% relating to RCA adjustment) for 2017 and 8% for 2018, whereafter a forecast return on the regulatory asset base is used until maturity.
The contracted electricity price used to value embedded derivatives is based on a combination of the factors in the table on the next page over the contracted period.
Forecast sales volumes are based on the most likely future sales volumes based on past trends and taking into account future production plans in consultation with industry specific experts and key customer executives.
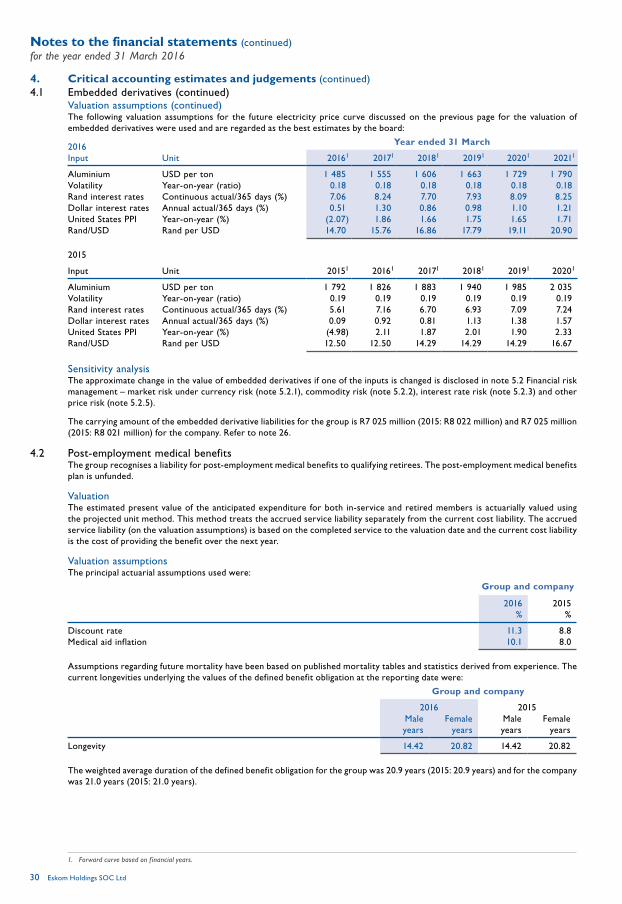
Notes to the financial statements (continued)for the year ended 31 March 2016
Eskom Holdings SOC Ltd30
4. Critical accounting estimates and judgements (continued)4.1 Embedded derivatives (continued)
Valuation assumptions (continued)The following valuation assumptions for the future electricity price curve discussed on the previous page for the valuation of embedded derivatives were used and are regarded as the best estimates by the board:
2016 Year ended 31 March
Input Unit 20161 20171 20181 20191 20201 20211
Aluminium USD per ton 1 485 1 555 1 606 1 663 1 729 1 790 Volatility Year-on-year (ratio) 0.18 0.18 0.18 0.18 0.18 0.18 Rand interest rates Continuous actual/365 days (%) 7.06 8.24 7.70 7.93 8.09 8.25 Dollar interest rates Annual actual/365 days (%) 0.51 1.30 0.86 0.98 1.10 1.21 United States PPI Year-on-year (%) (2.07) 1.86 1.66 1.75 1.65 1.71 Rand/USD Rand per USD 14.70 15.76 16.86 17.79 19.11 20.90
2015
Input Unit 20151 20161 20171 20181 20191 20201
Aluminium USD per ton 1 792 1 826 1 883 1 940 1 985 2 035 Volatility Year-on-year (ratio) 0.19 0.19 0.19 0.19 0.19 0.19 Rand interest rates Continuous actual/365 days (%) 5.61 7.16 6.70 6.93 7.09 7.24 Dollar interest rates Annual actual/365 days (%) 0.09 0.92 0.81 1.13 1.38 1.57 United States PPI Year-on-year (%) (4.98) 2.11 1.87 2.01 1.90 2.33 Rand/USD Rand per USD 12.50 12.50 14.29 14.29 14.29 16.67
Sensitivity analysis The approximate change in the value of embedded derivatives if one of the inputs is changed is disclosed in note 5.2 Financial risk management – market risk under currency risk (note 5.2.1), commodity risk (note 5.2.2), interest rate risk (note 5.2.3) and other price risk (note 5.2.5).
The carrying amount of the embedded derivative liabilities for the group is R7 025 million (2015: R8 022 million) and R7 025 million (2015: R8 021 million) for the company. Refer to note 26.
4.2 Post-employment medical benefits The group recognises a liability for post-employment medical benefits to qualifying retirees. The post-employment medical benefits plan is unfunded.
Valuation The estimated present value of the anticipated expenditure for both in-service and retired members is actuarially valued using the projected unit method. This method treats the accrued service liability separately from the current cost liability. The accrued service liability (on the valuation assumptions) is based on the completed service to the valuation date and the current cost liability is the cost of providing the benefit over the next year.
Valuation assumptions The principal actuarial assumptions used were:
Group and company
2016%
2015%
Discount rate 11.3 8.8 Medical aid inflation 10.1 8.0
Assumptions regarding future mortality have been based on published mortality tables and statistics derived from experience. The current longevities underlying the values of the defined benefit obligation at the reporting date were:
Group and company
2016 2015Male Female Male Femaleyears years years years
Longevity 14.42 20.82 14.42 20.82
The weighted average duration of the defined benefit obligation for the group was 20.9 years (2015: 20.9 years) and for the company was 21.0 years (2015: 21.0 years).
1. Forward curve based on f inancial years.

Annual Financial Statements | 31 March 2016 31
Sensitivity analysisThe effect of an increase or decrease in the assumptions is:
Group Company
Change in assumption
2016increase
2016decrease
2015increase
2015decrease
2016increase
2016decrease
2015increase
2015decrease
Rm Rm Rm Rm Rm Rm Rm Rm
Effect on aggregate current service cost and finance costDiscount rate 1% (211) 270 (177) 226 (208) 266 (174) 223 Medical aid inflation 1% 421 (326) 371 (285) 413 (320) 365 (280)Future mortality 1 year 58 (57) 48 (48) 56 (56) 47 (47)Effect on post-employment medical benefits obligationDiscount rate 1% (1 752) 2 233 (1 780) 2 295 (1 711) 2 183 (1 739) 2 244 Medical aid inflation 1% 2 199 (1 755) 2 252 (1 778) 2 150 (1 714) 2 202 (1 737)Future mortality 1 year 365 (365) 361 (361) 356 (356) 353 (352)
The carrying amount of the post-employment medical benefits liability for the group is R12 816 million (2015: R12 325 million) and R12 495 million (2015: R12 022 million) for the company. Refer to note 28.
The above sensitivity analyses are based on a change in an assumption while all other assumptions remain constant. In practice, this is unlikely to occur, and changes in some of the assumptions may be correlated. When calculating the sensitivity of the defined benefit obligation to significant actuarial assumptions, the present value of the defined benefit obligation is calculated with the projected unit credit method at the end of the reporting period which is recognised within the statement of financial position.
The methods and types of assumptions used in preparing the sensitivity analysis did not change compared to the previous period.
4.3 Occasional and service leave The group recognises a liability for occasional and service leave.
Valuation An actuarial valuation is done on an annual basis for occasional and service leave. The accrued liability is determined by valuing all future leave expected to be taken and payments to be made in respect of benefits up to the valuation date. The present value of the benefits is determined by using the yield of long-dated corporate bonds (or government bonds where high quality corporate bonds are not available).
Valuation assumptions The principal actuarial assumptions used were:
Group and company
2016 2015% %
Discount rate 11.3 8.8 General price inflation 8.1 6.0 Salary increases 9.6 7.5 Leave usage 4.0 4.0
Assumptions regarding future mortality have been based on published mortality tables and statistics derived from experience. For details regarding current longevities underlying the values of the occasional and service leave obligation at the reporting date refer to note 4.2.
Sensitivity analysis Based on current experience, only 4% (2015: 4%) of the leave is utilised. If the rate at which leave is taken is 8% (2015: 8%), then the liability will increase by R64 million (2015: R61 million).
The carrying amount of the occasional and service leave liability for the group is R1 266 million (2015: R1 237 million) and R1 198 million (2015: R1 175 million) for the company.

Notes to the financial statements (continued)for the year ended 31 March 2016
Eskom Holdings SOC Ltd32
4. Critical accounting estimates and judgements (continued)4.4 Decommissioning, mine closure and rehabilitation
Provision is made for the estimated decommissioning cost of nuclear and other generation plant and for the management of nuclear fuel assemblies and radioactive waste. Provision is made for the estimated mine-related closure, pollution control and rehabilitation costs at the end of the life of the mines, where a constructive and contractual obligation exists to pay coal suppliers.
Valuation These provisions are determined by discounting the estimated future decommissioning and rehabilitation costs.
Valuation assumptions The discount rate used for these provisions was 4.9% (2015: 4.7%) for the group and company.
Estimated payment dates The estimated payment dates of the costs are:
Group and company
2016 2015
Nuclear plant 2026 – 2041 2026 – 2041Coal and pumped storage plants 2024 – 2083 2018 – 2074Spent nuclear fuel 2019 – 2105 2018 – 2105Mine-related closure, pollution control and rehabilitation 2017 – 2074 2016 – 2073
Sensitivity analysis The carrying amount of the decommissioning, mine closure and rehabilitation provision would be an estimated R4 047 million (2015: R3 875 million) lower had the real discount rate used in the calculation of the provision increased by 1% and R5 315 million (2015: R4 885 million) higher had the real discount rate decreased by 1%.
The carrying amount of the decommissioning, mine closure and rehabilitation liabilities for the group and company is R29 596 million (2015: R24 152 million). Refer to note 29.
4.5 Coal-related obligations Provision is made for coal-related obligations which arise out of contractual obligations as a result of delays in commissioning of the related power stations.
Valuation These provisions are determined by taking consideration of the anticipated commissioning dates, future coal prices, coal utilisation and coal stock-piles.
Valuation assumptions The discount rate used for these provisions was 8.8% (2015: 4.7%) for the group and company.
The estimated payment dates of the costs are between 2017 and 2020 (2015: 2016 and 2020).
Sensitivity analysis The carrying amount of the coal-related obligations would be an estimated R277 million (2015: R268 million) lower had the anticipated commissioning dates been one month earlier than estimated and R262 million (2015: R283 million) higher had the anticipated commissioning dates been one month later than estimated.
The carrying amount of coal-related obligations liabilities for the group and company is R5 554 million (2015: R7 954 million). Refer to note 29.

Annual Financial Statements | 31 March 2016 33
5. Financial risk management Eskom’s integrated risk and resilience management process enables management to effectively assess and respond to all material risks that may affect the achievement of organisational objectives.
The group maintains an integrated risk and resilience management framework comprising governance structures, management policies and guidance standards with a focus on risk and resilience assessments, treatment plans, monitoring and reporting. The management of financial risks, as defined by IFRS 7 Financial instruments: disclosures, falls within these overarching structures, policies and standards.
Management of financial risks is delegated by the board of directors (the board) to the audit and risk committee. Day-to-day management of financial risks is carried out in the area in which the risks arise. Risk assessments, treatment plans and monitoring measures are reported to the audit and risk committee on a quarterly basis.
The group’s exposure to risk, its objectives, policies and processes for managing the risk and the methods used to measure it have been consistently applied in the years presented.
The group has exposure to the following risks as a result of its financial instruments: • credit risk – the risk of financial loss to the group if a customer or other counterparty to a financial instrument fails to meet
its contractual obligations • market risk – the risk that the fair value or future cash flows of financial instruments will fluctuate because of changes in foreign
exchange rates, commodity prices, interest rates and equity prices • liquidity risk – the risk that the group will not have sufficient financial resources to meet its obligations when they fall due, or
will have to do so at excessive cost
5.1 Credit risk 5.1.1 Financial instruments mainly managed by the treasury function
The asset and liability committee (Alco) (the role of the treasury committee has been incorporated into Alco) manages credit risk arising from the treasury department’s activities in the financial markets with the objective of maximising the rate of return on investments whilst not exceeding approved levels of credit risk exposure. It is chaired by the chief financial officer and reports on a quarterly basis to Exco and the audit and risk committee.
The committee’s terms of reference are maintained and approved by the chief financial officer. They are aligned to the Exco credit risk governance standards and are supplemented by appropriate policies and procedures.
Specific activities undertaken by the Alco include the following: • assess the credit quality of counterparties and approve credit limits based on this assessment • monitor the adherence to credit limits • approve methodologies for the management of counterparty exposure • ensure that, where applicable, transactions with counterparties are supported by trading agreements • facilitate and manage the issuing of financial guarantees by the group
To assist the Alco to discharge its mandate, the portfolio assessment section within the treasury function provides it with regular feedback on all treasury credit risk-related matters.
The management of credit risk is governed by the following policies: • trading in financial instruments is only conducted with selected counterparties after credit limits have been authorised • only financial institutions and/or counterparties with an independent minimum rating of A1 are accepted for investments. If
there are no independent ratings, the credit quality of the counterparty is assessed, taking into account its financial position, past experience and other factors
• all exposures are based on mark-to-market values. Transaction or close-out netting takes place in accordance with the terms and conditions of the underlying trading agreements
• minimum credit-rating requirements for financial institutions are maintained to assess the risk categories by rating class and to ascertain the probability of default inherent in each rating class
• approved concentration risk parameters and collateral management procedures are in place. Concentration of credit risk is managed by setting credit risk limits at a counterparty-specific level. Concentration credit risk limits are used as second tier limits in relation to counterparty credit limits. Counterparty-specific exposure is monitored against a set concentration of credit risk limits in relation to the total credit risk exposure to all counterparties
Risk is measured by determining a default probability per counterparty using default probabilities assessed by rating agencies for various types of credit ratings. These default probabilities are then applied to the market value of the investment placed to determine the capital at risk.
The treasury division’s policies and practices are designed to preserve the independence and integrity of decision-making and ensure credit risks are accurately assessed, properly approved, continually monitored and actively managed.
The following are monitored and reported on: • aggregate credit risk exposure • limits utilisation including any breaches • hold-limit exceptions • risk profile changes • risk concentrations

Notes to the financial statements (continued)for the year ended 31 March 2016
Eskom Holdings SOC Ltd34
5. Financial risk management (continued)5.1 Credit risk (continued)5.1.1 Financial instruments mainly managed by the treasury function (continued)
Where the credit risk of a particular counterparty has increased, a reassessment of the valuation of the instrument is made. In making this assessment, the counterparty is assessed for the following factors: • significance of financial difficulty • probability of bankruptcy • probability of breach of contract
Escap invests in listed shares and negotiable certificates of deposit (NCD) to satisfy its capital adequacy requirements in line with insurance regulations in South Africa. The listed shares do not expose the group to credit risk. Investments in NCDs are done with banks with a minimum credit rating of AA.
An analysis per credit rating level (as determined by rating agencies) of the following balances is presented below:
Group Company
2016 2015 2016 2015Note Rm Rm Rm Rm
Investment in securitiesAAA 3 771 2 562 3 771 2 562 AA 6 455 3 694 781 – AA- – 2 240 – 2 240
Maximum credit exposure 14 10 226 8 496 4 552 4 802
Financial trading assetsMaximum credit exposure 2 657 5 143 2 657 5 143
A1+ 2 082 3 913 2 082 3 913 A1 546 1 225 546 1 225 Unrated 29 5 29 5
No credit exposure 1 187 1 179 – –
14 3 844 6 322 2 657 5 143
Derivatives held for risk managementAAA 1 217 1 096 1 217 1 096 AA 17 763 9 935 17 763 9 935 A1+ 1 883 385 1 883 385 A+ 7 851 3 389 7 851 3 389 A1 270 199 270 199 A- 1 161 – 1 161 – A2 37 8 37 8
Maximum credit exposure 16 30 182 15 012 30 182 15 012
Cash and cash equivalentsMaximum credit exposure 28 452 9 964 28 134 9 087
A1+ 19 670 5 042 19 358 4 234 A1 8 775 4 898 8 775 4 850 Unrated 7 24 1 3
No credit exposure 2 (1 101) 2 (1 101)
21 28 454 8 863 28 136 7 986
5.1.2 Financial instruments managed by various divisions and subsidiaries (a) Trade and other receivables
Trade receivables Credit risk attributable to trade receivables is assessed taking into account the following counterparty characteristics: • geographic location of the customer (both internationally and within South Africa) • size of demand (large or small power user) • receivable ageing profile • security held (deposits and guarantees) • payment history
A large number of the residential customers are on a prepaid basis thereby eliminating credit risk relating to these customers. The group has well-established credit control procedures for conventional customers that monitor activity on customer accounts and allow for remedial action should the customer not comply with payment terms. These procedures include an internal collection process, follow up with the customer either telephonically or in person, negotiations of mutually acceptable payment arrangements and the issue of a notice of disconnection of supply and letters of demand. Non-payment can result in disconnection of supply and the customer’s account being closed. A legal collection process is pursued after disconnection.

Annual Financial Statements | 31 March 2016 35
The following strategies are currently in operation in high risk areas of non-paying customers with varying levels of success. These include: • disconnections • conversion to prepayment • use of debt collectors • payment arrangements • focus on early identification and letters of demand • increased security deposits and guarantees • efficient internal process, for example system automation of credit and collections such as automated notices and letters
of demand • adverse listing of defaulting customers
The decision to impair overdue amounts is assessed on the probability of recovery based on the individual customer’s credit risk profile and on the credit profile of the customer portfolio.
Progress on the collection process is reviewed on a regular basis and if it is evident that the amount will not be recovered, it is recommended for writeoff in terms of the group policy and delegation of authority. The process of recovery continues unless it is confirmed that there is no prospect of recovery or the costs of such action will exceed the benefits to be derived. Amounts written off are determined after taking into account the value of the security held.
The main classes of trade receivables are: • international customers • local large power users • local small power users
International customers Electricity supply agreements are entered into with key international customers who comprise utility companies and governments of neighbouring countries. Their payment terms are between 10 and 45 days. They are individually assessed for impairment.
International customers are not required to provide any security unless they default on their payment terms as they generally represent a low credit risk.
Local large power users Local large power users comprise South African redistributors (municipalities), commercial, industrial and mining customers usually with supplies above 100kVA. Payment terms are individually negotiated up to a maximum of 15 days. They are individually assessed for impairment.
Municipalities are not required to provide any security and are reassessed based on their payment history to determine if any security is necessary. Where a large power user has an acceptable credit rating from an approved rating agency the provision of a security is waived.
Certain municipalities continued to fall into arrears during the course of the financial year. Monitoring of these municipality payment levels continues to receive ongoing management attention and remains a high priority focus area. Interventions pursued included entering into special payment arrangements and following the Promotion to Administrative Justice Act for disconnections. Eskom continues to work closely with the Department of Co-operative Governance and Traditional Affairs and other government departments as well as relevant stakeholders to resolve the systemic challenges which have given rise to municipalities’ arrear debt. Interventions mandated by the collaboration war room that are currently being investigated include: • restriction of supply to non-paying municipalities if set maximum demand levels are exceeded • prioritise load shedding to the non-paying municipalities when emergencies are declared, for stage 1 load shedding and during
daily evening peak periods • limit electricity supply to the non-paying municipalities in line with what they are paying on a monthly basis • placing non-paying municipalities on a prepayment option
Local small power users These comprise local customers that have a supply of 100kVA or less in size. Payment terms for small power customers is 30 days.
New customers are required to provide security equivalent to between one and three months consumption at the commencement of the supply agreement. The level of security is reviewed if a customer defaults on their payment obligation or requires additional electricity supply capacity. In these instances, additional security is required to cover between one and three months of recent consumption before supply will commence.
Soweto receivables are an identified high-credit risk area subject to specific credit risk management. The collection of revenue from customers in Soweto remains a challenge. The enhancement of credit control strategies and monitoring of payment levels in this area continue to receive management attention. The payment levels expressed as a percentage of billed revenue (excluding interest) for the year, was 18% (2015: 16%). The residential revenue management strategy, which includes Soweto, continues to be implemented. The strategy entails implementation of split metering technology, conversion of meters to prepayment and stepping up disconnections for customers to improve payment levels.

Notes to the financial statements (continued)for the year ended 31 March 2016
Eskom Holdings SOC Ltd36
5. Financial risk management (continued)5.1 Credit risk (continued)5.1.2 Financial instruments managed by various divisions and subsidiaries (continued)(a) Trade and other receivables (continued)
Trade receivables (continued)An analysis of days outstanding is presented below:
Carrying amount
Not impaired1 Impaired
Not past due
Days past due Not past due
Days past due
0-15 16-45 46-75 >75 0-15 16-45 46-75 >75Rm Rm Rm Rm Rm Rm Rm Rm Rm Rm Rm
Group and company2016Individually assessed for impairmentInternational 1 533 845 528 152 8 – – – – – –
Gross 1 533 845 528 152 8 – – – – – – Impairment – – – – – – – – – – –
Local large power users – municipalities 6 647 4 157 65 42 – – 1 015 70 295 208 795
Gross 9 861 4 157 65 42 – – 1 096 200 553 348 3 400 Impairment (3 214) – – – – – (81) (130) (258) (140) (2 605)
Local large power users – other 6 524 6 212 180 38 1 4 22 5 11 3 48
Gross 6 887 6 212 180 38 1 4 37 6 20 8 381 Impairment (363) – – – – – (15) (1) (9) (5) (333)
Not past due
Days past due
Rm0-30Rm
31-60Rm
>60Rm
Collectively assessed for impairmentLocal small power users – Soweto 592 18 8 8 558
Gross 4 141 45 43 39 4 014 Impairment (3 549) (27) (35) (31) (3 456)
Local small power users – other 1 899 1 422 148 44 285
Gross 2 536 1 466 178 76 816 Impairment (637) (44) (30) (32) (531)
17 195
1. Receivables past due but not impaired are receivables where contractual payment terms are past due but the group believes that impairment is not required on the basis of the level of security or collateral available and the stage of collection of amounts owed to the group.
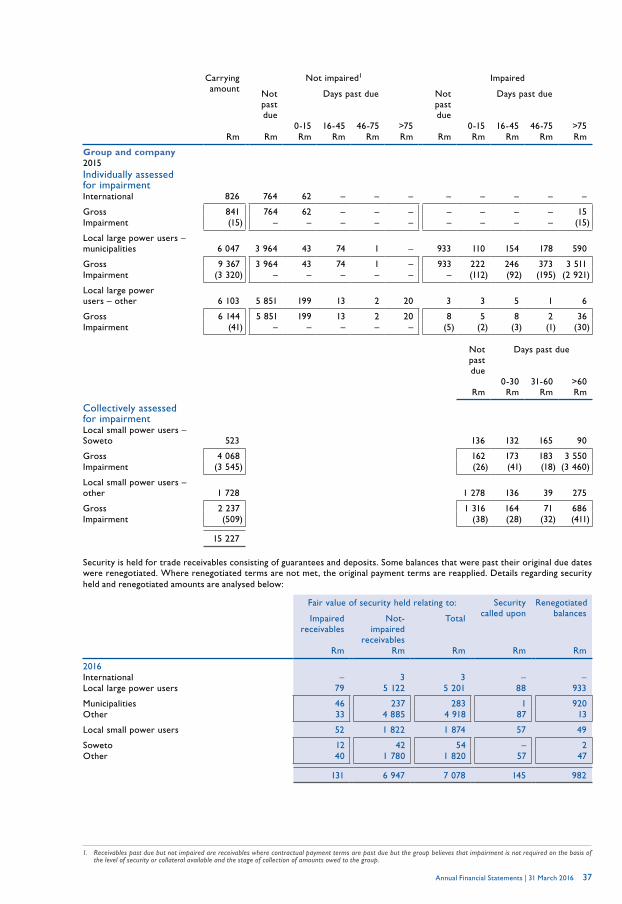
Annual Financial Statements | 31 March 2016 37
Carrying amount
Not impaired1 Impaired
Not past due
Days past due Not past due
Days past due
0-15 16-45 46-75 >75 0-15 16-45 46-75 >75Rm Rm Rm Rm Rm Rm Rm Rm Rm Rm Rm
Group and company2015Individually assessed for impairmentInternational 826 764 62 – – – – – – – –
Gross 841 764 62 – – – – – – – 15 Impairment (15) – – – – – – – – – (15)
Local large power users – municipalities 6 047 3 964 43 74 1 – 933 110 154 178 590
Gross 9 367 3 964 43 74 1 – 933 222 246 373 3 511 Impairment (3 320) – – – – – – (112) (92) (195) (2 921)
Local large power users – other 6 103 5 851 199 13 2 20 3 3 5 1 6
Gross 6 144 5 851 199 13 2 20 8 5 8 2 36 Impairment (41) – – – – – (5) (2) (3) (1) (30)
Not past due
Days past due
Rm0-30Rm
31-60Rm
>60Rm
Collectively assessed for impairmentLocal small power users – Soweto 523 136 132 165 90
Gross 4 068 162 173 183 3 550 Impairment (3 545) (26) (41) (18) (3 460)
Local small power users – other 1 728 1 278 136 39 275
Gross 2 237 1 316 164 71 686 Impairment (509) (38) (28) (32) (411)
15 227
Security is held for trade receivables consisting of guarantees and deposits. Some balances that were past their original due dates were renegotiated. Where renegotiated terms are not met, the original payment terms are reapplied. Details regarding security held and renegotiated amounts are analysed below:
Fair value of security held relating to: Security called upon
Renegotiated balancesImpaired
receivablesNot-
impaired receivables
Total
Rm Rm Rm Rm Rm
2016International – 3 3 – – Local large power users 79 5 122 5 201 88 933
Municipalities 46 237 283 1 920 Other 33 4 885 4 918 87 13
Local small power users 52 1 822 1 874 57 49
Soweto 12 42 54 – 2 Other 40 1 780 1 820 57 47
131 6 947 7 078 145 982
1. Receivables past due but not impaired are receivables where contractual payment terms are past due but the group believes that impairment is not required on the basis of the level of security or collateral available and the stage of collection of amounts owed to the group.

Notes to the financial statements (continued)for the year ended 31 March 2016
Eskom Holdings SOC Ltd38
5. Financial risk management (continued)5.1 Credit risk (continued)5.1.2 Financial instruments managed by various divisions and subsidiaries (continued)(a) Trade and other receivables (continued)
Trade receivables (continued)Fair value of security held relating to: Security
called uponRenegotiated
balancesImpaired receivables
Not-impaired
receivables
Total
Rm Rm Rm Rm Rm
2015International – 3 3 – – Local large power users 8 4 413 4 421 15 130
Municipalities – 297 297 – 123 Other 8 4 116 4 124 15 7
Local small power users 38 1 590 1 628 54 64
Soweto 12 – 12 – 7 Other 26 1 590 1 616 54 57
46 6 006 6 052 69 194
Other receivables Other receivables comprise mainly reinsurance receivables relating to insurance claims made and sundry receivables. There are no significant balances with specific repayment terms. No security is held in respect of these balances and no interest has been charged on overdue balances. Long outstanding debt or amounts handed over to debt collectors were considered for impairment.
(b) Finance lease receivables The supply of electricity to customers may be in the form of either a standard or premium power supply. A standard power supply is the least life cycle cost technically acceptable solution as defined in the South African Grid Code and the Distribution Network Code whereas with a premium supply the customer’s connection requirement exceeds the specifications of a standard supply. This is achieved through the installation of premium supply equipment for which the customer is required to pay a connection charge. Connection charges for premium supply contracts were repayable on a monthly basis over a maximum period of 25 years. This payment option is no longer available for new premium supplies as the connection charges are payable upfront.
The standard payment terms for trade receivables are also applied to the premium supply equipment connection charge customers. The credit risk exposure resulting from premium supply contracts is managed by monitoring payment levels of the customer’s trade receivable balance as well as monitoring the customer for signs of financial stress including business rescue or bankruptcy. There were no significant overdue or distressed balances relating to finance lease receivables in the current or previous financial year. Security in the form of bank guarantees is required from customers before the asset is constructed and is in place for a maximum period of 14 years to cover irrecoverable costs in the event of early termination of the supply contract.
Group and company
2016 2015Note Rm Rm
A+ – 115 BBB+ 3 38 BBB 30 25 BBB- 7 3 BB+ – 6 BB- 31 – Unrated 428 333
Maximum credit exposure 17 499 520
(c) Loans receivable Home loans are made available to qualifying employees in the group via the Eskom Finance Company SOC Ltd (EFC) group. Credit risk policies, developed in line with the National Credit Act, are in place which require various criteria to be met prior to the approval of a loan. These criteria include the valuation of the property, affordability of the loan repayments and credit history of the employee. Loans advanced were repayable over an average period of 27 years in 2015. Persons who are no longer in the employ of the group are required to settle their loans with EFC within 90 days of leaving the group’s service.
The assets and liabilities of EFC have been reclassified as held-for-sale in the 2016 financial year.
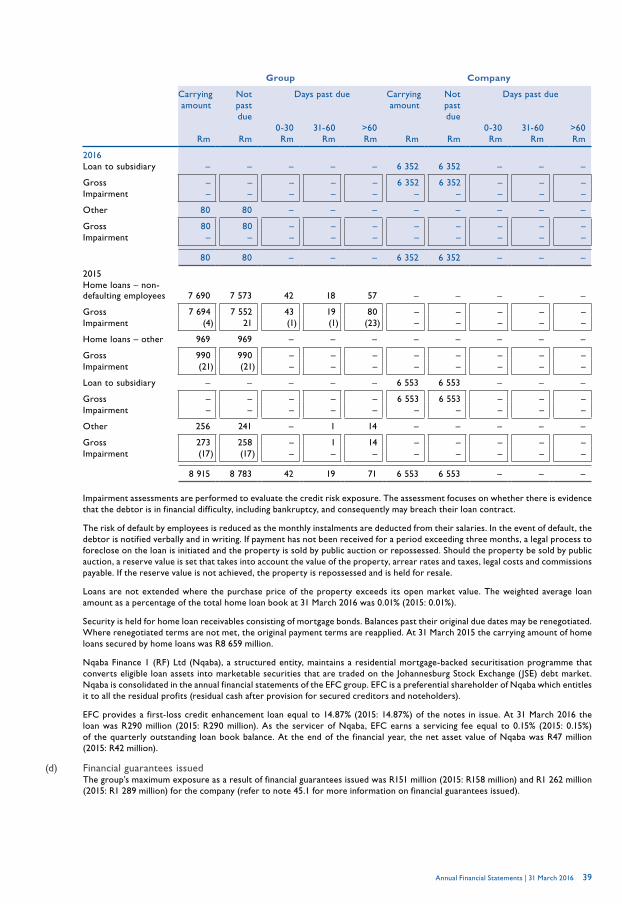
Annual Financial Statements | 31 March 2016 39
Group Company
Carrying amount
Not past due
Days past due Carrying amount
Not past due
Days past due
0-30 31-60 >60 0-30 31-60 >60Rm Rm Rm Rm Rm Rm Rm Rm Rm Rm
2016Loan to subsidiary – – – – – 6 352 6 352 – – –
Gross – – – – – 6 352 6 352 – – – Impairment – – – – – – – – – –
Other 80 80 – – – – – – – –
Gross 80 80 – – – – – – – – Impairment – – – – – – – – – –
80 80 – – – 6 352 6 352 – – –
2015Home loans – non-defaulting employees 7 690 7 573 42 18 57 – – – – –
Gross 7 694 7 552 43 19 80 – – – – – Impairment (4) 21 (1) (1) (23) – – – – –
Home loans – other 969 969 – – – – – – – –
Gross 990 990 – – – – – – – – Impairment (21) (21) – – – – – – – –
Loan to subsidiary – – – – – 6 553 6 553 – – –
Gross – – – – – 6 553 6 553 – – – Impairment – – – – – – – – – –
Other 256 241 – 1 14 – – – – –
Gross 273 258 – 1 14 – – – – – Impairment (17) (17) – – – – – – – –
8 915 8 783 42 19 71 6 553 6 553 – – –
Impairment assessments are performed to evaluate the credit risk exposure. The assessment focuses on whether there is evidence that the debtor is in financial difficulty, including bankruptcy, and consequently may breach their loan contract.
The risk of default by employees is reduced as the monthly instalments are deducted from their salaries. In the event of default, the debtor is notified verbally and in writing. If payment has not been received for a period exceeding three months, a legal process to foreclose on the loan is initiated and the property is sold by public auction or repossessed. Should the property be sold by public auction, a reserve value is set that takes into account the value of the property, arrear rates and taxes, legal costs and commissions payable. If the reserve value is not achieved, the property is repossessed and is held for resale.
Loans are not extended where the purchase price of the property exceeds its open market value. The weighted average loan amount as a percentage of the total home loan book at 31 March 2016 was 0.01% (2015: 0.01%).
Security is held for home loan receivables consisting of mortgage bonds. Balances past their original due dates may be renegotiated. Where renegotiated terms are not met, the original payment terms are reapplied. At 31 March 2015 the carrying amount of home loans secured by home loans was R8 659 million.
Nqaba Finance 1 (RF) Ltd (Nqaba), a structured entity, maintains a residential mortgage-backed securitisation programme that converts eligible loan assets into marketable securities that are traded on the Johannesburg Stock Exchange (JSE) debt market. Nqaba is consolidated in the annual financial statements of the EFC group. EFC is a preferential shareholder of Nqaba which entitles it to all the residual profits (residual cash after provision for secured creditors and noteholders).
EFC provides a first-loss credit enhancement loan equal to 14.87% (2015: 14.87%) of the notes in issue. At 31 March 2016 the loan was R290 million (2015: R290 million). As the servicer of Nqaba, EFC earns a servicing fee equal to 0.15% (2015: 0.15%) of the quarterly outstanding loan book balance. At the end of the financial year, the net asset value of Nqaba was R47 million (2015: R42 million).
(d) Financial guarantees issued The group’s maximum exposure as a result of financial guarantees issued was R151 million (2015: R158 million) and R1 262 million (2015: R1 289 million) for the company (refer to note 45.1 for more information on financial guarantees issued).

Notes to the financial statements (continued)for the year ended 31 March 2016
Eskom Holdings SOC Ltd40
5. Financial risk management (continued)5.2 Market risk
A significant part of market risk encountered by the group arises from financial instruments that are managed centrally within the treasury division of the group or from contracts containing embedded derivatives.
The objective of the group’s market risk management framework is to protect and enhance the statement of financial position and profit or loss by managing and controlling market risk exposures and to optimise the funding of business operations and facilitate capital expansion.
Financial instruments mainly managed by the treasury division The treasury division is responsible for managing market risk within the risk management framework approved by Exco and the board. The overall authority for the management of market risks within the treasury division is vested in the Alco. Measurement and reporting occurs on a daily and/or monthly basis and is performed by an independent section within the treasury division. Financial derivatives are used to manage market risk.
Financial instruments managed by various divisions and subsidiaries Market risk arises mainly from changes in foreign exchange rates and to a limited extent from changes in commodity prices and equity prices. The divisions and subsidiaries are responsible for identifying the exposure arising from these risks. They liaise with the centralised treasury division to hedge (economic and cash flow hedges) these exposures appropriately on their behalf.
Embedded derivatives Eskom entered into a number of agreements to supply electricity to electricity-intensive industries where the revenue from these contracts is based on commodity prices and foreign currency rates (USD) or foreign production price indices. This gives rise to embedded derivatives that require separation as a result of the different characteristics of the embedded derivative and the host contract. The remaining contractual periods are between four and 13 years.
The net impact on profit or loss because of changes in the fair value of the embedded derivatives for the group and company is a fair value gain of R997 million (2015: R1 310 million). At 31 March 2016, the embedded derivative liabilities were R7 025 million (2015: R8 022 million) for the group and R7 025 million (2015: R8 021 million) for the company.
The valuation methods and inputs are discussed in the accounting policies (refer to note 2.10.5) and the valuation assumptions are disclosed under critical accounting estimates and assumptions (refer to note 4.1). Risks arising from these contracts are discussed under the relevant risk areas as follows: • currency risk (refer to note 5.2.1) • commodity risk (refer to note 5.2.2) • interest rate risk (refer to note 5.2.3) • other price risk (refer to note 5.2.5)
Electricity contracts that contain embedded derivatives are considered for economic hedging. Hedging in respect of commodity risk and foreign currency exposure resulting from these embedded derivatives takes place on a short-term basis in terms of the South African Reserve Bank (SARB) regulations.
Loans receivable Market risk arises in respect of loans receivable from changes in interest rates and market prices. Market risk is monitored, analysed and reported by the EFC finance, assurance and risk committee. A strategy aimed at protecting the EFC group from changes in market risk that may have a negative impact on earnings has been implemented. Funds to finance operations are raised over the short term, usually for periods of three to six months, but not exceeding one year. This enables the pricing of assets to be matched with changes in the pricing of liabilities. The cost of funding is based on prevailing conditions in the South African money market. Rates charged on outstanding loan receivables are based on movements in the SARB repurchase rate. EFC has been reclassified as held-for-sale in the 2016 financial year.
5.2.1 Currency risk Currency risk arises primarily from purchasing imported goods and services directly from overseas or indirectly via local suppliers, foreign sales and foreign borrowings. The group is exposed to foreign exchange risk arising from future commercial transactions and recognised assets and liabilities that are denominated in a currency other than the functional currency of the group. All transactions in excess of R150 000 are hedged (ie economic or cash flow hedges). Currency exposure is identified by the business and hedged and managed by the central treasury division. Hedging instruments consist principally of forward exchange contracts, most of which have a maturity of less than one year from the reporting date, but which are rolled over at maturity when necessary. The group also uses cross-currency swaps. The hedging instrument is entered into once the exposure is firm and ascertainable.
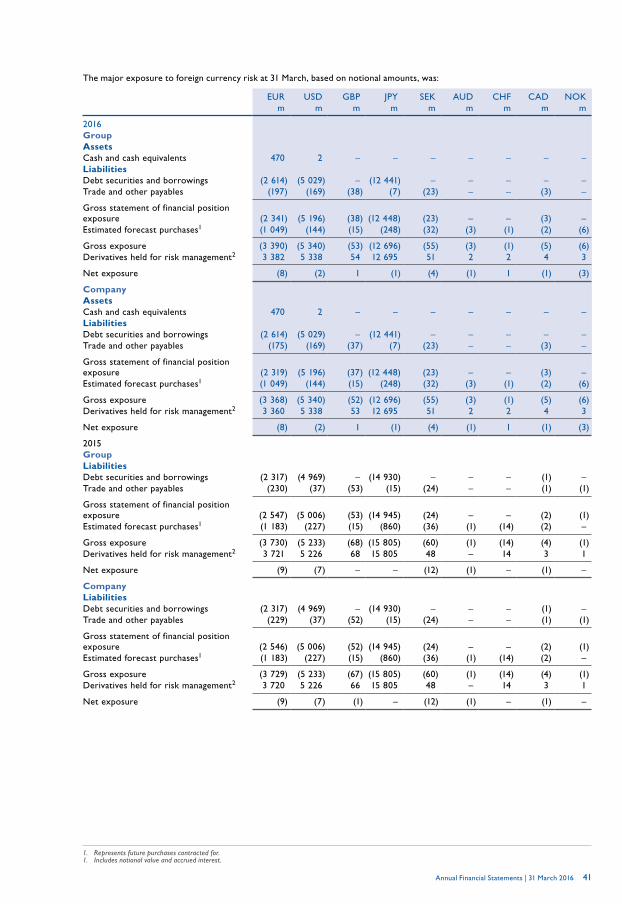
Annual Financial Statements | 31 March 2016 41
The major exposure to foreign currency risk at 31 March, based on notional amounts, was:
EUR USD GBP JPY SEK AUD CHF CAD NOKm m m m m m m m m
2016GroupAssetsCash and cash equivalents 470 2 – – – – – – – LiabilitiesDebt securities and borrowings (2 614) (5 029) – (12 441) – – – – – Trade and other payables (197) (169) (38) (7) (23) – – (3) –
Gross statement of financial position exposure (2 341) (5 196) (38) (12 448) (23) – – (3) – Estimated forecast purchases1 (1 049) (144) (15) (248) (32) (3) (1) (2) (6)
Gross exposure (3 390) (5 340) (53) (12 696) (55) (3) (1) (5) (6)Derivatives held for risk management2 3 382 5 338 54 12 695 51 2 2 4 3
Net exposure (8) (2) 1 (1) (4) (1) 1 (1) (3)
CompanyAssetsCash and cash equivalents 470 2 – – – – – – – LiabilitiesDebt securities and borrowings (2 614) (5 029) – (12 441) – – – – – Trade and other payables (175) (169) (37) (7) (23) – – (3) –
Gross statement of financial position exposure (2 319) (5 196) (37) (12 448) (23) – – (3) – Estimated forecast purchases1 (1 049) (144) (15) (248) (32) (3) (1) (2) (6)
Gross exposure (3 368) (5 340) (52) (12 696) (55) (3) (1) (5) (6)Derivatives held for risk management2 3 360 5 338 53 12 695 51 2 2 4 3
Net exposure (8) (2) 1 (1) (4) (1) 1 (1) (3)
2015GroupLiabilitiesDebt securities and borrowings (2 317) (4 969) – (14 930) – – – (1) – Trade and other payables (230) (37) (53) (15) (24) – – (1) (1)
Gross statement of financial position exposure (2 547) (5 006) (53) (14 945) (24) – – (2) (1)Estimated forecast purchases1 (1 183) (227) (15) (860) (36) (1) (14) (2) –
Gross exposure (3 730) (5 233) (68) (15 805) (60) (1) (14) (4) (1)Derivatives held for risk management2 3 721 5 226 68 15 805 48 – 14 3 1
Net exposure (9) (7) – – (12) (1) – (1) –
CompanyLiabilitiesDebt securities and borrowings (2 317) (4 969) – (14 930) – – – (1) – Trade and other payables (229) (37) (52) (15) (24) – – (1) (1)
Gross statement of financial position exposure (2 546) (5 006) (52) (14 945) (24) – – (2) (1)Estimated forecast purchases1 (1 183) (227) (15) (860) (36) (1) (14) (2) –
Gross exposure (3 729) (5 233) (67) (15 805) (60) (1) (14) (4) (1)Derivatives held for risk management2 3 720 5 226 66 15 805 48 – 14 3 1
Net exposure (9) (7) (1) – (12) (1) – (1) –
1. Represents future purchases contracted for.1. Includes notional value and accrued interest.
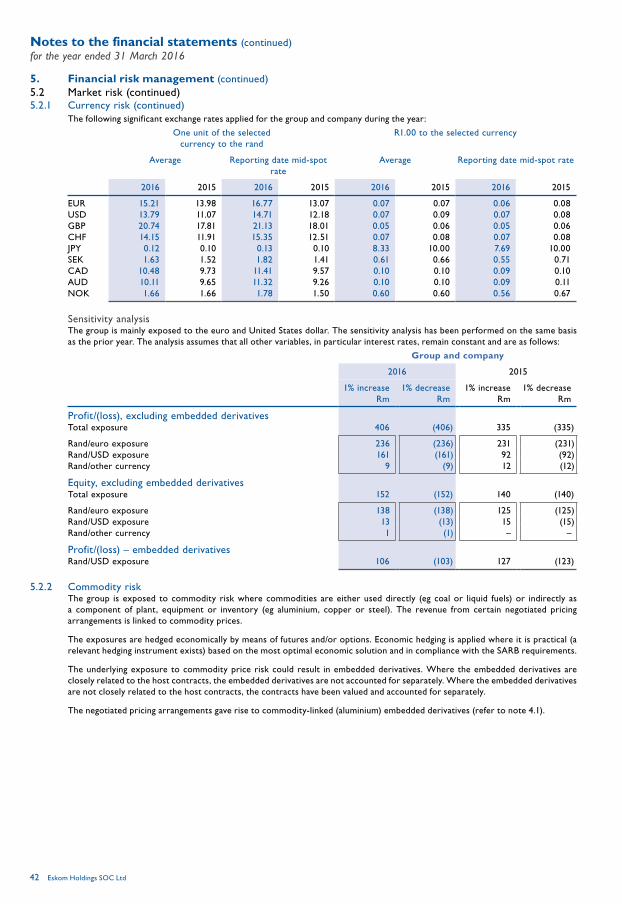
Notes to the financial statements (continued)for the year ended 31 March 2016
Eskom Holdings SOC Ltd42
5. Financial risk management (continued)5.2 Market risk (continued)5.2.1 Currency risk (continued)
The following significant exchange rates applied for the group and company during the year:
One unit of the selected currency to the rand
R1.00 to the selected currency
Average Reporting date mid-spot rate
Average Reporting date mid-spot rate
2016 2015 2016 2015 2016 2015 2016 2015
EUR 15.21 13.98 16.77 13.07 0.07 0.07 0.06 0.08 USD 13.79 11.07 14.71 12.18 0.07 0.09 0.07 0.08 GBP 20.74 17.81 21.13 18.01 0.05 0.06 0.05 0.06 CHF 14.15 11.91 15.35 12.51 0.07 0.08 0.07 0.08 JPY 0.12 0.10 0.13 0.10 8.33 10.00 7.69 10.00 SEK 1.63 1.52 1.82 1.41 0.61 0.66 0.55 0.71 CAD 10.48 9.73 11.41 9.57 0.10 0.10 0.09 0.10 AUD 10.11 9.65 11.32 9.26 0.10 0.10 0.09 0.11 NOK 1.66 1.66 1.78 1.50 0.60 0.60 0.56 0.67
Sensitivity analysisThe group is mainly exposed to the euro and United States dollar. The sensitivity analysis has been performed on the same basis as the prior year. The analysis assumes that all other variables, in particular interest rates, remain constant and are as follows:
Group and company
2016 2015
1% increase 1% decrease 1% increase 1% decreaseRm Rm Rm Rm
Profit/(loss), excluding embedded derivativesTotal exposure 406 (406) 335 (335)
Rand/euro exposure 236 (236) 231 (231)Rand/USD exposure 161 (161) 92 (92)Rand/other currency 9 (9) 12 (12)
Equity, excluding embedded derivativesTotal exposure 152 (152) 140 (140)
Rand/euro exposure 138 (138) 125 (125)Rand/USD exposure 13 (13) 15 (15)Rand/other currency 1 (1) – –
Profit/(loss) – embedded derivativesRand/USD exposure 106 (103) 127 (123)
5.2.2 Commodity riskThe group is exposed to commodity risk where commodities are either used directly (eg coal or liquid fuels) or indirectly as a component of plant, equipment or inventory (eg aluminium, copper or steel). The revenue from certain negotiated pricing arrangements is linked to commodity prices.
The exposures are hedged economically by means of futures and/or options. Economic hedging is applied where it is practical (a relevant hedging instrument exists) based on the most optimal economic solution and in compliance with the SARB requirements.
The underlying exposure to commodity price risk could result in embedded derivatives. Where the embedded derivatives are closely related to the host contracts, the embedded derivatives are not accounted for separately. Where the embedded derivatives are not closely related to the host contracts, the contracts have been valued and accounted for separately.
The negotiated pricing arrangements gave rise to commodity-linked (aluminium) embedded derivatives (refer to note 4.1).
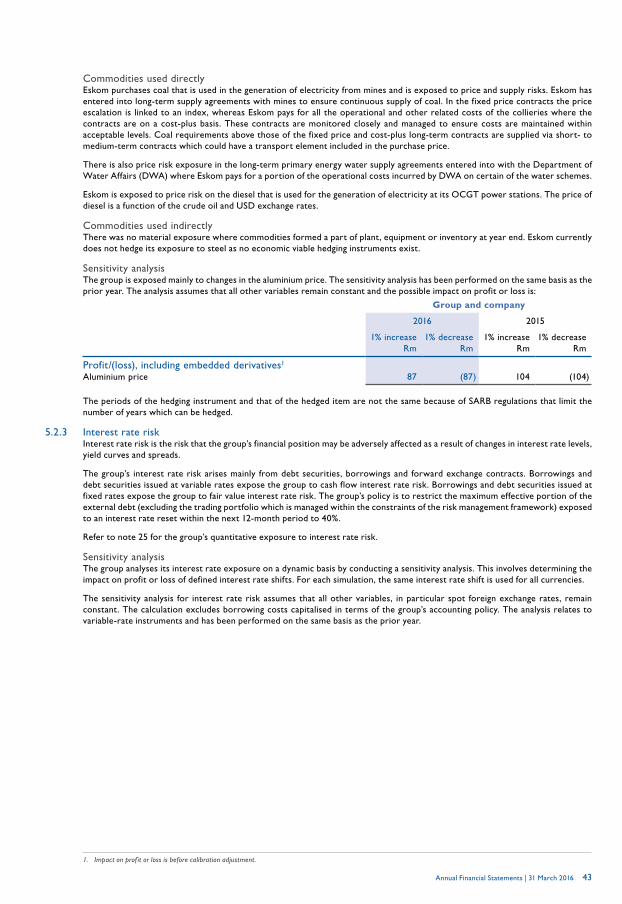
Annual Financial Statements | 31 March 2016 43
Commodities used directly Eskom purchases coal that is used in the generation of electricity from mines and is exposed to price and supply risks. Eskom has entered into long-term supply agreements with mines to ensure continuous supply of coal. In the fixed price contracts the price escalation is linked to an index, whereas Eskom pays for all the operational and other related costs of the collieries where the contracts are on a cost-plus basis. These contracts are monitored closely and managed to ensure costs are maintained within acceptable levels. Coal requirements above those of the fixed price and cost-plus long-term contracts are supplied via short- to medium-term contracts which could have a transport element included in the purchase price.
There is also price risk exposure in the long-term primary energy water supply agreements entered into with the Department of Water Affairs (DWA) where Eskom pays for a portion of the operational costs incurred by DWA on certain of the water schemes.
Eskom is exposed to price risk on the diesel that is used for the generation of electricity at its OCGT power stations. The price of diesel is a function of the crude oil and USD exchange rates.
Commodities used indirectly There was no material exposure where commodities formed a part of plant, equipment or inventory at year end. Eskom currently does not hedge its exposure to steel as no economic viable hedging instruments exist.
Sensitivity analysis The group is exposed mainly to changes in the aluminium price. The sensitivity analysis has been performed on the same basis as the prior year. The analysis assumes that all other variables remain constant and the possible impact on profit or loss is:
Group and company
2016 2015
1% increase 1% decrease 1% increase 1% decreaseRm Rm Rm Rm
Profit/(loss), including embedded derivatives1
Aluminium price 87 (87) 104 (104)
The periods of the hedging instrument and that of the hedged item are not the same because of SARB regulations that limit the number of years which can be hedged.
5.2.3 Interest rate risk Interest rate risk is the risk that the group’s financial position may be adversely affected as a result of changes in interest rate levels, yield curves and spreads.
The group’s interest rate risk arises mainly from debt securities, borrowings and forward exchange contracts. Borrowings and debt securities issued at variable rates expose the group to cash flow interest rate risk. Borrowings and debt securities issued at fixed rates expose the group to fair value interest rate risk. The group’s policy is to restrict the maximum effective portion of the external debt (excluding the trading portfolio which is managed within the constraints of the risk management framework) exposed to an interest rate reset within the next 12-month period to 40%.
Refer to note 25 for the group’s quantitative exposure to interest rate risk.
Sensitivity analysis The group analyses its interest rate exposure on a dynamic basis by conducting a sensitivity analysis. This involves determining the impact on profit or loss of defined interest rate shifts. For each simulation, the same interest rate shift is used for all currencies.
The sensitivity analysis for interest rate risk assumes that all other variables, in particular spot foreign exchange rates, remain constant. The calculation excludes borrowing costs capitalised in terms of the group’s accounting policy. The analysis relates to variable-rate instruments and has been performed on the same basis as the prior year.
1. Impact on prof it or loss is before calibration adjustment.

Notes to the financial statements (continued)for the year ended 31 March 2016
Eskom Holdings SOC Ltd44
5. Financial risk management (continued)5.2 Market risk (continued)5.2.3 Interest rate risk (continued)
Sensitivity analysis (continued)The simulation is performed on a monthly basis to verify that the maximum loss potential is within the limit set by management. The results of the simulation are included in the table below.
The ZAR and the USD interest rates are used in determining the fair value of embedded derivatives. The sensitivity analysis below indicates the impact on profit or loss if these rates change. The sensitivity analysis assumes that all other variables remain constant and has been prepared on the same basis as for the prior year.
Group Company
2016 2015 2016 2015
+100 basis
points
-100 basis
points
+100 basis
points
-100 basis
points
+100 basis points
-100 basis
points
+100 basis
points
-100 basis
pointsRm Rm Rm Rm Rm Rm Rm Rm
Profit/(loss), excluding embedded derivativesTotal exposure – 3 (44) 48 (47) 51 (53) 57
Rand interest rates 273 (284) 225 (238) 226 (236) 216 (229)EUR interest rates (70) 71 (59) 60 (70) 71 (59) 60 USD interest rates (194) 210 (195) 212 (194) 210 (195) 212 Other currency interest rates (9) 6 (15) 14 (9) 6 (15) 14
Equity, excluding embedded derivativesTotal exposure (2 908) 3 149 (1 612) 1 951 (2 908) 3 149 (1 594) 1 933
Rand interest rates 1 309 (1 372) 1 742 (1 639) 1 309 (1 372) 1 760 (1 657)EUR interest rates (871) 936 (841) 889 (871) 936 (841) 889 USD interest rates (3 314) 3 566 (2 478) 2 671 (3 314) 3 566 (2 478) 2 671 Other currency interest rates (32) 19 (35) 30 (32) 19 (35) 30
Profit/(loss) – embedded derivatives1
Total exposure 147 (162) 223 (258) 147 (162) 223 (258)
Rand interest rates 468 (497) 659 (709) 468 (497) 659 (709)USD interest rates (321) 335 (436) 451 (321) 335 (436) 451
Fixed and floating rate debtThe proportion of fixed versus floating rate debt at 31 March was:
Group and company
2016 2015
fixed floating fixed floating% % % %
Continuing operations 80 20 82 18
5.2.4 Equity price risk Equity price risk arises from investments listed on the JSE. Changes in the fair value of equity securities held by the group will fluctuate because of changes in market prices, caused by factors specific to the individual equity issuer, or factors affecting all similar equity securities traded on the market.
The investment mandate is stipulated by the Eskom board and is monitored by the Escap investment committee. Exposure to market risk is limited through diversification and by applying strict investment criteria.
The carrying value of investments made per sector are as follows:
Group
2016 2015
Rmportfolio
% Rmportfolio
%
Banks, financial services and insurance 267 22 298 25Basic materials and resources 143 12 233 20Consumer goods and services 527 44 465 39Other 250 22 183 16
1 187 100 1 179 100
A 1% increase or decrease in share prices would have increased/decreased profit or loss by R12 million (2015: R12 million). There will be no impact on equity. The analysis assumes that all other variables remain constant and is performed on the same basis as for the prior year.
1. Impact on prof it or loss is before calibration adjustment.

Annual Financial Statements | 31 March 2016 45
5.2.5 Other price risk Inflation price risk arises from embedded derivatives as discussed under note 4.1. The risk arises from movements in the electricity tariffs and the United States PPI.
Refer to note 26 for the group’s quantitative exposure to other price risk.
The following is the sensitivity analysis of the change in the value of the embedded derivatives (relating to customised pricing agreements) as a result of changes in electricity tariffs and the United States PPI. The analysis assumes that all other variables remain constant and the possible impact on profit or loss is:
Group and company
2016 2015
1% increase 1% decrease 1% increase 1% decreaseRm Rm Rm Rm
Profit/(loss), including embedded derivatives1 (135) 134 (416) 400
Electricity tariffs (263) 258 (568) 553 United States PPI 128 (124) 152 (153)
5.3 Liquidity risk Liquidity risk can arise from mismatches in the timing of cash flows from revenue and capital and operational outflows. Funding risk arises when the necessary liquidity to fund illiquid asset positions, such as building new electricity capacity, cannot be obtained at the expected terms and when required.
The objective of the group’s liquidity and funding management is to ensure that all foreseeable operational, capital expansion and loan commitment expenditure can be met under both normal and stressed conditions. The group has adopted an overall statement of financial position approach, which consolidates all sources and uses of liquidity, while aiming to maintain a balance between liquidity, profitability and interest rate considerations.
The management of group liquidity and funding risk is centralised in the treasury department in accordance with practices and limits set by the Exco and the board. The group’s liquidity and funding management process includes: • projecting cash flows and considering the cash required by the group and optimising the short-term liquidity as well as the
long-term funding • monitoring financial position liquidity ratios • maintaining a diverse range of funding sources with adequate back-up facilities • managing the concentration and profile of debt maturities • actively managing the funding risk by evaluating optimal entry points into the various markets per the official borrowing
programme • maintaining liquidity and funding contingency plans
Eskom has an established corporate governance structure and process for managing the risks regarding guarantees and contingent liabilities. All significant guarantees issued by Eskom are approved by the board, and are managed on an ongoing basis by Treasury and by the Exco and audit and risk committee of the board. Refer to note 45.
The guarantees are administratively managed by the treasury department. Updated guarantee schedules are compiled every month, taking cognisance of any changed risk factors, and are submitted to each of the committees for consideration and action, if necessary. Risk factors and assumptions affecting probability calculations are reassessed twice a year and presented to the above committees.
Eskom’s guarantees are diverse and unlinked, such that a trigger event for any one guarantee is unlikely to precipitate a trigger event in respect of other guarantees.
Given that there would be forewarning of payments required in terms of the other guarantees, and considering the amounts of the guarantees, it is expected that Eskom will be able to raise the required liquidity to effect any required payments.
5.3.1 Primary sources of funding and unused facilities The primary sources to meet Eskom’s liquidity requirements are cash generated from operations, cash inflows from maturing financial assets purchased, funds committed by government, signed and committed export credit agencies and development funding institution facilities, as well as local and foreign debt issued in the market. To supplement these liquidity sources under stress conditions, overdraft facilities (for which there was no requirement to use), undrawn loans, commercial paper facilities and unutilised government guarantees are in place as indicated in the table. All figures are quoted on notional amounts.
1. Impact on prof it or loss is before calibration adjustment.

Notes to the financial statements (continued)for the year ended 31 March 2016
Eskom Holdings SOC Ltd46
5. Financial risk management (continued)5.3 Liquidity risk (continued)5.3.1 Primary sources of funding and unused facilities (continued)
ZAR EUR USD JPY
2016 2015 2016 2015 2016 2015 2016 2015m m m m m m m m
Facilities availableExport credit agencies – – 845 921 195 483 – –
Crédit Agricole Corporate and Investment Bank – Coface – – 44 44 – – – – Banque Nationale de Paris Paribas – Coface – – 231 231 – – – – Banque Nationale de Paris Paribas – Servizi Assicurativi del Commercio Estero – – 261 261 – – – – Kreditanstalt für Wiederaufbau – Hermes – – 289 357 – – – – Deutsche Bank – Hermes – – 20 28 – – – – Export-Import Bank of the United States – – – – 195 483 – –
Development financing institutions 2 505 7 377 503 503 1 921 2 214 – –
World Bank – – – – 1 280 1 572 – – African Development Bank 232 316 331 331 256 256 – – Development Bank of South Africa – 3 000 – – – – – – Clean technology fund – African Development Bank – – – – 64 65 – – Clean technology fund – World Bank – – – – 221 221 – – European Investment Bank – – 75 75 – – – – Kreditanstalt für Wiederaufbau – 3 935 – – 100 100 – – Agence Française de Développement 2 273 126 97 97 – – – –
Government guarantees 168 546 191 189 – – – – – –
Domestic multi-term note programme 44 951 49 774 – – – – – – General guarantees 123 595 141 415 – – – – – –
General banking facilities 3 750 1 450 – – – – – –
174 801 200 016 1 348 1 424 2 116 2 697 – –
Funds received during the yearExport credit agencies – – 71 100 289 16 – 906
Japan Bank for International Cooperation – – – – – – – 906 Kreditanstalt für Wiederaufbau – Hermes – – 68 85 – – – – Deutsche Bank – Hermes – – 3 15 – – – – Export-Import Bank of the United States – – – – 289 16 – –
Development financing institutions 7 145 3 607 470 103 291 766 – –
World Bank1 – – – – 291 703 – – African Development Bank2 84 – – 100 – 5 – – Development Bank of South Africa3 3 000 3 000 – – – – – – Clean technology fund – World Bank4 – – – – – 28 – – Clean technology fund – African Development Bank4 – – – – – 30 – – Kreditanstalt für Wiederaufbau5 3 935 – – – – – – – Agence Française de Développement4, 6 126 607 – 3 – – – – Deutsche Bank guaranteed by Multilateral Investment Guarantee Agency7 – – 470 – – – – –
7 145 3 607 541 203 580 782 – 906
Government guarantees used during the year 22 643 15 151 – – – – – –
Domestic multi-term note programme 4 823 10 176 – – – – – – General guarantees 17 820 4 975 – – – – – –
1. All funds received were reimbursements on payments made by Eskom to various suppliers for goods and services supplied for the construction of the Medupi power station, Sere wind farm and Majuba rail projects.
2. All funds received were reimbursements on payments made by Eskom to various suppliers for goods and services supplied for the Medupi boilers and turbines and Sere wind farm.
3. Funds received were for bridging f inance for the capacity expansion programme.4. Funds received were for the Sere wind farm project.5. Funds received were for Eskom renewable grid integration and transmission strengthening.6. Funds received were for concentrated solar power projects.7. Funds received were for transmission lines and grid strengthening, substations and independent power producer integration.

Annual Financial Statements | 31 March 2016 47
5.3.2 Key indicators used for liquidity management Duration Management has set minimum duration limits to manage the debt and borrowings maturity profile. Group policy is to ensure that the external debt portfolio (excluding the trade portfolio) has a minimum duration of five years. The duration limits are independently monitored and reported to Alco on a monthly basis and to the Exco and the audit and risk committee on a quarterly basis.
The duration (a weighted average term to maturity measure based on future cash flows) of the debt (including cross-currency and interest rate swaps) measured at fair value at 31 March was:
Group and company
2016 2015Years Years
Continuing operations 8.63 11.00
Liquid assets Liquid assets are investments identified as having the potential to be quickly converted into cash. The liquid assets were:
Group Company
2016 2015 2016 2015Note Rm Rm Rm Rm
Investment in securities 14.1 10 226 8 496 4 552 4 802Cash and cash equivalents 21 28 454 8 863 28 136 7 986
38 680 17 359 32 688 12 788
Capital expenditure ratioThe capital expenditure ratio1 measures whether there are liquid funds available to invest in capital expenditure. The capital expenditure ratio for the period was:
Group Company
2016 2015 2016 2015% % % %
Continuing operations 64 53 60 50
5.3.3 Contractual cash flows The table on the next page indicates the contractual undiscounted cash flows of the group’s financial assets and liabilities on the basis of their earliest possible contractual maturity. The undiscounted cash flows in respect of the group’s financial assets are presented net of impairment losses and include estimates where there are no contractual repayment terms or the receivable is past due. The cash flows of the group’s financial liabilities are indicated on a gross undiscounted basis.
The cash flows for derivatives are presented as gross inflows and outflows even though physically they are settled simultaneously. Contractual cash flows are a function of forward exchange rates and forward interest rates and is a point in time calculation that is impacted by market conditions at that time.
The table contains only cash flows relating to financial instruments and financial guarantees. It does not include future cash flows expected from the normal course of business and related commodity-linked pricing agreements.
1. The ratio is calculated as cash generated from operations divided by cash expenditures on property, plant and equipment and intangible assets.

Notes to the financial statements (continued)for the year ended 31 March 2016
Eskom Holdings SOC Ltd48
5. Financial risk management (continued)5.3 Liquidity risk (continued)5.3.3 Contractual cash flows (continued)
Carrying amount Cash flows
Non-current
Current Total Nominal inflow/
outflow
0-3 months
4-12 months
1-5years
> 5years
Note Rm Rm Rm Rm Rm Rm Rm Rm
2016GroupFinancial assetsInvestment in securities 14 2 485 7 741 10 226 10 700 1 807 6 177 2 716 – Loans receivable 15 70 10 80 79 3 7 55 14 Derivatives held for risk management 16 27 600 2 582 30 182 60 031 1 437 897 17 002 40 695 Finance lease receivables 17 477 22 499 912 20 60 316 516 Trade and other receivables 19 54 21 785 21 839 21 758 20 797 907 54 – Financial trading assets1 14 – 3 844 3 844 4 279 2 058 1 221 544 456 Cash and cash equivalents 21 – 28 454 28 454 28 454 28 454 – – –
30 686 64 438 95 124 126 213 54 576 9 269 20 687 41 681
Financial liabilitiesDebt securities and borrowings 25 306 970 15 688 322 658 698 133 6 403 26 386 186 216 479 128 Derivatives held for risk management 16 2 862 2 011 4 873 4 416 841 3 434 1 686 (1 545)Finance lease payables 30 3 838 90 3 928 9 580 170 512 3 298 5 600 Trade and other payables 31 875 32 047 32 922 32 748 27 117 4 471 915 245 Financial trading liabilities1 14 – 1 250 1 250 1 721 1 028 17 95 581 Financial guarantees 45 – 1 1 151 151 – – –
314 545 51 087 365 632 746 749 35 710 34 820 192 210 484 009
CompanyFinancial assetsInvestment in securities 14 2 485 2 067 4 552 5 025 42 2 267 2 716 – Loans receivable 15 – 6 352 6 352 6 486 2 725 3 761 – – Derivatives held for risk management 16 27 600 2 582 30 182 60 031 1 437 897 17 002 40 695 Finance lease receivables 17 477 22 499 912 20 60 316 516 Trade and other receivables 19 54 24 455 24 509 24 484 23 821 608 55 – Financial trading assets1 14 – 2 657 2 657 3 092 2 058 34 544 456 Cash and cash equivalents 21 – 28 136 28 136 28 136 28 136 – – –
30 616 66 271 96 887 128 166 58 239 7 627 20 633 41 667
Financial liabilitiesDebt securities and borrowings 25 306 901 19 056 325 957 701 298 9 637 26 386 186 147 479 128 Derivatives held for risk management 16 2 862 2 024 4 886 4 429 854 3 434 1 686 (1 545)Finance lease payables 30 3 838 90 3 928 9 580 170 512 3 298 5 600 Trade and other payables 31 875 33 560 34 435 34 293 29 657 3 476 915 245 Financial trading liabilities1 14 – 1 250 1 250 1 721 1 028 17 95 581 Financial guarantees 45 – 2 2 1 262 1 262 – – –
314 476 55 982 370 458 752 583 42 608 33 825 192 141 484 009
1. The contractual cash f lows for f inancial trading assets and liabilities have been disclosed based on the contractual maturity of the instrument. However, as these instruments are held-for-trading they may be sold or settled prior to contractual maturity.
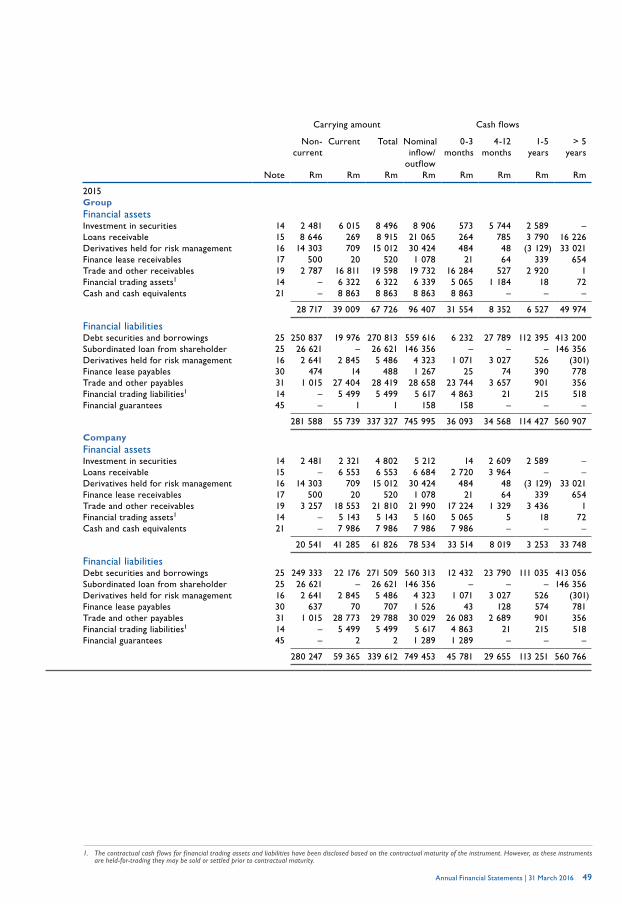
Annual Financial Statements | 31 March 2016 49
Carrying amount Cash flows
Non-current
Current Total Nominal inflow/
outflow
0-3 months
4-12 months
1-5years
> 5years
Note Rm Rm Rm Rm Rm Rm Rm Rm
2015GroupFinancial assetsInvestment in securities 14 2 481 6 015 8 496 8 906 573 5 744 2 589 – Loans receivable 15 8 646 269 8 915 21 065 264 785 3 790 16 226 Derivatives held for risk management 16 14 303 709 15 012 30 424 484 48 (3 129) 33 021Finance lease receivables 17 500 20 520 1 078 21 64 339 654 Trade and other receivables 19 2 787 16 811 19 598 19 732 16 284 527 2 920 1 Financial trading assets1 14 – 6 322 6 322 6 339 5 065 1 184 18 72 Cash and cash equivalents 21 – 8 863 8 863 8 863 8 863 – – –
28 717 39 009 67 726 96 407 31 554 8 352 6 527 49 974
Financial liabilitiesDebt securities and borrowings 25 250 837 19 976 270 813 559 616 6 232 27 789 112 395 413 200 Subordinated loan from shareholder 25 26 621 – 26 621 146 356 – – – 146 356 Derivatives held for risk management 16 2 641 2 845 5 486 4 323 1 071 3 027 526 (301)Finance lease payables 30 474 14 488 1 267 25 74 390 778 Trade and other payables 31 1 015 27 404 28 419 28 658 23 744 3 657 901 356 Financial trading liabilities1 14 – 5 499 5 499 5 617 4 863 21 215 518 Financial guarantees 45 – 1 1 158 158 – – –
281 588 55 739 337 327 745 995 36 093 34 568 114 427 560 907
CompanyFinancial assetsInvestment in securities 14 2 481 2 321 4 802 5 212 14 2 609 2 589 – Loans receivable 15 – 6 553 6 553 6 684 2 720 3 964 – – Derivatives held for risk management 16 14 303 709 15 012 30 424 484 48 (3 129) 33 021Finance lease receivables 17 500 20 520 1 078 21 64 339 654 Trade and other receivables 19 3 257 18 553 21 810 21 990 17 224 1 329 3 436 1 Financial trading assets1 14 – 5 143 5 143 5 160 5 065 5 18 72 Cash and cash equivalents 21 – 7 986 7 986 7 986 7 986 – – –
20 541 41 285 61 826 78 534 33 514 8 019 3 253 33 748
Financial liabilitiesDebt securities and borrowings 25 249 333 22 176 271 509 560 313 12 432 23 790 111 035 413 056 Subordinated loan from shareholder 25 26 621 – 26 621 146 356 – – – 146 356 Derivatives held for risk management 16 2 641 2 845 5 486 4 323 1 071 3 027 526 (301)Finance lease payables 30 637 70 707 1 526 43 128 574 781 Trade and other payables 31 1 015 28 773 29 788 30 029 26 083 2 689 901 356 Financial trading liabilities1 14 – 5 499 5 499 5 617 4 863 21 215 518 Financial guarantees 45 – 2 2 1 289 1 289 – – –
280 247 59 365 339 612 749 453 45 781 29 655 113 251 560 766
1. The contractual cash f lows for f inancial trading assets and liabilities have been disclosed based on the contractual maturity of the instrument. However, as these instruments are held-for-trading they may be sold or settled prior to contractual maturity.

Notes to the financial statements (continued)for the year ended 31 March 2016
Eskom Holdings SOC Ltd50
6. Accounting classification, fair value and fair value hierarchy 6.1 Accounting classification and fair value
Held-for-trading
Loans andreceivables
Available-for-sale
Liabilities at
amortised cost
Other assets
and liabilities
Total carrying
amount
Total fair
value
Note Rm Rm Rm Rm Rm Rm Rm
2016GroupFinancial assets
Investment in securities 14 – – 10 226 – – 10 226 10 226
Government bonds – – 3 769 – – 3 769 3 769 Negotiable certificates of deposit – – 6 457 – – 6 457 6 457
Loans receivable1 15 – 80 – – – 80 80
Derivatives held for risk management 16 1 130 – – – 29 052 30 182 30 182
Foreign exchange contracts 1 008 – – – 1 151 2 159 2 159 Cross-currency swaps 82 – – – 27 901 27 983 27 983 Commodity forwards 31 – – – – 31 31 Credit default swaps 9 – – – – 9 9
Finance lease receivables1 17 – – – – 499 499 499
Trade and other receivables1 19 – 21 839 – – – 21 839 21 839
Financial trading assets 14 3 844 – – – – 3 844 3 844
Repurchase agreements 2 044 – – – – 2 044 2 044 Listed shares 1 187 – – – – 1 187 1 187 Government bonds 613 – – – – 613 613
Cash and cash equivalents 21 – 28 454 – – – 28 454 28 454
Bank balances – 28 452 – – – 28 452 28 452 Unsettled deals – 2 – – – 2 2
4 974 50 373 10 226 – 29 551 95 124 95 124
Financial liabilities
Debt securities and borrowings 25 – – – 322 658 – 322 658 282 770
Eskom bonds – – – 126 466 – 126 466 120 216 Promissory notes – – – 46 – 46 45 Commercial paper – – – 4 822 – 4 822 4 822 Eurorand zero coupon bonds – – – 4 462 – 4 462 3 358 Foreign bonds – – – 58 815 – 58 815 54 739 Development financing institutions – – – 82 976 – 82 976 58 602 Export credit facilities – – – 37 597 – 37 597 34 465 Other loans – – – 7 474 – 7 474 6 523
Embedded derivatives 26 – – – – 7 025 7 025 7 025
Derivatives held for risk management 16 2 928 – – – 1 945 4 873 4 873
Foreign exchange contracts 1 482 – – – 106 1 588 1 588 Cross-currency swaps 382 – – – 1 839 2 221 2 221 Credit default swaps 1 064 – – – – 1 064 1 064
Finance lease payables1 30 – – – – 3 928 3 928 3 928
Trade and other payables1 31 – – – 32 922 – 32 922 32 922
Financial trading liabilities 14 1 250 – – – – 1 250 1 250
Short-sold government bonds 227 – – – – 227 227 Repurchase agreements 1 023 – – – – 1 023 1 023
4 178 – – 355 580 12 898 372 656 332 768
1. The fair values of these f inancial instruments approximate their carrying amounts. The effect of discounting is not expected to be material.

Annual Financial Statements | 31 March 2016 51
Held-for-trading
Loans andreceivables
Available-for-sale
Liabilities at
amortised cost
Other assets
and liabilities
Total carrying
amount
Total fair
value
Note Rm Rm Rm Rm Rm Rm Rm
2016CompanyFinancial assets
Investment in securities 14 – – 4 552 – – 4 552 4 552
Government bonds – – 3 769 – – 3 769 3 769 Negotiable certificates of deposit – – 783 – – 783 783
Loans receivable1 15 – 6 352 – – – 6 352 6 352
Derivatives held for risk management 16 1 130 – – – 29 052 30 182 30 182
Foreign exchange contracts 1 008 – – – 1 151 2 159 2 159 Cross-currency swaps 82 – – – 27 901 27 983 27 983 Commodity forwards 31 – – – – 31 31 Credit default swaps 9 – – – – 9 9
Finance lease receivables1 17 – – – – 499 499 499
Trade and other receivables1 19 – 24 509 – – – 24 509 24 509
Financial trading assets 14 2 657 – – – – 2 657 2 657
Repurchase agreements 2 044 – – – – 2 044 2 044 Government bonds 613 – – – – 613 613
Cash and cash equivalents 21 – 28 136 – – – 28 136 28 136
Bank balances – 28 134 – – – 28 134 28 134 Unsettled deals – 2 – – – 2 2
3 787 58 997 4 552 – 29 551 96 887 96 887
Financial liabilities
Debt securities and borrowings 25 – – – 325 957 – 325 957 286 069
Eskom bonds – – – 126 466 – 126 466 120 216 Promissory notes – – – 46 – 46 45 Commercial paper – – – 6 431 – 6 431 6 431 Eurorand zero coupon bonds – – – 4 462 – 4 462 3 358 Foreign bonds – – – 58 815 – 58 815 54 739 Development financing institutions – – – 82 976 – 82 976 58 602 Export credit facilities – – – 37 597 – 37 597 34 465 Other loans – – – 9 164 – 9 164 8 213
Embedded derivatives 26 – – – – 7 025 7 025 7 025
Derivatives held for risk management 16 2 941 – – – 1 945 4 886 4 886
Foreign exchange contracts 1 495 – – – 106 1 601 1 601 Cross-currency swaps 382 – – – 1 839 2 221 2 221 Credit default swaps 1 064 – – – – 1 064 1 064
Finance lease payables1 30 – – – – 3 928 3 928 3 928
Trade and other payables1 31 – – – 34 435 – 34 435 34 435
Financial trading liabilities 14 1 250 – – – – 1 250 1 250
Short-sold government bonds 227 – – – – 227 227 Repurchase agreements 1 023 – – – – 1 023 1 023
4 191 – – 360 392 12 898 377 481 337 593
1. The fair values of these f inancial instruments approximate their carrying amounts. The effect of discounting is not expected to be material.

Notes to the financial statements (continued)for the year ended 31 March 2016
Eskom Holdings SOC Ltd52
6. Accounting classification, fair value and fair value hierarchy (continued)6.1 Accounting classification and fair value (continued)
Held-for-trading
Loans and receivables
Available-for-sale
Liabilities at
amortised cost
Other assets
and liabilities
Total carrying amount
Total fair
value
Note Rm Rm Rm Rm Rm Rm Rm
2015GroupFinancial assets
Investment in securities 14 – – 8 496 – – 8 496 8 496
Government bonds – – 4 802 – – 4 802 4 802 Negotiable certificates of deposit – – 3 694 – – 3 694 3 694
Loans receivable1 15 – 8 915 – – – 8 915 7 474
Secured by mortgages – 8 659 – – – 8 659 7 315 Other – 256 – – – 256 159
Derivatives held for risk management 16 1 231 – – – 13 781 15 012 15 012
Foreign exchange contracts 501 – – – 84 585 585 Cross-currency swaps 713 – – – 13 697 14 410 14 410 Commodity forwards 8 – – – – 8 8 Credit default swaps 9 – – – – 9 9
Finance lease receivables2 17 – – – – 520 520 520
Trade and other receivables2 19 – 19 598 – – – 19 598 19 598
Financial trading assets 14 6 322 – – – – 6 322 6 322
Repurchase agreements 5 084 – – – – 5 084 5 084 Listed shares 1 179 – – – – 1 179 1 179 Government bonds 59 – – – – 59 59
Cash and cash equivalents 21 – 8 863 – – – 8 863 8 863
Bank balances – 5 959 – – – 5 959 5 959 Unsettled deals – (1 101) – – – (1 101) (1 101)Fixed deposits – 4 005 – – – 4 005 4 005
7 553 37 376 8 496 – 14 301 67 726 66 285
Financial liabilities
Debt securities and borrowings 25 – – – 297 434 – 297 434 269 195
Eskom bonds – – – 112 103 – 112 103 114 838 Promissory notes – – – 40 – 40 47 Commercial paper – – – 7 531 – 7 531 7 377 Eurorand zero coupon bonds – – – 3 942 – 3 942 3 594 Foreign bonds – – – 48 670 – 48 670 48 585 Development financing institutions – – – 62 447 – 62 447 49 691 Export credit facilities – – – 28 488 – 28 488 27 966 Subordinated loan from shareholder – – – 26 621 – 26 621 12 420 Other loans – – – 7 592 – 7 592 4 677
Embedded derivatives 26 – – – – 8 022 8 022 8 022
Derivatives held for risk management 16 1 335 – – – 4 151 5 486 5 486
Foreign exchange contracts 824 – – – 1 530 2 354 2 354 Cross-currency swaps 11 – – – 2 621 2 632 2 632 Commodity forwards 1 – – – – 1 1 Credit default swaps 499 – – – – 499 499
Finance lease payables2 30 – – – – 488 488 488
Trade and other payables2 31 – – – 28 419 – 28 419 28 419
Financial trading liabilities 14 5 499 – – – – 5 499 5 499
Short-sold government bonds 493 – – – – 493 493 Repurchase agreements 5 006 – – – – 5 006 5 006
6 834 – – 325 853 12 661 345 348 317 109
1. The fair value of loans receivable is based on what a market participant would be willing to pay to acquire the loans on the assumption that this participant would not have the ability to deduct repayments from the group’s payroll thus increasing the probability of default resulting in a lower fair value than Eskom’s carrying value.
2. The fair values of these f inancial instruments approximate their carrying amounts. The effect of discounting is not expected to be material.

Annual Financial Statements | 31 March 2016 53
Held-for-trading
Loans and receivables
Available-for-sale
Liabilities at
amortised cost
Other assets
and liabilities
Total carrying amount
Total fair
value
Note Rm Rm Rm Rm Rm Rm Rm
2015CompanyFinancial assets
Investment in securitiesGovernment bonds 14 – – 4 802 – – 4 802 4 802
Loans receivable1 15 – 6 553 – – – 6 553 6 553
Derivatives held for risk management 16 1 231 – – – 13 781 15 012 15 012
Foreign exchange contracts 501 – – – 84 585 585 Cross-currency swaps 713 – – – 13 697 14 410 14 410 Commodity forwards 8 – – – – 8 8 Credit default swaps 9 – – – – 9 9
Finance lease receivables1 17 – – – – 520 520 520
Trade and other receivables1 19 – 21 810 – – – 21 810 21 810
Financial trading assets 14 5 143 – – – – 5 143 5 143
Repurchase agreements 5 084 – – – – 5 084 5 084 Government bonds 59 – – – – 59 59
Cash and cash equivalents 21 – 7 986 – – – 7 986 7 986
Bank balances – 5 082 – – – 5 082 5 082 Unsettled deals – (1 101) – – – (1 101) (1 101)Fixed deposits – 4 005 – – – 4 005 4 005
6 374 36 349 4 802 – 14 301 61 826 61 826
Financial liabilities
Debt securities and borrowings 25 – – – 298 130 – 298 130 269 890
Eskom bonds – – – 112 103 – 112 103 114 838 Promissory notes – – – 40 – 40 47 Commercial paper – – – 7 027 – 7 027 6 873 Eurorand zero coupon bonds – – – 3 942 – 3 942 3 594 Foreign bonds – – – 48 670 – 48 670 48 585 Development financing institutions – – – 62 447 – 62 447 49 691 Export credit facilities – – – 28 488 – 28 488 27 966 Subordinated loan from shareholder – – – 26 621 – 26 621 12 420 Other loans – – – 8 792 – 8 792 5 876
Embedded derivatives 26 – – – – 8 021 8 021 8 021
Derivatives held for risk management 16 1 335 – – – 4 151 5 486 5 486
Foreign exchange contracts 824 – – – 1 530 2 354 2 354 Cross-currency swaps 11 – – – 2 621 2 632 2 632 Commodity forwards 1 – – – – 1 1 Credit default swaps 499 – – – – 499 499
Finance lease payables1 30 – – – – 707 707 707
Trade and other payables1 31 – – – 29 788 – 29 788 29 788
Financial trading liabilities 14 5 499 – – – – 5 499 5 499
Short-sold government bonds 493 – – – – 493 493 Repurchase agreements 5 006 – – – – 5 006 5 006
6 834 – – 327 918 12 879 347 631 319 391
1. The fair values of these f inancial instruments approximate their carrying amounts. The effect of discounting is not expected to be material.

Notes to the financial statements (continued)for the year ended 31 March 2016
Eskom Holdings SOC Ltd54
6. Accounting classification, fair value and fair value hierarchy (continued)6.1 Accounting classification and fair value (continued)
Valuation processes The group has established a control framework with respect to the measurement of fair values. It includes a valuation team that ultimately reports to the chief financial officer and has overall responsibility for all significant fair value measurements.
The valuation team regularly reviews significant unobservable inputs and valuation adjustments. If third party information, such as broker quotes or pricing services, is used to measure fair value, then the valuation team assesses and documents the evidence obtained from the third parties to support their conclusion that such valuations meet the requirements of IFRS, including the level in the fair value hierarchy that the resulting fair value estimate should be classified to.
Principal markets The group is involved in various principal markets because of the unique funding activities undertaken. The fair value will be determined by each participant in the different principal markets. The principal markets are: • capital and money markets • development financing institutions • export credit agencies
6.2 Fair value hierarchy Fair value measurements are categorised into the different levels in the fair value hierarchy based on the inputs to the valuation techniques used. The valuation technique used for cross-currency swaps has been improved during the year. There were no changes in the valuation techniques applied for the other instruments. The hierarchy levels are defined as follows: Level 1: Quoted prices (unadjusted) in active markets for identical assets or liabilities. Level 2: Inputs other than quoted prices included within level 1 that are observable for the asset or liability, either directly (ie as
prices) or indirectly (ie derived from prices). Level 3: Inputs for the financial asset or financial liability that are not based on observable market data (unobservable inputs).
The group recognises transfers between levels of the fair value hierarchy at the end of the reporting period during which the transfers have occurred.
Eskom’s policy for determining when transfers between levels in the hierarchy have occurred includes monitoring of the following factors: • changes in market and trading activity (eg significant increases/decreases in activity) • changes in inputs used in valuation techniques (eg inputs becoming/ceasing to be observable in the market)
There were no transfers between level 1, 2 or 3 of the fair value hierarchy during the year.
The valuation techniques used are as follows:
Level 1: Quoted prices (unadjusted) in active markets The fair values of financial instruments traded in active markets are based on quoted market prices at the reporting date. A market is regarded as active when it is a market in which transactions for the asset or liability take place with sufficient frequency and volume to provide pricing information on an ongoing basis. The quoted market price used for financial assets held by the group is the current bid price. For financial liabilities included in level 1, the current ask price is used. Instruments included in level 1 comprise listed investments classified as trading securities or available for sale.
Level 2: Inputs other than quoted prices included within level 1 that are observable Financial instrument Fair value determination
Non-derivatives A discounted cash flow technique is used, which uses expected cash flows and a market-related discount rate
Derivatives Valuation determined with reference to broker quotes as well as use of discounted cash flow and option pricing models. Broker quotes are tested for reasonableness by discounting expected future cash flows using a market interest rate for a similar instrument at the measurement date
Valuations of cross-currency swaps include the credit risk of Eskom (known as debit value adjustment) and counterparties (known as credit value adjustment) where appropriate. A stochastic modelling approach is followed where the expected future exposure to credit risk for Eskom and its counterparties (considering default probabilities and recovery rates derived from market data) is modelled
Trade and other receivables and payables, and finance lease receivables and payables
The future cash flows are discounted at the implicit interest rate based on the contractual terms. The fair values approximate the carrying value as the effect of discounting at a market rate as opposed to an Eskom-specific rate is not expected to be material
Level 3: Inputs not based on observable market data (unobservable inputs) Level 3 items are fair valued using unobservable inputs (embedded derivative for measurement and disclosure and government loan for disclosure). Refer to note 26 for a movement reconciliation and to notes 4.1 and 5.2 for information regarding the valuation techniques and assumptions used.

Annual Financial Statements | 31 March 2016 55
The fair value hierarchy of financial instruments is as follows:
Group Company
Level 1 Level 2 Level 3 Total Level 1 Level 2 Level 3 TotalRm Rm Rm Rm Rm Rm Rm Rm
2016Assets measured at fair valueInvestment in securities 3 769 6 457 – 10 226 3 769 783 – 4 552
Government bonds 3 769 – – 3 769 3 769 – – 3 769 Negotiable certificates of deposit – 6 457 – 6 457 – 783 – 783
Derivatives held for risk management – 30 182 – 30 182 – 30 182 – 30 182
Foreign exchange contracts – 2 159 – 2 159 – 2 159 – 2 159 Cross-currency swaps – 27 983 – 27 983 – 27 983 – 27 983 Commodity forwards – 31 – 31 – 31 – 31 Credit default swaps – 9 – 9 – 9 – 9
Financial trading assets 1 800 2 044 – 3 844 613 2 044 – 2 657
Repurchase agreements – 2 044 – 2 044 – 2 044 – 2 044 Listed shares 1 187 – – 1 187 – – – – Government bonds 613 – – 613 613 – – 613
Assets not measured at fair valueLoans receivable – 80 – 80 – 6 352 – 6 352
Loans to subsidiaries – – – – – 6 352 – 6 352 Other – 80 – 80 – – – –
Finance lease receivables – 499 – 499 – 499 – 499
Trade and other receivables – 21 839 – 21 839 – 24 509 – 24 509
Cash and cash equivalents – 28 454 – 28 454 – 28 136 – 28 136
Bank balances – 28 452 – 28 452 – 28 134 – 28 134 Unsettled deals – 2 – 2 – 2 – 2
5 569 89 555 – 95 124 4 382 92 505 – 96 887
Liabilities measured at fair valueEmbedded derivatives – – 7 025 7 025 – – 7 025 7 025
Derivatives held for risk management – 4 873 – 4 873 – 4 886 – 4 886
Foreign exchange contracts – 1 588 – 1 588 – 1 601 – 1 601 Cross-currency swaps – 2 221 – 2 221 – 2 221 – 2 221 Credit default swaps – 1 064 – 1 064 – 1 064 – 1 064
Financial trading liabilities 227 1 023 – 1 250 227 1 023 – 1 250
Short-sold government bonds 227 – – 227 227 – – 227 Repurchase agreements – 1 023 – 1 023 – 1 023 – 1 023
Liabilities not measured at fair valueDebt securities and borrowings 120 216 162 554 – 282 770 120 216 165 853 – 286 069
Eskom bonds 120 216 – – 120 216 120 216 – – 120 216 Promissory notes – 45 – 45 – 45 – 45 Commercial paper – 4 822 – 4 822 – 6 431 – 6 431 Eurorand zero coupon bonds – 3 358 – 3 358 – 3 358 – 3 358 Foreign bonds – 54 739 – 54 739 – 54 739 – 54 739 Development financing institutions – 58 602 – 58 602 – 58 602 – 58 602 Export credit facilities – 34 465 – 34 465 – 34 465 – 34 465 Other loans – 6 523 – 6 523 – 8 213 – 8 213
Finance lease payables – 3 928 – 3 928 – 3 928 – 3 928
Trade and other payables – 32 922 – 32 922 – 34 435 – 34 435
120 443 205 300 7 025 332 768 120 443 210 125 7 025 337 593

Notes to the financial statements (continued)for the year ended 31 March 2016
Eskom Holdings SOC Ltd56
6. Accounting classification, fair value and fair value hierarchy (continued)6.2 Fair value hierarchy (continued)
Group Company
Level 1 Level 2 Level 3 Total Level 1 Level 2 Level 3 TotalRm Rm Rm Rm Rm Rm Rm Rm
2015Assets measured at fair valueInvestment in securities 4 802 3 694 – 8 496 4 802 – – 4 802
Government bonds 4 802 – – 4 802 4 802 – – 4 802 Negotiable certificates of deposit – 3 694 – 3 694 – – – –
Derivatives held for risk management – 15 012 – 15 012 – 15 012 – 15 012
Foreign exchange contracts – 585 – 585 – 585 – 585 Cross-currency swaps – 14 410 – 14 410 – 14 410 – 14 410 Commodity forwards – 8 – 8 – 8 – 8 Credit default swaps – 9 – 9 – 9 – 9
Financial trading assets 1 238 5 084 – 6 322 59 5 084 – 5 143
Repurchase agreements – 5 084 – 5 084 – 5 084 – 5 084 Listed shares 1 179 – – 1 179 – – – – Government bonds 59 – – 59 59 – – 59
Assets not measured at fair valueLoans receivable – 7 474 – 7 474 – 6 553 – 6 553
Secured by mortgages – 7 315 – 7 315 – – – – Loans to subsidiaries – – – – – 6 553 – 6 553 Other – 159 – 159 – – – –
Finance lease receivables – 520 – 520 – 520 – 520
Trade and other receivables – 19 598 – 19 598 – 21 810 – 21 810
Cash and cash equivalents – 8 863 – 8 863 – 7 986 – 7 986
Bank balances – 5 959 – 5 959 – 5 082 – 5 082 Unsettled deals – (1 101) – (1 101) – (1 101) – (1 101)Fixed deposits – 4 005 – 4 005 – 4 005 – 4 005
6 040 60 245 – 66 285 4 861 56 965 – 61 826
Liabilities measured at fair valueEmbedded derivatives – – 8 022 8 022 – – 8 021 8 021
Derivatives held for risk management – 5 486 – 5 486 – 5 486 – 5 486
Foreign exchange contracts – 2 354 – 2 354 – 2 354 – 2 354 Cross-currency swaps – 2 632 – 2 632 – 2 632 – 2 632 Commodity forwards – 1 – 1 – 1 – 1 Credit default swaps – 499 – 499 – 499 – 499
Financial trading liabilities 493 5 006 – 5 499 493 5 006 – 5 499
Short-sold government bonds 493 – – 493 493 – – 493 Repurchase agreements – 5 006 – 5 006 – 5 006 – 5 006
Liabilities not measured at fair valueDebt securities and borrowings 114 838 141 937 12 420 269 195 114 838 142 632 12 420 269 890
Eskom bonds 114 838 – – 114 838 114 838 – – 114 838 Promissory notes – 47 – 47 – 47 – 47 Commercial paper – 7 377 – 7 377 – 6 873 – 6 873 Eurorand zero coupon bonds – 3 594 – 3 594 – 3 594 – 3 594 Foreign bonds – 48 585 – 48 585 – 48 585 – 48 585 Development financing institutions – 49 691 – 49 691 – 49 691 – 49 691 Export credit facilities – 27 966 – 27 966 – 27 966 – 27 966 Subordinated loan from shareholder – – 12 420 12 420 – – 12 420 12 420 Other loans – 4 677 – 4 677 – 5 876 – 5 876
Finance lease payables – 488 – 488 – 707 – 707
Trade and other payables – 28 419 – 28 419 – 29 788 – 29 788
115 331 181 336 20 442 317 109 115 331 183 619 20 441 319 391
Annual Financial Statements | 31 March 2016 57
7. Segment information Management has determined the reportable segments based on the reports regularly provided, reviewed and used by Exco to make strategic decisions and assess performance of the segments. Exco assesses the performance of the operating segments based on a measure of profit or loss consistent with that of the financial statements. The amounts provided to Exco with respect to total assets and liabilities are measured in terms of IFRS. These assets and liabilities are allocated based on the operation of the segment and the physical location of the assets.
The operations in each of the group’s reportable segments are as follows:
Generation Consists of the generation and primary energy functions. These functions procure primary energy and generate electricity for sale
Transmission Consists of the transmission grids and the integrated demand management functions. These functions operate and maintain the transmission network for transmitting electricity and is responsible for the energy efficiency programmes
Distribution Distribution consists of nine provincial operating units. These units provide, operate and maintain the distribution network for distributing electricity
Energy purchases/sales The Southern African energy and Energy planning and market development segments have been aggregated. They both deal with decisions involving energy purchases and sales to southern Africa and would be influenced by the same sales demand trends. Their activities include systems operations, purchase or sale of electricity from or to southern African countries, purchase of electricity from IPPs and wholesale energy for the purposes of energy trading
Group customer services Group customer services consists of the customer service function that sells electricity to local large power users (including municipalities) and local small power users
Group capital Group capital is responsible for the planning, development and monitoring of all capital projects and the execution of capacity expansion projects
All other segments Relates to operating segments which are below the quantitative thresholds for determining a reportable segment in terms of IFRS 8 Operating segments which includes the group’s subsidiaries as well as all service and strategic functions which do not qualify as a reportable segment in terms of IFRS 8
As a consequence of the group’s changing operational environment and circumstances the activities relating to the Southern African energy and Energy planning and market development segments have increased above the quantitative thresholds for determining a reportable segment in terms of IFRS 8. The prior year's segment report has been restated in line with the revised reportable segment structure.
The revenue earned by subsidiaries is presented in the segment note in line with what has been reported in the respective subsidiary financial statements. Inter-segment revenue and purchases of electricity are allocated between Generation, Transmission, Distribution, Energy purchases/sales and Group customer services segments based on cost recovery plus a uniform return on assets.
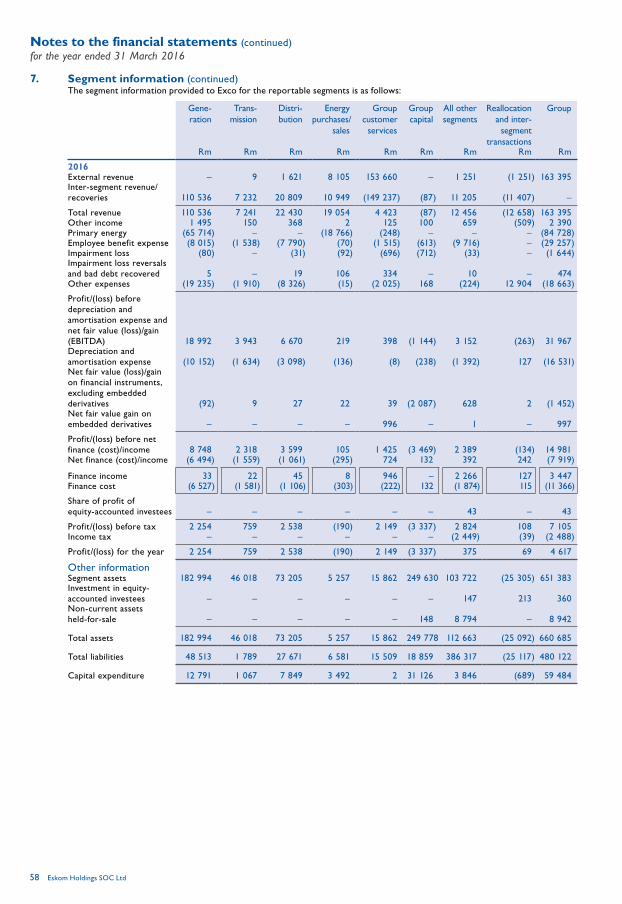
Notes to the financial statements (continued)for the year ended 31 March 2016
Eskom Holdings SOC Ltd58
7. Segment information (continued)The segment information provided to Exco for the reportable segments is as follows:
Gene-ration
Trans-mission
Distri-bution
Energy purchases/
sales
Group customer
services
Group capital
All other segments
Reallocation and inter-
segment transactions
Group
Rm Rm Rm Rm Rm Rm Rm Rm Rm
2016External revenue – 9 1 621 8 105 153 660 – 1 251 (1 251) 163 395 Inter-segment revenue/recoveries 110 536 7 232 20 809 10 949 (149 237) (87) 11 205 (11 407) –
Total revenue 110 536 7 241 22 430 19 054 4 423 (87) 12 456 (12 658) 163 395 Other income 1 495 150 368 2 125 100 659 (509) 2 390 Primary energy (65 714) – – (18 766) (248) – – – (84 728)Employee benefit expense (8 015) (1 538) (7 790) (70) (1 515) (613) (9 716) – (29 257)Impairment loss (80) – (31) (92) (696) (712) (33) – (1 644)Impairment loss reversals and bad debt recovered 5 – 19 106 334 – 10 – 474 Other expenses (19 235) (1 910) (8 326) (15) (2 025) 168 (224) 12 904 (18 663)
Profit/(loss) before depreciation and amortisation expense and net fair value (loss)/gain (EBITDA) 18 992 3 943 6 670 219 398 (1 144) 3 152 (263) 31 967Depreciation and amortisation expense (10 152) (1 634) (3 098) (136) (8) (238) (1 392) 127 (16 531)Net fair value (loss)/gain on financial instruments, excluding embedded derivatives (92) 9 27 22 39 (2 087) 628 2 (1 452)Net fair value gain on embedded derivatives – – – – 996 – 1 – 997
Profit/(loss) before net finance (cost)/income 8 748 2 318 3 599 105 1 425 (3 469) 2 389 (134) 14 981Net finance (cost)/income (6 494) (1 559) (1 061) (295) 724 132 392 242 (7 919)
Finance income 33 22 45 8 946 – 2 266 127 3 447Finance cost (6 527) (1 581) (1 106) (303) (222) 132 (1 874) 115 (11 366)
Share of profit of equity-accounted investees – – – – – – 43 – 43
Profit/(loss) before tax 2 254 759 2 538 (190) 2 149 (3 337) 2 824 108 7 105Income tax – – – – – – (2 449) (39) (2 488)
Profit/(loss) for the year 2 254 759 2 538 (190) 2 149 (3 337) 375 69 4 617
Other informationSegment assets 182 994 46 018 73 205 5 257 15 862 249 630 103 722 (25 305) 651 383 Investment in equity-accounted investees – – – – – – 147 213 360 Non-current assets held-for-sale – – – – – 148 8 794 – 8 942
Total assets 182 994 46 018 73 205 5 257 15 862 249 778 112 663 (25 092) 660 685
Total liabilities 48 513 1 789 27 671 6 581 15 509 18 859 386 317 (25 117) 480 122
Capital expenditure 12 791 1 067 7 849 3 492 2 31 126 3 846 (689) 59 484

Annual Financial Statements | 31 March 2016 59
Gene-ration
Trans-mission
Distri-bution
Energy purchases/
sales
Group customer
services
Group capital
All other segments
Reallocation and inter-
segment transactions
Group
Rm Rm Rm Rm Rm Rm Rm Rm Rm
2015Continuing operationsExternal revenue – 125 1 210 6 326 140 030 – 1 112 (1 112) 147 691 Inter-segment revenue/recoveries 102 072 5 877 18 903 6 743 (133 595) – 9 613 (9 613) –
Total revenue 102 072 6 002 20 113 13 069 6 435 – 10 725 (10 725) 147 691 Other income 5 009 477 670 – 120 115 606 (2 553) 4 444 Primary energy (69 981) – – (13 133) (309) (2) – – (83 425)Employee benefit expense (7 034) (1 379) (6 864) (62) (1 414) (577) (8 582) – (25 912)Impairment loss (88) (3) (7) (1) (2 701) (23) (1 082) – (3 905)Impairment loss reversals and bad debt recovered 7 6 10 – 101 3 12 – 139 Other expenses (17 365) (2 047) (8 675) (29) (1 930) 197 1 622 12 456 (15 771)
Profit/(loss) before depreciation and amortisation expense and net fair value (loss)/gain (EBITDA) 12 620 3 056 5 247 (156) 302 (287) 3 301 (822) 23 261Depreciation and amortisation expense (8 029) (1 448) (2 904) (1) (8) (57) (1 768) 100 (14 115)Net fair value (loss)/gain on financial instruments, excluding embedded derivatives (514) (251) (31) 103 (53) (3 007) (358) (6) (4 117)Net fair value gain on embedded derivatives – – – – 1 310 – – – 1 310
Profit/(loss) before net finance (cost)/income 4 077 1 357 2 312 (54) 1 551 (3 351) 1 175 (728) 6 339
Net finance (cost)/income (5 476) (1 080) (851) – 497 (26) 587 240 (6 109)
Finance income 13 9 47 – 692 – 2 062 173 2 996 Finance cost (5 489) (1 089) (898) – (195) (26) (1 475) 67 (9 105)
Share of profit of equity-accounted investees – – – – – – 49 – 49
(Loss)/profit before tax (1 399) 277 1 461 (54) 2 048 (3 377) 1 811 (488) 279Income tax – – – – – – 97 (134) (37)
(Loss)/profit for the year from continuing operations (1 399) 277 1 461 (54) 2 048 (3 377) 1 908 (622) 242
Discontinued operationsLoss for the year from discontinued operations – – – – – – (42) – (42)
(Loss)/profit for the year (1 399) 277 1 461 (54) 2 048 (3 377) 1 866 (622) 200

Notes to the financial statements (continued)for the year ended 31 March 2016
Eskom Holdings SOC Ltd60
7. Segment information (continued)Gene-ration
Trans-mission
Distri-bution
Energy purchases/
sales
Group customer
services
Group capital
All other segments
Reallocation and inter-
segment transactions
Group
Rm Rm Rm Rm Rm Rm Rm Rm Rm
2015Other informationSegment assets 131 558 39 671 69 632 1 006 14 488 249 059 74 519 (22 336) 557 597 Investment in equity-accounted investees – – – – – – 150 198 348
Total assets 131 558 39 671 69 632 1 006 14 488 249 059 74 669 (22 138) 557 945
Total segment liabilities 44 480 1 536 24 868 2 554 16 372 16 121 356 823 (21 973) 440 781
Capital expenditure 11 449 2 842 6 615 – 9 29 753 1 420 (1 025) 51 063
Group
Revenue Non-current assets
2016 2015 2016 2015Geographical information Rm Rm Rm Rm
South Africa 155 339 141 384 534 427 471 178 Foreign countries 8 056 6 307 188 134
163 395 147 691 534 615 471 312
The group’s reportable segments operate mainly in South Africa, which is Eskom’s country of domicile.
Revenue is allocated based on the country in which the customer is located after eliminating inter-segment transactions. There is no significant revenue derived from a single external customer by any of the reportable segments.
Non-current assets disclosed for geographical information comprise non-current assets other than deferred tax assets and financial instruments.
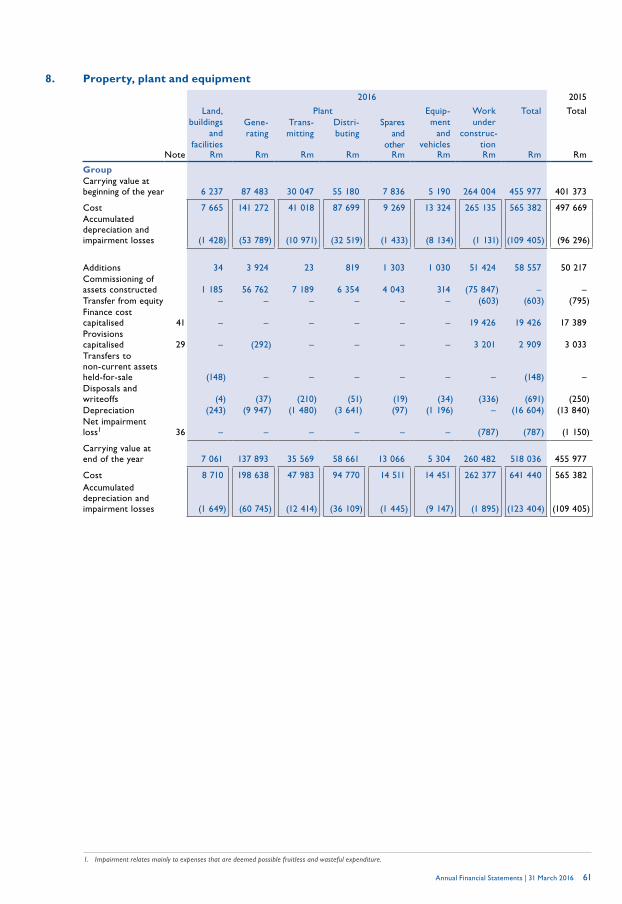
Annual Financial Statements | 31 March 2016 61
8. Property, plant and equipment
2016 2015
Land, buildings
and facilities
Plant Equip-ment
and vehicles
Work under
construc-tion
Total TotalGene-rating
Trans-mitting
Distri-buting
Spares and
otherNote Rm Rm Rm Rm Rm Rm Rm Rm Rm
GroupCarrying value at beginning of the year 6 237 87 483 30 047 55 180 7 836 5 190 264 004 455 977 401 373
Cost 7 665 141 272 41 018 87 699 9 269 13 324 265 135 565 382 497 669 Accumulated depreciation and impairment losses (1 428) (53 789) (10 971) (32 519) (1 433) (8 134) (1 131) (109 405) (96 296)
Additions 34 3 924 23 819 1 303 1 030 51 424 58 557 50 217 Commissioning of assets constructed 1 185 56 762 7 189 6 354 4 043 314 (75 847) – – Transfer from equity – – – – – – (603) (603) (795)Finance cost capitalised 41 – – – – – – 19 426 19 426 17 389 Provisions capitalised 29 – (292) – – – – 3 201 2 909 3 033 Transfers to non-current assets held-for-sale (148) – – – – – – (148) – Disposals and writeoffs (4) (37) (210) (51) (19) (34) (336) (691) (250)Depreciation (243) (9 947) (1 480) (3 641) (97) (1 196) – (16 604) (13 840)Net impairment loss1 36 – – – – – – (787) (787) (1 150)
Carrying value at end of the year 7 061 137 893 35 569 58 661 13 066 5 304 260 482 518 036 455 977
Cost 8 710 198 638 47 983 94 770 14 511 14 451 262 377 641 440 565 382 Accumulated depreciation and impairment losses (1 649) (60 745) (12 414) (36 109) (1 445) (9 147) (1 895) (123 404) (109 405)
1. Impairment relates mainly to expenses that are deemed possible fruitless and wasteful expenditure.

Notes to the financial statements (continued)for the year ended 31 March 2016
Eskom Holdings SOC Ltd62
8. Property, plant and equipment (continued)
2016 2015
Land, buildings
and facilities
Plant Equip-ment
and vehicles
Work under
construc-tion
Total TotalGene-rating
Trans-mitting
Distri-buting
Spares and
otherNote Rm Rm Rm Rm Rm Rm Rm Rm Rm
CompanyCarrying value at beginning of the year 6 124 88 335 30 083 55 340 7 865 4 684 265 037 457 468 402 207
Cost 7 476 142 514 41 058 87 895 9 334 11 955 266 168 566 400 497 181 Accumulated depreciation and impairment losses (1 352) (54 179) (10 975) (32 555) (1 469) (7 271) (1 131) (108 932) (94 974)
Additions 31 4 103 53 848 1 291 821 51 473 58 620 49 059 Commissioning of assets constructed 1 155 56 762 7 189 6 354 4 043 285 (75 788) – – Common control asset transfer – – – – – – – – 1 774 Transfer from equity – – – – – – (603) (603) (795)Finance cost capitalised 41 – – – – – – 19 426 19 426 17 389 Provisions capitalised 29 – (292) – – – – 3 201 2 909 3 033 Transfers to non-current assets held- for-sale (148) – – – – – – (148) – Disposals and writeoffs (4) (37) (210) (51) (34) (301) (336) (973) (239)Depreciation (242) (10 068) (1 482) (3 651) (99) (1 086) – (16 628) (13 811)Net impairment loss1 36 – – – – – – (787) (787) (1 149)
Carrying value at end of the year 6 916 138 803 35 633 58 840 13 066 4 403 261 623 519 284 457 468
Cost 8 488 200 080 48 053 94 995 14 511 12 460 263 518 642 105 566 400 Accumulated depreciation and impairment losses (1 572) (61 277) (12 420) (36 155) (1 445) (8 057) (1 895) (122 821) (108 932)
Group Company
2016 2015 2016 2015Note Rm Rm Rm Rm
Carrying value of leased assets 3 528 184 3 528 483
Generating plant 3 357 – 3 357 – Spares and other plant 171 184 171 202 Equipment and vehicles – – – 281
The total depreciation charge for property, plant and equipment is disclosed in profit or loss in the following categories: 16 604 13 840 16 628 13 811
Depreciation and amortisation expense 38 16 591 13 827 16 615 13 798 Primary energy 13 13 13 13
Group and company
2016 2015% %
Average rates of finance cost capitalised to qualifying assets:General borrowings 9.77 9.63 Specific borrowings 8.79 8.40
Details of land and buildings are available for examination at the registered offices of the respective businesses. None of the assets are encumbered or held as security.
1. Impairment relates mainly to expenses that are deemed possible fruitless and wasteful expenditure.

Annual Financial Statements | 31 March 2016 63
9. Intangible assets
2016 2015
Rights Computer software
Concession assets
Total Total
Note Rm Rm Rm Rm Rm
GroupCarrying value at beginning of the year 1 792 978 134 2 904 3 016
Cost 2 012 5 857 215 8 084 7 291 Accumulated depreciation and impairment losses (220) (4 879) (81) (5 180) (4 275)
Additions and transfers 394 463 70 927 846 Disposals and writeoffs – – – – (19)Amortisation 38 – (677) (16) (693) (939)
Carrying value at end of the year 2 186 764 188 3 138 2 904
Cost 2 406 6 259 296 8 961 8 084 Accumulated depreciation and impairment losses (220) (5 495) (108) (5 823) (5 180)
CompanyCarrying value at beginning of the year 1 792 954 – 2 746 2 810
Cost 2 012 5 527 – 7 539 6 748 Accumulated depreciation and impairment losses (220) (4 573) – (4 793) (3 938)
Additions and transfers 394 459 – 853 795 Common control asset transfer – – – – 14 Disposals and writeoffs – – – – (19)Amortisation 38 – (655) – (655) (854)
Carrying value at end of the year 2 186 758 – 2 944 2 746
Cost 2 406 5 941 – 8 347 7 539 Accumulated depreciation and impairment losses (220) (5 183) – (5 403) (4 793)
Rights have been assessed for impairment as they have an indefinite useful life. The recoverable amount of the rights is based on the fair value less costs of disposal. The fair value is based on current prices which have been derived from the most recent comparable market transactions for similar servitude rights (level 2 fair value hierarchy).
10. Future fuel suppliesGroup and company
2016 2015
Coal Nuclear Total TotalNote Rm Rm Rm Rm
Carrying value at beginning of the year 8 732 347 9 079 8 744 Net additions 250 1 499 1 749 1 999 Provisions capitalised 29 2 442 – 2 442 524 Writeoff of mine assets (1 903) – (1 903) – Transfer from equity – – – (341)Transfer to inventories (865) – (865) (1 847)
Carrying value at end of the year 8 656 1 846 10 502 9 079

Notes to the financial statements (continued)for the year ended 31 March 2016
Eskom Holdings SOC Ltd64
11. Investment in equity-accounted investeesGroup Company
2016 2015 2016 2015Rm Rm Rm Rm
11.1 Investment in joint venturesBalance at beginning of the year 348 318 95 95 Share of profit after tax 43 49 – – Dividends received (31) (19) – –
Balance at end of the year 360 348 95 95
The group’s investments in the joint ventures are not considered to be individually material. The group’s share of the results of its significant joint ventures, all of which are unlisted, is as follows:
Name Main business Country of incorporation
Interest held
Post-tax profit for the year
2016 2015% Rm Rm
Group2016Directly heldMotraco – Mozambique Transmission Company SARL1 Electricity
transmissionMozambique
33 47 45 Indirectly heldTrans Africa Projects (Pty) Ltd Engineering
servicesSouth Africa
50 (4) 4
43 49
SDR/United Engineers Joint Venture has been liquidated on 24 August 2015.
The share capital of the group’s investment in joint ventures comprises ordinary shares. The joint ventures are structured as separate vehicles and the group has a residual interest in the net assets. The relevant activities are jointly controlled in accordance with the agreements under which the entities are established. The joint arrangements have therefore been classified as joint ventures.
11.2 Investment in associates The carrying value of investment in associates is Rnil (2015: Rnil). The group has investments in Uitenhage Electricity Supply Company (Pty) Ltd (Uitesco) which ceased trading in 2008 and is in the process of being wound up and Western Power Corridor Company (Pty) Ltd (Westcor) that is dormant.
12. Investment in subsidiariesCompany
2016 2015Rm Rm
Shares at cost 384 384 Indebtedness – 71
384 455
1. Issued/stated capital in foreign currency. Year end is 31 December.

Annual Financial Statements | 31 March 2016 65
Name Main business Country of incorporation
Issued/stated share
capital
Interest held
Investment at cost
Indebted-ness
R % Rm Rm
Directly held2016Escap SOC Ltd Insurance South Africa 379 500 000 100 380 – Eskom Development Foundation NPC
Corporate social investment South Africa– 100 – –
Eskom Enterprises SOC Ltd
Non-regulated electricity supply industry activities in South Africa and electricity supply and related services outside South Africa
South Africa
99 000 100 –1 – Eskom Finance Company SOC Ltd2
Finance (employee housing loans) South Africa4 000 100 –1 –
Natal Navigation Collieries and Estate Company SOC Ltd
Property holding South Africa
771 425 100 – – PN Energy Services SOC Ltd
Not trading South Africa1 500 000 100 4 –
384 –
2015Escap SOC Ltd Insurance South Africa 379 500 000 100 380 – Eskom Development Foundation NPC
Corporate social investment South Africa– 100 – –
Eskom Enterprises SOC Ltd
Non-regulated electricity supply industry activities in South Africa and electricity supply and related services outside South Africa
South Africa
99 000 100 –1 713 Eskom Finance Company SOC Ltd
Finance (employee housing loans) South Africa4 000 100 –1 –
Natal Navigation Collieries and Estate Company SOC Ltd
Property holding South Africa
771 425 100 – – PN Energy Services SOC Ltd
Not trading South Africa1 500 000 100 4 –
384 71
2016 2015
Name Main business Country of incorporation
Issued/stated share
capital
Interest held
Issued/stated share
capital
Interest held
R % R %
Indirectly heldEskom Rotek Industries SOC Ltd4
Construction and abnormal load transportation
South Africa1 100 1 100
Eskom Uganda Ltd5 Operations management Uganda 100 100 100 100 Golang Coal SOC Ltd Coal exports South Africa 1 000 67 1 000 67 Nqaba Finance 1 (RF) Ltd2, 6
Residential backed mortgage securities
South Africa100 100 100 100
Pebble Bed Modular Reactor SOC Ltd
Reactor driven generation project
South Africa100 100 100 100
Rosherville Properties SOC Ltd
Properties South Africa1 100 1 100
Rotek Industries SOC Ltd4
Maintenance and services South Africa– – 4 000 100
South Dunes Coal Terminal SOC Ltd7
Coal exports South Africa2 667 75 4 000 50
1. Nominal. 2. Classif ied as held-for-sale. Refer to note 22. 3. The equity loan of Eskom Enterprises SOC Ltd was interest free. 4. The operations of Rotek Industries SOC Ltd and Roschcon SOC Ltd have been amalgamated effective from 1 April 2015 and are now trading as Eskom Rotek Industries SOC
Ltd. Roschon SOC Ltd was renamed to Eskom Rotek Industries SOC Ltd and Rotek Industries SOC Ltd was deregistered on 26 May 2015. 5. Issued/stated capital in foreign currency. Year end is 31 December. 6. Nqaba is a securitisation vehicle. 7. The shareholding in South Dunes Coal Terminal SOC Ltd increased while the total equity for the group remained unchanged as a result of restructuring during the year.

Notes to the financial statements (continued)for the year ended 31 March 2016
Eskom Holdings SOC Ltd66
12. Investment in subsidiaries (continued)All the subsidiaries continue to be accounted for as previously assessed as there has not been any change in the control assessment.
The group does not have any subsidiaries with a material non-controlling interest.
The following subsidiaries are dormant: • Eskom Enterprises Global West Africa (process of liquidation) • Nempskom Communications Ltd (process of liquidation)
Technology Services International SOC Ltd was deregistered on 18 June 2015.
13. Deferred taxGroup Company
2016 2015 2016 2015Note Rm Rm Rm Rm
13.1 Deferred tax assetsBalance at beginning of the year 230 339 – – Transfer from profit or loss 42 (56) (109) – –
Balance at end of the year 174 230 – –
Comprising 174 230 – –
Property, plant and equipment 135 (29) – – Provisions 16 90 – – Tax losses 22 169 – – Investment in securities 1 – – –
13.2 Deferred tax liabilitiesBalance at beginning of the year 18 154 18 813 17 848 18 194 Transfer from profit or loss 42 1 890 (201) 1 697 (160)Transfer from statement of comprehensive income 42 2 522 (458) 2 521 (451)Conversion of subordinated loan from the shareholder to share capital (1 445) – (1 445) – Common control transfer of assets – – – 265 Transfer to non-current assets held-for-sale (121) – – –
Balance at end of the year 21 000 18 154 20 621 17 848
Comprising 21 000 18 154 20 621 17 848
Property, plant and equipment 49 343 42 390 48 816 41 959 Inventories 2 205 2 187 2 206 2 187 Provisions (17 557) (14 800) (17 394) (14 700)Tax losses (10 795) (6 578) (10 794) (6 574)Embedded derivative liabilities (1 966) (2 246) (1 967) (2 246)Investment in securities 18 2 (13) 2 Cash flow hedges 4 567 2 264 4 567 2 264 Payments received in advance (4 833) (4 844) (4 832) (4 843)Employee benefit obligations 18 (221) 32 (201)
Unused tax losses available for offset against future taxable income 38 632 24 096 38 550 23 479

Annual Financial Statements | 31 March 2016 67
14. Investment in securities and financial trading instruments
Portfolio Managed by Purpose
Market-making Treasury Reduce the cost of borrowing
Investing Treasury Temporary investments where funds have been received but have not yet been spent
Insurance Escap Investments in terms of short-term insurance regulations in South Africa to maintain adequate ring-fenced capital reserves
2016 2015
Market- making
Investing Insurance Total Market- making
Investing Insurance Total
Rm Rm Rm Rm Rm Rm Rm Rm
14.1 Investment in securitiesGroupGovernment bonds – 3 769 – 3 769 – 4 802 – 4 802 Negotiable certificates of deposit – 783 5 674 6 457 – – 3 694 3 694
– 4 552 5 674 10 226 – 4 802 3 694 8 496
Maturity analysis – 4 552 5 674 10 226 – 4 802 3 694 8 496
Non-current – 2 485 – 2 485 – 2 481 – 2 481 Current – 2 067 5 674 7 741 – 2 321 3 694 6 015
CompanyGovernment bonds – 3 769 – 3 769 – 4 802 – 4 802 Negotiable certificates of deposit – 783 – 783 – – – –
– 4 552 – 4 552 – 4 802 – 4 802
Maturity analysis – 4 552 – 4 552 – 4 802 – 4 802
Non-current – 2 485 – 2 485 – 2 481 – 2 481 Current – 2 067 – 2 067 – 2 321 – 2 321
14.2 Financial trading assetsGroupRepurchase agreements 2 044 – – 2 044 5 084 – – 5 084
Eskom bonds 1 479 – – 1 479 2 323 – – 2 323 Government bonds 565 – – 565 2 761 – – 2 761
Listed shares – – 1 187 1 187 – – 1 179 1 179 Government bonds 613 – – 613 59 – – 59
2 657 – 1 187 3 844 5 143 – 1 179 6 322
CompanyRepurchase agreements 2 044 – – 2 044 5 084 – – 5 084
Eskom bonds 1 479 – – 1 479 2 323 – – 2 323 Government bonds 565 – – 565 2 761 – – 2 761
Government bonds 613 – – 613 59 – – 59
2 657 – – 2 657 5 143 – – 5 143
Collateral heldEskom purchased both Eskom and government bonds from approved counterparties and has committed to resell this back to the counterparties in the following financial year. Although Eskom has legal title to the bonds at year end, they have not been recognised on the statement of financial position as a result of the commitment to resell. The total receivable is secured by bonds of an equivalent fair value.

Notes to the financial statements (continued)for the year ended 31 March 2016
Eskom Holdings SOC Ltd68
14. Investment in securities and financial trading instruments (continued)14.3 Financial trading liabilities
2016 2015
Market- making
Investing Insurance Total Market- making
Investing Insurance Total
Rm Rm Rm Rm Rm Rm Rm Rm
GroupShort-sold government bonds 227 – – 227 493 – – 493 Repurchase agreements 1 023 – – 1 023 5 006 – – 5 006
Eskom bonds 118 – – 118 1 555 – – 1 555 Government bonds 905 – – 905 3 451 – – 3 451
1 250 – – 1 250 5 499 – – 5 499
CompanyShort-sold government bonds 227 – – 227 493 – – 493 Repurchase agreements 1 023 – – 1 023 5 006 – – 5 006
Eskom bonds 118 – – 118 1 555 – – 1 555 Government bonds 905 – – 905 3 451 – – 3 451
1 250 – – 1 250 5 499 – – 5 499
Encumbered assetsEskom concluded sale and repurchase transactions of both Eskom and government bonds with approved counterparties. The group enters into transactions whereby it transfers assets recognised on its statement of financial position, but retains either all or substantially all of the risks and rewards of the transferred assets or a portion of them. If all or substantially all risks and rewards are retained, then the transferred assets are not derecognised.
15. Loans receivable
2016 2015
Grossvalue
Allow-ance for impair-
ment
Carrying value
Grossvalue
Allow-ance for impair-
ment
Carryingvalue
Rm Rm Rm Rm Rm Rm
GroupHome loans – non-defaulting employees – – – 7 694 (4) 7 690 Home loans – other – – – 990 (21) 969 Other 80 – 80 273 (17) 256
80 – 80 8 957 (42) 8 915
Maturity analysis 80 8 915
Non-current 70 8 646 Current 10 269
CompanyLoans to subsidiaries 6 352 – 6 352 6 553 – 6 553
Maturity analysis 6 352 6 553
Non-current – – Current 6 352 6 553
Group
2016 2015Rm Rm
Reconciliation of movements in allowance for impairmentBalance at beginning of the year 42 35 Net impairment loss 11 14 Writeoffs (18) (7)Transfer to non-current assets held-for-sale (35) –
Balance at end of the year – 42

Annual Financial Statements | 31 March 2016 69
16. Derivatives held for risk management
2016 2015
Foreign exchange contracts
Cross-currency
swaps
Commo-dity
forwards
Credit default swaps
Total Foreign exchange contracts
Cross-currency
swaps
Commo-dity
forwards
Credit default swaps
Total
Rm Rm Rm Rm Rm Rm Rm Rm Rm Rm
GroupNet (liability)/asset at beginning of the year (1 769) 11 778 7 (490) 9 526 1 638 6 663 51 1 8 353 Net fair value gain/(loss) 9 073 20 837 39 (565) 29 384 (6 033) 5 522 (53) (496) (1 060)
Income statement 5 885 15 070 39 (565) 20 429 (4 723) 3 584 (53) (496) (1 688)Statement of comprehensive income 3 188 5 767 – – 8 955 (1 310) 1 938 – – 628
Finance income accrued – (291) – (49) (340) 1 (251) – 5 (245)Cash (received)/paid (6 733) (6 562) (15) 49 (13 261) 2 625 (156) 9 – 2 478
Net asset/(liability) at end of the year 571 25 762 31 (1 055) 25 309 (1 769) 11 778 7 (490) 9 526
Hedge exposure covered 571 25 762 31 (1 055) 25 309 (1 769) 11 778 7 (490) 9 526
Debt securities and borrowings (766) 25 762 – (1 055) 23 941 (460) 11 778 – (490) 10 828 Other 1 337 – 31 – 1 368 (1 309) – 7 – (1 302)
AssetsEconomic hedging 1 008 82 31 9 1 130 501 713 8 9 1 231 Cash flow hedging 1 151 27 901 – – 29 052 84 13 697 – – 13 781
2 159 27 983 31 9 30 182 585 14 410 8 9 15 012
Maturity analysis 2 159 27 983 31 9 30 182 585 14 410 8 9 15 012
Non-current – 27 600 – – 27 600 – 14 303 – – 14 303 Current 2 159 383 31 9 2 582 585 107 8 9 709
LiabilitiesEconomic hedging 1 482 382 – 1 064 2 928 824 11 1 499 1 335 Cash flow hedging 106 1 839 – – 1 945 1 530 2 621 – – 4 151
1 588 2 221 – 1 064 4 873 2 354 2 632 1 499 5 486
Maturity analysis 1 588 2 221 – 1 064 4 873 2 354 2 632 1 499 5 486
Non-current – 1 798 – 1 064 2 862 – 2 142 – 499 2 641 Current 1 588 423 – – 2 011 2 354 490 1 – 2 845
Notional amount m m m m m m m m m m
EUR 2 340 1 036 – – 3 376 2 571 1 143 – – 3 714 USD 706 4 8911 – – 5 597 1 784 3 412 – – 5 196 GBP 54 – – – 54 68 – – – 68 JPY 254 12 366 – – 12 620 911 14 840 – – 15 751 SEK 51 – – – 51 48 – – – 48 AUD 2 – – – 2 – – – – – CHF 2 – – – 2 14 – – – 14 CAD 4 – – – 4 3 – – – 3 NOK 3 – – – 3 1 – – – 1 ZAR – – 468 6 868 7 336 – – 482 6 868 7 350
1. Includes forward starting cross-currency swaps of USD300 million.

Notes to the financial statements (continued)for the year ended 31 March 2016
Eskom Holdings SOC Ltd70
16. Derivatives held for risk management (continued)
2016 2015
Foreign exchangecontracts
Cross-currency
swaps
Commo-dity
forwards
Credit default swaps
Total Foreign exchangecontracts
Cross-currency
swaps
Commo-dity
forwards
Credit default
swaps
Total
Rm Rm Rm Rm Rm Rm Rm Rm Rm Rm
CompanyNet (liability)/asset at beginning of the year (1 769) 11 778 7 (490) 9 526 1 638 6 663 51 1 8 353 Net fair value gain/(loss) 9 039 20 837 39 (565) 29 350 (6 033) 5 522 (53) (496) (1 060)
Income statement 5 851 15 070 39 (565) 20 395 (4 723) 3 584 (53) (496) (1 688)Statement of comprehensive income 3 188 5 767 – – 8 955 (1 310) 1 938 – – 628
Finance income accrued – (291) – (49) (340) 1 (251) – 5 (245)Cash (received)/paid (6 712) (6 562) (15) 49 (13 240) 2 625 (156) 9 – 2 478
Net asset/(liability) at end of the year 558 25 762 31 (1 055) 25 296 (1 769) 11 778 7 (490) 9 526
Hedge exposure covered 558 25 762 31 (1 055) 25 296 (1 769) 11 778 7 (490) 9 526
Debt securities and borrowings (766) 25 762 – (1 055) 23 941 (460) 11 778 – (490) 10 828 Other 1 324 – 31 – 1 355 (1 309) – 7 – (1 302)
AssetsEconomic hedging 1 008 82 31 9 1 130 501 713 8 9 1 231 Cash flow hedging 1 151 27 901 – – 29 052 84 13 697 – – 13 781
2 159 27 983 31 9 30 182 585 14 410 8 9 15 012
Maturity analysis 2 159 27 983 31 9 30 182 585 14 410 8 9 15 012
Non-current – 27 600 – – 27 600 – 14 303 – – 14 303 Current 2 159 383 31 9 2 582 585 107 8 9 709
LiabilitiesEconomic hedging 1 495 382 – 1 064 2 941 824 11 1 499 1 335 Cash flow hedging 106 1 839 – – 1 945 1 530 2 621 – – 4 151
1 601 2 221 – 1 064 4 886 2 354 2 632 1 499 5 486
Maturity analysis 1 601 2 221 – 1 064 4 886 2 354 2 632 1 499 5 486
Non-current – 1 798 – 1 064 2 862 – 2 142 – 499 2 641 Current 1 601 423 – – 2 024 2 354 490 1 – 2 845
Notional amount m m m m m m m m m m
EUR 2 317 1 036 – – 3 353 2 571 1 143 – – 3 714 USD 705 4 8911 – – 5 596 1 784 3 412 – – 5 196 GBP 53 – – – 53 68 – – – 68 JPY 254 12 366 – – 12 620 911 14 840 – – 15 751 SEK 51 – – – 51 48 – – – 48 AUD 2 – – – 2 – – – – – CHF 2 – – – 2 14 – – – 14 CAD 4 – – – 4 3 – – – 3 NOK 3 – – – 3 1 – – – 1 ZAR – – 468 6 868 7 336 – – 482 6 868 7 350
1. Includes forward starting cross-currency swaps of USD300 million.

Annual Financial Statements | 31 March 2016 71
The hedging practices and accounting treatment are disclosed in note 2.10.3 in the accounting policies. The derivative instrument used to hedge the various financial risks that arise are set out as follows:
Derivative instrument
Financial risk hedged
Exposure
Foreign exchange contracts
Currency Electricity generation activity purchases and loans denominated in foreign currencies
Cross-currency swaps
Currency and interest rate
Foreign fixed rate bonds and other foreign fixed or floating borrowings
Commodity forwards
Market Electricity sales in terms of agreements where the sales price is influenced by the market price for aluminium
Credit default swaps
Credit Credit event or event of default by Eskom on bonds issued
Cash flow hedges Contractual cash flows are a function of forward exchange rates and forward interest rates and are a point in time calculation that are impacted by market conditions at that time. This may result in future contractual cash outflows or inflows even though the fair value of the derivative may be reflected as an asset or liability.
The periods in which the cash flows of derivatives designated as cash flow hedges are expected to occur are:
Group and company
Carrying amount
Undiscounted cash flows
0-3 months
4-12 months
1-5 years
>5 years
Rm Rm Rm Rm Rm Rm
2016Forward exchange contracts
Assets 1 151 1 237 507 730 – – Liabilities (106) (143) (80) (63) – –
Cross-currency swapsAssets 27 901 56 385 (52) 22 16 905 39 510 Liabilities (1 839) (2 304) (146) (2 316) (1 296) 1 454
27 107 55 175 229 (1 627) 15 609 40 964
2015Forward exchange contracts
Assets 84 91 20 71 – – Liabilities (1 530) (1 498) (405) (1 093) – –
Cross-currency swapsAssets 13 697 27 929 2 (193) (3 174) 31 294 Liabilities (2 621) (1 587) (143) (1 604) (289) 449
9 630 24 935 (526) (2 819) (3 463) 31 743
The periods in which the cash flows associated with derivatives are expected to impact profit and loss are:
2016Forward exchange contracts
Assets 1 151 7 240 507 730 179 5 824 Liabilities (106) (143) (80) (63) – –
Cross-currency swapsAssets 27 901 56 385 (52) 22 16 905 39 510 Liabilities (1 839) (2 304) (146) (2 316) (1 296) 1 454
27 107 61 178 229 (1 627) 15 788 46 788
2015Forward exchange contracts
Assets 84 91 20 71 – – Liabilities (1 530) (5 206) (405) (1 093) (118) (3 590)
Cross-currency swapsAssets 13 697 27 929 2 (193) (3 174) 31 294 Liabilities (2 621) (1 587) (143) (1 604) (289) 449
9 630 21 227 (526) (2 819) (3 581) 28 153

Notes to the financial statements (continued)for the year ended 31 March 2016
Eskom Holdings SOC Ltd72
16. Derivatives held for risk management (continued) Ineffective cash flow hedges
During the year a loss of R19 million (2015: a gain of R57 million) was recognised in profit or loss as ineffectiveness arising from cash flow hedges (refer to note 39). There were no transactions for which cash flow hedge accounting had to be ceased in the current or comparative financial years as a result of highly probable cash flows no longer being expected to occur.
Day-one gain/loss The group recognises a day-one gain/loss on initial recognition of cross-currency and credit default swaps held as hedging instruments where applicable.
Group and company
Cross-currency
swaps
Credit default swaps
Total
Rm Rm Rm
Gain/(loss) at 31 March 2014 861 (79) 782 Day-one (loss)/gain recognised (17) 98 81 Amortised to profit or loss (112) 5 (107)
Gain at 31 March 2015 732 24 756 Day-one loss recognised (306) – (306)Amortised to profit or loss (467) – (467)
(Loss)/gain at 31 March 2016 (41) 24 (17)
17. Finance lease receivablesGroup and company
2016 2015
Grossreceivables
Unearned finance income
Present value of
minimum lease
payments
Gross receivables
Unearned finance income
Present value of
minimum lease
paymentsRm Rm Rm Rm Rm Rm
Non-current 832 (355) 477 993 (493) 500
Between one and five years 316 (198) 118 339 (230) 109 After five years 516 (157) 359 654 (263) 391
CurrentWithin one year 80 (58) 22 85 (65) 20
912 (413) 499 1 078 (558) 520
The average implicit interest rate for the group and company was 13% (2015: 13%).

Annual Financial Statements | 31 March 2016 73
18. Payments made in advance
2016 2015
Securing debt raised
Environmental rehabilitation
trust fund
Other Total Total
Rm Rm Rm Rm Rm
GroupBalance at beginning of the year 1 386 757 3 366 5 509 5 440 Payments made 555 125 3 242 3 922 2 066 Expense recognised – – (432) (432) (533)Transferred to the statement of financial position (481) – (2 048) (2 529) (1 464)
Balance at end of the year 1 460 882 4 128 6 470 5 509
Maturity analysis 1 460 882 4 128 6 470 5 509
Non-current 814 882 883 2 579 3 004 Current 646 – 3 245 3 891 2 505
CompanyBalance at beginning of the year 1 386 757 3 121 5 264 5 270 Payments made 555 125 3 204 3 884 1 988 Expense recognised – – (324) (324) (530)Transfer to the statement of financial position (481) – (2 048) (2 529) (1 464)
Balance at end of the year 1 460 882 3 953 6 295 5 264
Maturity analysis 1 460 882 3 953 6 295 5 264
Non-current 814 882 867 2 563 3 003 Current 646 – 3 086 3 732 2 261
19. Trade and other receivables
2016 2015
Gross value
Allowance for
impairment
Carrying value
Gross value
Allowance for
impairment
Carrying value
Rm Rm Rm Rm Rm Rm
GroupFinancial instrumentsTrade receivablesInternational 1 533 – 1 533 841 (15) 826 Local large power users 16 748 (3 577) 13 171 15 511 (3 361) 12 150
Municipalities 9 861 (3 214) 6 647 9 367 (3 320) 6 047 Other 6 887 (363) 6 524 6 144 (41) 6 103
Local small power users 6 677 (4 186) 2 491 6 305 (4 054) 2 251
Soweto 4 141 (3 549) 592 4 068 (3 545) 523 Other 2 536 (637) 1 899 2 237 (509) 1 728
24 958 (7 763) 17 195 22 657 (7 430) 15 227
Other receivables 4 715 (71) 4 644 4 434 (63) 4 371
Reinsurance 3 414 – 3 414 2 755 – 2 755 Sundry 1 301 (71) 1 230 1 679 (63) 1 616
29 673 (7 834) 21 839 27 091 (7 493) 19 598 Non-financial instrumentsVAT 25 – 25 45 – 45
29 698 (7 834) 21 864 27 136 (7 493) 19 643
Maturity analysis 21 864 19 643
Non-current 54 2 787 Current 21 810 16 856
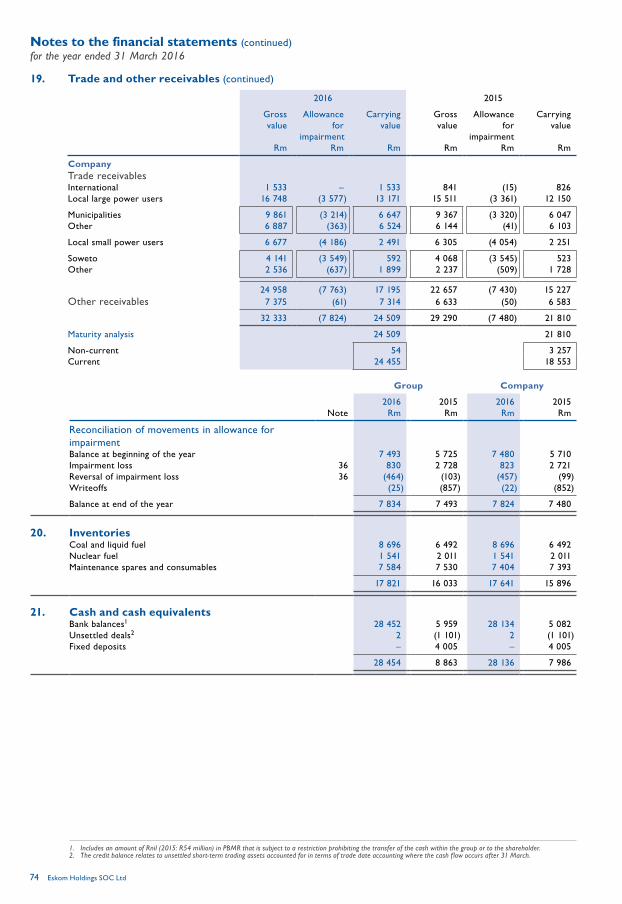
Notes to the financial statements (continued)for the year ended 31 March 2016
Eskom Holdings SOC Ltd74
19. Trade and other receivables (continued)
2016 2015
Gross value
Allowance for
impairment
Carrying value
Gross value
Allowance for
impairment
Carrying value
Rm Rm Rm Rm Rm Rm
CompanyTrade receivablesInternational 1 533 – 1 533 841 (15) 826 Local large power users 16 748 (3 577) 13 171 15 511 (3 361) 12 150
Municipalities 9 861 (3 214) 6 647 9 367 (3 320) 6 047 Other 6 887 (363) 6 524 6 144 (41) 6 103
Local small power users 6 677 (4 186) 2 491 6 305 (4 054) 2 251
Soweto 4 141 (3 549) 592 4 068 (3 545) 523 Other 2 536 (637) 1 899 2 237 (509) 1 728
24 958 (7 763) 17 195 22 657 (7 430) 15 227 Other receivables 7 375 (61) 7 314 6 633 (50) 6 583
32 333 (7 824) 24 509 29 290 (7 480) 21 810
Maturity analysis 24 509 21 810
Non-current 54 3 257 Current 24 455 18 553
Group Company
2016 2015 2016 2015Note Rm Rm Rm Rm
Reconciliation of movements in allowance for impairmentBalance at beginning of the year 7 493 5 725 7 480 5 710 Impairment loss 36 830 2 728 823 2 721 Reversal of impairment loss 36 (464) (103) (457) (99)Writeoffs (25) (857) (22) (852)
Balance at end of the year 7 834 7 493 7 824 7 480
20. InventoriesCoal and liquid fuel 8 696 6 492 8 696 6 492 Nuclear fuel 1 541 2 011 1 541 2 011 Maintenance spares and consumables 7 584 7 530 7 404 7 393
17 821 16 033 17 641 15 896
21. Cash and cash equivalentsBank balances1 28 452 5 959 28 134 5 082 Unsettled deals2 2 (1 101) 2 (1 101)Fixed deposits – 4 005 – 4 005
28 454 8 863 28 136 7 986
1. Includes an amount of Rnil (2015: R54 million) in PBMR that is subject to a restriction prohibiting the transfer of the cash within the group or to the shareholder. 2. The credit balance relates to unsettled short-term trading assets accounted for in terms of trade date accounting where the cash f low occurs after 31 March.

Annual Financial Statements | 31 March 2016 75
22. Non-current assets and liabilities held-for-sale Eskom residential properties
Certain residential properties that are regarded as surplus to Eskom's operational needs have been presented as held-for-sale in line with the decision by the shareholder to dispose of non-core assets. The properties will be disposed of in the open market and it is expected that the disposal of these properties will be concluded by 31 March 2017.
Eskom Finance Company SOC LtdThe assets and liabilities of EFC have been presented as held-for-sale in line with the decision by the shareholder to dispose of non-core assets and is expected to be completed by 31 March 2017.
2016Group Company
Land,buildings
and facilities
Eskom Finance
Company
Reallocation and
inter-company
transactions
Total Land, buildings
and facilities
Rm Rm Rm Rm Rm
Statements of financial position
AssetsNon-current 148 8 493 ( 14) 8 627 148
Property, plant and equipment 148 1 – 149 148 Loans receivable – 8 476 – 8 476 – Trade and other receivables – 2 – 2 – Deferred tax – 14 ( 14) – –
Current – 376 ( 61) 315 –
Loans receivable – 213 – 213 – Taxation – 15 – 15 – Trade and other receivables – 1 – 1 – Cash and cash equivalents – 147 ( 61) 86 –
Total assets 148 8 869 ( 75) 8 942 148
LiabilitiesNon-current – 1 231 121 1 352 –
Debt securities and borrowings – 1 231 – 1 231 – Deferred tax – – 121 121 –
Current – 6 826 (6 370) 456 –
Debt securities and borrowings – 6 796 (6 352) 444 – Trade and other payables – 30 ( 18) 12 –
Total liabilities – 8 057 (6 249) 1 808 –
23. Service concession arrangementsThe group operates a service concession for the generation and transmission of electricity through its operations in Uganda. The group operated a service concession arrangement in Mali (EEM) which was disposed of during the 2015 financial year (liquidated on 24 February 2015).
Eskom Uganda Ltd (Eskom Uganda) entered into an operation and maintenance agreement with Uganda Electricity Generation Company Ltd (UEGCL) in 2002, which is linked to a power purchase agreement concluded with Uganda Electricity Transmission Company Ltd (UETCL). In terms of the agreements, Eskom Uganda operates and maintains two hydro-electric power stations in Uganda, from which it supplies electricity to UETCL. The dams, powerhouses, related switchyard facilities, high voltage substations, land and movable property together constitute the ‘energy assets’ in terms of the agreement. The concession period is 20 years (ending in December 2023).
Eskom Uganda is entitled to receive revenue from UETCL, based on electricity supplied at tariffs regulated by the Electricity Regulatory Authority of Uganda. It also receives a fee to cover it for investment in additional energy assets where required. This has been recognised as an intangible asset.
The plant remains the property of UEGCL and will revert to UEGCL at the end of the concession period. At that point Eskom Uganda will have no further obligation in respect of the plant.
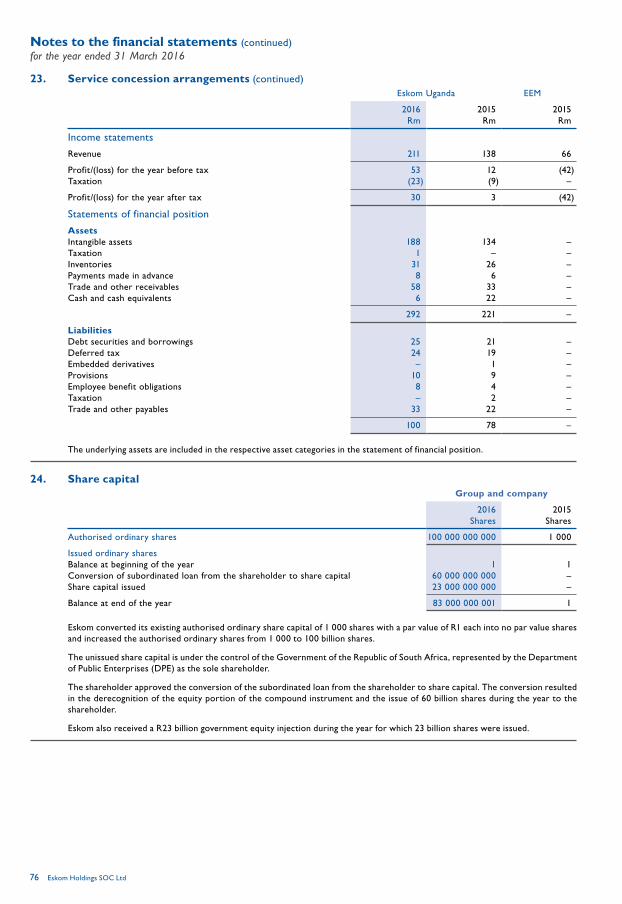
Notes to the financial statements (continued)for the year ended 31 March 2016
Eskom Holdings SOC Ltd76
23. Service concession arrangements (continued)Eskom Uganda EEM
2016 2015 2015Rm Rm Rm
Income statements
Revenue 211 138 66
Profit/(loss) for the year before tax 53 12 (42)Taxation (23) (9) –
Profit/(loss) for the year after tax 30 3 (42)
Statements of financial position
AssetsIntangible assets 188 134 – Taxation 1 – – Inventories 31 26 – Payments made in advance 8 6 – Trade and other receivables 58 33 – Cash and cash equivalents 6 22 –
292 221 –
LiabilitiesDebt securities and borrowings 25 21 – Deferred tax 24 19 – Embedded derivatives – 1 – Provisions 10 9 – Employee benefit obligations 8 4 – Taxation – 2 – Trade and other payables 33 22 –
100 78 –
The underlying assets are included in the respective asset categories in the statement of financial position.
24. Share capitalGroup and company
2016 2015Shares Shares
Authorised ordinary shares 100 000 000 000 1 000
Issued ordinary sharesBalance at beginning of the year 1 1 Conversion of subordinated loan from the shareholder to share capital 60 000 000 000 – Share capital issued 23 000 000 000 –
Balance at end of the year 83 000 000 001 1
Eskom converted its existing authorised ordinary share capital of 1 000 shares with a par value of R1 each into no par value shares and increased the authorised ordinary shares from 1 000 to 100 billion shares.
The unissued share capital is under the control of the Government of the Republic of South Africa, represented by the Department of Public Enterprises (DPE) as the sole shareholder.
The shareholder approved the conversion of the subordinated loan from the shareholder to share capital. The conversion resulted in the derecognition of the equity portion of the compound instrument and the issue of 60 billion shares during the year to the shareholder.
Eskom also received a R23 billion government equity injection during the year for which 23 billion shares were issued.

Annual Financial Statements | 31 March 2016 77
25. Debt securities and borrowings
Group Company
2016 2015 2016 2015Rm Rm Rm Rm
Eskom bonds 126 466 112 103 126 466 112 103 Promissory notes 46 40 46 40 Commercial paper 4 822 7 531 6 431 7 027 Eurorand zero coupon bonds 4 462 3 942 4 462 3 942 Foreign bonds 58 815 48 670 58 815 48 670 Development financing institutions 82 976 62 447 82 976 62 447 Export credit facilities 37 597 28 488 37 597 28 488 Subordinated loan from shareholder – 26 621 – 26 621 Other loans 7 474 7 592 9 164 8 792
322 658 297 434 325 957 298 130
Maturity analysis 322 658 297 434 325 957 298 130
Non-current 306 970 277 458 306 901 275 954 Current 15 688 19 976 19 056 22 176
Group Company
Currency Security number
Interest rate Nominal Maturity date
Carrying value Carrying value
2016 2015 2016 2015 2016 2015 2016 2015% % m m Rm Rm Rm Rm
Eskom bonds 126 466 112 103 126 466 112 103
ZAR EL151 – 2.96 – 2 047 Jun 15 – 2 741 – 2 741 ZAR ES151 – 7.77 – 2 224 Aug 15 – 2 239 – 2 239 ZAR ES181 9.06 9.04 9 577 9 689 Apr 18 10 009 10 146 10 009 10 146 ZAR ECN20 9.98 – 2 500 – Mar 20 2 486 – 2 486 – ZAR E1702 10.10 10.09 11 203 11 285 Aug 21 12 709 13 029 12 709 13 029 ZAR ECN22 10.16 – 2 500 – Mar 22 2 467 – 2 467 – ZAR ES231 9.36 9.33 12 213 11 537 Jan 23 12 829 12 172 12 829 12 172 ZAR ECN24 10.33 – 2 500 – Mar 24 2 461 – 2 461 – ZAR ES261 9.03 8.99 19 826 18 782 Apr 26 19 068 18 036 19 068 18 036 ZAR EL281 2.55 2.21 3 941 3 900 May 28 5 055 4 768 5 055 4 768 ZAR EL291 1.90 1.80 3 700 3 700 Nov 29 4 500 4 281 4 500 4 281 ZAR EL301 2.30 2.29 3 700 3 700 Jul 30 4 224 4 015 4 224 4 015 ZAR EL311 2.10 2.16 3 740 3 700 Jun 31 4 068 3 824 4 068 3 824 ZAR ECN32 2.95 – 2 500 – Mar 32 2 541 – 2 541 – ZAR ES331 8.96 9.30 29 563 27 211 Sep 33 25 923 23 953 25 923 23 953 ZAR EL361 2.25 2.23 3 741 2 565 Jan 36 3 970 2 585 3 970 2 585 ZAR EL371 2.25 2.26 3 250 2 431 Jan 37 3 425 2 438 3 425 2 438 ZAR ES421 9.87 9.96 11 797 8 739 Apr 42 10 731 7 876 10 731 7 876
Promissory notes2 46 40 46 40
ZAR PN07 15.34 15.34 20 20 Aug 20 11 9 11 9 ZAR PN08 15.08 15.08 20 20 Aug 21 9 8 9 8 ZAR PN09 14.80 14.80 35 35 Aug 22 14 12 14 12 ZAR PN10 14.61 14.61 35 35 Aug 23 12 11 12 11
Commercial paper 4 822 7 531 6 431 7 027
ZAR n/a – 7.10 – 316 May 15 – 319 – – ZAR n/a3 7.35 6.43 6 629 7 190 Mar 17 4 4 822 5 857 6 431 7 027 ZAR n/a – 7.29 – 429 May 16 – 432 – – ZAR n/a – 7.16 – 382 May 17 – 385 – – ZAR n/a – 7.27 – 400 May 18 – 400 – – ZAR n/a – 10.54 – 136 May 20 – 138 – –
Eurorand zero coupon bonds2 4 462 3 942 4 462 3 942
ZAR n/a 13.93 13.93 2 000 2 000 Dec 18 1 397 1 226 1 397 1 226 ZAR n/a 13.33 13.33 8 000 8 000 Aug 27 1 924 1 697 1 924 1 697 ZAR n/a 11.89 11.89 7 500 7 500 Dec 32 1 141 1 019 1 141 1 019
Balance carried forward to the next page 135 796 123 616 137 405 123 112
1. Government guaranteed. 2. Holders have a right to f irst charge against revenue and assets of Eskom in terms of section 7 of Eskom Conversion Act. 3. Includes, inter alia, instruments issued to subsidiaries. 4. Latest in a range of maturity dates is indicated for these instruments.

Notes to the financial statements (continued)for the year ended 31 March 2016
Eskom Holdings SOC Ltd78
25. Debt securities and borrowings (continued)Group Company
Currency Security number
Interest rate Nominal Maturity date
Carrying value Carrying value
2016 2015 2016 2015 2016 2015 2016 2015% % m m Rm Rm Rm Rm
Balance carried forward from previous page 135 796 123 616 137 405 123 112Foreign bonds 58 815 48 670 58 815 48 670
USD n/a 5.75 5.75 1 750 1 750 Jan 21 25 862 21 427 25 862 21 427 USD n/a 6.75 6.75 1 000 1 000 Aug 23 14 727 12 168 14 727 12 168 USD n/a 7.13 7.13 1 250 1 250 Feb 25 18 226 15 075 18 226 15 075
Development financing institutions1 82 976 62 447 82 976 62 447
ZAR n/a2 8.33 7.45 1 667 1 800 Aug 28 1 682 1 815 1 682 1 815 USD n/a2 2.01 – 242 – Aug 28 3 576 – 3 576 – EUR n/a2 2.11 2.11 3 3 Dec 28 51 39 51 39 EUR n/a2 0.20 0.38 539 579 Aug 29 9 042 7 572 9 042 7 572 ZAR n/a2 7.15 6.24 9 364 9 970 Aug 29 9 475 10 069 9 475 10 069 ZAR n/a2 10.10 – 3 935 – Sep 29 3 937 – 3 937 – ZAR n/a 10.37 9.90 15 000 12 000 Jan 31 15 244 12 221 15 244 12 221 EUR n/a2 1.50 – 470 – Mar 31 7 737 – 7 737 – ZAR n/a2 8.77 8.73 950 855 Jun 31 969 872 969 872 USD n/a2 1.02 1.49 9 271 Aug 31 134 3 195 134 3 195 ZAR n/a 7.43 6.51 1 474 1 568 Mar 32 1 479 1 573 1 479 1 573 USD n/a2 0.90 0.63 119 68 May 38 1 758 835 1 758 835 ZAR n/a2 9.23 9.11 25 973 22 688 May 38 26 944 23 360 26 944 23 360 USD n/a2 0.25 0.25 29 29 May 51 424 352 424 352 USD n/a2 0.25 0.25 36 35 Aug 51 524 544 524 544
Export credit facilities1 37 597 28 488 37 597 28 488
JPY n/a 1.59 1.60 12 366 14 840 May 22 1 612 1 493 1 612 1 493 EUR n/a 0.90 1.02 97 112 Sep 23 1 568 1 446 1 568 1 446 EUR n/a 0.82 1.04 14 15 Jul 24 227 196 227 196 EUR n/a 5.08 5.07 763 845 Jan 27 12 374 10 529 12 374 10 529 EUR n/a 2.56 2.61 716 753 Jul 27 11 402 9 220 11 402 9 220 ZAR n/a 9.15 8.08 1 978 1 966 Jul 27 1 847 1 778 1 847 1 778 USD n/a 2.32 2.32 590 317 Mar 31 8 567 3 826 8 567 3 826
Subordinated loan from shareholder – 26 621 – 26 621
ZAR n/a – 7.52 – 5 000 Dec 38 – 2 542 – 2 542 ZAR n/a – 8.95 – 5 000 Mar 39 – 2 294 – 2 294 ZAR n/a – 9.43 – 7 500 Jun 39 – 3 215 – 3 215 ZAR n/a – 9.15 – 7 500 Sep 39 – 3 319 – 3 319 ZAR n/a – 9.57 – 7 500 Dec 39 – 3 182 – 3 182 ZAR n/a – 9.52 – 7 500 Mar 40 – 3 230 – 3 230 ZAR n/a – 9.54 – 5 000 Jun 40 – 2 176 – 2 176 ZAR n/a – 8.58 – 5 000 Sep 40 – 2 344 – 2 344 ZAR n/a – 9.03 – 5 000 Dec 40 – 2 233 – 2 233 ZAR n/a – 9.81 – 5 000 Mar 41 – 2 086 – 2 086
Other loans 7 474 7 592 9 164 8 792
ZAR n/a – 8.11 – 37 Jul 16 – 37 – – ZAR n/a 10.18 10.18 2 600 2 600 Jul 20 2 648 2 647 2 648 2 647 ZAR n/a 8.69 8.18 2 150 2 150 Dec 21 2 155 2 154 2 155 2 154 ZAR n/a 9.07 8.85 1 000 1 000 Aug 23 1 013 1 013 1 013 1 013 ZAR n/a 12.80 12.80 1 500 1 500 Oct 24 1 589 1 588 1 589 1 588
ZAR n/a3 7.09 5.61 1 758 1 390 On
demand – – 1 759 1 390
ZAR n/a – – 69 153 On
demand 69 153 – –
322 658 297 434 325 957 298 130
1. Latest in a range of maturity dates is indicated for these instruments.2. Government guaranteed. 3. Includes, inter alia, instruments issued to subsidiaries.

Annual Financial Statements | 31 March 2016 79
26. Embedded derivatives
2016 2015
Commodityand/orforeign
currency
Foreigncurrency or
interest rate
United StatesPPI andforeign
currency
Total Total
Rm Rm Rm Rm Rm
GroupLiability at beginning of the year 7 589 1 432 8 022 9 332Net fair value gain (689) (1) (307) (997) (1 310)
Liability at end of the year 6 900 – 125 7 025 8 022
Maturity analysis 6 900 – 125 7 025 8 022
Non-current 5 287 – 123 5 410 6 647Current 1 613 – 2 1 615 1 375
CompanyLiability at beginning of the year 7 589 – 432 8 021 9 331Net fair value gain (689) – (307) (996) (1 310)
Liability at end of the year 6 900 – 125 7 025 8 021
Maturity analysis 6 900 – 125 7 025 8 021
Non-current 5 287 – 123 5 410 6 646Current 1 613 – 2 1 615 1 375
27. Payments received in advance and deferred income
2016 2015
Upfront capital
contributions
Government grant
Other Total Total
Note Rm Rm Rm Rm Rm
27.1 Payments received in advanceGroupBalance at beginning of the year 4 355 302 164 4 821 5 716 Payments received 816 3 332 75 4 223 4 460 Transfers to the statement of financial position (88) (2 372) – (2 460) (4 180)
Deferred income 27.2 (88) (2 372) – (2 460) (2 420)Trade and other payables – – – – (1 760)
Income recognised (473) (5) (104) (582) (1 175)
Balance at end of the year 4 610 1 257 135 6 002 4 821
Maturity analysis 4 610 1 257 135 6 002 4 821
Non-current 2 618 – 8 2 626 2 664 Current 1 992 1 257 127 3 376 2 157
CompanyBalance at beginning of the year 4 355 302 152 4 809 5 703 Payments received 816 3 332 74 4 222 4 450 Transfers to the statement of financial position (88) (2 372) – (2 460) (4 180)
Deferred income 27.2 (88) (2 372) – (2 460) (2 420)Trade and other payables – – – – (1 760)
Income recognised (473) (5) (96) (574) (1 164)
Balance at end of the year 4 610 1 257 130 5 997 4 809
Maturity analysis 4 610 1 257 130 5 997 4 809
Non-current 2 618 – 8 2 626 2 664 Current 1 992 1 257 122 3 371 2 145

Notes to the financial statements (continued)for the year ended 31 March 2016
Eskom Holdings SOC Ltd80
27. Payments received in advance and deferred income (continued)
2016 2015
Upfront capital
contributions
Government grant
Other Total Total
Note Rm Rm Rm Rm Rm
27.2 Deferred incomeGroup and companyBalance at beginning of the year 2 772 12 146 – 14 918 13 292 Transfers from payments received in advance 27.1 88 2 372 – 2 460 2 420 Income recognised (152) (753) – (905) (794)
Balance at end of the year 2 708 13 765 – 16 473 14 918
Maturity analysis 2 708 13 765 – 16 473 14 918
Non-current 2 549 12 967 – 15 516 14 055 Current 159 798 – 957 863
28. Employee benefit obligations
2016 2015
Post-employment
medical benefits
Leave Annual and performance
bonus
Other Total Total
Notes Rm Rm Rm Rm Rm Rm
GroupBalance at beginning of the year 12 325 1 943 933 685 15 886 14 483Raised/(reversed) to income statement 583 675 1 564 – 2 822 2 625
Raised 583 675 2 075 – 3 333 2 804 Reversed – – (511) – (511) (179)
(Reversed)/raised to other comprehensive income (840) – – – (840) 909 Finance cost 41 1 120 – – 38 1 158 1 060 Cash paid (372) (650) (407) (2) (1 431) (3 191)
Balance at end of the year 12 816 1 968 2 090 721 17 595 15 886
Maturity analysis 12 816 1 968 2 090 721 17 595 15 886
Non-current 12 405 – – – 12 405 11 960 Current 411 1 968 2 090 721 5 190 3 926
CompanyBalance at beginning of the year 12 022 1 813 814 677 15 326 13 930 Raised/(reversed) to income statement 573 635 1 616 – 2 824 2 435
Raised 573 635 2 037 – 3 245 2 614 Reversed – – (421) – (421) (179)
Raised/(reversed) to other comprehensive income (830) – – – (830) 884 Finance cost 41 1 092 – – 38 1 130 1 034 Cash paid (362) (619) (378) – (1 359) (2 957)
Balance at end of the year 12 495 1 829 2 052 715 17 091 15 326
Maturity analysis 12 495 1 829 2 052 715 17 091 15 326
Non-current 12 094 – – – 12 094 11 665 Current 401 1 829 2 052 715 4 997 3 661
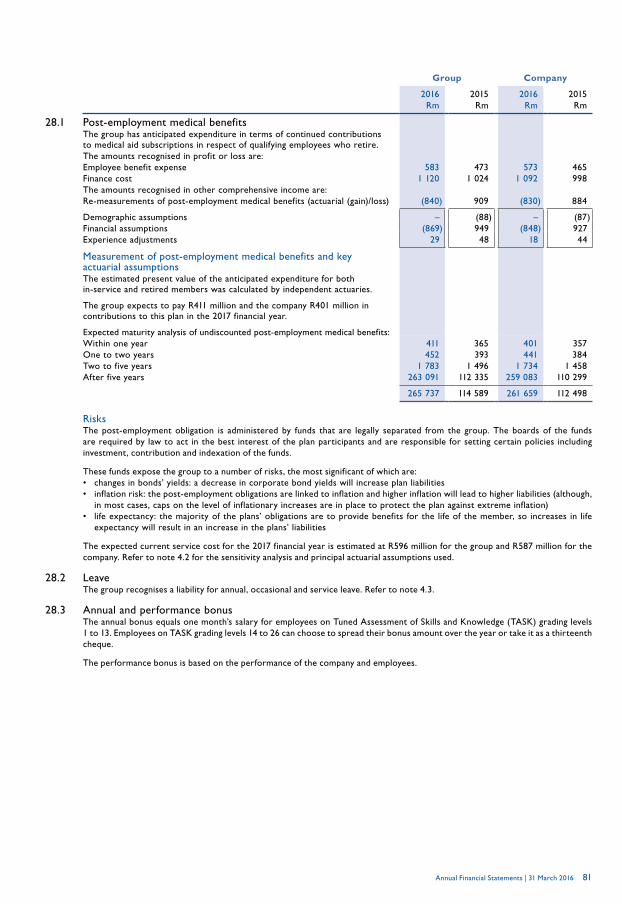
Annual Financial Statements | 31 March 2016 81
Group Company
2016 2015 2016 2015Rm Rm Rm Rm
28.1 Post-employment medical benefits
The group has anticipated expenditure in terms of continued contributions to medical aid subscriptions in respect of qualifying employees who retire.
The amounts recognised in profit or loss are:Employee benefit expense 583 473 573 465 Finance cost 1 120 1 024 1 092 998 The amounts recognised in other comprehensive income are:Re-measurements of post-employment medical benefits (actuarial (gain)/loss) (840) 909 (830) 884
Demographic assumptions – (88) – (87)Financial assumptions (869) 949 (848) 927 Experience adjustments 29 48 18 44
Measurement of post-employment medical benefits and key actuarial assumptionsThe estimated present value of the anticipated expenditure for both in-service and retired members was calculated by independent actuaries.
The group expects to pay R411 million and the company R401 million in contributions to this plan in the 2017 financial year.
Expected maturity analysis of undiscounted post-employment medical benefits:Within one year 411 365 401 357 One to two years 452 393 441 384 Two to five years 1 783 1 496 1 734 1 458 After five years 263 091 112 335 259 083 110 299
265 737 114 589 261 659 112 498
Risks The post-employment obligation is administered by funds that are legally separated from the group. The boards of the funds are required by law to act in the best interest of the plan participants and are responsible for setting certain policies including investment, contribution and indexation of the funds.
These funds expose the group to a number of risks, the most significant of which are: • changes in bonds’ yields: a decrease in corporate bond yields will increase plan liabilities • inflation risk: the post-employment obligations are linked to inflation and higher inflation will lead to higher liabilities (although,
in most cases, caps on the level of inflationary increases are in place to protect the plan against extreme inflation) • life expectancy: the majority of the plans’ obligations are to provide benefits for the life of the member, so increases in life
expectancy will result in an increase in the plans’ liabilities
The expected current service cost for the 2017 financial year is estimated at R596 million for the group and R587 million for the company. Refer to note 4.2 for the sensitivity analysis and principal actuarial assumptions used.
28.2 LeaveThe group recognises a liability for annual, occasional and service leave. Refer to note 4.3.
28.3 Annual and performance bonusThe annual bonus equals one month’s salary for employees on Tuned Assessment of Skills and Knowledge (TASK) grading levels 1 to 13. Employees on TASK grading levels 14 to 26 can choose to spread their bonus amount over the year or take it as a thirteenth cheque.
The performance bonus is based on the performance of the company and employees.

Notes to the financial statements (continued)for the year ended 31 March 2016
Eskom Holdings SOC Ltd82
28. Employee benefit obligations (continued)Group Company
2016 2015 2016 2015Rm Rm Rm Rm
28.4 Pension benefits
The net benefit asset at the reporting date is not accounted for in the financial statements. The rules of the Eskom Pension and Provident Fund (EPPF) state that any deficit on the valuation of the fund will be funded by increases in future contributions or reductions in benefits. If there is a substantial surplus on the valuation of the fund, future contributions may be decreased or benefits may be improved as determined by the trustees of the fund.
The EPPF is registered in terms of the Pension Funds Act. All employees are members of the fund. Contributions comprise 20.8% of pensionable emoluments of which members pay 7.3%. The assets of the fund are held separately from those of the group in respect of funds under the control of the trustees.
The fund was valued actuarially on the IAS 19 Employee benefits basis on 31 March 2016 (previous valuation at 31 March 2015). The actuarial present value of retirement benefits at 31 March 2016 was R102 678 million (2015: R99 820 million), while the fair value of the fund’s assets was R128 012 million (2015: R118 174 million).
Valuation assumptions The principal actuarial assumptions used were:
Long-term investment return before tax (%) 11.30 8.80 11.30 8.80 Future general salary increases (%) 9.60 7.50 9.60 7.50 Future pension increases (inflation) (%) 8.10 6.00 8.10 6.00
Assumptions regarding future mortality have been based on published mortality tables and statistics derived from experience. For details regarding current longevities underlying the values of the pension benefit obligation at the reporting date refer to note 4.2.
29. Provisions Power station-related environmental restoration – nuclear plant
Provision made for the estimated decommissioning cost of nuclear plant and for the management of nuclear fuel assemblies and radioactive waste. Refer to note 4.4.
Power station-related environmental restoration – other generating plant Provision made for the estimated decommissioning cost of all other generating plant. Refer to note 4.4.
Mine-related closure, pollution control and rehabilitation Provision made for the estimated cost of closure, pollution control, rehabilitation and mine employee benefits at the end of the life of the mines, where a constructive and contractual obligation exists to pay coal suppliers. Refer to note 4.4.
Coal-related obligations The provision relates to new build related coal obligations. Refer to note 4.5.
Other Includes provision made for contractual obligations to maintain and restore the infrastructure under service concession arrangements, onerous contracts, compensation events and guarantees.

Annual Financial Statements | 31 March 2016 83
2016 2015
Power station-related environmental
restoration
Mine-related
closure,pollution
control and rehabilitation
Coal-related
obligations
Other Total Total
Nuclear plant
Other generating
plantNote Rm Rm Rm Rm Rm Rm Rm
GroupBalance at beginning of the year 10 982 7 705 5 465 7 954 8 944 41 050 30 758 Charged to income statement 600 (23) 165 (1 727) 92 (893) 7 450 Capitalised to property, plant and equipment 8 (158) (134) (32) – 3 233 2 909 3 033
Raised – 176 – – 5 874 6 050 5 088 Reversed – (108) (31) – (2 641) (2 780) (2 535)Change in discount rate (158) (202) (1) – – (361) 480
Capitalised to future fuel 10 – – 2 442 – – 2 442 524
Raised – – 2 606 – – 2 606 410Reversed – – (113) – – (113) (7)Change in discount rate – – (51) – – (51) 121
Capitalised to inventory 96 – 102 – – 198 86
Raised 96 – 123 – – 219 125 Reversed – – (21) – – (21) (39)
Finance cost 41 1 157 791 468 167 5 2 588 2 877 Cash paid – – (30) (840) (3 168) (4 038) (3 678)
Balance at end of the year 12 677 8 339 8 580 5 554 9 106 44 256 41 050
Maturity analysis 12 677 8 339 8 580 5 554 9 106 44 256 41 050
Non-current 12 677 8 339 7 675 3 924 226 32 841 31 078 Current – – 905 1 630 8 880 11 415 9 972
CompanyBalance at beginning of the year 10 982 7 705 5 465 7 954 8 740 40 846 30 195 Raised/(reversed) to income statement 600 (23) 165 (1 727) (46) (1 031) 7 694 Capitalised to property, plant and equipment (158) (134) (32) – 3 233 2 909 3 033
Raised – 176 – – 5 874 6 050 5 088 Reversed – (108) (31) – (2 641) (2 780) (2 535)Change in discount rate (158) (202) (1) – – (361) 480
Capitalised to future fuel – – 2 442 – – 2 442 524
Raised – – 2 606 – – 2 606 410Reversed – – (113) – – (113) (7)Change in discount rate – – (51) – – (51) 121
Capitalised to inventory 96 – 102 – – 198 86
Raised 96 – 123 – – 219 125 Reversed – – (21) – – (21) (39)
Finance cost 41 1 157 791 468 167 – 2 583 2 875 Cash paid – – (30) (840) (3 053) (3 923) (3 561)
Balance at end of the year 12 677 8 339 8 580 5 554 8 874 44 024 40 846
Maturity analysis 12 677 8 339 8 580 5 554 8 874 44 024 40 846
Non-current 12 677 8 339 7 675 3 924 211 32 826 31 039 Current – – 905 1 630 8 663 11 198 9 807

Notes to the financial statements (continued)for the year ended 31 March 2016
Eskom Holdings SOC Ltd84
30. Finance lease payables
2016 2015
Gross payables
Future finance charges
Present value
Gross payables
Future finance charges
Present value
Rm Rm Rm Rm Rm Rm
GroupNon-current 8 898 (5 060) 3 838 1 168 (694) 474
Between one and five years 3 298 (2 619) 679 390 (307) 83 After five years 5 600 (2 441) 3 159 778 (387) 391
CurrentWithin one year 682 (592) 90 99 (85) 14
9 580 (5 652) 3 928 1 267 (779) 488
CompanyNon-current 8 898 (5 060) 3 838 1 355 (718) 637
Between one and five years 3 298 (2 619) 679 574 (331) 243 After five years 5 600 (2 441) 3 159 781 (387) 394
CurrentWithin one year 682 (592) 90 171 (101) 70
9 580 (5 652) 3 928 1 526 (819) 707
The average implicit interest rate for the group and company was 16% (2015: 18%).
Group Company
2016 2015 2016 2015Rm Rm Rm Rm
31. Trade and other payablesFinancial instruments 32 922 28 419 34 435 29 788
Trade and other payables 22 586 21 335 23 995 22 146 Accruals 7 170 4 384 7 275 4 942 Deposits 3 166 2 700 3 165 2 700
Non-financial instrumentsVAT 272 580 179 494
33 194 28 999 34 614 30 282
Maturity analysis 33 194 28 999 34 614 30 282
Non-current 875 1 015 875 1 015 Current 32 319 27 984 33 739 29 267
32. RevenueElectricity revenue 161 688 146 268 161 688 146 268 Other revenue 1 707 1 423 1 707 1 423
163 395 147 691 163 395 147 691
Electricity revenue of R1 647 million (2015: R597 million) was not recognised as it was assessed that there is a high probability that the related economic benefits will not materialise. In addition R175 million of previously not recognised revenue has now been recognised in the current year. Eskom continues to actively pursue recovery of these amounts. Refer to note 5.1.2 (a)

Annual Financial Statements | 31 March 2016 85
Group Company
2016 2015 2016 2015Note Rm Rm Rm Rm
33. Other incomeInsurance proceeds 917 2 732 1 393 5 111 Services income 355 213 – – Insurance premium income 79 116 – – Management fee income – – 117 261 Operating lease income 262 275 226 219 Dividend income 32 29 32 19 Sale of scrap 134 186 134 186 Other income 611 893 569 849
2 390 4 444 2 471 6 645
34. Primary energyOwn generation costs 57 594 61 630 57 594 61 630 Environmental levy 8 120 8 353 8 120 8 353 International electricity purchases 3 660 3 679 3 660 3 679 Independent power producers 15 106 9 453 15 106 9 453 Other 248 310 248 310
84 728 83 425 84 728 83 425
Own generating costs relates to the cost of coal, uranium, water and liquid fuels that are used in the generation of electricity. Eskom use a combination of short-, medium- and long-term agreements with suppliers for coal purchases and long-term agreements with the DWA to reimburse the department for the cost incurred in supplying water to Eskom.
35. Employee benefit expenseSalaries 20 092 18 681 18 517 17 446 Overtime 1 970 1 682 1 657 1 446 Post-employment medical benefits 583 473 573 465 Leave 675 767 635 714 Annual and performance bonus 2 140 1 383 2 133 1 256 Pension benefits 2 089 1 976 1 943 1 845
Direct costs of employment 27 549 24 962 25 458 23 172 Direct training and development 147 197 117 176 Temporary and contract staff costs 3 124 2 743 843 883 Other staff costs 1 703 1 016 1 569 962
Gross employee benefit expense 32 523 28 918 27 987 25 193 Capitalised to property, plant and equipment (3 266) (3 006) (3 266) (3 006)
29 257 25 912 24 721 22 187
36. Net impairment lossImpairment 1 644 3 905 1 623 3 882
Property, plant and equipment 8 789 1 157 789 1 156 Inventories 11 5 11 5 Loans receivable 15 14 15 – –Trade and other receivables 19 830 2 728 823 2 721
Reversal (469) (132) (459) (120)
Property, plant and equipment 8 (2) (7) (2) (7)Inventories – (21) – (14)Loans receivable 15 (3) (1) – –Trade and other receivables 19 (464) (103) (457) (99)
Bad debts recovered (5) (7) (5) (7)
1 170 3 766 1 159 3 755

Notes to the financial statements (continued)for the year ended 31 March 2016
Eskom Holdings SOC Ltd86
Group Company
2016 2015 2016 2015Note Rm Rm Rm Rm
37. Other expensesManagerial, technical and other fees 563 715 505 678 Direct research and development 38 35 38 35 Operating lease expense 1 117 1 397 412 753 Auditors’ remuneration1 94 97 80 84 Net loss on disposal of property, plant and equipment 358 111 494 103 Government grant – – – –
Income (23) (209) (23) (209)Expenses incurred 23 209 23 209
Repairs and maintenance, transport and other expenses 16 493 13 416 23 641 20 430
18 663 15 771 25 170 22 083
38. Depreciation and amortisation expenseDepreciation of property, plant and equipment 8 16 591 13 827 16 615 13 798 Amortisation of intangible assets 9 693 939 655 854 Deferred income recognised (government grant) 27 (753) (651) (753) (651)
16 531 14 115 16 517 14 001
39. Net fair value loss on financial instruments, excluding embedded derivativesFinancial trading assets 156 232 172 112 Financial trading liabilities (122) (329) (122) (329)Derivatives held for risk management 16 20 429 (1 688) 20 395 (1 688)Trade and other receivables – 15 (2) 13 Cash and cash equivalents 75 284 74 284 Trade and other payables (407) 141 (426) 172 Debt securities and borrowings (21 709) (2 929) (21 709) (2 929)Amount recycled from statement of comprehensive income 126 157 126 157
Amortisation of effective portion of terminated cash flow hedges 145 100 145 100Ineffective portion of cash flow hedges (19) 57 (19) 57
(1 452) (4 117) (1 492) (4 208)
40. Finance incomeInvestment in securities 723 739 347 513 Loans receivable 825 799 446 422 Finance lease receivables 65 68 65 68 Trade and other receivables 951 677 951 676 Cash and cash equivalents 883 713 858 681
3 447 2 996 2 667 2 360
1. There were no non-audit services rendered by the group's statutory auditors.

Annual Financial Statements | 31 March 2016 87
Group Company
2016 2015 2016 2015Note Rm Rm Rm Rm
41. Finance costDebt securities and borrowings 23 242 19 699 23 333 19 731
Eskom bonds 10 202 9 381 10 202 9 381 Promissory notes 6 5 6 5 Commercial paper 587 677 573 627 Eurorand zero coupon bonds 520 458 520 458 Foreign bonds 3 637 2 041 3 637 2 041 Development financing institutions 4 777 3 192 4 777 3 192 Export credit facilities 1 560 1 345 1 560 1 345 Subordinated loan from shareholder 1 208 2 228 1 208 2 228 Other loans 745 372 850 454
Derivatives held for risk management 3 151 2 496 3 151 2 496 Employee benefit obligations 28 1 158 1 060 1 130 1 034 Provisions 29 2 588 2 877 2 583 2 875 Finance lease payables 387 87 406 107 Trade and other payables 266 275 266 275
Gross finance cost 30 792 26 494 30 869 26 518 Capitalised to property, plant and equipment 8 (19 426) (17 389) (19 426) (17 389)
11 366 9 105 11 443 9 129
42. Income taxCurrent tax 542 129 – – Deferred tax 13 1 946 (92) 1 697 (160)
Reversal of temporary differences 6 017 2 377 5 917 2 481 Tax losses (4 071) (2 469) (4 220) (2 641)
2 488 37 1 697 (160)
2016 2015
Before tax
Tax Net of tax
Before tax
Tax Net of tax
Rm Rm Rm Rm Rm Rm
Income tax recognised in other comprehensive incomeGroupAvailable-for-sale financial assetsNet change in fair value (57) 16 (41) (63) 17 (46)Cash flow hedges 8 226 (2 303) 5 923 (665) 186 (479)
Changes in fair value 8 955 (2 507) 6 448 628 (176) 452 Net amount transferred to profit or loss (126) 35 (91) (157) 44 (113)Net amount transferred to initial carrying amount of hedged items (603) 169 (434) (1 136) 318 (818)
Foreign currency translation differences 21 – 21 24 – 24 Re-measurement of post-employment medical benefits 840 (235) 605 (909) 255 (654)
9 030 (2 522) 6 508 (1 613) 458 (1 155)
CompanyAvailable-for-sale financial assetsNet change in fair value (54) 15 (39) (64) 18 (46)Cash flow hedges 8 226 (2 303) 5 923 (665) 186 (479)
Changes in fair value 8 955 (2 507) 6 448 628 (176) 452 Net amount transferred to profit or loss (126) 35 (91) (157) 44 (113)Net amount transferred to initial carrying amount of hedged items (603) 169 (434) (1 136) 318 (818)
Re-measurement of post-employment medical benefits 830 (233) 597 (884) 247 (637)
9 002 (2 521) 6 481 (1 613) 451 (1 162)

Notes to the financial statements (continued)for the year ended 31 March 2016
Eskom Holdings SOC Ltd88
42. Income tax (continued)
2016 2015
Rm % Rm %
Reconciliation between standard and effective tax rateGroupTaxation expense at standard rate 1 989 28.00 78 28.00 Non-taxable income (34) (0.48) (182) (65.07)Expenses not deductible for tax purposes 533 7.50 197 70.10Deferred tax asset previously not recognised – – (56) (19.77)
Taxation expense per the income statement 2 488 35.02 37 13.26
CompanyTaxation expense/(income) at standard rate 1 204 28.00 (219) 28.00 Non-taxable income (28) (0.66) (131) 16.80 Expenses not deductible for tax purposes 521 12.13 190 (24.34)
Taxation expense/(income) per the income statement 1 697 39.47 (160) 20.46
43. Cash generated from operationsGroup Company
2016 2015 2016 2015Rm Rm Rm Rm
Profit before tax 7 105 279 4 299 (782)Adjustments for: 29 904 36 117 30 722 36 879
Depreciation and amortisation expense 16 531 14 115 16 517 14 001 Depreciation expense – primary energy 13 13 13 13 Net impairment loss (excluding bad debts recovered) 1 175 3 773 1 164 3 762 Net fair value gain on financial instruments including embedded derivatives 455 2 807 496 2 898 Net loss on disposal of property, plant and equipment 358 111 494 103 Writeoff of mine assets 1 903 – 1 903 – Dividend income (32) (29) (32) (19)Increase in employee benefit obligations 2 822 2 625 2 824 2 435 (Decrease)/increase in provisions (893) 7 450 (1 031) 7 694 Decrease in deferred income (152) (143) (152) (143)Payments made in advance recognised in profit or loss 432 533 324 530 Payments received in advance recognised in profit or loss (582) (1 175) (574) (1 164)Finance income (3 447) (2 996) (2 667) (2 360)Finance cost 11 366 9 105 11 443 9 129 Share of loss of equity-accounted investees (43) (49) – – Non-current assets and liabilities held-for-sale (2) (23) – –
37 009 36 396 35 021 36 097 Changes in working capital: (2 201) (8 868) (2 305) (10 647)
Increase in payments made in advance (3 093) (913) (3 055) (835)(Increase)/decrease in inventories (500) 894 (457) 831 Increase in trade and other receivables (4 269) (5 468) (4 753) (7 261)Increase/(decrease) in trade and other payables 3 853 (2 642) 3 966 (2 984)Expenditure incurred on employee benefit obligations (1 431) (3 191) (1 359) (2 957)Expenditure incurred on provisions (984) (2 008) (869) (1 891)Increase in payments received in advance 4 223 4 460 4 222 4 450
34 808 27 528 32 716 25 450
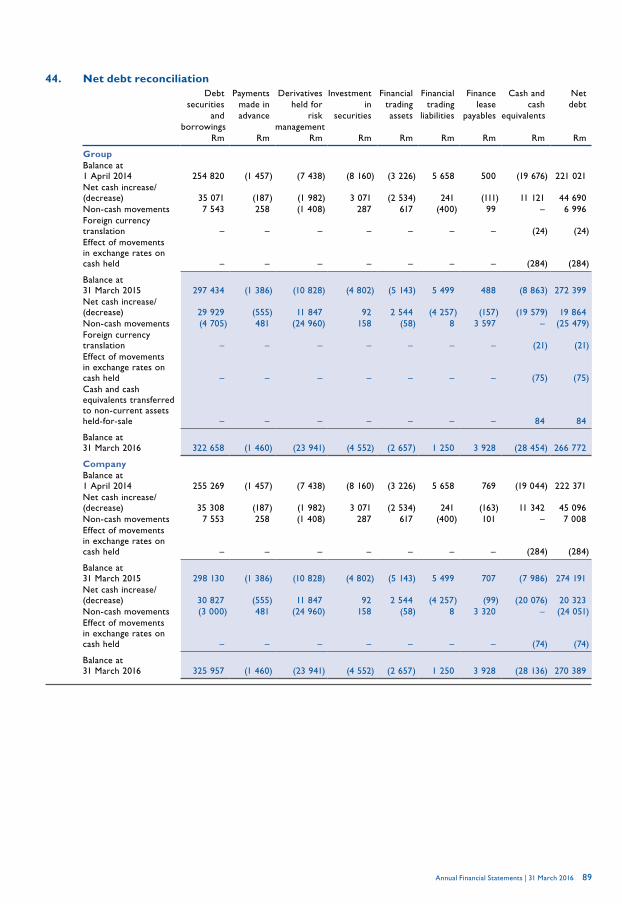
Annual Financial Statements | 31 March 2016 89
44. Net debt reconciliationDebt
securities and
borrowings
Payments made in advance
Derivatives held for
risk management
Investment in
securities
Financial trading assets
Financial trading
liabilities
Finance lease
payables
Cash and cash
equivalents
Net debt
Rm Rm Rm Rm Rm Rm Rm Rm Rm
GroupBalance at 1 April 2014 254 820 (1 457) (7 438) (8 160) (3 226) 5 658 500 (19 676) 221 021 Net cash increase/(decrease) 35 071 (187) (1 982) 3 071 (2 534) 241 (111) 11 121 44 690 Non-cash movements 7 543 258 (1 408) 287 617 (400) 99 – 6 996 Foreign currency translation – – – – – – – (24) (24)Effect of movements in exchange rates on cash held – – – – – – – (284) (284)
Balance at 31 March 2015 297 434 (1 386) (10 828) (4 802) (5 143) 5 499 488 (8 863) 272 399 Net cash increase/(decrease) 29 929 (555) 11 847 92 2 544 (4 257) (157) (19 579) 19 864 Non-cash movements (4 705) 481 (24 960) 158 (58) 8 3 597 – (25 479)Foreign currency translation – – – – – – – (21) (21)Effect of movements in exchange rates on cash held – – – – – – – (75) (75)Cash and cash equivalents transferred to non-current assets held-for-sale – – – – – – – 84 84
Balance at 31 March 2016 322 658 (1 460) (23 941) (4 552) (2 657) 1 250 3 928 (28 454) 266 772
CompanyBalance at 1 April 2014 255 269 (1 457) (7 438) (8 160) (3 226) 5 658 769 (19 044) 222 371 Net cash increase/(decrease) 35 308 (187) (1 982) 3 071 (2 534) 241 (163) 11 342 45 096 Non-cash movements 7 553 258 (1 408) 287 617 (400) 101 – 7 008 Effect of movements in exchange rates on cash held – – – – – – – (284) (284)
Balance at 31 March 2015 298 130 (1 386) (10 828) (4 802) (5 143) 5 499 707 (7 986) 274 191 Net cash increase/(decrease) 30 827 (555) 11 847 92 2 544 (4 257) (99) (20 076) 20 323 Non-cash movements (3 000) 481 (24 960) 158 (58) 8 3 320 – (24 051)Effect of movements in exchange rates on cash held – – – – – – – (74) (74)
Balance at 31 March 2016 325 957 (1 460) (23 941) (4 552) (2 657) 1 250 3 928 (28 136) 270 389

Notes to the financial statements (continued)for the year ended 31 March 2016
Eskom Holdings SOC Ltd90
45. Guarantees and contingent liabilitiesGroup Company
Unit 2016 2015 2016 2015
Eskom issues guarantees for strategic and business purposes to facilitate other business transactions.
45.1 Financial guaranteesLong-term debt raised by Motraco Motraco, a private joint venture company between Eskom, Electricidade de Mocambique and Swaziland Electricity Board, owns transmission lines connecting the South African, Mozambican and Swaziland national grids to establish a secure source of electrical power for the Mozal aluminium smelter in Maputo, Mozambique. Motraco has raised debt as part of these operations maturing on 30 April 2019. Eskom has guaranteed a portion of this debt.
The guarantees would be triggered if Motraco was unable to meet its obligations in terms of the long-term debt agreement. The risk of default resulting from the political risk in Mozambique is mitigated through a guarantee arranged with an established international insurance company, which specialises in facilitating investments in high risk, low income countries.Guarantee issued USDm 10 13 10 13 Default probability % 0.40 0.43 0.40 0.43Financial guarantee Rm 151 158 151 158
Unprovided portion, disclosed as a contingent liability Rm 150 157 150 157 Provision (refer to note 29) Rm 1 1 1 1
The default probability trend into the future is seen to be positive, and changes in variables will not have a significant impact on profit or loss.
No payments have been made in terms of these guarantees since their inception in 1999.
EFC loans to group employeesEFC has granted loans (secured by mortgage bonds on the properties) to qualifying employees of the group. Eskom has issued guarantees to EFC to the extent to which the loan values of employees exceed the current value of the mortgage security.Historically EFC has absorbed any losses incurred and has not called up any guarantee payments. Eskom’s guarantee exposure is therefore governed by the default probability of EFC, which is influenced by the risk of significant fluctuations in interest rates that might cause employees to default on their repayments. The risk adjusted credit exposure of EFC is calculated by applying a rating agency’s annual default probabilities.
Unsecured portion of loan book % – – 1.00 2.00Default probability of unsecured portion of loan book % – – 26.00 27.00Secured portion of loan book % – – 99.00 98.00
Default probability of secured portion of loan book % – – 0.01 0.01Financial guarantee Rm – – 1 111 1 131
Unprovided portion, disclosed as a contingent liability Rm – – 1 110 1 130 Provision (refer to note 29) Rm – – 1 1
Changes in variables will not have a significant impact on profit or loss.
Summary of financial guaranteesUnprovided portion, disclosed as a contingent liability Rm 150 157 1 260 1 287
Long-term debt raised by Motraco Rm 150 157 150 157 EFC loans to group employees Rm – – 1 110 1 130
Amounts provided in other provisions Rm 1 1 2 2
Long-term debt raised by Motraco Rm 1 1 1 1 EFC loans to group employees Rm – – 1 1
Total guarantees Rm 151 158 1 262 1 289
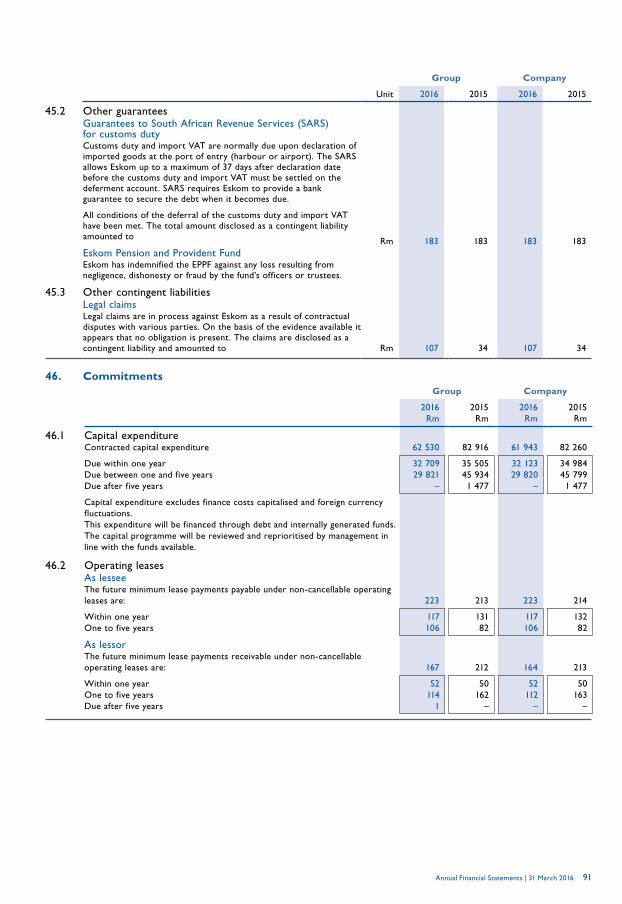
Annual Financial Statements | 31 March 2016 91
Group Company
Unit 2016 2015 2016 2015
45.2 Other guaranteesGuarantees to South African Revenue Services (SARS) for customs duty Customs duty and import VAT are normally due upon declaration of imported goods at the port of entry (harbour or airport). The SARS allows Eskom up to a maximum of 37 days after declaration date before the customs duty and import VAT must be settled on the deferment account. SARS requires Eskom to provide a bank guarantee to secure the debt when it becomes due.
All conditions of the deferral of the customs duty and import VAT have been met. The total amount disclosed as a contingent liability amounted to Rm 183 183 183 183 Eskom Pension and Provident Fund Eskom has indemnified the EPPF against any loss resulting from negligence, dishonesty or fraud by the fund’s officers or trustees.
45.3 Other contingent liabilities Legal claims
Legal claims are in process against Eskom as a result of contractual disputes with various parties. On the basis of the evidence available it appears that no obligation is present. The claims are disclosed as a contingent liability and amounted to Rm 107 34 107 34
46. CommitmentsGroup Company
2016 2015 2016 2015Rm Rm Rm Rm
46.1 Capital expenditureContracted capital expenditure 62 530 82 916 61 943 82 260
Due within one year 32 709 35 505 32 123 34 984 Due between one and five years 29 821 45 934 29 820 45 799 Due after five years – 1 477 – 1 477
Capital expenditure excludes finance costs capitalised and foreign currency fluctuations. This expenditure will be financed through debt and internally generated funds. The capital programme will be reviewed and reprioritised by management in line with the funds available.
46.2 Operating leasesAs lesseeThe future minimum lease payments payable under non-cancellable operating leases are: 223 213 223 214
Within one year 117 131 117 132 One to five years 106 82 106 82
As lessorThe future minimum lease payments receivable under non-cancellable operating leases are: 167 212 164 213
Within one year 52 50 52 50 One to five years 114 162 112 163 Due after five years 1 – – –

Notes to the financial statements (continued)for the year ended 31 March 2016
Eskom Holdings SOC Ltd92
47. Related-party transactionsThe group is wholly owned by its shareholder, the government, represented by the DPE.
Eskom (and its subsidiaries) are classified as Schedule 2 public entities in terms of the PFMA.
Eskom’s government related parties include national departments (including the shareholder), constitutional institutions, public entities (schedule 1, 2 and 3) and local government (including municipalities).
Related parties also comprise subsidiaries of Eskom, associates and joint ventures of the group and post-retirement benefit plans for the benefit of employees. It also includes key management personnel of Eskom or its shareholder and close family members of these related parties.
The list of public entities in the national sphere of government is provided by National Treasury on its website www.treasury.gov.za. It also provides the names of subsidiaries of public entities.
Key management personnel for Eskom include the group’s board of directors and the Exco. Disclosure of related-party transactions with key management personnel is included in note 50.
The following transactions were carried out with related parties: Group Company
2016 2015 2016 2015Note Rm Rm Rm Rm
TransactionsSales of goods and services1 88 032 79 641 89 586 85 053
National departments 1 173 983 1 173 974 Local government 77 824 70 344 77 824 70 344 Public entities 6 020 5 509 6 020 5 492 Eskom subsidiaries – – 1 554 5 438 Joint venture in which Eskom is a partner 3 015 2 805 3 015 2 805
Government grant funding received for electrification 3 331 3 064 3 331 3 064
National departments 3 191 3 064 3 191 3 064 Public entities 140 – 140 –
Purchases of goods and services2 10 088 10 573 20 897 20 003
National departments 1 688 1 740 1 687 1 738 Local government 1 117 1 159 1 112 1 148 Public entities 5 023 5 436 4 376 5 372 Eskom subsidiaries – – 11 608 9 638 Joint venture in which Eskom is a partner 171 262 171 262 Other related parties 35 2 089 1 976 1 943 1 845
Finance income 1 438 1 243 1 884 1 665
National departments 311 472 311 472 Local government 827 585 827 585 Public entities 300 186 300 186 Eskom subsidiaries – – 446 422
Finance cost3 7 152 7 095 7 378 7 265
National departments 1 231 2 304 1 231 2 304 Local government 23 16 23 16 Public entities 5 740 4 677 5 740 4 677 Eskom subsidiaries – – 226 170 Other related parties 158 98 158 98
Dividend incomeJoint venture in which Eskom is a partner 31 19 – – Lease income 52 55 56 59
Public entities 52 55 52 55 Eskom subsidiaries – – 4 4
Lease expenses 1 2 1 1
Local government 1 – 1 –Public entities – 2 – 1
Finance lease finance cost
Eskom subsidiaries – – 19 20
Environmental levyPublic entities 34 8 120 8 353 8 120 8 353
1. Goods and services are sold to related parties at an arm’s length basis at market-related prices. 2. Goods and services are bought from related parties at an arm’s length basis at market-related prices. 3. Bonds are bearer instruments and it is therefore unknown if the initial counterparty still holds the bonds. Transactions in the secondary market where Eskom is not the
counterparty are therefore excluded.
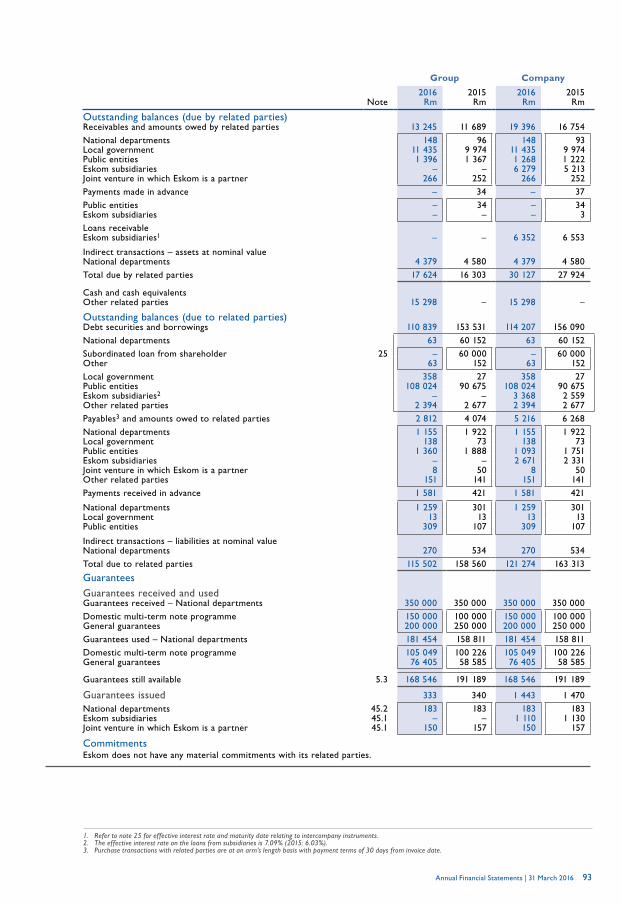
Annual Financial Statements | 31 March 2016 93
Group Company
2016 2015 2016 2015Note Rm Rm Rm Rm
Outstanding balances (due by related parties)Receivables and amounts owed by related parties 13 245 11 689 19 396 16 754 National departments 148 96 148 93 Local government 11 435 9 974 11 435 9 974 Public entities 1 396 1 367 1 268 1 222 Eskom subsidiaries – – 6 279 5 213 Joint venture in which Eskom is a partner 266 252 266 252 Payments made in advance – 34 – 37 Public entities – 34 – 34 Eskom subsidiaries – – – 3 Loans receivableEskom subsidiaries1 – – 6 352 6 553
Indirect transactions – assets at nominal valueNational departments 4 379 4 580 4 379 4 580 Total due by related parties 17 624 16 303 30 127 27 924
Cash and cash equivalentsOther related parties 15 298 – 15 298 –
Outstanding balances (due to related parties)Debt securities and borrowings 110 839 153 531 114 207 156 090 National departments 63 60 152 63 60 152 Subordinated loan from shareholder 25 – 60 000 – 60 000 Other 63 152 63 152 Local government 358 27 358 27 Public entities 108 024 90 675 108 024 90 675 Eskom subsidiaries2 – – 3 368 2 559 Other related parties 2 394 2 677 2 394 2 677 Payables3 and amounts owed to related parties 2 812 4 074 5 216 6 268 National departments 1 155 1 922 1 155 1 922 Local government 138 73 138 73 Public entities 1 360 1 888 1 093 1 751 Eskom subsidiaries – – 2 671 2 331 Joint venture in which Eskom is a partner 8 50 8 50 Other related parties 151 141 151 141 Payments received in advance 1 581 421 1 581 421
National departments 1 259 301 1 259 301Local government 13 13 13 13Public entities 309 107 309 107
Indirect transactions – liabilities at nominal valueNational departments 270 534 270 534 Total due to related parties 115 502 158 560 121 274 163 313
GuaranteesGuarantees received and usedGuarantees received – National departments 350 000 350 000 350 000 350 000 Domestic multi-term note programme 150 000 100 000 150 000 100 000 General guarantees 200 000 250 000 200 000 250 000 Guarantees used – National departments 181 454 158 811 181 454 158 811 Domestic multi-term note programme 105 049 100 226 105 049 100 226 General guarantees 76 405 58 585 76 405 58 585
Guarantees still available 5.3 168 546 191 189 168 546 191 189
Guarantees issued 333 340 1 443 1 470 National departments 45.2 183 183 183 183 Eskom subsidiaries 45.1 – – 1 110 1 130 Joint venture in which Eskom is a partner 45.1 150 157 150 157
Commitments Eskom does not have any material commitments with its related parties.
1. Refer to note 25 for effective interest rate and maturity date relating to intercompany instruments. 2. The effective interest rate on the loans from subsidiaries is 7.09% (2015: 6.03%). 3. Purchase transactions with related parties are at an arm’s length basis with payment terms of 30 days from invoice date.

Notes to the financial statements (continued)for the year ended 31 March 2016
Eskom Holdings SOC Ltd94
48. Events after the reporting date There were no significant events after the reporting date.
49. Restatement of comparativesChange in measurement basis of cross-currency swaps classified as derivatives held for risk management.
Eskom makes use of a valuation technique in terms of IFRS to determine the fair value of cross-currency swaps that are held for risk management. Eskom reviewed and improved the valuation technique to better reflect non-performance risk, in particular credit risk taking into account the credit value adjustment (CVA) of the counterparty and debit value adjustment (DVA) of Eskom. This resulted in a value that is more representative of the net credit exposure to a counterparty.
As the improvements in the valuation technique are relevant to determine the fair value in prior years and given the size of the adjustments related to prior years, the prior year financial statements have been restated.
The impact of the restatement is as follows:
Group Company
Previously reported
Adjustments Restated Previously reported
Adjustments Restated
Rm Rm Rm Rm Rm Rm
Statements of financial position at 31 March 2015
AssetsNon-currentDerivatives held for risk management 19 242 (4 939) 14 303 19 242 (4 939) 14 303 EquityCapital and reserves attributable to owner of the company 122 247 (5 083) 117 164 116 040 (5 083) 110 957 LiabilitiesNon-currentDerivatives held for risk management 520 2 121 2 641 520 2 121 2 641 Deferred tax 20 131 (1 977) 18 154 19 825 (1 977) 17 848
Income statements for the year ended 31 March 2015
Continuing operationsProfit before depreciation and amortisation expense and net fair value gain/(loss) (EBITDA) 23 261 – 23 261 22 886 – 22 886Depreciation and amortisation expense (14 115) – (14 115) (14 001) – (14 001)Net fair value gain/(loss) on financial instruments excluding embedded derivatives 630 (4 747) (4 117) 539 (4 747) (4 208)Net fair value gain on embedded derivatives 1 310 – 1 310 1 310 – 1 310
Profit before net finance cost 11 086 (4 747) 6 339 10 734 (4 747) 5 987 Net finance cost (6 109) – (6 109) (6 769) – (6 769)
Finance income 2 996 – 2 996 2 360 – 2 360 Finance cost (9 105) – (9 105) (9 129) – (9 129)
Share of profit of equity-accounted investees, net of tax 49 – 49 – – –
Profit before tax 5 026 (4 747) 279 3 965 (4 747) ( 782)Income tax (1 366) 1 329 ( 37) (1 169) 1 329 160
Profit for the year from continuing operations 3 660 (3 418) 242 2 796 (3 418) ( 622)Discontinued operationsLoss for the year from discontinued operations ( 42) – ( 42) – – –
Profit for the year 3 618 (3 418) 200 2 796 (3 418) ( 622)
Annual Financial Statements | 31 March 2016 95
50. Directors’ remuneration1
Remuneration philosophyEskom links management remuneration to the performance of the organisation and an individual’s contribution. Market factors are also crucial as rewards and remuneration must be kept at levels that will assist Eskom in retaining key leadership skills. Basic salary is augmented by short- and long-term incentives.
International and local benchmarks are considered to ensure executive packages are aligned with those offered by companies of similar stature to Eskom. Eskom aims to remunerate in line with the median of the market to recruit and retain the best management team to lead the business.
The executive remuneration strategy is constantly reviewed to stay aligned with the DPE remuneration guidelines and abreast with best practices.
People and governance committeeThe people and governance committee assists the board to apply policy relating to the remuneration of directors and executives as set by Eskom’s shareholder. The policy also covers the nomination of executives for senior positions and conditions of service.
The committee enhances business performance by:• approving, guiding and influencing key human resources policies and strategies• monitoring compliance with the Employment Equity Act• guiding strategies to achieve equity in Eskom, and• approving the principles governing reward and incentive schemes
Non-executive directorsRemuneration of non-executive directors is benchmarked against the norms for companies of similar size and is in line with guidelines issued by the shareholder. Remuneration proposals from the people and governance committee regarding non-executive directors’ remuneration are forwarded to the board. The board then makes recommendations to the shareholder.
Non-executive directors receive a fixed monthly fee and are reimbursed for out-of-pocket expenses incurred in fulfilling their duties.
Executive management committee membersThe committee makes recommendations to the board concerning the remuneration of the chief executive, and approves the remuneration of the other Exco members (group executives). The remuneration is considered in accordance with a framework approved by the shareholder. The board recommendation on the remuneration of the chief executive has to be approved by the shareholder.
Factors influencing the remuneration of the Exco members include level of skill, experience, contribution to organisational performance and success of the group. Remuneration includes a basic package and short- and long-term incentives.
Every year, the people and governance committee reviews the structure of these packages to ensure there is an appropriate balance between fixed and variable remuneration and short- and long-term incentives and rewards.
The group chief executive and chief financial officer have term contracts. The group executives have permanent employment contracts based on Eskom’s standard conditions of service.
Remuneration structureThe remuneration of the Exco members includes the following components:
Guaranteed amountThey receive a guaranteed pay package with remuneration based on cost to company. This comprises a fixed cash portion and compulsory benefits (medical aid, life cover and pension). The guaranteed amount is reviewed annually to keep remuneration in line with the market.
Short-term incentivesThese reward the achievement of individual predetermined performance objectives and targets (these are linked to the shareholder compact) as set by the group chief executive in performance contracts with each Exco member. The people and governance committee approves the targets set for the group chief executive.
The short-term incentive scheme is calculated as a percentage of pensionable earnings.
Long-term incentivesThese are designed to attract, retain and reward the Exco members for meeting the organisational objectives set by the shareholder. A market benchmarked long-term incentive scheme has been approved by the shareholder effective from 1 April 2005.
Long-term incentive schemeA number of performance shares (award performance shares) were awarded to the Exco members on 1 April 2013, 2014 and 2015.
The value of the performance shares is deemed to be R1 at grant date, and is escalated at a money market rate to determine the value at reporting date.
1. Includes remuneration of the group chief executive, chief f inancial off icer and Exco members (group executives who are senior executives but not directors of Eskom).

Notes to the financial statements (continued)for the year ended 31 March 2016
Eskom Holdings SOC Ltd96
50. Directors’ remuneration (continued)Remuneration structure (continued)Long-term incentives (continued)Long-term incentive scheme (continued)The board has set performance conditions in line with the Eskom corporate plan and shareholder compact over a three-year performance period. Performance covers financial and non-financial targets in areas such as ensuring business sustainability of Eskom, ensuring reliability of supply to all South Africans, ensuring that future power needs for South Africa are adequately provided for and supporting the developmental objectives of South Africa, with an agreed weighting in each category.
Awards only vest if and to the extent that, these targets are met. Potential vesting percentages range from 0% to 100%. A threshold and a stretch target are set for each measure, with an expected (on target) vesting of 50%.
Performance parameters aligned with the shareholder compact and corporate plan are complemented by a set of gatekeeper conditions. If gatekeeper requirements are not met, the board at its discretion may adjust the vesting percentages even though targets have been met.
The following gatekeeper conditions can trigger a review of vesting percentages:• if the LTIR is greater than 0.35• if the sustainability committee gives an unfavourable safety report • if Eskom’s audited financial statements show a financial loss • if the auditors qualify Eskom’s financial statements• if a significant PFMA contravention occurs
The vesting period for award performance shares is three years from the date of grant. At the end of that period, the people and governance committee decides on the amounts to be paid in line with:• the percentage of award performance shares that vest, based on the performance conditions achieved• the value of the award performance shares based on the grant value, escalated at a money market rate
In addition to the performance conditions, vesting of award performance shares is dependent on the scheme participant remaining in Eskom’s employment throughout the vesting period. The award lapses if employment ceases during the vesting period (other than for permitted reasons).
Share awards – vestedAward performance shares awarded on 1 April 2013 vested on 31 March 2016 with an expected vesting rate over the three-year period of 44.48% due to the achievement of non-financial performance conditions. The cash value of the vested shares is payable in June 2016 at R1.23 per share based on the money market rate. Shares awarded on 1 April 2012 were redeemed during the year.
Shares vested on 31 March 2016 (with comparative status at 31 March 2015) are:
Award performance
shares vested on 31 March 2016
Award performance
shares vested on 31 March 2016 at a rate of 34.48%1
Award performance
shares payable at R1.23 per share
Award performance
shares vested on 31 March 2015
Award performance
shares vested on 31 March 2015 at a rate of 42.06%1
Award performance
shares payable at R1.20 per share
Name Number Number R'000 Number Number R'000
TBL Molefe – – – 1 829 776 769 604 924T Govender 2 185 983 753 727 927 2 185 983 919 424 1 103MM Koko 1 677 295 578 331 711 1 677 294 705 470 847SJ Lennon – – – 2 109 869 887 411 1 065DL Marokane – – – 2 658 316 1 118 088 1 342AA Masango 1 028 088 354 485 436 964 894 405 834 487A Noah 2 171 168 748 619 921 2 171 168 913 193 1 096MM Ntsokolo 2 488 574 858 060 1 055 2 488 574 1 046 694 1 256EM Pule 1 597 367 550 772 677 1 597 367 671 853 806
Share awards – vestingThe current estimated vesting values of the award performance shares are R1.24 per share for the 1 April 2014 awards (vesting 31 March 2017) and R1.26 for the April 2015 awards (vesting 31 March 2018). The value of the performance shares allocated does not take into account the impact of performance conditions over the applicable three-year performance periods. The vesting percentage of 50% for the 1 April 2014 and 50% for the 1 April 2015 awards, are estimates.
1. The people and governance committee applied its discretion and reduced the vesting rate from 44.48% to 34.48% (2015: 47.06% to 42.06%).

Annual Financial Statements | 31 March 2016 97
Shares awarded on 1 April 2015 Shares awarded on 1 April 2014Outstanding
award performance
shares vesting on 31 March 2018
Award performance
shares vesting on 31 March 2018 at
a rate of 50%
Award performance
shares payable in June 2018 at
R1.26 per share
Outstanding award
performance shares vesting on
31 March 2017
Award performance
shares vesting on 31 March 2017 at
a rate of 50%
Award performance
shares payable in June 2017 at
R1.24 per shareName Number Number R'000 Number Number R'000
B Molefe 7 502 880 3 751 440 4 727 – – – A Singh 3 869 880 1 934 940 2 438 – – – T Govender 2 574 094 1 287 047 1 622 2 423 818 1 211 909 1 503 MM Koko 2 693 304 1 346 652 1 697 2 028 856 1 014 428 1 258 AA Masango 1 624 104 812 052 1 023 1 526 407 763 204 946A Noah 2 556 648 1 278 324 1 611 2 407 391 1 203 696 1 493 MM Ntsokolo 2 930 405 1 465 203 1 846 2 759 328 1 379 664 1 711 EM Pule 1 791 402 895 701 1 129 1 686 820 843 410 1 046
The details of the schemes are: Long-term
incentive plan Long-term
incentive plan
Date of grant 1 April 2015 1 April 2014Number of shares awarded 25 542 717 12 832 620 Contractual life Three years Three yearsVesting conditions Variable vesting
depending onthe achievementof performance
conditions
Variable vesting depending on
the achievement of performance
conditionsMethod of settlement Cash CashExpected attrition of employee (%) – – Expected outcome of performance conditions (%) 50% 50%
Long-term incentive plan
2016
Long-term incentive plan
2015Reconciliation of performance share movements Number Number
Outstanding at beginning of the year 43 959 547 58 755 334 Granted during the year 25 542 717 12 832 620 Changes in Exco during the year 2 192 881 4 239 555Forfeited during the year (4 488 092) (5 618 788)Settled during the year (17 683 241) (26 249 174)
Outstanding at end of the year 49 523 812 43 959 547
Carrying amount of liability (R’000) 14 380 15 072
Intrinsic value of liabilities relating to vested rights (R’000) 4 728 8 925
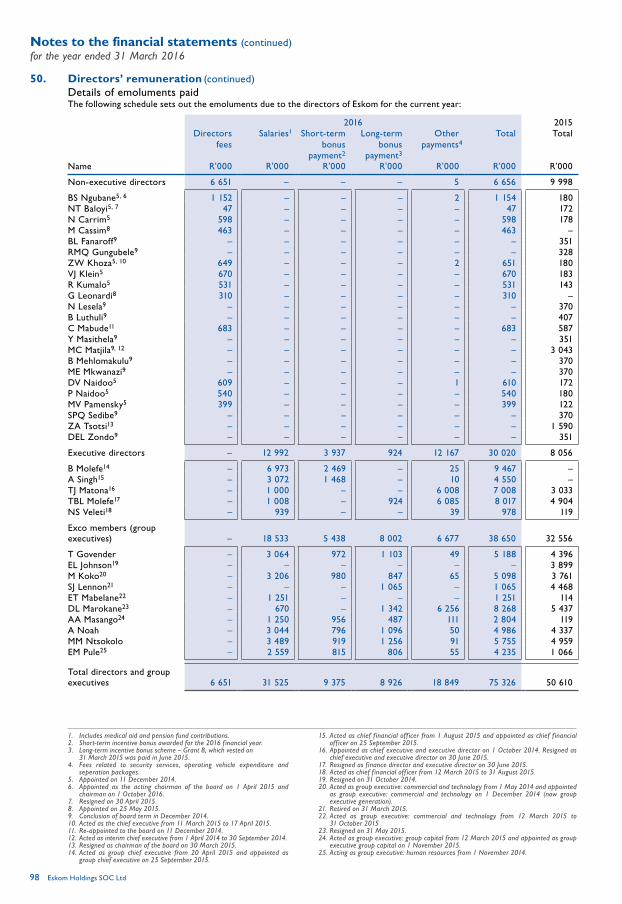
Notes to the financial statements (continued)for the year ended 31 March 2016
Eskom Holdings SOC Ltd98
50. Directors’ remuneration (continued)Details of emoluments paidThe following schedule sets out the emoluments due to the directors of Eskom for the current year:
2016 2015Directors
feesSalaries1 Short-term
bonusLong-term
bonusOther
payments4Total Total
payment2 payment3
Name R'000 R'000 R'000 R'000 R'000 R'000 R'000
Non-executive directors 6 651 – – – 5 6 656 9 998
BS Ngubane5, 6 1 152 – – – 2 1 154 180 NT Baloyi5, 7 47 – – – – 47 172 N Carrim5 598 – – – – 598 178 M Cassim8 463 – – – – 463 – BL Fanaroff9 – – – – – – 351 RMQ Gungubele9 – – – – – – 328 ZW Khoza5, 10 649 – – – 2 651 180 VJ Klein5 670 – – – – 670 183 R Kumalo5 531 – – – – 531 143 G Leonardi8 310 – – – – 310 – N Lesela9 – – – – – – 370 B Luthuli9 – – – – – – 407 C Mabude11 683 – – – – 683 587 Y Masithela9 – – – – – – 351 MC Matjila9, 12 – – – – – – 3 043 B Mehlomakulu9 – – – – – – 370 ME Mkwanazi9 – – – – – – 370 DV Naidoo5 609 – – – 1 610 172 P Naidoo5 540 – – – – 540 180 MV Pamensky5 399 – – – – 399 122 SPQ Sedibe9 – – – – – – 370 ZA Tsotsi13 – – – – – – 1 590 DEL Zondo9 – – – – – – 351
Executive directors – 12 992 3 937 924 12 167 30 020 8 056
B Molefe14 – 6 973 2 469 – 25 9 467 – A Singh15 – 3 072 1 468 – 10 4 550 – TJ Matona16 – 1 000 – – 6 008 7 008 3 033 TBL Molefe17 – 1 008 – 924 6 085 8 017 4 904 NS Veleti18 – 939 – – 39 978 119
Exco members (group executives) – 18 533 5 438 8 002 6 677 38 650 32 556
T Govender – 3 064 972 1 103 49 5 188 4 396 EL Johnson19 – – – – – – 3 899 M Koko20 – 3 206 980 847 65 5 098 3 761 SJ Lennon21 – – – 1 065 – 1 065 4 468 ET Mabelane22 – 1 251 – – – 1 251 114DL Marokane23 – 670 – 1 342 6 256 8 268 5 437 AA Masango24 – 1 250 956 487 111 2 804 119 A Noah – 3 044 796 1 096 50 4 986 4 337 MM Ntsokolo – 3 489 919 1 256 91 5 755 4 959 EM Pule25 – 2 559 815 806 55 4 235 1 066
Total directors and group executives 6 651 31 525 9 375 8 926 18 849 75 326 50 610
1. Includes medical aid and pension fund contributions.2. Short-term incentive bonus awarded for the 2016 f inancial year.3. Long-term incentive bonus scheme – Grant 8, which vested on
31 March 2015 was paid in June 2015.4. Fees related to security services, operating vehicle expenditure and
seperation packages.5. Appointed on 11 December 2014.6. Appointed as the acting chairman of the board on 1 April 2015 and
chairman on 1 October 2016.7. Resigned on 30 April 2015.8. Appointed on 25 May 2015.9. Conclusion of board term in December 2014.10. Acted as the chief executive from 11 March 2015 to 17 April 2015.11. Re-appointed to the board on 11 December 2014.12. Acted as interim chief executive from 1 April 2014 to 30 September 2014.13. Resigned as chairman of the board on 30 March 2015.14. Acted as group chief executive from 20 April 2015 and appointed as
group chief executive on 25 September 2015.
15. Acted as chief f inancial off icer from 1 August 2015 and appointed as chief f inancial off icer on 25 September 2015.
16. Appointed as chief executive and executive director on 1 October 2014. Resigned as chief executive and executive director on 30 June 2015.
17. Resigned as f inance director and executive director on 30 June 2015.18. Acted as chief f inancial off icer from 12 March 2015 to 31 August 2015.19. Resigned on 31 October 2014.20. Acted as group executive: commercial and technology from 1 May 2014 and appointed
as group executive: commercial and technology on 1 December 2014 (now group executive generation).
21. Retired on 31 March 2015.22. Acted as group executive: commercial and technology from 12 March 2015 to
31 October 201523. Resigned on 31 May 2015.24. Acted as group executive: group capital from 12 March 2015 and appointed as group
executive group capital on 1 November 2015.25. Acting as group executive: human resources from 1 November 2014.

Annual Financial Statements | 31 March 2016 99
2016 2015R'000 R'000
Housing loans to Exco members at 31 MarchT Govender – 1 773 ET Mabelane 678 720 AA Masango 526 541 EM Pule 135 182
1 339 3 216
The interest rate on the loan from EFC at 31 March 2016 was 8.50% (2015: 7.50%). The loans are repayable over a maximum period of 30 years1.
The following board and Exco members were directors of Eskom directly held subsidiary companies. Fees paid for attendance of meetings were all paid to Eskom Holdings.
Eskom Enterprises SOC Ltd2
T Govender – – DL Marokane3 – – TBL Molefe4 – – MM Ntsokolo – –
Escap SOC Ltd5
EL Johnson6 – – TBL Molefe7 – 36 DL Marokane8 – –A Singh9 – –
Eskom Finance Company SOC Ltd5
TBL Molefe10 5 5 NS Veleti11 – 10 A Singh12 10 – EM Pule 10 –
1. On resignation the terms and conditions of the loan are renegotiated.2. Paid by Eskom.3. Resigned on 26 June 2015.4. Resigned on 1 July 2015.5. Fees paid to Eskom.6. Resigned on 31 October 2014.7. Resigned on 11 July 2015.8. Appointed on 26 January 2015 and resigned on 1 June 2015.9. Appointed on 15 October 2015.10. Resigned on 1 July 2015.11. Resigned on 1 October 2015.12. Appointed on 21 October 2015.
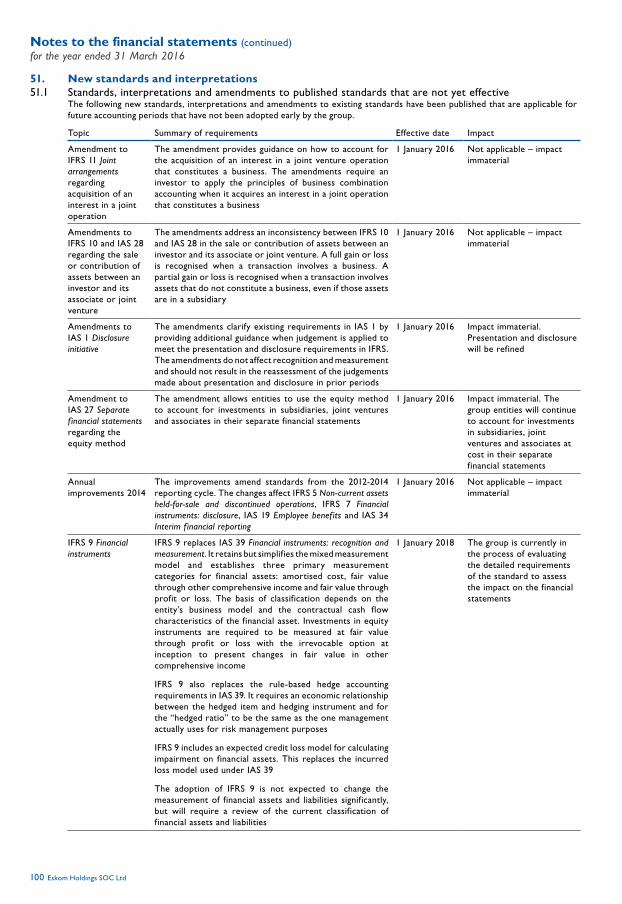
Notes to the financial statements (continued)for the year ended 31 March 2016
Eskom Holdings SOC Ltd100
51. New standards and interpretations 51.1 Standards, interpretations and amendments to published standards that are not yet effective
The following new standards, interpretations and amendments to existing standards have been published that are applicable for future accounting periods that have not been adopted early by the group.
Topic Summary of requirements Effective date Impact
Amendment to IFRS 11 Joint arrangements regarding acquisition of an interest in a joint operation
The amendment provides guidance on how to account for the acquisition of an interest in a joint venture operation that constitutes a business. The amendments require an investor to apply the principles of business combination accounting when it acquires an interest in a joint operation that constitutes a business
1 January 2016 Not applicable – impact immaterial
Amendments to IFRS 10 and IAS 28 regarding the sale or contribution of assets between an investor and its associate or joint venture
The amendments address an inconsistency between IFRS 10 and IAS 28 in the sale or contribution of assets between an investor and its associate or joint venture. A full gain or loss is recognised when a transaction involves a business. A partial gain or loss is recognised when a transaction involves assets that do not constitute a business, even if those assets are in a subsidiary
1 January 2016 Not applicable – impact immaterial
Amendments to IAS 1 Disclosure initiative
The amendments clarify existing requirements in IAS 1 by providing additional guidance when judgement is applied to meet the presentation and disclosure requirements in IFRS. The amendments do not affect recognition and measurement and should not result in the reassessment of the judgements made about presentation and disclosure in prior periods
1 January 2016 Impact immaterial. Presentation and disclosure will be refined
Amendment to IAS 27 Separate f inancial statements regarding the equity method
The amendment allows entities to use the equity method to account for investments in subsidiaries, joint ventures and associates in their separate financial statements
1 January 2016 Impact immaterial. The group entities will continue to account for investments in subsidiaries, joint ventures and associates at cost in their separate financial statements
Annual improvements 2014
The improvements amend standards from the 2012-2014 reporting cycle. The changes affect IFRS 5 Non-current assets held-for-sale and discontinued operations, IFRS 7 Financial instruments: disclosure, IAS 19 Employee benefits and IAS 34 Interim f inancial reporting
1 January 2016 Not applicable – impact immaterial
IFRS 9 Financial instruments
IFRS 9 replaces IAS 39 Financial instruments: recognition and measurement. It retains but simplifies the mixed measurement model and establishes three primary measurement categories for financial assets: amortised cost, fair value through other comprehensive income and fair value through profit or loss. The basis of classification depends on the entity’s business model and the contractual cash flow characteristics of the financial asset. Investments in equity instruments are required to be measured at fair value through profit or loss with the irrevocable option at inception to present changes in fair value in other comprehensive income
IFRS 9 also replaces the rule-based hedge accounting requirements in IAS 39. It requires an economic relationship between the hedged item and hedging instrument and for the “hedged ratio” to be the same as the one management actually uses for risk management purposes
IFRS 9 includes an expected credit loss model for calculating impairment on financial assets. This replaces the incurred loss model used under IAS 39
The adoption of IFRS 9 is not expected to change the measurement of financial assets and liabilities significantly, but will require a review of the current classification of financial assets and liabilities
1 January 2018 The group is currently in the process of evaluating the detailed requirements of the standard to assess the impact on the financial statements
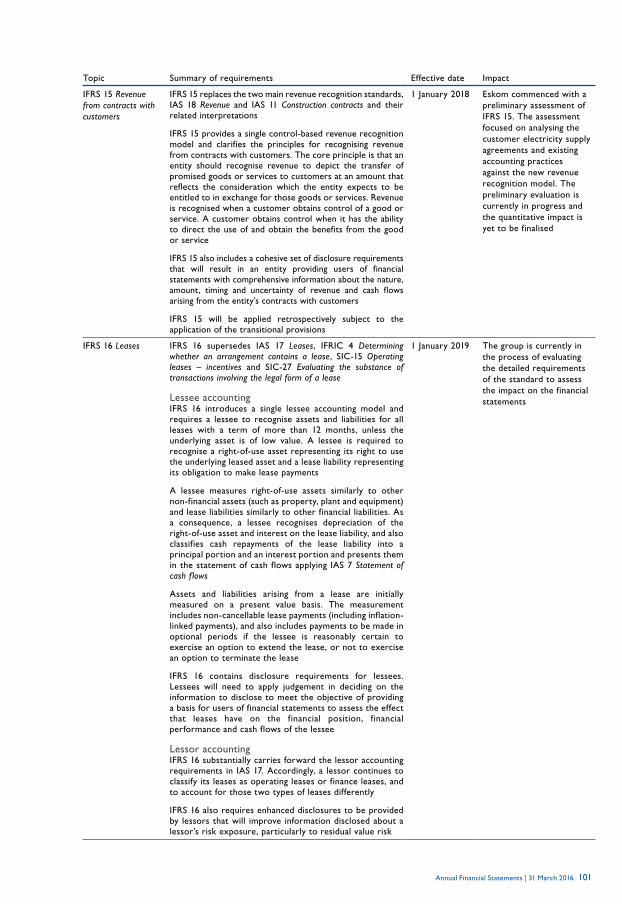
Annual Financial Statements | 31 March 2016 101
Topic Summary of requirements Effective date Impact
IFRS 15 Revenue from contracts with customers
IFRS 15 replaces the two main revenue recognition standards, IAS 18 Revenue and IAS 11 Construction contracts and their related interpretations
IFRS 15 provides a single control-based revenue recognition model and clarifies the principles for recognising revenue from contracts with customers. The core principle is that an entity should recognise revenue to depict the transfer of promised goods or services to customers at an amount that reflects the consideration which the entity expects to be entitled to in exchange for those goods or services. Revenue is recognised when a customer obtains control of a good or service. A customer obtains control when it has the ability to direct the use of and obtain the benefits from the good or service
IFRS 15 also includes a cohesive set of disclosure requirements that will result in an entity providing users of financial statements with comprehensive information about the nature, amount, timing and uncertainty of revenue and cash flows arising from the entity’s contracts with customers
IFRS 15 will be applied retrospectively subject to the application of the transitional provisions
1 January 2018 Eskom commenced with a preliminary assessment of IFRS 15. The assessment focused on analysing the customer electricity supply agreements and existing accounting practices against the new revenue recognition model. The preliminary evaluation is currently in progress and the quantitative impact is yet to be finalised
IFRS 16 Leases IFRS 16 supersedes IAS 17 Leases, IFRIC 4 Determining whether an arrangement contains a lease, SIC-15 Operating leases – incentives and SIC-27 Evaluating the substance of transactions involving the legal form of a lease
Lessee accounting IFRS 16 introduces a single lessee accounting model and requires a lessee to recognise assets and liabilities for all leases with a term of more than 12 months, unless the underlying asset is of low value. A lessee is required to recognise a right-of-use asset representing its right to use the underlying leased asset and a lease liability representing its obligation to make lease payments
A lessee measures right-of-use assets similarly to other non-financial assets (such as property, plant and equipment) and lease liabilities similarly to other financial liabilities. As a consequence, a lessee recognises depreciation of the right-of-use asset and interest on the lease liability, and also classifies cash repayments of the lease liability into a principal portion and an interest portion and presents them in the statement of cash flows applying IAS 7 Statement of cash flows
Assets and liabilities arising from a lease are initially measured on a present value basis. The measurement includes non-cancellable lease payments (including inflation-linked payments), and also includes payments to be made in optional periods if the lessee is reasonably certain to exercise an option to extend the lease, or not to exercise an option to terminate the lease
IFRS 16 contains disclosure requirements for lessees. Lessees will need to apply judgement in deciding on the information to disclose to meet the objective of providing a basis for users of financial statements to assess the effect that leases have on the financial position, financial performance and cash flows of the lessee
Lessor accounting IFRS 16 substantially carries forward the lessor accounting requirements in IAS 17. Accordingly, a lessor continues to classify its leases as operating leases or finance leases, and to account for those two types of leases differently
IFRS 16 also requires enhanced disclosures to be provided by lessors that will improve information disclosed about a lessor’s risk exposure, particularly to residual value risk
1 January 2019 The group is currently in the process of evaluating the detailed requirements of the standard to assess the impact on the financial statements
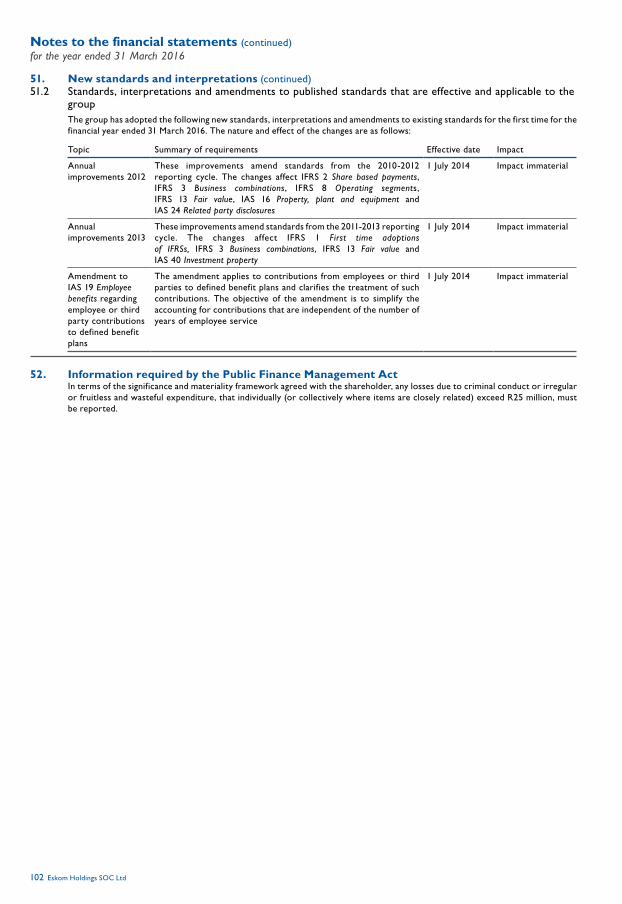
Notes to the financial statements (continued)for the year ended 31 March 2016
Eskom Holdings SOC Ltd102
51. New standards and interpretations (continued)51.2 Standards, interpretations and amendments to published standards that are effective and applicable to the
groupThe group has adopted the following new standards, interpretations and amendments to existing standards for the first time for the financial year ended 31 March 2016. The nature and effect of the changes are as follows:
Topic Summary of requirements Effective date Impact
Annual improvements 2012
These improvements amend standards from the 2010-2012 reporting cycle. The changes affect IFRS 2 Share based payments, IFRS 3 Business combinations, IFRS 8 Operating segments, IFRS 13 Fair value, IAS 16 Property, plant and equipment and IAS 24 Related party disclosures
1 July 2014 Impact immaterial
Annual improvements 2013
These improvements amend standards from the 2011-2013 reporting cycle. The changes affect IFRS 1 First time adoptions of IFRSs, IFRS 3 Business combinations, IFRS 13 Fair value and IAS 40 Investment property
1 July 2014 Impact immaterial
Amendment to IAS 19 Employee benefits regarding employee or third party contributions to defined benefit plans
The amendment applies to contributions from employees or third parties to defined benefit plans and clarifies the treatment of such contributions. The objective of the amendment is to simplify the accounting for contributions that are independent of the number of years of employee service
1 July 2014 Impact immaterial
52. Information required by the Public Finance Management ActIn terms of the significance and materiality framework agreed with the shareholder, any losses due to criminal conduct or irregular or fruitless and wasteful expenditure, that individually (or collectively where items are closely related) exceed R25 million, must be reported.

Annual Financial Statements | 31 March 2016 103
52.1 Irregular expenditureGroup and company
2016 2015Note Rm Rm
Balance at beginning of the year 418 – Current year expenditure 106 712
Back 2 Basics Programme (a) – 310 Land purchase (b) – 108 Breach of PPPFA (c) 41 287 Breach of NEMA (d) 7 – Use of labour broker – internal processes not followed (e) 10 – Professional services contract – internal processes not followed (f) 36 – Commitments made before approval (g) 3 – Procurement of services – incorrect classification as an emergency (h) 4 – Various other instances 5 7
Amounts condoned (146) (4)
Condoned in prior year – (4)Land purchase (b) (108) – Professional services contract (f) (36) – Commitments made before approval (g) (2) –
378 708 Amounts recoverable (not condoned) – – Amounts not recoverable (not condoned) (30) (290)
Breach of PPPFA (c) (30) (287)Immaterial/minor incidence – preventative and corrective measures in place – (3)
Irregular expenditure awaiting condonation 348 418
Comprising 348 418
B2B Engineering Tools 310 310 Land purchase – 108 Breach of PPPFA 11 – Breach of NEMA 7 – Use of labour broker 10 – Commitments made before approval 1 – Procurement of services – incorrect classification as an emergency 4 – Various other instances 5 –
Age analysis 348 418
Current year 38 418 Prior years 310 –
(a) Back 2 Basics Programme engineering toolsThe expenditure of R310 million on the Back 2 Basics engineering tools project was derecognised by the board on 19 April 2016 within the provisions of the National Treasury Guideline of April 2015. The matter is still reflected in the closing balance of irregular expenditure at 31 March 2016 as derecognition occurred after year end.
(b) Purchase of land without investment committee approvalThe irregular expenditure incurred has been condoned by the relevant authority and has therefore been removed from the register of irregular expenditure.
(c) Preferential Procurement Policy Framework ActThe expenditure of R41 million that was incurred during the year in breach of the PPPFA consists of the following:• Eskom’s exemption from the PPPFA expired on 7 December 2012. Eskom paid R30 million (2015: R287 million) for the year
ended 31 March 2016 on contracts that were entered into between 8 December 2012 and 31 March 2013 that were inconsistent with the requirements of the PPPFA. These contracts were not recalled or corrected and Eskom will continue to meet its obligations under these contracts until they expire. All these transactions took place in the normal course of business and were subject to Eskom’s approved procurement policy in force at that time.
• Eskom applied monetary thresholds contrary to the requirements of the PPPFA. The amounts used in determining the appropriate bidding process applicable to specific transactions were exclusive of VAT whereas the requirement is that it should be determined using amounts inclusive of VAT. Certain procurement was therefore done using the incorrect bidding process resulting in irregular expenditure being incurred on affected transactions amounting to R11 million. The total population of affected transactions is currently under investigation to determine if any more contracts have been affected. Eskom is ensuring that regular reviews are conducted and that buyers are made aware and retrained on the supply chain management procedure. Condonation of any instances of irregular expenditure will be sought during the 2017 financial year.
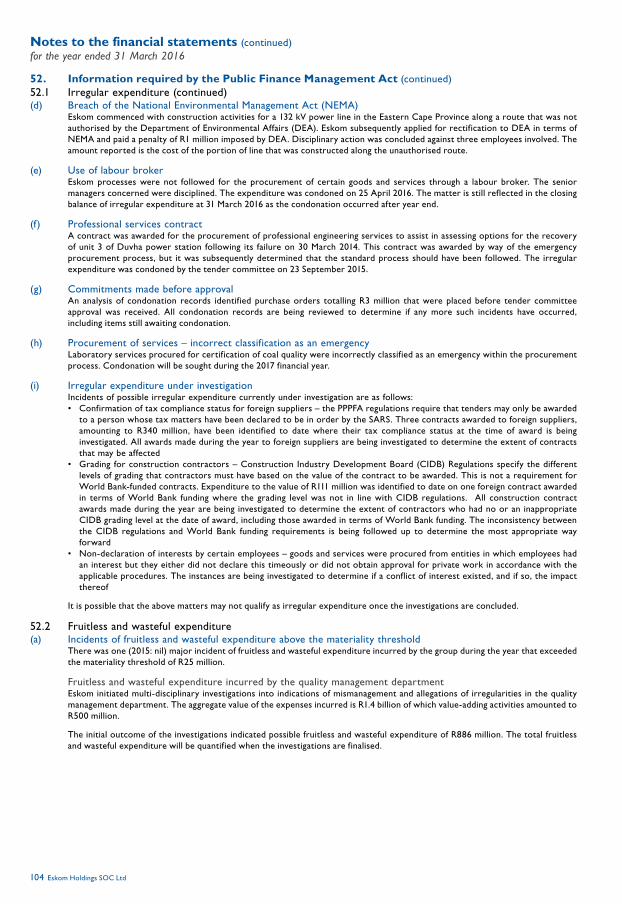
Notes to the financial statements (continued)for the year ended 31 March 2016
Eskom Holdings SOC Ltd104
52. Information required by the Public Finance Management Act (continued)52.1 Irregular expenditure (continued)(d) Breach of the National Environmental Management Act (NEMA)
Eskom commenced with construction activities for a 132 kV power line in the Eastern Cape Province along a route that was not authorised by the Department of Environmental Affairs (DEA). Eskom subsequently applied for rectification to DEA in terms of NEMA and paid a penalty of R1 million imposed by DEA. Disciplinary action was concluded against three employees involved. The amount reported is the cost of the portion of line that was constructed along the unauthorised route.
(e) Use of labour brokerEskom processes were not followed for the procurement of certain goods and services through a labour broker. The senior managers concerned were disciplined. The expenditure was condoned on 25 April 2016. The matter is still reflected in the closing balance of irregular expenditure at 31 March 2016 as the condonation occurred after year end.
(f) Professional services contractA contract was awarded for the procurement of professional engineering services to assist in assessing options for the recovery of unit 3 of Duvha power station following its failure on 30 March 2014. This contract was awarded by way of the emergency procurement process, but it was subsequently determined that the standard process should have been followed. The irregular expenditure was condoned by the tender committee on 23 September 2015.
(g) Commitments made before approvalAn analysis of condonation records identified purchase orders totalling R3 million that were placed before tender committee approval was received. All condonation records are being reviewed to determine if any more such incidents have occurred, including items still awaiting condonation.
(h) Procurement of services – incorrect classification as an emergency Laboratory services procured for certification of coal quality were incorrectly classified as an emergency within the procurement process. Condonation will be sought during the 2017 financial year.
(i) Irregular expenditure under investigationIncidents of possible irregular expenditure currently under investigation are as follows:• Confirmation of tax compliance status for foreign suppliers – the PPPFA regulations require that tenders may only be awarded
to a person whose tax matters have been declared to be in order by the SARS. Three contracts awarded to foreign suppliers, amounting to R340 million, have been identified to date where their tax compliance status at the time of award is being investigated. All awards made during the year to foreign suppliers are being investigated to determine the extent of contracts that may be affected
• Grading for construction contractors – Construction Industry Development Board (CIDB) Regulations specify the different levels of grading that contractors must have based on the value of the contract to be awarded. This is not a requirement for World Bank-funded contracts. Expenditure to the value of R111 million was identified to date on one foreign contract awarded in terms of World Bank funding where the grading level was not in line with CIDB regulations. All construction contract awards made during the year are being investigated to determine the extent of contractors who had no or an inappropriate CIDB grading level at the date of award, including those awarded in terms of World Bank funding. The inconsistency between the CIDB regulations and World Bank funding requirements is being followed up to determine the most appropriate way forward
• Non-declaration of interests by certain employees – goods and services were procured from entities in which employees had an interest but they either did not declare this timeously or did not obtain approval for private work in accordance with the applicable procedures. The instances are being investigated to determine if a conflict of interest existed, and if so, the impact thereof
It is possible that the above matters may not qualify as irregular expenditure once the investigations are concluded.
52.2 Fruitless and wasteful expenditure(a) Incidents of fruitless and wasteful expenditure above the materiality threshold
There was one (2015: nil) major incident of fruitless and wasteful expenditure incurred by the group during the year that exceeded the materiality threshold of R25 million.
Fruitless and wasteful expenditure incurred by the quality management departmentEskom initiated multi-disciplinary investigations into indications of mismanagement and allegations of irregularities in the quality management department. The aggregate value of the expenses incurred is R1.4 billion of which value-adding activities amounted to R500 million.
The initial outcome of the investigations indicated possible fruitless and wasteful expenditure of R886 million. The total fruitless and wasteful expenditure will be quantified when the investigations are finalised.

Annual Financial Statements | 31 March 2016 105
Actions taken to date include:• initial investigations led to the dismissal of two employees (includes a senior manager)• civil litigation is currently underway against one of the main suppliers • a fidelity claim has been lodged against Eskom insurance for losses arising from fraudulent or dishonest acts committed by
employees (cover limit of R3 billion)
Further disciplinary, civil and/or criminal action will be considered against all parties involved based on the findings of the independent forensic investigation that is currently in progress.
(b) Incidents of fruitless and wasteful expenditure below the materiality thresholdTotal fruitless and wasteful expenditure which individually or collectively (where items are closely related) were below the materiality threshold was R93 million (2015: R51 million) comprising 655 (2015: 606) incidents of which 25 incidents accounted for R80 million. Management continues to institute preventive and corrective measures, including disciplinary action, as considered appropriate.
(c) Fruitless and wasteful expenditure under investigationThere are currently 96 incidents of alleged fruitless and wasteful expenditure under investigation, of which one may exceed the materiality threshold of R25 million. The nature and extent of potential losses incurred cannot be reasonably ascertained at this stage. It is important to note that these are allegations and many of these occurrences may not qualify as fruitless and wasteful expenditure upon conclusion of the investigations.
52.3 Criminal conduct(a) Theft of conductors, cabling and related equipment
Losses due to conductor theft, cabling and related equipment totalled R85 million (2015: R102 million), involving 5 161 incidents (2015: 5 680 incidents). Actions to combat these losses are managed by the Eskom Network Equipment Crime Committee in collaboration with affected state owned enterprises and the South African Police Services. The combined effort resulted in 229 (2015: 297) arrests and R5 million (2015: R11 million) worth of stolen material was recovered.
(b) FraudEskom concluded 14 (2015: 23) investigations into fraud during the reporting period involving R33 million (2015: R40 million). The existing internal control measures in the affected areas as well as similar areas have been reviewed and enhanced. Disciplinary, criminal as well as civil proceedings have been instituted against those involved.

Notes to the financial statements (continued)for the year ended 31 March 2016
Eskom Holdings SOC Ltd106
53. Pro forma revaluation of property, plant and equipment (unaudited) The group currently accounts for its property, plant and equipment using the cost model under IAS 16 Property, plant and equipment. The cost model requires that property, plant and equipment should be measured at cost (including borrowing cost capitalised in respect of qualifying assets), less accumulated depreciation and impairment. However, the cost model does not reflect the true economic value of the group’s property, plant and equipment and the basis on which our tariff is calculated by NERSA. Therefore, a summary has been provided below reflecting what the impact on the financial statements would be if the group’s property, plant and equipment was measured using the depreciated replacement cost (DRC) model. Borrowing costs were not included in the carrying amount of property, plant and equipment when determining the increase or decrease in the revaluation surplus and have therefore been expensed. The fair values determined using the DRC model were reviewed for possible impairment loss in order to determine whether or not the net future cash inflows related to the use of property, plant and equipment are less than the calculated fair value of property, plant and equipment. The fair values disclosed below are net of the adjustment made for the tariff shortfall in the first few years of R310 billion (2015: R206 billion). This shortfall is expected to be eliminated once the electricity price determined in terms of the regulatory methodology, which is based on the depreciated replacement values, is fully phased in by NERSA.
2016 2015
Historicalcost
Adjustments After revaluation
Historicalcost
Adjustments After revaluation
Rm Rm Rm Rm Rm Rm
Summarised group statements of financial position at 31 March 2016AssetsProperty, plant and equipment 518 036 71 140 589 176 455 977 181 551 637 528 Other assets 142 649 – 142 649 101 968 – 101 968
660 685 71 140 731 825 557 945 181 551 739 496
Equity and liabilitiesTotal equity 180 563 51 221 231 784 117 164 130 717 247 881 Deferred tax liabilities 21 000 19 919 40 919 18 154 50 834 68 988 Other liabilities 459 122 – 459 122 422 627 – 422 627
660 685 71 140 731 825 557 945 181 551 739 496
Summarised group income statements for the year ended 31 March 2016Profit before depreciation and amortisation expense, net impairment loss and other expenses 51 345 – 51 345 39 991 – 39 991 Depreciation and amortisation expense (16 531) (2 965) (19 496) (14 115) (10 119) (24 234)Net impairment loss (1 170) 787 ( 383) (3 766) 1 149 (2 617)Other expenses (18 663) ( 134) (18 797) (15 771) ( 102) (15 873)
Profit/(loss) before net finance cost 14 981 (2 312) 12 669 6 339 (9 072) (2 733)Net finance cost (7 919) (19 426) (27 345) (6 109) (17 389) (23 498)Share of profit of equity-accounted investees, net of tax 43 – 43 49 – 49
Profit/(loss) before tax 7 105 (21 738) (14 633) 279 (26 461) (26 182)Income tax (2 488) 6 087 3 599 ( 37) 7 409 7 372
Profit/(loss) for the year from continuing operations 4 617 (15 651) (11 034) 242 (19 052) (18 810)Profit for the year from discontinued operations – – – ( 42) – ( 42)
Profit/(loss) for the year 4 617 (15 651) (11 034) 200 (19 052) (18 852)
Summarised group statements of comprehensive income for the year ended 31 March 2016Profit/(loss) for the year 4 617 (15 651) (11 034) 200 (19 052) (18 852)Other comprehensive income/(loss) 6 508 (63 844) (57 336) (1 155) 31 086 29 931
Revaluation reserve (reversed)/raised – (88 672) (88 672) – 43 175 43 175 Other items of other comprehensive income/(loss) 9 030 – 9 030 (1 613) – (1 613)Income tax thereon (2 522) 24 828 22 306 458 (12 089) (11 631)
Total comprehensive income/(loss) for the year 11 125 (79 495) (68 370) ( 955) 12 034 11 079

Annual Financial Statements | 31 March 2016 107
Accounting and other financial terms
CVA Credit Value AdjustmentDRC Depreciated Replacement CostDVA Debit Value AdjustmentEBITDA Earnings Before Interest, Tax, Depreciation and AmortisationFFO Free Funds From OperationsFIFO First-In-First-OutIAS International Accounting Standard/(s)IFRIC International Financial Reporting Interpretations CommitteeIFRS International Financial Reporting Standard/(s)ISA International Standards of AuditingLIFO Last-In-First-OutPPI Producer Price IndexR RandRm Rand millionsSIC Standing Interpretations Committee of the International Accounting
Standards CommitteeVAT Value Added Tax
Currencies
AUD Australian DollarCAD Canadian DollarCHF Swiss FrancEUR EuroGBP Pound Sterling (United Kingdom)JPY Japanese YenNOK Norwegian KroneSEK Swedish KronaUSD United States DollarZAR South African Rand
Entities
company Eskom Holdings SOC LtdEEM Eskom Energie Manantali s.aEFC Eskom Finance Company SOC LtdEPPF Eskom Pension and Provident FundEscap Escap SOC LtdEskom Eskom Holdings SOC LtdEskom Enterprises Eskom Enterprises SOC LtdEskom Uganda Eskom Uganda Ltdgroup Eskom Holdings SOC Ltd and its subsidiariesMotraco Mozambique Transmission Company SARLNqaba Nqaba Finance 1 (RF) LtdPBMR Pebble Bed Modular Reactor SOC LtdUEGCL Uganda Electricity Generation Company LtdUETCL Uganda Electricity Transmission Company LtdUitesco Uitenhage Electricity Supply Company (Pty) Ltd
Legislation
Companies Act Companies Act, No.71 of 2008NEMA National Environmental Management Act, No. 107 of 1998PAA Public Audit Act, No. 25 of 2004PFA Pension Funds Act, No 24 of 1956PFMA Public Finance Management Act, No. 1 of 1999PPPFA Preferential Procurement Policy Framework Act, No. 5 of 2000
Appendix – Acronyms and abbreviations
Measures
GWh Gigawatt hourkg Kilogramkm KilometrekVA kilovolt-ampere kWh Kilowatt hourkWhSO Kilowatt hour Sent OutL LitreMt Million tonsMVA Mega volt ampereMW MegawattMWh Megawatt hourMWhSO Megawatt hour Sent Out
Other
Alco Asset and Liability CommitteeB-BBEE Broad-Based Black Economic EmpowermentBNP Banque Nationale de ParisBoard Board of directorsBPP Business Productivity ProgrammeCA(SA) Chartered Accountant of South AfricaCIDB Construction Industry Development BoardDEA Department of Environmental AffairsDPE Department of Public EnterprisesDTC Design-to-costDWA Department of Water AffairsEAF Energy Availability FactorExco Executive Management CommitteeIDM Integrated Demand ManagementIPP Independent Power ProducerIRP Integrated resource planISO International Standards OrganisationJSE Johannesburg Stock ExchangeKing III King Code of Governance Principles and the King Report of GovernanceKPI Key Performance IndicatorLTIR Lost Time Injury RateMoU Memorandum of Understanding MYPD Multi-Year Price DeterminationNCD Negotiable Certificates of DepositNERSA National Energy Regulator of South AfricaOCGT Open Cycle Gas TurbineRCA Regulatory Clearing AccountSAIDI System Average Interruption Duration IndexSARB South African Reserve BankSARS South African Revenue ServicesTASK Tunes Assessment of Skills and KnowledgeTMPS Total measured procurement spend UCLF Unplanned Capability Loss Factor
Eskom Holdings SOC Ltd108
Appendix – Acronyms and abbreviations (continued)
Contact details
111 3
Telephone numbers Websites and email addresses
Eskom head office +27 11 800 8111 Eskom website www.eskom.co.za [email protected]
Eskom Media Desk +27 11 800 3304+27 11 800 3309+27 11 800 3343 +27 11 800 3378+27 82 805 7278
Eskom Media Desk [email protected]
Investor Relations +27 11 800 2775 Investor Relations [email protected]
Eskom Corporate Affairs +27 11 800 2323 Eskom integrated results www.eskom.co.za/IR2016
Toll-free Crime Line 0800 112 722 Feedback on our report [email protected]
Eskom Development Foundation +27 11 800 6128 Eskom Development Foundation www.eskom.co.za/[email protected]
Ethics Office Advisory Service +27 11 800 2791 +27 11 800 3187 +27 11 800 3189
Ethics Office Advisory Service [email protected]
National Sharecall number 08600 ESKOM or 08600 37566
Promotion of Access to Information Act [email protected]
Customer SMS line 35328 Integrated demand management and energy advice
CS (customer service) mobile Dial *120*6937566# or *120*myeskom#
Customer Service [email protected]
MyEskom mobi-site www.myeskom.co.za MyEskom app
EskomSouthAfrica Twitter Eskom_SA
Physical address Postal address
Eskom Megawatt Park 2 Maxwell Drive Sunninghill Sandton 2157
PO Box 1091 Johannesburg 2000
Company Secretary Company registration number
Ms Suzanne DanielsEskom Holdings SecretariatPO Box 1091Johannesburg2000
Eskom Holdings SOC Ltd2002/015527/30