Embed Size (px)
Citation preview
45
Details of fish markets, respondents engaged in marketing,
marketing and capture fishing as well as marketing and culture fishing
activities from Choryasi taluka and Surat city are discussed here.
Additionally results of statistical and microbiological analyses are also
presented.
3.1 Fish Markets' Details
In Choryasi taluka of Surat district and Surat city, fishes were sold
through wholesale and retail markets. Vendors also played role in fish
marketing. New trend in selling of live Indian major carps was also
observed from the study area.
3.1.1 Wholesale Fish Market
The only wholesale fish market located at Nanpura area of Surat
city (Plate-I, Figs. 1-3) was studied. The market was constructed in 1950
by Surat municipal corporation (SMC). Total 68 traders were enrolled
and allotted fixed place by SMC for fish trading from 6:00 a.m. to
10:00 a.m. The market was dominated by women wholesalers.
Trucks loaded with fishes were brought to fish market early in the
morning without cooling facility. Fishes sold in the wholesale market
were brought from villages of Choryasi taluka (Bhimpore, Dumas,
Hazira, Magdalla, Kavas and Ichchhapore), outside Surat city (Porbandar,
46
Veraval, Jamnagar, Junagadh, Jakhao and Golai) and other states of
Maharashtra, Andhra Pradesh and Kerala by road and railways.
Approximately 40 ton fishes were marketed daily by wholesalers of
Nanpura fish market. Dead fishes were packed in thermocol boxes with
ice while live fishes were brought to the market in drums. Fishes were
sorted according to the species and size and sold in the market.
Fish distribution was at local and district level. Traders of Nanpura
wholesale fish market sold their fishes to retailers of various local fish
markets (Nanpura, Golwad, Navsaribajar, Saiyadpura, Dilligate, Rander,
Bhimpore, Dumas, Suvali and Hazira), fish markets of Valsad and
Navsari, retail outlets, vendors, also to hotels and restaurants of Surat
district.
Variety of freshwater fishes such as Catla sp. (catla), Labeo sp.
(rohu), Cirrhinus sp. (mrigal), Pangasius sp. (pangas), Oxygaster sp.
(chaliya), Mystus sp. (singala) and Macrobrachium sp. (sondhiya) were
found to be sold in the market. Among marine water fishes viz., Dasyatis
sp. (patara), Atropus sp. (bangda), Stromateus sp. (paplet), Harpodon sp.
(bumla), Parastromateus sp. (halwa), Polynemus sp. (rawas, cheriyu,
dara), Muraenesox sp. (vam), Protonibea sp. (ghol), Scylla sp. (karachla)
and Penaeus sp. (zinga) were commonly sold in Nanpura wholesale fish
market.
47
From these fishes, freshwater fishes Catla sp., Labeo sp.,
Cirrhinus sp. and marine water Stromateus sp., Parastromateus sp. and
Muraenesox sp. were brought from other states. Only Clarius sp. (magur)
was found to be sold in live condition and fetched better price.
Commonly available fishes in the wholesale market are shown in Plates
II, III (Figs.1 & 3), IV and V (Figs.2 & 3).
The wholesale market was centrally located in Surat city. There
was no proper building for marketing, the selling of fish was on the road
without facility of electricity, water, drainage, storage room and proper
flooring. Small platform was constructed in the market but wholesalers
did not use for fish selling. There was no lavatory and washing facilities.
Hygienic conditions were very poor. Fishes were piledup on the floor
(Plate-VI, Fig.1). Most of the fish merchants did not use ice or any
chilling facilities while very few of them used meagre amount of crushed
ice during selling the fishes (Plate-VI, Fig.2). As a result, fishes tend to
deteriorate the quality and traders sold at lower price. Some traders were
found to pack the unsold fishes in thermocol boxes with ice for the next
day sale (Plate-VI, Fig.3).
Fish auction was not observed in Choryasi taluka and Surat city.
Price was fixed by wholesalers of Nanpura fish market. Fishes brought
from Andhra Pradesh and other states fetched higher price compared to
the local one due to quality and demand. Wholesalers earned commission
48
from traders who sent their fishes from different parts of India to Nanpura
wholesale fish market. They also got profit by selling fishes to retailers.
State fisheries Department issued the license to all registered
traders who paid Rs.1000/annum to the license issuing authority. The
Surat municipal corporation authority was found to check the fish quality
periodically and collect the revenue from the traders at the rate of
Rs.5/10 kg weight of fishes. SMC provided a container for collection of
spoilt fishes and waste of fish selling. Moreover, the market premise was
washed everyday by the SMC mobile unit.
The National Fisheries Development Board (NFDB), Hyderabad
had allotted a grant of Rs. 1.39 crore to Surat Municipal Corporation in
the year 2011 for the construction of a modern fish market at Nanpura
area of Surat city. There was a need to broaden the roads near the market
to renovate the Nanpura fish market which would have affected the
houses of local people. Residents of the area and wholesalers protested,
SMC planned to shift the market from Nanpura to other place of Surat.
Till date no modern fish market is constructed in the city.
3.1.2 Retail Fish Markets
Total eleven retail fish markets were found to be located at
Choryasi taluka and Surat city. From these Bhimpore, Dumas, Suvali
(Plate-VII, Figs. 1-3), Hazira and Rander (Plate-VIII, Figs.1 & 2) were
49
situated at Choryasi taluka while Katargam (Plate-VIII, Fig.3), Nanpura,
Golwad, Navsaribajar (Plate-IX, Figs.1-3), Saiyadpura and Dilligate
(Plate-X, Figs.1 & 2) were located at Surat city. From these, Navsaribajar
and Saiyadpura fish markets were constructed in 1950 by SMC. Only
Rander market had small platform, remaining other retail markets did not
have any constructed area. Fishes were sold in retail markets from
8:00 a.m. to 11:00 a.m. in the morning and 5:00 p.m. to 8:00 p.m. in the
evening.
Total 1832 active fisherfolks of Choryasi taluka engaged in
marketing as well as in marketing and capture fishing were registered in
Fisheries Department. On the other hand, there was no record of
registered retailers of Surat city in SMC or Fisheries Department. Men
and women both were involved in marketing but retail fish markets were
dominated by women fish sellers.
Fishes were brought to retail markets from fisherfolks of Choryasi
taluka who were engaged in marketing and capture fishing as well as
from Nanpura wholesale fish market of Surat city. Fishes were
transported by vehicles without any cooling facility. Approximately daily
25 ton fishes were marketed by retailers. Dead fishes were packed in
thermocol box, bamboo baskets and aluminum vessels while live fishes
were carried to the market in drums. Fish distribution was carried out at
local and state level. Retailers of Choryasi taluka and Surat city sold their
50
fishes to consumers and vendors except the retailers of Katargam fish
market. They sold their fishes to traders of Kolkata. Prominent role of
middlemen was observed in Rander village. Moreover, retailers of
Variav, Bhimpore and Dumas also sold their fishes to middlemen who
supplied the fishes to Rander market and fetched more profit.
Variety of freshwater fishes like Catla sp. (catla), Labeo sp. (rohu),
Cirrhinus sp. (mrigal), Pangasius sp. (pangas), Oxygaster sp. (chaliya),
Mystus sp. (singala), Wallago sp. (padhin), Heteropneustes sp. (singhi)
and Macrobrachium sp. (sondhiya) were found to be sold in the market.
Estuarine fishes viz., Mugil sp. (boyee) and Hilsa sp. (palwa) were sold.
Among marine water fishes viz., Dasyatis sp. (patara), Stromateus sp.
(paplet), Harpodon sp. (bumla), Parastromateus sp. (halwa), Muraenesox
sp. (vam), Protonibea sp. (ghol), Polynemus sp. (rawas, cheriyu, dara),
Scoliodon sp. (magru), Tenualosa sp. (modar), Sardinella sp. (kati),
Scylla sp. (karachla) and Penaus sp. (zinga) were sold in retail markets of
Choryasi taluka. Freshwater fish Clarius sp. (magur) and brackish water
fish Boleophthalmus sp. (levta) were sold in live condition (Plate-II, Fig.3
and Plate-III, Fig.2) while Harpodon sp. (bumla) was sold in dried form
(Plate-V, Fig.1). Common fishes of retail markets are shown in Plates II-
IV (Figs.2 & 3) and V.
Infrastructure of retail fish markets was very poor. Proper building
and flooring, facility of electricity, water drainage and storage room were
51
not seen in any of the market. Platform was constructed only in
Navsaribajar, Saiyadpura and Rander fish markets. There was no lavatory
and washing facilities. Hygienic conditions were very poor (Plate-VII,
Figs.2-3 and Plate-X, Fig.3). Retailers sold their fishes on the roadside
without maintaining the quality of fish. There was no Government
organised shop or outlet found from the study area.
SMC authority provided space only to the retailers of Surat city for
fish marketing. The SMC authority was found to check the fish quality
periodically and collect the revenue from the retailers at the rate of
Rs.5/10kg weight of fishes. SMC also provided containers near markets
of Surat city whereas Gram Panchayat provided containers to markets of
Choryasi taluka for collection of spoilt fishes and waste of fish.
Government did not play any role in fixation of price. It was fixed
by the retailers and varied from species, size, season and quality of fish.
Due to intermediary’s role, producers and consumers suffered for better
revenue.
3.1.3 Marketing Through Vendors
Fish marketing through vendors was not common in study area.
Door to door fish selling by women vendors were seen in Damka, Vasva
and Junagam villages of Choryasi taluka. Approximately ten vendors
were involved in fish vending from 9:00 a.m. to 12:00 noon. Each vendor
52
dealt with approximately less than 10 kg of fishes. Vendors sold variety
of fishes such as Catla sp. (catla), Labeo sp. (rohu), Cirrhinus sp.
(mrigal), Macrobrachium sp. (sondhiya) and marine fishes such as
Stromateus sp. (paplet), Harpodon sp. (bumla) etc. They carried the
fishes in bamboo baskets or aluminum containers without any
preservation facility.
3.1.4 Special Observations
A new trend in marketing of live Indian major carps in
Katargam fish market of Choryasi taluka was observed from the study
area during 5:00 p.m. to 8:00 p.m. (Plate-XI, Fig.1). Live fishes were
brought from culture farm of Magdalla, Kavas and Ichchhapore villages
to Katargam retail fish market. Though Olpad is not included in study
area but it is worth to mention that here also live fish marketing was
observed (Plate-XI, Figs.2-3 & Plate-XII, Fig.1). Fishes were brought
from farms to Olpad taluka.
Approximately 80 kg live fishes were marketed daily by retailers.
Live fishes Catla sp., Labeo sp. and Cirrhinus sp. were carried in
oxygenated tank (Plate-XII, Fig.2). Retailers used aerator (Plate-XI,
Fig.1) and oxygenated tank for selling fishes (Plate-XII, Fig.3). Retailers
of Katargam and Olpad fish market sold live fishes to local consumers.
Dead fishes were sold at the rate of Rs. 100/Kg whereas live fishes cost
53
was Rs. 200/Kg thus retailers fetched double price through selling of live
fish. Elite class consumers preferred to pay higher price for live and
quality fishes.
3.2 Respondents' Details
All the members engaged in marketing are described as
respondents. Form the present data, respondents from Choryasi taluka
(Rander, Varivav, Magdalla, Umra, Kavas, Gabheni, Budia, Bhimpore,
Dumas, Damka, Vasva, Suvali, Junagam, Hazira, Vanz, Karadva,
Ichchhapore and Abhva and Surat City (Nanpura, Navsaribajar, Golwad,
Saiyadpura and Dilligate) were classified in two categories viz.,
respondents of category I and respondents of category II. Under these
categories, related information on socio-economic and professional status
were analysed.
3.2.1 Respondents of Category I
This category included the respondents engaged in marketing as
well as marketing and capture fishing having large number of samples.
From Choryasi taluka, there was no respondent involved in wholesale
marketing whereas 1832 respondents in retail marketing were registered
in Government Fisheries Department and 183 (10%) respondents were
interviewed. 68 respondents from Surat city were registered in Fisheries
54
Department and SMC for wholesale marketing. 41 respondents (60%)
were interviewed. No registration was made at any organization for retail
marketing from Surat city. However approximately 60 nonregistered
retailers were observed during the study and 36 (60%) were interviewed.
Thus total 260 respondents were interviewed and analysed under the
respondents of Category I.
Villagewise maximum respondents (21.9%) were observed from
Bhimpore village followed by Dumas (15.4%) for retail marketing from
Choryasi taluka (Plate-XIII, Fig.1). Fishes were captured from inland and
marine water. Small scale fishing and marketing were noted from Rander,
Variav, Magdalla, Umra, Kavas, Gabheni, Budia, Bhimpore, Dumas,
Damka, Vasva, Suvali, Junagam and Hazira villages of Choryasi taluka.
Wholesale and retail markets of Nanpura from Surat city represented
maximum respondents (Plate-XIII, Fig.1). Sexwise, there was not much
difference among the respondents. Males (51.2%) and females (48.8%)
participated in the occupation of fish marketing. Males mainly
contributed in capture fishing while females of same families were
involved in marketing (Plate-XIII, Fig.2). Fishing activities of capture
and marketing were dominated by Machhi community (83.1%) followed
by Halpati (13.5%) and Koli Patel (3.5%) as shown in Plate-XIV, Fig. 1,
the age group of 41-62 year covered the maximum respondents of 51.2%
(Plate-XIV, Fig.2) followed by 22-40 years (38.8%). Only 10% of
55
respondents were found beyond 62 years age groups. The middle age
group of respondents community dominated the occupation.
The level of education of respondents could also be an important
factor in learning and adopting the new technology in fish marketing and
capture fishing. Maximum respondents (33.8%) were found to have
primary education, minimum respondents (0.4%) had education upto
college and beyond while 23.3 % were illiterate (Plate-XV, Fig.1). The
type of house is an indicator for the status of respondents. It was observed
that 49.2% respondents had pakka house while 12.7% had kachha house
(Plate-XV, Fig.2). Body mass index (BMI) is an indicator to show the
health status of respondents. According to Body mass index analysis,
more than 80% respondents had normal weight. 18.5% respondents were
found to be underweight (Plate-XVI, Fig.1). Among gadgets, most
common was television sets used by more than 50% of respondents
followed by the necessary gadget like refrigerator (33.1%). Plate-XVI,
Fig.2 shows that though the mobile phone is very widely used but only
5.4% of respondents used the mobile phones. In terms of mobility, it was
found that 62.3% of respondents' families owned two wheelers. Nearly
26.5% of respondents' families did not have any vehicle (Plate-XVII,
Fig.1).
Economic status of respondents engaged in marketing as well as
marketing and capture fishing is depicted through Plate-XVII-XVIII.
56
Plate -XVII, Fig.2 shows the overall picture of income of respondents
indicating 53.1% of respondents had income between Rs. 2,000-20,000
followed by 31.2% respondents in income group of Rs. 20,001-40,000.
These respondents belonged to villages of Choryasi taluka (rural area)
and Surat city the urban area which have different measures of income to
check the poverty line. Applying the criteria, analysis was made
separately for both groups. 36.6% of respondents from the village of
Choryasi taluka of Surat district were found below poverty line (BPL)
and 63.4% of respondents were above poverty line (APL). On the other
hand, 100% respondents of Surat city were APL (Plate-XVIII, Fig.1).
Plate-XVIII, Fig.2 shows that 16.3% of respondents gained
handsome profit from fish sale whereas 33.7% of respondents got
marginal profit and continued the business as traditional occupation.
Respondents of this category were analysed for their role only in
marketing as well as marketing and capture fishing activity. 29.6% of
respondents were engaged only in business of fish marketing whereas
larger number of respondents (70.4%) were engaged in marketing and
capture fishing (Plate-XIX, Fig.1). Total 86% of respondents accepted
fishing and marketing as a full time occupation (Plate-XIX, Fig.2).
Findings indicated that majority of respondents (91.8%) had fish
occupational experience for more than ten years (Plate-XX, Fig.1).
Marketing, capture and marketing of fish was the traditional business of
57
82.1% respondents and remaining 17.9% opted the profession for earning
money (Plate-XX, Fig.2).
Fishes sold in the market included freshwater, estuarine and marine
contributing 42.5% shell fish consisted mainly prawn and crab had higher
contribution than the fin fish (Plate-XXI, Fig.1). Quantity of fish sold by
the respondents in the markets varied. Plate-XXI, Fig.2 shows that 76.4%
respondents dealt with the weight of less than 5 kg for selling whereas
more than 20 kg fishes were handled by 23% of respondents. During field
study it was observed that 38.3% respondents used ice boxes for
preservation of fishes while 61.7% respondents did not use any freezing
facilities (Plate-XXII, Fig.1). Plate-XXII, Fig.2 depicts that 41.8% of
respondents sold their catch directly to local people and consumers.
27.2% respondents sold their catch to fish markets and 16.6%
respondents dealt with retailers. Middlemen shared the catch of 10.1%.
Minimum respondents (0.4%) sold their fishes to private agency. The
survey results revealed that the majority of respondents (78.2%) did not
respond to problems in occupation of marketing, capture fishing and
marketing. 15.8% respondents expressed that there was less catch and
insufficient availability of fish for sale. Only 5.4% respondents expressed
problem of preservation and transportation (Plate-XXIII, Fig.1).
58
3.2.2 Respondents of Category II
This category included eight respondents from Choryasi taluka
(Magdalla, Vanz, Karadva, Budia, Kavas, Ichchhapore and Abhva)
having occupation of marketing and culture fishing activity. Every village
had one farmer except kavas with two farmers. All eight farmers
registered in State Fisheries Department were selected for case study.
All the respondents of this category were male and marketed their
own cultured animals. Occupation was dominated by Koli Patel
community. Six of the respondents belonged to age group of 35-41 years.
One trader was very young of 27 year from Ichchhapore and other one
had higher age of 55 years from Karadva. Respondents from Magdalla
and Kavas were found to have education upto collage level while one
respondent from Abhva was postgraduated in the subject of Aquatic
Biology. Respondents of Vanz, Budia, Ichchhapore and Karadva had
education upto higher secondary. All the respondents had pakka houses
with all modern gadgets. 60% respondents owned two wheeler vehicles.
The remaining 40% respondents from Magdalla and Abhva had the four
wheelers.
Out of total eight farmers, seven were engaged in fresh water
culture fishing activity and one was associated in brackish water shrimp
farming. Each member of category II adopted the fishing activity and
59
marketing as a source of income and none had this occupation as
traditional.
Seven respondents had freshwater culture. Five ponds were from
Vanz, Budia, Ichchhapore Karadva, and Magdalla having size of 1-6 ha
(Plate-XXIV, Figs.1 & 2) Two ponds were from Kavas with the size of 1
ha. Villages of Magdalla and Budia had private ponds. Respondents of
other villages had ponds on lease for ten years from State Fisheries
Department. All ponds were perennial. Respondents of Magdalla, Vanz,
Karadva and Budia stocked their ponds with major carps. While
respondents of Kavas and Ichchhapore adopted composite fish culture
technique and stocked their ponds with major carps (Catla sp., Labeo sp.,
Cirrhinus sp.), grass carp (Ctenopharyngodon sp.) and fresh water prawn
(Macrobrachium sp.) for obtaining better production and economic gain.
Fresh water was drawn to the ponds through canal. Stocking density of
seed varied from 5,000-20,000 fingerlings/ha and 25,000-30,000 post
larvae of Macrobrachium sp./ha. The highest stocking density was in
Magdalla pond with 20,000 fingerlings/ha. In composite fish culture, the
highest stocking density was in Kavas with 5,000 fingerlings/ha and
30,000 post larvae/ha. Only respondents of Kavas and Ichchhapore fed
their fishes with supplementary feed (rice bran). Respondents did not
have farming training from any organization except the respondent of
Karadva village. Respondents of Karadva and Budia villages harvested
60
their crops thrice a year through retailers of Katargam and private parties.
Ponds of Kavas and Ichchhapore were stocked with Indian major carps,
grass carp and prawns were harvested twice a year and sold to outlet of
Hazira market from Ichchhapore while respondents of Magdalla and
Vanz villages harvested their crops once a year (Plate-XXIV, Fig.3).
Respondent of Magdalla harvested maximum quantity (3,000 kg/year),
from freshwater culture fishery followed by Kavas and
Ichchhapore (2,000 kg/year), Karadva (1,500 kg/year), Vanz and Budia
(1,000 kg/year).
New trend in marketing of live Indian major carps were observed
in Choryasi taluka. Respondents of Magdalla and Vanz sold their fishes
in live condition to retailers of Katargam fish market (Plate-XXV, Figs.1
& 2). The fishes were sold partly in live condition to consumers and bulk
was sent to Kolkata city. Respondents of Kavas sold their live fin fishes
to retailers of Katargam fish market and dead shell fishes to Nanpura
wholesale or local markets of Choryasi taluka. The earning from the
culture was Rs.50,000/year in Budia village. Respondents of Magdalla,
Vanz, Karadva, Kavas and Ichchhapore earned more money in the range
of Rs.1,00,000-2,00,000/year.
Only one respondent from Abhva village was engaged in brackish
water shrimp farming activity. He had twenty ponds having size of 0.8 ha
(Plate-XXV, Fig.3). Land was on lease from the State Fisheries
61
Department for ten years. Water from creek of Arabian Sea was drawn
into the ponds for stocking of Penaeus monodon (Tiger shrimp) at
1,00,000/ha density. The respondent was well aware of changing trends
in shrimp farming and followed all the steps of pond management
practice including pond preparation, water quality management, seed
stocking, feeding, aeration, disease control, biosecurity (Plate-XXVI,
Fig.1) etc. till harvesting. Culture period of shrimp was 180 days and
ponds were used for two crops/year. There was one technical assistant
and other staff for maintaining the culture farm. Technical assistant
monitored farm conditions at all levels including purchase of quality
hatchery seeds, fertilizer application, feed and feeding, soil, water quality
and disease management. The crop production of shrimp was reported of
about 80,000 kg/year.
During the crop harvestation (Plate-XXVI, Fig.2) every care was
taken to maintain the quality of shrimp. Ample amount of good quality
ice was used for chilled killing and proper preservation (Plate-XXVI,
Fig.3 and Plate-XXVII, Figs.1 & 2). The harvested shrimps (Plate-
XXVII, Fig.3) were marketed to West Coast frozen food Pvt. Ltd. at
Olpad and Shri Dutt aquaculture Pvt. Ltd. at Bilimora where shrimps
were processed and exported to Europe, Japan, Russia and South Africa.
62
3.3 Statistical Analyses
In order to find the influence of one parameter on others, statistical
analyses were applied in the assumption. ANOVA test, Post hoc test and
Independent sample test were applied in the hypothesis for variables viz.,
income level, Body mass index (BMI), experience, Part or Full time
involved in fishing business, education, age, gender and type of
occupation.
3.3.1 ANOVA between Income and Body Mass Index (BMI)
Hypothesis were,
Ho: Models does not exist
H1: Model exist
Table 3.1 indicates that p-value was less than 0.05, so null
hypothesis was rejected at 5% level of significance which means that
model exist.
3.3.2 Coefficient between Income and Body Mass Index (BMI)
Ho: There is no significant influence of income level on Body
Mass Index (BMI)
H1: There is significant influence of income level on Body Mass
Index (BMI)
63
Table 3.2 indicates that coefficient of income was significant as
P value was 0.001 (<0.05) which means that income of respondent
affected the BMI.
3.3.3 ANOVA between Experience and Income Level
Hypothesis were,
Ho: There is no significant influence of experience on income level
H1: There is significant influence of experience on income level
Table 3.3 shows that P value of ANOVA test for influence of
experience on income level was greater than 0.05 (0.311), so null
hypothesis was rejected which means there was no significant influence
of experience on income level.
3.3.4 ANOVA between Part/Full time Fishing Occupation and
Income Level
Hypothesis were,
Ho: There is no significant influence of part/full time fishing
occupation on income level
H1: There is significant influence of part/full time fishing
occupation on income level
It can be seen from Table 3.4 that P value was greater than 0.05
(0.154), so we failed to reject null hypothesis which means there was no
significant influence of part/full time involved in fishing occupation on
income level.
64
3.3.5 ANOVA between Education and Income Level
Hypothesis were,
Ho: There is no significant influence of education and income level
H1: There is significant influence of education and income level
Table 3.5 indicates that P value was 0.000 which was less than 0.05
which means that we reject null hypothesis and there was significant
influence of education on income level (Plate-XXVIII, Fig.1).
3.3.6 ANOVA between Age and Income Level
Hypothesis were,
Ho: There is no significant influence of age on income level
H1: There is significant influence of age on income level
Table 3.6 shows that P value was 0.01 which was less than 0.05 so,
null hypothesis was rejected which means there was significant influence
of age on income level with the increase in age, income level also
increases (Plate-XXVIII, Fig.2).
3.3.7 Post Hoc Tests between Age and Income Level
Tukey’s test:
Ho: There is no significant influence of age on income level
H1: There is significant influence of age on income level
Table 3.7 shows that P value of age group 22-40 and 61-90 was
0.013 which was less than 0.05 so, null hypothesis was rejected. There
65
was significant difference in the income level of respondents in the age
group of 22-40 and 61-90.
Scheffe Test:
Ho: There is no significant influence of age on income level
H1: There is significant influence of age on income level
Table 3.7 shown that P value of age group 22-40 and 61-90 was
0.018 which was less than 0.05 so, null hypothesis was rejected. There
was significant difference in the income level of respondents in the age
group of 22-40 and 61-90.
3.3.8 Independent Sample Tests between Gender and Income Level
Hypothesis were,
Ho: There is no significant influence of gender on income level
H1: There is significant influence of gender on income level
It is seen from Table 3.8 that P value was 0.018(>0.05), so null
hypothesis was rejected which means that there was no significant
influence of gender on income level.
3.3.9 Independent Sample Tests between Type of Occupation and
Income Level
Hypothesis were,
Ho: There is no significant influence of type of occupation and
income level
66
H1: There is significant influence of type of occupation and income
level
Table 3.9 indicates that P value was 0.000 (>0.01), so null
hypothesis was rejected which means that there was significant influence
of type of occupation on income level. From the mean rank (Table 3.9) it
may be interpreted that mean income level of marketing respondents was
more than marketing and capture fishing respondents.
3.4 Microbiological analyses
Fifty four fish samples of eighteen species and replicates of each
from different freshwater, estuarine and marine fishes from one
wholesale, four retail markets, one vendor and one culture farm were
analysed to check the quality of fishes.
3.4.1 Total Viable Count (TVC)
The results of total bacterial count in fish samples expressed in
colony forming unit per gram (CFU/g) are shown in Table 3.10. Colonies
were observed in plate ranged from 10-2
-10-4
dilution factor (Plate-XXIX,
Figs.1-3).
Results showed highest bacterial count (137.5×10⁵
CFU/g and
95.3×10⁵
CFU/g) in fresh samples of Mugil parsia and Stromateus
cinereus marine fish samples of Dumas retail fish market followed by
67
fishes from Hazira market. Nanpura wholesale market showed higher
bacterial count (69.5×10⁵
CFU/g) from marine fresh fish samples whereas
fresh samples of Nanpura retail market showed bacterial count (46.3×10⁵
CFU/g). Dried samples of marine fish (Polynemus sp.) showed very high
bacterial count (99.8×10⁵
CFU/g). Fresh fish samples collected from
vendors of Gabheni village showed less or no bacterial count (28.5×10⁵
CFU/g) compared to other fish markets of Choryasi taluka and Surat city.
The minimum bacterial counts (0.95×10⁵
CFU/) from shrimp of culture
farm of Abhva village was noted. No bacterial growth was observed from
Katargam retail market.
Habitatwise, fifteen fresh water fish samples of Catla catla and
Labeo rohita from different wholesale and retail markets were found
completely free from the bacterial growth while twenty four samples of
seven marine species crossed the permissible limit (5×10⁵
CFU/g)
showing very high bacterial count.
3.4.2 Gram Staining and Biochemical Test
The results of qualitative analysis are shown in Table 3.10. Out of
total fifty four fish samples, Escherichia coli was found in twenty one
fish samples collected from Nanpura wholesale and retail markets of
Nanpura, Dumas and Hazira. Escherichia coli was also observed from
fish samples (Stromateus cinereus) collected from vendors of Gabheni
68
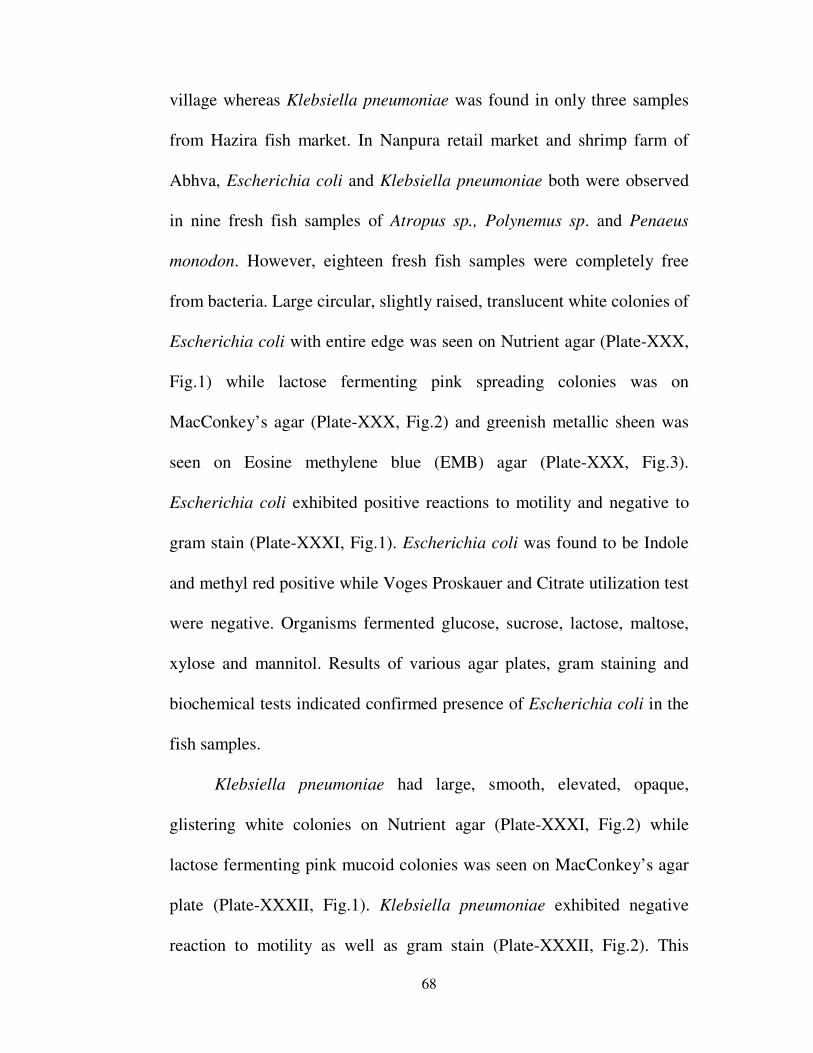
village whereas Klebsiella pneumoniae was found in only three samples
from Hazira fish market. In Nanpura retail market and shrimp farm of
Abhva, Escherichia coli and Klebsiella pneumoniae both were observed
in nine fresh fish samples of Atropus sp., Polynemus sp. and Penaeus
monodon. However, eighteen fresh fish samples were completely free
from bacteria. Large circular, slightly raised, translucent white colonies of
Escherichia coli with entire edge was seen on Nutrient agar (Plate-XXX,
Fig.1) while lactose fermenting pink spreading colonies was on
MacConkey’s agar (Plate-XXX, Fig.2) and greenish metallic sheen was
seen on Eosine methylene blue (EMB) agar (Plate-XXX, Fig.3).
Escherichia coli exhibited positive reactions to motility and negative to
gram stain (Plate-XXXI, Fig.1). Escherichia coli was found to be Indole
and methyl red positive while Voges Proskauer and Citrate utilization test
were negative. Organisms fermented glucose, sucrose, lactose, maltose,
xylose and mannitol. Results of various agar plates, gram staining and
biochemical tests indicated confirmed presence of Escherichia coli in the
fish samples.
Klebsiella pneumoniae had large, smooth, elevated, opaque,
glistering white colonies on Nutrient agar (Plate-XXXI, Fig.2) while
lactose fermenting pink mucoid colonies was seen on MacConkey’s agar
plate (Plate-XXXII, Fig.1). Klebsiella pneumoniae exhibited negative
reaction to motility as well as gram stain (Plate-XXXII, Fig.2). This
69
organism was found to be Voges Proskauer, Citrate utilization and weak
urease positive. Organisms fermented glucose, sucrose, lactose, maltose,
xylose and mannitol. Results of various agar plates, gram staining and
biochemical tests indicated confirmed presence of Klebsiella pneumoniae
in the fish samples.


![NULV[ ChZT Z;},[ VSZD€¦ · D]bT;Z TJFlZB J CF,FT[ lh\NULV[ ChZT Z;},[ VSZD s;Pf o ,[BS o X[B DMCdDN C;G GHOL D]HTCLNsD]\A.f : E-PUBLISHER : D]N=So VDZ l5|8ZL4 #&P .;,FD5]ZF D]\A.v$](https://img.pdfslide.us/doc/110x75/5f80fbfe3f52a17d9705806d/nulv-chzt-z-vszd-dbtz-tjflzb-j-cfft-lhnulv-chzt-z-vszd-spf-o-bs.jpg)