Embed Size (px)
Citation preview

Chapter 3Section 3.02
Chap
ter 3
• VF
M S
ectio
n 3.
02
130
Ministry of Health and Long-Term Care
Cancer Treatment Services
1.0 Summary
Cancer is a group of more than 200 different dis-eases characterized by the uncontrolled spread of abnormal cells in the body. Overall, 63% of Ontar-ians diagnosed with cancer currently survive the first five years after diagnosis, compared with just half in the 1970s.
However, cancer is also the leading cause of death in this province, with more than 29,000 Ontarians estimated to have died of cancer in 2016, accounting for 30% of all deaths in the province that year. An estimated 86,000 new cancer cases were diagnosed in Ontario in 2016.
The Ministry of Health and Long-Term Care (Ministry) has overall responsibility for cancer (or oncological) care in the province, and Cancer Care Ontario (CCO) is the provincial agency responsible under the Ministry for funding hospitals, collecting cancer data, developing clinical standards and plan-ning cancer services to meet patient needs.
About 100 Ontario hospitals deliver cancer-treatment services across the province’s 14 Local Health Integration Networks (LHINs), and 14 of these hospitals are designated as regional cancer centres, meaning they can deliver the most complex cancer treatments.
In 2015/16, CCO and the Ministry spent a combined total of about $1.6 billion to treat cancer,
most of it for hospital procedures and treatment drugs. The Ministry also provides additional fund-ing to hospitals through hospitals’ global budgets to support some cancer surgeries, expand the capacity of radiation services, and cover the cost of cancer drugs administered in hospitals.
The three main treatments for cancer are surgery to remove cancerous tissue, and radiation and drug therapy (such as chemotherapy) to kill or shrink cancerous cells. A patient can receive one or more of these treatments.
Stem cell transplant is another, more specialized treatment in which healthy bone-marrow cells are transplanted into the patient to aid the growth of healthy new blood cells. Supportive services for cancer patients include symptom management and psychosocial cancer services.
Cancer can be diagnosed through procedures such as computerized tomography (CT) scans, which use x-rays; magnetic resonance imaging (MRIs), which use magnetic fields and pulses of radio waves; positron emission tomography (PET) scans, which use radioactive tracers; and biopsies, in which tissue samples are extracted for analysis.
The Cancer Quality Council of Ontario, a quasi-independent body that monitors and reports on the province’s cancer-system performance, says Ontario has lower mortality rates than the rest of Canada for colorectal, lung and female breast cancers. Statistics Canada says the five-year survival rates

131Cancer Treatment Services
Chap
ter 3
• S
ectio
n 3.
02
for prostate, breast, colorectal and lung cancers, the most common types of cancer in Ontario, are higher than elsewhere in Canada.
Despite these successes, our audit found that some cancer services are not provided in a timely and equitable manner to meet the needs of Ontar-ians. For example:
• There are significant regional variations in wait times for some urgent cancer surger-ies. Urgent surgeries for 15 out of 17 types of cancer did not meet the 14-day wait-time tar-get. We also noted significant wait-time varia-tions by LHIN. For example, wait times for urgent gynaecological cancer surgery ranged from 12 days at South East LHIN to 74 days at Central West LHIN, compared to the Min-istry’s wait time target of 14 days. In addition, we found that hospitals located near each other had significant wait-time differences. For example, the difference in 90th percentile wait times (after the 10% of patients with the longest wait times are removed) for urgent breast cancer surgeries between two hospitals just 15 kilometres apart was 30 days (14 days at one hospital and 44 at the other).
• Some radiation treatment plans are not reviewed according to clinical guidelines. Review of radiation treatment plans by a second radiation oncologist in the early stages of radiation therapy is a quality-assurance process to ensure patient safety and treatment effectiveness, and to detect any errors before administering significant additional doses of radiation. However, we noted that 13% of curative treatment plans (intended to cure a cancer) were never reviewed, and another 11% were not reviewed within recommended time frames. We also noted that 72% of pallia-tive treatment plans (intended to relieve pain and other symptoms) were never reviewed. CCO informed us that the review of palliative treatment plans is a new initiative and there-fore has not been a priority relative to the review of curative treatment plans.
• Radiation treatment is under-utilized. CCO set a target to use radiation treatment in 48% of cases in Ontario, in keeping with evidence-based international best practices. However, the 2015/16 rate for radiation treatment province-wide was only 39%. CCO indicated that proximity to radiation centres and phys-ician referral behaviours are the main reasons for the low utilization rates. CCO estimates that in 2015/16, about 1,500 more patients could have benefitted from radiation therapy had its target been met.
• Inequities exist in access to take-home cancer drugs. Ontarians who use cancer drugs taken at home are covered through the publicly funded Ontario Drug Benefit Program if they are seniors aged 65 or over, living in homes for special care or long-term care homes, receiving professional home and community care services or receiving social assistance benefits. These patients pay a deductible of about $50 or less per year on average. Although the Province also pays the cost of take-home cancer drugs for patients younger than 65 years old with high drug costs relative to their incomes through the Trillium Drug Program, these patients have to pay a deductible of about 4% of their annual household income. However, patients who do not fit in any of these categories must rely on private insurance (if they have it) or pay for it themselves. In comparison, British Columbia, Alberta, Saskatchewan and Manitoba, which operate different drug funding models than Ontario, cover the costs of all publicly funded cancer drugs for all patients. Cancer patients in these provinces do not have to apply for financial support through a lengthy process similar to the one used in Ontario.
• Supports are inadequate for patients on proper and safe usage of take-home cancer drugs. Patients using take-home cancer drugs should follow special instructions for admin-istration and safe handling of oral cancer

132
Chap
ter 3
• VF
M S
ectio
n 3.
02
drugs. However, it appears that patients were not adequately educated and monitored in the use of their take-home cancer drugs. In addition, these drugs can be dispensed by any pharmacy in Ontario. In comparison, Alberta requires that take-home cancer drugs be dispensed only at designated pharmacies by pharmacists specially trained in cancer drug therapies and dosages.
• No oversight of cancer drug therapy is provided at private specialty clinics. Many private clinics are not regulated or licensed by the Ministry or CCO, so they are not subject to the same level of oversight and standards as hospitals with respect to cancer drug therapy. They are not required, for example, to have an onsite emergency department; nor do they have to employ oncologists or nurses special-ized in oncology to provide cancer services. Ontario’s College of Physicians and Surgeons does not have the authority to inspect or assess the delivery of cancer drug therapy at private specialty clinics.
• Stem cell transplant wait times are long. In 2015/16, actual wait times for autologous transplants (using the patient’s own previ-ously stored stem cells) ranged between 234 days and 359 days, or about 1.5 times longer than CCO’s target wait time, and only about half of these transplants met the wait-time target. Actual wait times for allogenic transplants (using stem cells donated by someone else) were up to 285 days, almost seven times longer than the CCO target, and only 9% of these transplants met the wait-time target.
• There is insufficient capacity for stem cell transplants. Limited capacity for stem cell transplants has been raised as an issue in Ontario since 2009. As a result, Ontario sometimes sends patients to the United States for allogenic stem cell transplants. The aver-age cost in the United States per procedure was $660,000 (all amounts in this report are
in Canadian dollars), or almost five times the $128,000 average in Ontario. From 2015 to 2017, we estimated the costs for out-of-country transplants to be $43 million—or about $34 million more than it would have cost here had the capacity existed. CCO projected that another 106 patients will be sent to the U.S. for transplants, and we estimated these trans-plants would cost around $70 million between July 2017 and the end of 2020/21.
• Symptom-management support is inad-equate. Support services in Ontario were inadequate to help ease patient symptoms and side effects during cancer treatment, and lagged behind those of other jurisdictions, such as Manitoba and the U.S. As a result, many patients visited hospital emergency rooms at least once during their treatment—even though CCO says emergency rooms are inappropriate for most cancer patients.
• Psychosocial cancer services are insuffi-cient and inconsistent. According to the Can-adian Association of Psychosocial Oncology, as many as 40% of cancer patients require help from specialized professionals in addi-tion to their medical treatment. However, we noted that in 2016/17, only 5.8% of patients received consultations with dietitians, and only 6.6% with social workers. More than half of the 14 regional cancer centres did not have a dedicated psychiatrist, occupational ther-apist, psychologist, or physiotherapist on site.
• Ontario is slow to adopt advances in posi-tron emission tomography (PET) scans. Ontario performed fewer PET scans per 1,000 people than elsewhere in Canada or in other countries. PET scans use injected radioactive tracers to create images of cancers. We found that 41% of the province’s PET scan capacity was unused in 2016/17, suggesting that more patients could receive and potentially benefit from PET scans without adding more PET scanners. In addition, Ontario has not updated eligibility criteria or OHIP coverage

133Cancer Treatment Services
Chap
ter 3
• S
ectio
n 3.
02
rules for PET scans since 2013. Ontario has also been slow to adopt new radioactive tracers, which led some Ontarians to seek PET scans using these radioactive tracers out-of-country at an average cost of $8,500 per scan.
• Significant regional variations exist in CT scan and MRI wait times for cancer patients. We reviewed 2016/17 wait-time data for urgent, less urgent and non-urgent CT scans and MRIs and found that only 59% of CT scans and 51% of MRIs for cancer patients were performed within the Ministry’s wait-time targets. We also noted significant wait-time variations among hospitals. For example, cancer patients had to wait up to 49 days for CT scans at one hospital, compared to up to 11 days at another just five kilometres away. Other patients had to wait up to 42 days for MRIs at one hospital, compared to up to 15 days at another just 25 kilometres away.
• Wait times for biopsies are long. Fewer than half (46%) of biopsies performed in hospital operating rooms were done within the Ministry’s targeted wait time of 14 days. The 90th percentile wait time was 78 days, or almost six times longer than the target. This means that 10% of patients wait longer than 78 days and 90% waited some amount of time under 78 days. In particular, biopsies for colorectal cancers had the longest wait times, with the 90th percentile wait time being 125 days, or almost nine times longer than the Ministry target.
• There is no provincial peer review program for diagnostic-imaging results. Review of diagnostic-imaging results by a second radi-ologist has remained inadequate even though misinterpretation of some results in 2013 led to several incorrect diagnoses in Ontario. We noted that 48% of hospitals we surveyed did not perform regularly scheduled reviews of diagnostic images. The Ministry has taken no steps to implement the province-wide
peer-review program recommended by Health Quality Ontario.
• Cancer funding is inequitable. In Ontario, both the Ministry and CCO fund hospitals for radiation services, but they do not use a consistent method or rate to determine the amount. CCO acknowledges that the current funding approach for radiation treatment needs to be revised to ensure that hospitals are funded consistently and equitably. During the period from 2014/15 to 2016/17, we also found that CCO provided hospitals a total of $107 million for cancer drug therapy based on historical funding rather than service volumes. In addition, CCO funded about $12 million and $3.1 million for incomplete cancer drug treatments and non-malignant cases, respectively.
Overall ConclusionOur audit found that CCO, in conjunction with the Ministry and hospitals, has effective procedures and systems in place to ensure that most—but not all—cancer patients receive treatment in a timely, equit-able, and cost-efficient manner. We noted that some Ontarians’ needs were not being met in the areas of stem cell transplants, access to take-home cancer drugs, radiation treatment, PET scans, symptom management and psychosocial oncology services. Wait times for some urgent cancer surgeries and diagnostic services also needed improvement.
While cancer services are provided in accord-ance with applicable standards, guidelines and legislation, more work is needed to improve patient-safety standards at private specialty clinics and through second reviews of radiation treatment plans and diagnostic-imaging results.
Our audit also concluded that the results and effectiveness of cancer programs in meeting their intended objectives are measured and publicly reported periodically, except for wait times relating to biopsy and psychosocial services.
134
Chap
ter 3
• VF
M S
ectio
n 3.
02
We welcome any insights and recommendations provided by the Auditor General.
Ontario’s cancer system is among the best in the world. Cancer survival for nearly all cancer types is improving and mortality rates are declining, particularly from breast, colo-rectal and lung cancers. In 2016/17, Ontario announced investments of $130 million over three years for cancer services. The investment allows for the delivery of more cancer care services, such as PET, and will help reduce wait times for cancer surgeries. In 2017, the Ministry is investing in capital infrastructure to increase provincial capacity and adding an additional $32 million in treatment volume funding for stem cell transplants and acute leukemia, which will mean fewer patients will require transplants out of country.
Ontario’s public drug programs provide funding for both oral and injectable cancer drugs based on an evidence-based review pro-cess. Ontario’s investment in cancer drugs has increased by an average rate of 12% per year, with cancer drug expenditures being approxi-mately $791 million in 2016/17.
The audit identifies area of consideration that the Ministry is already taking measures to address, which reinforces its commitment to current work and future direction. The Ministry looks forward to a continued partnership with Cancer Care Ontario to ensure equitable access to cancer treatment services for all Ontarians and continued cancer system improvement.
The Ministry will continue to work closely with Cancer Care Ontario to ensure that Ontarians have access to high-quality cancer treatment services.
This report contains 18 recommendations, con-sisting of 33 actions, to address our audit findings.
OVERALL RESPONSE FROM CANCER CARE ONTARIO
Cancer Care Ontario is committed to working with the Ministry of Health and Long-Term Care (Ministry) and our many partners to ensure the delivery of high-quality, sustainable and person-centred care for all Ontarians. Cancer Care Ontario appreciates the Auditor General’s com-prehensive audit of Cancer Treatment Services and welcomes opportunities to improve these services in Ontario.
Much work has been done by all partners in the cancer system to ensure high-quality care, which has resulted in Ontario leading the coun-try in the five-year survival rate for the most common types of cancer. Cancer Care Ontario has enabled improvements across the system through strong partnerships, a robust perform-ance management and accountability model, data infrastructure and clinical expertise.
The recommendations within this report build upon the work that has been done to date by Cancer Care Ontario, the Ministry and partners. The report also identifies further opportunities to drive improvements in a num-ber of areas. Cancer Care Ontario looks forward to working collaboratively with the Ministry and our partners to address the recommendations noted within this report.
OVERALL RESPONSE FROM MINISTRY
The Ministry acknowledges the recommenda-tions made by the Auditor General of Ontario and thanks her for conducting this timely audit. The Ministry is committed to the development and implementation of innovative initiatives and solutions that address the impact of cancer and cancer treatment on the lives of Ontarians.

135Cancer Treatment Services
Chap
ter 3
• S
ectio
n 3.
02
2.2 Cancer Treatment Services2.2.1 Diagnosis
The first step in cancer treatment is diagnosis, and early diagnosis improves chances of survival and recovery. Diagnosis is used to confirm the pres-ence of cancer, identify its type and grade (how quickly cancer grows and spreads), determine how far it has progressed (its stage), and identify a treatment plan.
There are two principal diagnostic methods: biopsies and imaging. In a biopsy, physicians remove body tissue for laboratory analysis to determine the type and extent of cancer. Images are generated by one or a combination of the three following devices:
• computed tomography (CT) scan, which uses x-rays;
• magnetic resonance imaging (MRI), which uses a magnetic field and pulses of radio waves; and
• positron emission tomography (PET) scan, which uses radioactive tracers.
2.0 Background
2.1 Cancer OverviewCancer is a group of more than 200 different dis-eases characterized by the uncontrolled spread of abnormal cells in the body, and can be grouped into five main categories, according to the type of cell they start in:
• carcinoma: begins in the skin or in tissues that line or cover internal organs or glands, such as colon, lung and prostate;
• sarcoma: starts in the connective or sup-portive tissues, such as bone, cartilage, fat, muscle, or blood vessels;
• leukemia: originates in blood-forming tissue, such as bone marrow;
• lymphoma and myeloma: begins in the cells of the immune system; and
• brain and spinal cord cancers: known as central nervous system cancers.
Cancer Care Ontario (CCO), the Canadian Can-cer Society and Statistics Canada all say that about half of all Ontarians will develop a cancer in their lifetime, and one in four Ontarians will die of it.
Cancer is the leading cause of death in Ontario; CCO estimates that more than 29,000 people in the province died of cancer in 2016, accounting for 30% of all Ontario deaths that year. It estimates about 86,000 new cases were diagnosed the same year in Ontario (see Figure 1). CCO also predicts the number of new cases will rise in coming years because Ontario’s population is getting older, and cancer is a disease of aging.
In Ontario, the most common newly diagnosed cancers are lung, colorectal, breast and prostate. Ontario leads the country in five-year survival rates for these four cancers, and it has the third-lowest cancer-related mortality rate among other jurisdic-tions in Canada. (Five-year survival rates measure the percentage of people still alive five years after a diagnosis of cancer.)
Figure 1: Distribution of New Cancer Cases by Cancer Type, 2016Source of data: Cancer Care Ontario
# of New % of NewType of Cancer Cases CasesBreast 11,285 13
Colorectal 10,912 13
Lung 10,824 12
Prostate 8,266 10
Bladder 4,969 6
Skin: Melanoma 3,840 4
Uterus 3,213 4
Thyroid 3,207 4
Kidney 2,623 3
Pancreas 2,106 2
Liver 1,362 2
Cervix 717 1
Other Cancers 22,324 26
Total 85,648 100

136
Chap
ter 3
• VF
M S
ectio
n 3.
02
2.2.2 Treatment
Once a diagnosis of cancer is made, oncologists use one or more of the following treatments to combat it:
• radiation, administered to destroy cancerous cells or reduce the size of tumours while tak-ing steps to prevent damage to normal healthy cells and tissue;
• surgery, most effective for completely remov-ing early-stage cancerous tumours and/or tissue in cancers that have not spread beyond the part of the body in which they originated; and
• drug therapy (such as chemotherapy), used before surgery or radiation to shrink a tumour; with radiation; after surgery or radiation to destroy any remaining cancerous cells; and/or as a standalone treatment. Drugs (medication) can be administered at home, usually orally, and/or in hospital, usually by injection or intravenously. Apart from chemo-therapy, immunotherapy (a new field of cancer research worldwide with clinical trials under way in Canada) is another type of drug therapy that enhances a patient’s immune system to fight cancer.
2.2.3 Additional Treatments and Services
In addition to the three main forms of treatment above, stem cell transplant is a specialized treat-ment to transplant healthy bone-marrow cells into patients who have certain types of cancers, such as leukemia and some lymphomas. The transplants help replace blood-forming stem cells destroyed by cancer, chemotherapy and/or radiation therapy.
Cancer patients also receive help with symptom-management, a specialized service that helps them deal with physical symptoms such as pain, nausea, fever and vomiting, and emotional symptoms such as depression and anxiety.
Psychosocial Oncology is another specialized service that aims to help cancer patients and their
families improve their quality of life and emotional well-being by providing dietary, physical, psychiat-ric, occupational, and other professional support.
2.3 Cancer Spending and Administration
Both the Ministry and CCO fund cancer treatment services in Ontario, and they spent a combined total of about $1.6 billion on cancer treatment in 2015/16.
Of the total, CCO spent about $1.2 billion, primarily on the in-hospital costs of cancer surgery, cancer drug therapy (chemotherapy), radiation treatment and other specialized services, such as stem cell transplants. Figure 2 provides a break-down of CCO spending in 2015/16.
Figure 2: Cancer Care Ontario Expenditures on Cancer Programs, 2015/16Source of data: Cancer Care Ontario
1. Includes radiation equipment.2. Includes stem cell transplants.3. Covers cost of CCO senior staff engaged to monitor quality, develop
evidence-based guidance and implement best practices.4. Our audit covers all areas of cancer expenditures except Cancer Screening,
Quality Initiative programs and the administrative and miscellaneous funding to regional cancer centres. We last audited Cancer Screening in 2012, and followed up in 2014.
5. Ontario residents who qualify for OHIP and are receiving approved out-patient intravenous cancer drug treatment at the hospital can receive full coverage under the New Drug Funding Program or the cancer drug therapy Quality Based Procedures funding program and pay nothing out-of-pocket.
Cancer Drugs ($350 million)5
Other Cancer Treatmentsand Services ($53 million)2
Administrative andMiscellaneous Funding toRegional Cancer Centres($86 million)4
Radiation Treatment1
($134 million)
Cancer Drug Therapy($185 million)5
Cancer Surgery($187 million)
Quality Initiative Programs ($29 million)3,4
Cancer Screening($154 million)4

137Cancer Treatment Services
Chap
ter 3
• S
ectio
n 3.
02
The Ministry spent an additional $375 million in 2015/16 on cancer drugs covered under the Ontario Drug Benefit Program. Specifically, for patients requiring take-home cancer drugs: Ontario pays the drug cost for people 65 and older, receiv-ing social assistance benefits, living in homes for special care and long-term-care homes or receiving professional home and community care services. These patients pay a deductible of about $50 or less per year on average. The Province also pays the cost of take-home cancer drugs for patients under the age of 65 with high drug costs relative to their incomes. These patients pay a deductible of about 4% of their annual household income. Ontarians who do not receive public benefits under any of these categories have to pay out-of-pocket for the costs of cancer drugs taken at home, unless they have private health-care insurance coverage.
The Ministry also provides additional funding directly to hospitals to support some cancer surger-ies, expand the capacity of radiation services, and cover the cost of cancer drugs administered in hospitals. Except for experimental drugs, patients receiving cancer drugs in a hospital are entitled to receive full coverage as long as they have a valid Ontario Health Insurance Plan card and the drug is prescribed by an attending health-care professional.
Figure 3 shows the different players in Ontario’s cancer-care system.
3.0 Audit Objective and Scope
The objective of our audit was to assess whether Cancer Care Ontario (CCO), in conjunction with the Ministry of Health and Long-Term Care (Min-istry) and Ontario hospitals, has effective proced-ures and systems in place to:
• ensure that cancer treatments are provided in a timely and equitable manner to meet Ontarians’ needs in a cost-efficient manner
and in accordance with applicable standards, guidelines and legislation; and
• measure and publicly report periodically on the results and effectiveness of cancer pro-grams in meeting their intended objectives.
Before starting our work, we identified the audit criteria we would use to address our audit objective. These criteria were established based on a review of applicable legislation, policies and pro-cedures, and internal and external studies. Senior management at CCO and the Ministry reviewed and agreed with our objective and associated criteria as listed in Appendix 1.
Our audit work was conducted primarily at CCO offices in Toronto from December 2016 to June 2017. We obtained written representation from CCO and the Ministry that, effective November 14, 2017, they have provided us with all the informa-tion they are aware of that could significantly affect the findings of this report. We also interviewed senior management and examined related data and documentation at CCO and the Ministry.
As well, we spoke with key personnel at all 14 regional cancer centres and at two community hospitals (see Appendix 2).
In addition, we spoke with various stakeholder groups, including the Canadian Cancer Society, Canadian Partnership Against Cancer, Canadian Association of Psychosocial Oncology, Ontario College of Pharmacists, College of Physicians and Surgeons and Ontario Nurses Association.
To obtain a better understanding of the cancer system, we conducted a survey of the 14 regional cancer centres (we received a response rate of 64%) and 71 hospitals in Ontario that received funding from CCO to deliver cancer treatments (we received a response rate of 63%).
We reviewed relevant research and best prac-tices of cancer-treatment services in Ontario and other jurisdictions. We also engaged independent advisers with expertise in the field of cancer-treatment services to assist us on this audit.

138
Chap
ter 3
• VF
M S
ectio
n 3.
02
4.0 Detailed Audit Observations
4.1 Radiation Treatment4.1.1 Radiation Treatment Under-Utilized
We found that radiation treatment, which seeks to kill or shrink cancerous cells and tumours using radioactive materials beamed or inserted into the body, is under-utilized in all regions of Ontario.
CCO set a province-wide target to administer radiation therapy to 48% of cancer patients at some point during their treatment, in accordance with evidence-based international standards and best-practice guidelines.
We reviewed CCO data on radiation from 2011/12 to 2015/16 and found that the treatment rate province-wide rose from 38% to 39% during that time. In 2015/16, CCO estimated that about 1,500 more patients could have benefitted from radiation therapy had its target been met that year.
Figure 3: Roles and Responsibilities of Key Players in Ontario’s Cancer System Prepared by the Office of the Auditor General of Ontario
Private Clinics
• Offers services including cancer drug infusion therapy.*
Ministry of Health and Long-Term Care
• Determines provincial funding to hospitals and cancer treatment services.
• Administers various drug programs such as the Ontario Drug Benefit Program, the Trillium Drug Program and the New Drug Funding Program to help Ontarians access cancer drugs.
Cancer Care Ontario (CCO)
• Directs provincial funding to hospitals and other providers to deliver cancer services.
• Plans cancer services.
• Collects cancer data.
• Develops and implements quality improvements and standards in clinical practices.
• Manages Regional Cancer Programs:
• Networks of hospitals, health-care professionals and other organizations involved in providing cancer care services within each of the province’s 14 LHINs to co-ordinate and respond to regional cancer issues.
• Led by a Regional Vice President (RVP).
Hospitals
• About 100 hospitals offer various cancer treatment services.
• 14 of them are designated as Regional Cancer Centres, which are considered clinical centres of excellence capable of providing the most complex cancer treatments.
Cancer Quality Council of Ontario
• Monitors and reports publicly on cancer system performance in Ontario.
• Makes recommendations for targeted quality improvement to the Minister via CCO’s Board of Directors.
• Benchmarks the quality of Ontario’s cancer system performance against national and international leaders.
Information sharing
Reporting
* Cancer infusion therapies administered at these clinics are for cancer drugs that have been approved by Health Canada but are not covered by public funding or OHIP. Payments for these drugs are through the patient’s third party insurance and/or self-pay.

139Cancer Treatment Services
Chap
ter 3
• S
ectio
n 3.
02
Figure 4 shows that none of the Local Health Integration Networks (LHINs) met the 48% target in 2015/16. We also noted that utilization rates of radiation treatment varied in 2015/16 among LHINs.
CCO indicated that proximity to radiation centres and physician referral behaviours are the main reasons for the low utilization rates. Patients who live far from radiation facilities, for example, or those treated in hospitals that do not offer radia-tion, were less likely to receive it than those treated at hospitals that offered radiation.
4.1.2 Some Radiation Treatment Plans Not Reviewed According to Clinical Guidelines
Hospitals did not consistently perform reviews of radiation treatment plans according to clinical guidelines.
The review of radiation treatment plans by a second radiation oncologist in the early stages of radiation therapy is a quality-assurance process to standardize patient care, ensure patient safety and
treatment effectiveness, and detect any potential clinical errors. It includes a review of radiation dos-age, and mapping to define the borders of a tumour and exclude healthy normal organs from radiation.
In 2015, the Canadian Partnership for Quality Radiation Therapy (comprised of the Canadian Organization of Medical Physicists, the Canadian Association of Medical Radiation Technologists, the Canadian Association of Radiation Oncology and the Canadian Partnership Against Cancer) recom-mended a review of each curative radiation treat-ment plan by a second radiation oncologist before it begins or, at the very least, before 25% of the total prescribed dose is administered.
A review of treatment plans prior to, or in the early stages of radiation therapy, is most beneficial, because any errors can be corrected before signifi-cant additional doses of radiation are administered. The American Society for Radiation Oncology conducted a survey in 2013—ninety-three percent of respondents were practicing radiation oncolo-gists and the remaining 7% of respondents were residents or trainees—and reported that as many as
Figure 4: Utilization Rates for Radiation Treatment by LHIN, 2015/16Source of data: Cancer Care Ontario (CCO)
Note: CCO informed us that the utilization rate from North West LHIN is likely underestimated because many patients in the west of the LHIN receive treatment in Manitoba.
Target: 48%
0%
10%
20%
30%
40%
50%
60%
Erie
St.
Clai
r
Sout
h W
est
Wat
erlo
o W
ellin
gton
Ham
ilton
Nia
gara
Hald
iman
d Br
ant
Cent
ral W
est
Mis
siss
auga
Hal
ton
Toro
nto
Cent
ral
Cent
ral
Cent
ral E
ast
Sout
h Ea
st
Cham
plai
n
Nor
th S
imco
e M
usko
ka
Nor
th E
ast
Nor
th W
est

140
Chap
ter 3
• VF
M S
ectio
n 3.
02
10% of treatments were changed based on results of reviews. In addition, 2013/14 Ontario data on the review of radiation treatment plans also indi-cated that changes were recommended in about 3% of cases.
CCO collects data on reviews of radiation treat-ment plans from hospitals and divides it into two categories—treatment plans with curative intent (aiming to cure a cancer), and treatment plans with palliative intent (seeking to relieve pain and other symptoms).
Based on our examination of CCO data on reviews of radiation treatment plans in 2016/17, we found that:
• Thirteen percent of curative treatment plans were never reviewed, and an additional 11% were not reviewed within the recommended time frame. The percentage of curative treatment plans reviewed within the recom-mended time frame also varied significantly among hospitals, ranging from 52% to 100%.
• Only 28% of palliative treatment plans were reviewed. The percentage of palliative treatment plans reviewed within the recom-mended time frame also varied significantly among hospitals, ranging from 1% to 96%.
Although CCO collected data on reviews of radiation treatment plans, it did not assess whether cancer centres reviewed palliative-treatment plans. In addition, CCO did not assess whether cancer centres reviewed curative-treatment plans within the recommended time frame. Since the timing of reviews is not included in the performance-management scorecard used by CCO to assess hospital performance, the hospitals were not held accountable for failing to follow clinical guidelines for review.
CCO informed us that the review of palliative treatment plans is a new initiative and therefore has not been a priority relative to the review of curative treatment plans. CCO also informed us that this new initiative has been slowly ramping up since 2013 and that starting in 2017/18, hospitals will be required to perform reviews of palliative
radiation treatment plans. The minimum review target for palliative treatment plans at each centre in 2017/18 will be 10%, with an overall provincial target of 30%.
RECOMMENDATION 1
To better ensure that cancer patients receive timely and safe radiation treatment, we recom-mend that Cancer Care Ontario work with the Ministry of Health and Long-Term Care and hospitals to:
• develop a strategy to increase the accessibil-ity of radiation services to patients who do not live close to a radiation centre;
• implement a program to increase physician awareness of the availability and benefit of radiation treatment; and
• monitor reviews of radiation treatment plans to determine whether the reviews are done in accordance with clinical guidelines.
CANCER CARE ONTARIO RESPONSE
Cancer Care Ontario agrees that safe and timely access to radiation treatment is intrinsic to high-quality cancer care.
In order to ensure that patients have equitable and appropriate access to radiation-treatment facilities, Cancer Care Ontario developed a 10-year Radiation Treatment Capital Investment Strategy. This strategy is updated every five years as new data about pro-jected cancer incidence and treatment demand becomes available and to keep pace with clinical practice and advancements in technology. Additionally, there is a rolling two-year capital replacement plan. The location, size and timing of investments toward these facilities are based on a standard framework with input from a multi-disciplinary committee with representa-tion from across the province. The Ministry has supported this strategy, resulting in an increase in the number of radiation treatment units from

141Cancer Treatment Services
Chap
ter 3
• S
ectio
n 3.
02
65 in 2000 to 107 in 2017 in alignment with the recommendations.
Cancer Care Ontario is analyzing new cancer incidence data that became available in August 2017 in order to determine the optimal number and location of radiation-treatment facilities needed in the province. By March 2018, Cancer Care Ontario will update its Radiation Treat-ment Capital Investment Strategy (last updated in 2012), which guides capital investments to build and equip radiation treatment facilities.
Cancer Care Ontario is working closely with regional partners to increase physician awareness of the indications for and availability of radiation treatment locally. Detailed LHIN-specific reports identifying groups of patients who could benefit from treatment have been developed and shared with Regional Cancer Programs to ensure that local initiatives target these patients and their physicians.
Cancer Care Ontario will continue to work with Regional Cancer Programs to increase peer review of radiation treatment plans according to clinical guidelines. To our know-ledge, Ontario is the only jurisdiction that measures peer review of radiation treatment plans and monitors whether the peer review is performed on each individual treatment plan and the timing of this review in accordance with clinical guidelines (before, during or after treatment). This information is shared with Regional Cancer Programs as part of our quality improvement program.
4.2 Cancer Surgery4.2.1 Long Wait Times for Some Urgent Cancer Surgical Consultations and Surgeries
Our audit found that although wait times for sur-gical cancer consultations and surgeries were gen-erally shorter than for non-cancer cases, they were still long and further improvements could be made.
Cancer surgical consultations and surgeries in Ontario are classified according to four priority lev-els: emergency, urgent, less urgent, and non-urgent. In 2016/17, 99% of cancer surgical consultations and surgeries were in the last three priorities.
In 2016/17, CCO collected wait-time data for 31,000 surgical consultations. The provincial wait-time targets say that 90% of all cancer-surgery patients should receive their surgical consultation within 10 days for urgent cases. Urgent is defined as high suspicion of cancer or biopsy positive for can-cer where patients have high likelihood of having highly aggressive malignancies. We noted long wait times for these cases. For example:
• Seventy-two percent of urgent thyroid patients received their consultations within the wait-time target. The 90th percentile wait time was 31 days—three times longer than the target. This means that 10% of patients waited longer than 31 days, and 90% waited some amount of time under 31 days.
• Sixty-three percent of urgent gynaecological patients received their consultations within the wait-time target. The 90th percentile wait time was 27 days—two and a half times longer than the target. This means that 10% of patients waited longer than 27 days, and 90% waited some amount of time under 27 days.
Information provided to us by CCO showed that more than 55,000 cancer surgeries were performed in Ontario in 2016/17. CCO collects wait-time data for these surgeries. The provincial wait-time targets stipulate that 90% of all cancer surgeries should be completed within 14 days for urgent cases. CCO informed us that many factors can affect a hospital’s ability to meet wait-time targets, includ-ing availability of operating rooms, wait time for surgical preparations, such as MRIs and CT scans, and the complexity of patients’ conditions (see Sec-tion 4.5).
We analyzed the 2016/17 wait-time data by types of cancer surgery from urgent to non-urgent, and noted that:

142
Chap
ter 3
• VF
M S
ectio
n 3.
02
tral West LHIN, compared to the wait-time target of 14 days (see Figure 7).
We also noted that hospitals located near each other had significant wait-time differences. For example, the difference in the 90th percentile wait times for urgent breast cancer surgeries between two hospitals just 15 kilometres apart was 30 days (14 days at one hospital and 44 at the other) when the Ministry’s wait-time target was 14 days.
While some regions have implemented a cen-tral referral and booking service for some cancer surgeries in an effort to improve wait times and access, this service is not consistently available for all cancer surgeries at all the LHINs; where central referral and booking service is not available, indi-vidual surgeons and hospitals have to manage their own wait lists.
RECOMMENDATION 2
To better ensure patients have timely and equitable access to cancer surgery, we recom-mend that Cancer Care Ontario work with the Ministry of Health and Long-Term Care and hospitals to:
• Urgent surgeries for 15 out of 17 types of can-cer did not meet the 14-day wait-time target (see Figure 5).
• The more urgent the surgery, the less likely it was to be performed within the wait-time tar-gets (see Figure 6). Cancer surgeries with the worst wait-time performance were thyroid, head and neck, and prostate, which did not meet the wait-time targets at both the urgent and non-urgent levels.
4.2.2 Wait Times for Urgent Surgery Varied among Hospitals
The wait time for cancer surgery depends on the hospital and surgeon to which the patient is referred. We found that wait times varied among hospitals, resulting in inequitable access to cancer surgeries across the province.
We analyzed the 2016/17 wait-time data by LHIN, and noted significant wait-time variations by LHIN. For example, the 90th percentile wait times for urgent gynaecological cancer surgery ranged from 12 days at South East LHIN to 74 days at Cen-
Figure 5: Wait Times for Urgent Cancer Surgery by Types of Cancer, 2016/17 (Days)Source of data: Cancer Care Ontario
Note: Wait times measured as the maximum amount of time in which nine of 10 patients have their surgeries.
50
3634
3229
2422 22 22 21 21 20
16 15 1512
8
0
5
10
15
20
25
30
35
40
45
50
Skin
: Car
cino
ma
Thyr
oid
Live
r, Pa
ncre
as,
Gal
l Bla
dder
Gyn
aeco
logi
cal
Skin
: Mel
anom
a
Stom
ach
Head
and
Nec
k(e
xcl.
Thyr
oid)
Soft
Tiss
ue
Brea
st
Colo
rect
al
Lung
Gen
itour
inar
y(e
xcl.
Pros
tate
)
Pros
tate
Esop
hagu
s
Lym
phom
as
Cent
ral N
ervo
usSy
stem
Bone
Target: 14

143Cancer Treatment Services
Chap
ter 3
• S
ectio
n 3.
02
• analyze the reasons for delays in schedul-ing surgical consultations and performing urgent cancer surgeries;
• take corrective action to reduce wait times for surgical consultations and cancer surgeries; and
• assess the benefits of having a central-ized referral and booking process for cancer surgeries.
CANCER CARE ONTARIO RESPONSE
Cancer Care Ontario agrees with this recom-mendation and is working with Regional Cancer Program partners to continue to reduce cancer surgery wait times.
Cancer Care Ontario reviews hospital performance on a monthly/quarterly basis to identify reasons for delay and develop tar-geted solutions to reduce wait times. Overall, the Province is performing well on wait-time
targets for cancer surgery. In the first quarter of 2017/18, 89% of all non-emergency cancer surgeries were performed within set targets, and wait times for urgent surgeries were 81% (that is, within two weeks of consultation). Cancer Care Ontario recognizes there are both regional and disease-type variations in wait times, and will continue to work with partner hospitals to reduce wait times.
Cancer Care Ontario will continue to investi-gate the reasons for delays in surgical consulta-tions and urgent cancer surgeries and consider improvement initiatives as appropriate. While priority targets provide guidance for surgeons to help triage patients in a standardized manner, ultimately surgeons must use their judgment to assign priorities based on the patient’s symp-toms, physical status as well as the status of the cancer.
Cancer Care Ontario is participating in the Pan-LHIN Referral Management Working
Figure 6: Comparison by Urgency of Percentages of Cancer Surgeries Completed within Wait-Time Targets, 2016/17Source of data: Cancer Care Ontario
Note: Our analysis did not include emergency cases because 99% of cancer surgeries performed in 2016/17 were urgent, less urgent or non-urgent.
0%
20%
40%
60%
80%
100%
120%
Thyr
oid
Live
r, Pa
ncre
as,
Gal
l Bla
dder
Gyn
aeco
logi
cal
Skin
: Mel
anom
a
Skin
: Car
cino
ma
Head
and
Nec
k(e
xcl.
Thyr
oid)
Soft
Tiss
ue
Brea
st
Stom
ach
Colo
rect
al
Lung
Gen
itour
inar
y(e
xcl.
Pros
tate
)
Lym
phom
as
Pros
tate
Esop
hagu
s
Cent
ral N
ervo
usSy
stem
Bone
% of non-urgent cancer surgeries completed within wait-time targetsTarget = 90%
% of less urgent cancer surgeries completed within wait-time targets% of urgent cancer surgeries completed within wait-time targets

144
Chap
ter 3
• VF
M S
ectio
n 3.
02
Group, which has been mandated by the Ministry to develop a province-wide eRefer-ral strategy. As part of this initiative, Cancer Care Ontario will assess the benefits of a centralized referral and booking process for cancer surgeries.
4.3 Cancer Drug TherapyOncologists, in consultation with patients, decide which cancer therapy best suits the patient based on the oncologist’s medical judgment, clinical practice guidelines and the patient’s medical circumstances. A patient may decline a drug recommended by the oncologist in favour of a dif-ferent one because the recommended drug may be difficult to administer or has worse side effects or there is a lack of funding from the Province. Ontarians can receive cancer drug therapy through different ways:
• Take-home cancer drugs are administered at home, usually orally; however, some are given by intramuscular (into the muscle) or
subcutaneous (under the skin) injection, or topically (on the skin).
• In-hospital cancer drugs are administered at hospital out-patient clinics by nurses with oncology training through intravenous (IV) drip or injection.
• In-hospital cancer drugs administered for patients in hospital rooms can be oral or by injection.
In most instances, patients do not have a choice between in-hospital and take-home cancer drugs. Very few in-hospital injectable cancer drugs offer take-home substitutes in oral or topical form. Similarly, many take-home drugs do not come in IV or injectable form. Some cancer drug treatments contain a combination of medication involving oral therapy and injection.
Eligible Ontarians can receive their cancer drug coverage through various programs, including the Ontario Drug Benefit Program (see Section 2.3). There are several categories of financial support, including the Trillium Drug Program (Trillium), for patients eligible for the Ontario Drug Benefit
Wait TimeLHIN with the Wait Time LHIN with the Wait Time Difference
Type of Cancer Surgery Longest Wait Time (Days) Shortest Wait Time (Days) (Days)Skin: Carcinoma Central East 82 Central 17 65
Gynaecological Central West 74 South East 12 62
Genitourinary (excl. Prostate) North Simcoe Muskoka 58 Toronto Central 6 52
Skin: Melanoma Central East 40 Waterloo Wellington 12 28
Colorectal North West 40 Central West Toronto Central
14 26
Lung Mississauga Halton 36 North East 11 25
Breast South East 35 North East 12 23
Stomach Mississauga Halton 47 Hamilton Niagara Haldimand Brant
24 23
Head and Neck (excl. Thyroid) Centre East 37 Toronto Central 17 20
Central Nervous System Mississauga Halton 17 Erie St.Clair 3 14
Liver, Pancreas, Gall Bladder South West 46 Hamilton Niagara Haldimand Brant
33 13
Note: Some types of cancer did not have a significant volume of urgent surgeries performed in 2016/17.
Figure 7: Wait-Time Variations by Type of Urgent Cancer Surgeries by LHIN, 2016/17Source of data: Cancer Care Ontario

145Cancer Treatment Services
Chap
ter 3
• S
ectio
n 3.
02
Program. Trillium is for patients with high drug costs relative to their income. For those patients who have private insurance or can pay out-of-pocket for their drugs, which can be as high as $126,000 per year for patients using standard doses, they may not need to apply for Trillium.
4.3.1 Take-Home Cancer Drug Patients Experience Inequities
Ontarians who qualify for OHIP and need out-patient intravenous cancer drug treatments at the hospitals may receive full coverage under the Ministry’s New Drug Funding Program (NDFP). Although take-home cancer drugs are funded through the Ontario Drug Benefit Program in the same way that drugs are covered for other diseases, we noted that some cancer patients requiring take-home cancer drugs experience inequities.
Some patients requiring take-home cancer drugs have to go through the Trillium application process in order to obtain funding from the Ontario Drug Benefit Program. For drugs not on the Ontario Drug Benefit formulary, such as some take-home cancer drugs, physicians or nurse practitioners must also apply for Ministry approval through the case-by-case review process under the Exceptional Access Program (EAP) to ensure that clinical criteria are met before funding is granted. In comparison, all patients requiring approved in-hospital cancer drugs do not have to go through such processes.
Our analysis of CCO data for 2015/16 indicated that 47% of cancer patients were given take-home drugs, but this number is expected to increase in the future because 60% of all new cancer drug treatments currently under development are oral drugs.
Through the Ontario Drug Benefit Program, the cost of take-home drugs is covered for patients aged 65 or older, receiving social assistance benefits (through the Ontario Disability Support Program and Ontario Works), living in a home for special care or a long-term-care home, or receiving profes-sional home and community care services. These
patients pay an average of $50 or less per year of total costs for their treatments. The Province also covers, through Trillium, the cost of take-home can-cer drugs for patients under the age of 65 with high drug costs relative to their incomes. About 1,200, or 12%, of patients who are eligible for the Ontario Drug Benefit Program and require take-home can-cer drugs receive benefits through Trillium. These patients pay an income-based deductible, which is about 4% of their annual household income. Ontar-ians who do not receive public benefits under any of these categories have to pay out-of-pocket the costs of cancer drugs taken at home, unless they have private health-care insurance coverage.
In comparison, the Western provinces and the territories—British Columbia, Alberta, Sas-katchewan, Manitoba, the Northwest Territories, Nunavut and the Yukon—provide full coverage of all publicly funded cancer drugs for all patients no matter whether their drugs are administered in hospital or taken at home. There is no appli-cation process required for patients in these regions regardless of their drug costs and their income level.
As mentioned above, no application for the Ontario Drug Benefit Program is required for many Ontarians—seniors, people receiving social assist-ance benefits, living in a home for special care or a long-term-care home, or receiving professional home and community care services. However, individuals who are younger than 65 and have high drug costs relative to their household income must apply for Trillium, which is a lengthy process as discussed in Section 4.3.2.
The Ministry informed us that a patient’s condition meeting criteria based on evidence is a consistent requirement for both intravenous and take-home cancer drugs across Canada. The Ministry also informed us that although coverage may be available in other provinces, these provinces may not be the fastest to begin funding a take-home cancer drug, following national clinical reviews and negotiations.
146
Chap
ter 3
• VF
M S
ectio
n 3.
02
4.3.2 Processes for Exceptional Access Program and Trillium Drug Program Need Improvement
Ontarians who qualify for OHIP have access to can-cer drugs on the Ontario Drug Benefit formulary without application or eligibility assessment when a prescription is presented at a pharmacy. Cancer patients who do not qualify for the Ontario Drug Benefit Program and need financial support can apply for the Trillium Drug Program (Trillium), which requires proof of annual household income to determine the coverage and deductible. As part of the Trillium application, patients must submit documentation on household income or provide authorization to validate household income with the Canada Revenue Agency.
In addition, Ontarians requiring many take-home cancer drugs, or other drugs that are not available on the Ontario Drug Benefit formulary, must have their physicians or nurse practitioners apply for authorization through EAP to ensure that these drugs are appropriately funded based on evidence-based clinical criteria. Meeting evidence-based clinical criteria is also required for intra-venous drugs provided through the Ministry’s New Drug Funding Program and used in hospital out-patient clinics. To access an EAP drug, the patient’s physician or nurse practitioner submits a request to the Ministry with clinical information to support using the requested drugs. This process is done manually by fax, and any renewals require clinical information regarding the ongoing benefit of the drug from the physician or nurse practitioner. If the same drug is used for a patient who has been admitted to hospital, the physician or nurse practi-tioner can prescribe the drug directly without going through the EAP process.
Our survey of hospitals shows that while the majority of regional cancer centres have dedicated personnel to assist patients with Trillium applica-tions, 44% of community hospitals surveyed do not. About 7% of community hospitals that participated in our survey indicated that they use pharmacists to help with the EAP requests and/or Trillium applica-
tions, which in turn reduced the time the pharma-cists were available for clinical work.
Based on our review of 2015/16 data provided by the Ministry, we noted long turnaround times for both EAP requests and Trillium applications. We found that the Ministry’s processing times are measured in business days, not calendar days. Considering that cancer treatment is most effective the earlier that it begins, we view calendar days as a more timely measurement and see more benefit to cancer patients by including weekends and holidays in processing times. We also found that:
• The processing-time target for EAP related to cancer medication is three business days. However, actual processing times were almost three times longer—an average of about nine business days—equivalent to about two weeks when considering calendar days. In fact, 87% of respondents in our survey of hospitals indi-cated that processing times could be short-ened. We also noted that 22% of EAP requests in 2015/16 required the physicians or nurse practitioners to submit additional information due to incomplete information in the earlier requests. EAP typically approves requests for take-home cancer drugs for one year. Renewal of funding is granted if the drug continues to be effective. Physicians or nurse practitioners prescribing these drugs have to renew the EAP requests for their patients in order to confirm whether there is continued benefit or toxici-ties from the treatment.
• The processing-time targets for Trillium measure the time from the date the Ministry receives the application to the date the appli-cation is reviewed. It does not measure the overall time between receipt of the application and when a decision is made. For 2015/16, 24% of all Trillium applications were required to submit additional information to proceed. When we took that into account, the overall turnaround time, from the date the Ministry received a new application to the date the household was enrolled was 19 business

147Cancer Treatment Services
Chap
ter 3
• S
ectio
n 3.
02
Figure 8 shows a summary of our analysis of the EAP cancer drugs with the highest government spending through Trillium. We noted that Trillium covered almost the entire drug costs, ranging from 95% to 99%.
RECOMMENDATION 3
To better ensure patients have equitable and timely access to the cancer drugs they need, we recommend that the Ministry of Health and Long-Term Care work with Cancer Care Ontario to:
• evaluate the operational efficiency of finan-cial-support programs for cancer drugs; and
• simplify and streamline the request and application process for financial support for cancer drugs.
MINISTRY RESPONSE
The Ministry agrees that Ontarians should receive timely and equitable access to effective cancer therapies and that processes for both access and funding of costly drug therapies should be streamlined, efficient, and sustainable to effectively serve the public. The Ministry
days on average—equivalent to about one month when considering calendar days. In addition, patients have to update their Trillium enrolment information annually in order to confirm their household income and continued eligibility. If they have given Tril-lium access to their CRA information, this can occur automatically.
Our survey results showed that each Ontario oncologist surveyed spent an average of 3½ hours a week on paperwork for EAP requests—time that they could have used to see an average of seven more patients a week.
In addition, 69% of respondents to our survey indicated that the EAP process should be simpli-fied, and 76% said the frequency of requests for renewing EAP coverage should be reduced.
We also questioned the rationale for making patients and their physicians or nurse practitioners go through the lengthy and manual Trillium and EAP processes when the majority of them were approved in the end anyway and were covered for almost the entire drug cost. In 2015/16, EAP received over 8,100 requests for cancer drugs, and only about 5% of the requests were rejected by the Ministry.
Figure 8: Exceptional Access Program (EAP) Cancer Drugs with the Highest Government Spending through the Trillium Drug Program, 2015/16Source of data: Ministry of Health and Long-Term Care
Approximate Avg. Cost Covered % of DrugAnnual Cost of by Ministry for a Cost Covered
Drug Name Cancer Type Standard Dose1 ($) Standard Dose2 ($) by TrilliumPomalidomide Multiple Myeloma 126,000 124,740 99
Lenalidomide Multiple Myeloma and Bone Marrow 99,000 96,030 97
Everolimus Various 73,000 70,810 97
Sunitinib Various 68,000 65,280 96
Ruxolitinib Bone Marrow 61,000 59,780 98
Dasatinib Leukemia 60,000 57,000 95
Nilotinib Leukemia 51,000 48,960 96
Abiraterone Prostate 43,000 41,710 97
1. Cost does not include professional fees or mark-ups, and is based on the approximate wholesale cost of the drug at standard dose(s) used for the cancer condition.
2. The percentage of the cost of standard dose paid by the Ministry is calculated using average annual expenditures for each drug. Annual expenditure is defined as the average cost actually paid by the Ministry's Trillium Drug Program per recipient.

148
Chap
ter 3
• VF
M S
ectio
n 3.
02
accepts the recommendation to work on process improvements with its stakeholders and its agency, Cancer Care Ontario, to optimize the timeliness of decisions for cancer drugs and to ensure value for money.
Cancer drugs that are on the Ontario Drug Benefit (ODB) Formulary can be provided to ODB program recipients when a prescription is presented at a pharmacy. Other than meeting the ODB program eligibility, there is no assess-ment required for funding of these cancer drugs.
The Exceptional Access Program (EAP) over-sees appropriate access to about 30 oral cancer treatments by applying a case-by-case review process to drugs that average about $75,000 per patient in annual costs. The Ministry continues to modernize and optimize EAP’s manual pro-cesses for case-by-case assessment of requests through technology solutions, streamlining initiatives, and enhancing criteria transparency. The Special Authorization Digital Information Exchange (SADIE) system will be launched in 2018, offering an online digital service for prescribers to research, submit, and manage requests to the EAP. SADIE is expected to have the capability to provide real-time responses for many EAP drugs and indications and to improve the timeliness of decisions for drug access.
The Trillium Drug Program (Trillium Program) is utilized by about 5% of recipients taking a publicly funded cancer drug and 11% of recipients of cancer drugs on the EAP list. The Ministry agrees with the recommendation that improvements and evaluation of the Trillium Program are necessary and work is under way to streamline processes by simplifying forms and instructions. The Ministry has been actively engaging with stakeholders to enhance under-standing of this program that was launched to ensure that all Ontarians with high drug costs relative to their income would not face financial hardship and continues to work to improve enrolment timeliness and enhance the patient experience with the program.
4.3.3 Patients Getting Inadequate Supports for Proper and Safe Usage of Take-Home Drugs
Chemotherapy, which is a type of drug therapy, was traditionally administered to patients at hospitals by injection or intravenously. With the increase in availability of oral cancer drugs, more patients are now able to take these oral cancer drugs at home. In addition, as a result of the increase in effective oral cancer drugs, more patients are now being treated using daily or cyclic doses of self-admin-istered oral cancer drugs at home. Patients using take-home cancer drugs should follow instructions for administration and safe handling of these drugs. For example, they may have to store cancer drugs separately from other medications or take the can-cer drugs in a certain order with other medications.
However, cancer patients may not have adequate help to ensure that they use and handle the drugs properly. CCO’s December 2014 think tank report, Enhancing the Delivery of Take-Home Cancer Therapies in Ontario, identified gaps in educating take-home cancer drug patients, particularly in the areas of providing guidance on the safe handling, disposal, drug interactions and how to deal with missed doses.
In addition, 89% of hospitals that responded to our survey did not have standardized full-day edu-cational sessions for patients starting take-home cancer drugs. Cancer patients may not know what to do when they miss a treatment, take the medica-tion late, or vomit right after taking it. As well, only 11% of hospitals we surveyed had programs to call patients to check on them and answer questions on all cancer drug-related side effects.
In comparison, all patients in other provinces, such as Alberta and Newfoundland and Labrador, who start oral take-home cancer drugs are invited to a standardized educational session. Patients in Alberta, British Columbia, Saskatchewan and Newfoundland and Labrador also receive follow-up phone calls after commencing their medications.

149Cancer Treatment Services
Chap
ter 3
• S
ectio
n 3.
02
CCO took some actions in 2016 to address concerns about patient safety regarding the use of take-home cancer drugs, but the effectiveness of such actions has yet to be seen.
For example, CCO collaborated with the Uni-versity of Toronto to offer training to pharmacists caring for cancer patients, including those with take-home oncology drugs—but this training is not mandatory. CCO’s analysis of 2013/14 data showed that about 88% of all take-home cancer drug prescriptions were dispensed by community pharmacies. As of the end of 2016, only about 1.5% of all pharmacists in Ontario had taken the course, even though 53% of the province’s pharmacies dispensed cancer drugs that year.
RECOMMENDATION 4
To better ensure cancer drugs are used by patients safely at home, we recommend that Cancer Care Ontario work with the Ontario Col-lege of Pharmacists, the Ministry of Health and Long-Term Care, and hospitals to:
• establish education programs for cancer patients on safe usage and handling of take-home cancer drugs and monitoring pro-grams to assist cancer patients on adhering to proper use of oral cancer drug therapy at home; and
• evaluate whether to require that pharmacists who dispense cancer drugs receive special-ized cancer-drug-therapy training and are familiar with cancer therapy regimens, including oral cancer drug regimens.
CANCER CARE ONTARIO RESPONSE
Cancer Care Ontario agrees with this recom-mendation and has been developing several initiatives to support cancer patients in the safe use of at-home cancer drugs.
Cancer Care Ontario, in partnership with the de Souza Institute, has developed two online education programs. One is a teaching tool to assist health-care providers in the assessment
Not All Pharmacists Dispensing Cancer Drugs Received Specialized Training
In Ontario, any pharmacist at any pharmacy can dispense cancer drugs. The Ministry informed us that oncology pharmacotherapy and therapeutics are only taught as part of the Ontario university pharmacy program to prepare students to be prac-titioners in this area. There is currently no manda-tory specialized oncology training for practising pharmacists who dispense take-home cancer drugs.
In comparison, Alberta allows only designated pharmacies, with pharmacists who have received specialized cancer-drug-therapy training and are familiar with normal dosages, to dispense these medications.
The Ministry informed us that the competence of pharmacists and pharmacy technicians is regulated by the Ontario College of Pharmacists, whose responsibility it is to maintain professional standards among pharmacists.
According to a 2013 survey published in the Journal of Oncology Pharmacy Practice, only 24% of community pharmacists were familiar with the common doses for oral anti-cancer drugs, and only 9% felt comfortable educating patients about these medications. A 2015 report by the Institute for Safe Medication Practices Canada said the lack of specialized training in oral take-home cancer drugs among community pharmacists contributed to dos-age errors. For example, patients sometimes need to adjust dosage during their treatment by taking a different strength of pill. The adjustment could be complicated, and some pharmacists may not be familiar with the criteria of dosage adjustment.
In addition, as noted in the Recommendations for the Safe Use and Handling of Oral Anti-Cancer Drugs in Community Pharmacy: A Pan-Canadian Consensus Guideline, produced by the Canadian Association of Provincial Cancer Agencies and CCO, commun-ity pharmacies may have limited training related to cancer treatment and little exposure to cancer drugs due to low dispensing volumes. As a result, it is recommended that cancer drug prescriptions be reviewed by a pharmacist with both experience and training in cancer treatment.

150
Chap
ter 3
• VF
M S
ectio
n 3.
02
and education of patients receiving at-home cancer drugs to ensure that patients understand their treatment and the importance of taking it as prescribed. The second tool teaches patients how to safely handle at-home cancer drugs and promotes adherence in the home/non-acute care setting. In addition, Cancer Care Ontario is supporting Regional Cancer Program initia-tives to increase access to an oncology provider who patients can call if they have concerns or questions. Some regional cancer centres have introduced follow-up programs to call, monitor and support patients at home.
Cancer Care Ontario also collaborated with the University of Toronto to develop training courses for pharmacists who dispense chemotherapy drugs, including take-home cancer drugs.
Finally, in 2017, Cancer Care Ontario estab-lished the Oncology Pharmacy Task Force, which is developing recommendations to ensure the safe and appropriate use of take-home can-cer drugs. Part of this work will be to develop best practice recommendations for pharmacists who dispense take-home cancer drugs. The task force’s report (to be submitted to the Ministry by March 2018) may recommend standardized specialized cancer-drug-therapy training for pharmacists. If so, Cancer Care Ontario would support making such training mandatory.
MINISTRY RESPONSE
The Ministry supports this recommendation and agrees that patients on take-home cancer drugs can be well-served by health-care professionals who are confident in providing good quality care, education and monitoring with the goal to optimize the benefits of therapy for patients.
The Ministry recognizes that it is part of the pharmacist’s responsibilities to ensure the safe use and handling of any medication, and that the right patient receives the right medication as prescribed in the appropriate doses. The phar-
macist also has the responsibility to educate the patient regarding the appropriate use of drugs. The competency of pharmacists is regulated by the Ontario College of Pharmacists (College), whose responsibilities include maintaining professional standards among pharmacists and holding pharmacists accountable to the estab-lished legislation and standards of practice of the profession.
The Ministry supports the recommendation that CCO work with the College to establish standards and training for pharmacists to deliver quality services on dispensing, counsel-ling, and safe handling of take-home cancer medications. As appropriate, CCO should work with the Ministry and hospitals to help support its work with the College.
4.3.4 No Oversight of Cancer Drug Therapy Provided at Private Specialty Clinics
Private specialty clinics can offer services including cancer drug infusion therapy to patients who are willing to pay out-of-pocket and/or through private insurance coverage; however, many of them are not regulated or licensed by the Ministry or CCO. Therefore, they are not subject to the same level of oversight and standards as hospitals when provid-ing cancer drug therapy. This can put patient safety at risk and affect quality of care.
Ontario regulates out-of-hospital premises where procedures are performed under various forms of anaesthesia and sedation. Ontario also licenses and regulates Independent Health Facili-ties, which perform surgical, therapeutic and diag-nostic procedures that are funded by OHIP. While some private specialty clinics may be regulated under one of these categories, many specialty pri-vate clinics do not fall under either category.
In Canada, each province decides the medical circumstances under which it will fund usage of intravenous cancer drugs approved by Health Can-ada—especially for drugs used to treat more than one type of cancer. For example, Bevacizumab is

151Cancer Treatment Services
Chap
ter 3
• S
ectio
n 3.
02
covered for treating colorectal cancer but not brain cancer in Ontario, while it is covered for both can-cers in British Columbia, Saskatchewan, Manitoba and Newfoundland and Labrador.
If patients need an intravenous cancer drug that is not funded by OHIP but has been approved as safe by Health Canada—for example, Bevacizumab for brain cancer treatment—their oncologist will sometimes refer them to a private specialty clinic. However, patients must be willing to pay out-of-pocket and/or have private insurance coverage. While the Ministry does not provide operating funding to these private specialty clinics, physicians working in these clinics receive professional fees from OHIP for providing services to patients.
In 2015/16, OHIP was billed by 105 physicians for about $1.4 million, covering approximately 20,000 cancer drugs and therapies delivered in private specialty clinics or in physician offices. Since Ontario has no specific legislation that regu-lates private health clinics or requires them to be licensed, the Ministry does not have any informa-tion on their operations, such as the number of clinics, their location, the types of services they provide, or their performance.
CCO requires facilities providing cancer drug therapy to have an onsite emergency department, but this requirement does not apply to private specialty clinics, because they are not regulated by the Ministry or CCO. In addition, there is no legal requirement that private specialty clinics use oncologists or nurses specialized in oncology to provide care. Cancer services at private specialty clinics may be provided by physicians and nurses with no specialized cancer training.
No other provinces regulate private health clin-ics in their jurisdictions either. However, Alberta has legislation that provides for accreditation of a wider range of health facilities, and its College of Physicians and Surgeons has the authority to inspect both accredited and non-accredited medical facilities.
The College of Physicians and Surgeons of Ontario (College) inspects out-of-hospital premises
and conducts assessments of Independent Health Facilities with a focus on the delivery of surgical, therapeutic and diagnostic procedures, as well as procedures performed under various forms of anaesthesia and sedation. However, the College does not have the authority to inspect or assess the delivery of cancer drug therapy at private specialty clinics.
RECOMMENDATION 5
To help ensure cancer patients receive safe cancer drug therapy, we recommend that the Ministry of Health and Long-Term Care:
• work with Cancer Care Ontario to evalu-ate the need to set standards and oversee delivery of cancer drug therapy at private specialty clinics; and
• work with the College of Physicians and Sur-geons of Ontario to evaluate the feasibility to include cancer drug therapy treatments in its inspections on private specialty clinics.
MINISTRY RESPONSE
The Ministry is currently moving forward with legislation that aims to include Independent Health Facilities, Out of Hospitals and Energy Applying and Detecting Medical Devices under a single regulatory framework that would, in part, create the flexibility to enable new facilities to be added to the legislative regime in the future. The new legislation will ensure access to qual-ity services in community health facilities, like clinics that perform chemotherapy infusions, regardless of whether they are publicly or pri-vately funded, by introducing new quality assur-ance measures and standards to ensure patient safety and the delivery of quality of care.
To bring private infusion clinics under the Community Health Facilities (CHF) regime, a regulation would have to be passed identifying infusion clinics or their services as CHF services for the purposes of making them subject to the legislation. In addition, an inspection body

152
Chap
ter 3
• VF
M S
ectio
n 3.
02
would be identified to develop standards, hire inspectors, conduct inspections, prepare inspec-tion reports and ensure compliance with quality and safety standards.
The Ministry will work with Cancer Care Ontario, the Ontario College of Pharmacists, the College of Physicians and Surgeons of Ontario and other stakeholders and experts to evaluate the need to create and enforce standards in can-cer drug therapy clinics.
4.3.5 Recommendations to Address Under-Dosing Incident Not Fully Implemented
In March 2013, four hospitals in Ontario informed about 1,000 of their cancer patients that they had received lower-than-intended doses of two cancer drugs during their intravenous chemotherapies. The under-dosing was estimated at 10% and 7% for cyclophosphamide and gemcitabine, respectively.
The Ministry subsequently conducted a review of the province’s cancer-drug supply system that concluded the incident was the result of significant inadequacies in the communication and implemen-tation of drug specifications and preparations.
In response to the review, the Safeguarding Health Care Integrity Act, 2014 (Act) was passed in 2014. The Act allows the Ontario College of Pharmacists to inspect and license hospital pharmacies in the province to ensure compliance with standards.
The Ministry review also included 12 recom-mendations to address the root cause of the incident and to prevent similar problems in future. While most of the recommendations have been addressed, we noted that one —to ensure traceabil-ity of computer-based clinic and hospital records for patients and their treatments—remains a concern according to the College’s 2016 inspections.
RECOMMENDATION 6
To better ensure cancer patients receive safe and accurate doses of cancer drugs, we recommend
that the Ministry of Health and Long-Term Care (Ministry) work with the Ontario College of Pharmacists and hospitals to implement the remaining recommendations from the Ministry’s review of the provincial cancer-drug-supply system, especially to address inadequacies in communication and implementation of drug specifications and preparations.
MINISTRY RESPONSE
The Ministry accepts this recommendation and will work with the College of Pharmacists and hospitals to implement the remaining recom-mendations from the Ministry’s review of the provincial cancer-drug-supply system.
4.3.6 Provincial Process to Manage Cancer Drug Shortages Needs Improvement
Shortages of drugs, including cancer drugs, have become a global issue. Causes include contamina-tion of raw materials, production delays, recalls, or production limits imposed by drug manufacturers. There have been at least three cancer drug short-ages in Canada since 2014.
In April 2014, the common cancer drug Pacli-taxel became scarce after Health Canada suspended a manufacturer for violations of standards. In fall 2014, manufacturing problems at two different pharmaceutical companies led to a shortage of the drug Bacillus Calmette-Guerin, used to treat bladder cancer. And in March 2017, a shortage developed of the drug 5-fluorouracil, used in a large number of cancer treatments, after Health Canada quarantined products made by its main supplier for possible damaged or leaking vials.
In June 2016, Health Canada introduced regulations for mandatory public reporting of drug shortages by manufacturers. Drug makers are now required to publicly provide six months’ advance notice for anticipated drug shortages or discontinuations, and five days’ public notice of unanticipated shortages.

153Cancer Treatment Services
Chap
ter 3
• S
ectio
n 3.
02
However, Ontario has established no clear provincial protocol or guideline that hospitals, CCO or the Ministry can use to manage drug shortages. Specifically, we found that:
• Nearly 78% of hospitals that responded to our survey indicated that the Ministry, LHINs and CCO should more actively provide help and guidance to hospitals during cancer-drug shortages. Another 84% said there should be a provincial lead to facilitate drug-sharing during shortages.
• Hospitals are responsible for contacting sup-pliers and other hospitals in their local areas to borrow drugs. While the Ministry informed us that LHINs are supporting local communi-cation among hospitals and hospital pharma-cies, we noted that there is no provincial network connecting all hospital pharmacies in Ontario to facilitate communication with each other. Nearly 88% of hospitals that responded to our survey indicated that there would be benefits to having a province-wide platform or network connecting all hospital pharmacies to facilitate sharing of drug inventory and infor-mation about shortages.
• While the Ministry, CCO and the LHINs have collaborated during drug shortages, indi-vidual physicians are ultimately responsible for deciding, based on published clinical guidelines and patient conditions, whether to prescribe an alternative drug or suspend treat-ment until the shortage ends. Our hospital survey showed that during the 2017 shortage of 5-fluorouracil, oncologists at 16% of hospi-tals prescribed other drugs.
• Neither the Ministry nor CCO have policies on the appropriate level of cancer-drug inventory that hospitals should keep on hand; inventory management of medications is the respon-sibility of individual hospitals. Our survey showed that 91% of hospitals had no formal written policies on maintaining minimum inventory levels for all cancer drugs. Instead,
inventories were based on actual usage, and replenished only when they ran low.
RECOMMENDATION 7
To help ensure a stable and effective supply of cancer drugs, we recommend that Cancer Care Ontario work with the Ministry of Health and Long-Term Care and hospitals to:
• improve the process for sharing information on drug shortages and inventory; and
• establish a protocol for communication, drug-sharing and prioritizing patients in the event of a cancer-drug shortage.
CANCER CARE ONTARIO RESPONSE
Cancer Care Ontario agrees that cancer patients should have access to a stable and effective sup-ply of cancer drugs.
Cancer Care Ontario currently maintains a web-based platform (collaboration site) for hos-pital pharmacies to share information on cancer drug shortages and inventory. Cancer Care Ontario will work with cancer treatment centres to promote more consistent use of the platform.
CCO will work with the Ministry to sup-port the management of cancer-related shortages—such as clinical guidance, includ-ing therapeutic alternatives, and possible prioritization approaches.
MINISTRY RESPONSE
Drug shortages have become a common issue in Ontario, across Canada, and globally, and they have the ability to significantly impact patients. The Ministry and Cancer Care Ontario support this recommendation to enhance and improve collaborations with our health partners, to build a proactive and responsive provincial framework that optimizes timely escalations, responses and solutions to anticipated cancer drug shortages to avoid or minimize patient impacts.
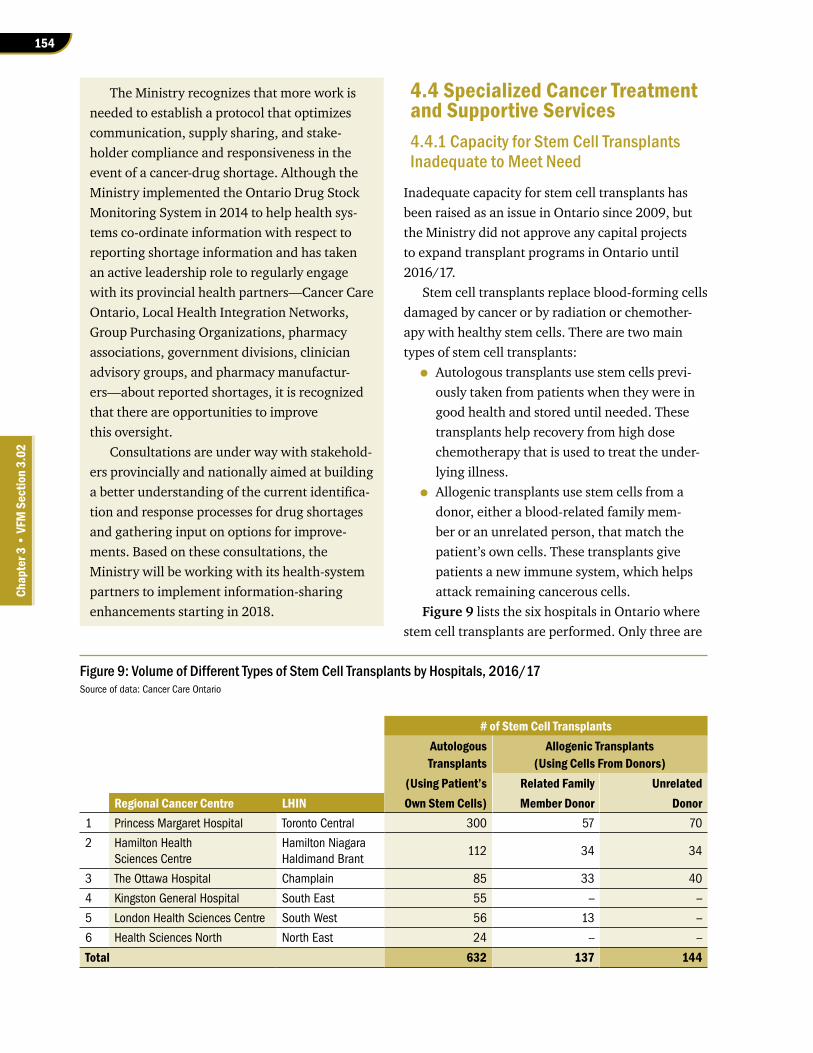
154
Chap
ter 3
• VF
M S
ectio
n 3.
02
The Ministry recognizes that more work is needed to establish a protocol that optimizes communication, supply sharing, and stake-holder compliance and responsiveness in the event of a cancer-drug shortage. Although the Ministry implemented the Ontario Drug Stock Monitoring System in 2014 to help health sys-tems co-ordinate information with respect to reporting shortage information and has taken an active leadership role to regularly engage with its provincial health partners—Cancer Care Ontario, Local Health Integration Networks, Group Purchasing Organizations, pharmacy associations, government divisions, clinician advisory groups, and pharmacy manufactur-ers—about reported shortages, it is recognized that there are opportunities to improve this oversight.
Consultations are under way with stakehold-ers provincially and nationally aimed at building a better understanding of the current identifica-tion and response processes for drug shortages and gathering input on options for improve-ments. Based on these consultations, the Ministry will be working with its health-system partners to implement information-sharing enhancements starting in 2018.
4.4 Specialized Cancer Treatment and Supportive Services4.4.1 Capacity for Stem Cell Transplants Inadequate to Meet Need
Inadequate capacity for stem cell transplants has been raised as an issue in Ontario since 2009, but the Ministry did not approve any capital projects to expand transplant programs in Ontario until 2016/17.
Stem cell transplants replace blood-forming cells damaged by cancer or by radiation or chemother-apy with healthy stem cells. There are two main types of stem cell transplants:
• Autologous transplants use stem cells previ-ously taken from patients when they were in good health and stored until needed. These transplants help recovery from high dose chemotherapy that is used to treat the under-lying illness.
• Allogenic transplants use stem cells from a donor, either a blood-related family mem-ber or an unrelated person, that match the patient’s own cells. These transplants give patients a new immune system, which helps attack remaining cancerous cells.
Figure 9 lists the six hospitals in Ontario where stem cell transplants are performed. Only three are
Figure 9: Volume of Different Types of Stem Cell Transplants by Hospitals, 2016/17Source of data: Cancer Care Ontario
# of Stem Cell TransplantsAutologous Allogenic TransplantsTransplants (Using Cells From Donors)
(Using Patient’s Related Family UnrelatedRegional Cancer Centre LHIN Own Stem Cells) Member Donor Donor
1 Princess Margaret Hospital Toronto Central 300 57 70
2 Hamilton Health Sciences Centre
Hamilton Niagara Haldimand Brant
112 34 34
3 The Ottawa Hospital Champlain 85 33 40
4 Kingston General Hospital South East 55 -- --
5 London Health Sciences Centre South West 56 13 --
6 Health Sciences North North East 24 -- --
Total 632 137 144

155Cancer Treatment Services
Chap
ter 3
• S
ectio
n 3.
02
equipped to perform all types of transplants. Over the last decade, advances in stem-cell matching and post-transplant care have resulted in more cancer patients eligible for transplants, particularly allogenic procedures.
In May 2015, clinical leaders of transplant centres wrote to the Ministry and CCO to declare a stem-cell crisis and a critical infrastructure shortage that affected the number of transplants they could perform. They said this led to growing wait lists, which resulted in patient relapses and deaths.
Lack of timely response by the Ministry and CCO between 2009 and 2015 to the growing demand for stem cell transplants, and delays in the launch of projects to expand capacity, led to excessive wait times, costly out-of-country transplants and poorer patient outcomes (see Section 4.4.2). Figure 10 provides a timeline for stem cell transplant events from 2009 to 2017.
Between 2011/12 and 2015/16, the Ministry increased operational funding to transplant centres by $19 million, but we noted that this increase cov-ered only the actual operational cost of performing
transplants. It did not take into consideration the significant capital investment required to expand capacity—more laboratory facilities, for example, to handle the sophisticated stem-cell matching pro-cedures required before transplants, and construc-tion of negative-pressure rooms to protect patients from infection after transplants. As a result, the number of transplants that hospitals could perform has remained restricted.
The hospitals informed us that there had been no provincial strategy for expanding stem cell transplant capacity. They looked to CCO and the Ministry for direction on increasing provincial transplant capacity—but we found that CCO and the Ministry had differing explanations. CCO, for example, indicated that it was not involved because the Ministry funds hospitals directly for capital expansions, and hospitals are responsible for capital-expansion planning, not CCO. For its part, the Ministry informed us that it received no capital-funding requests from the hospitals relating to transplant-capacity expansions.
Figure 10: Timeline of Stem Cell Transplant Events, 2009–2017Prepared by the Office of the Auditor General of Ontario
Year Significant Events2009 • CCO submits a report to the Ministry indicating a rapid increase in demand for transplants, and
recommends immediate expansion of transplant programs.
2010 • CCO establishes a Stem Cell Transplant Steering Committee made up of hospital representatives, clinical experts, patient representatives and CCO program management
2011–2012 • Hospitals begin reporting transplant data to CCO showing few transplants done within wait-time targets. • In December 2011, CCO Stem Cell Transplant Steering Committee finds that capacity and funding
limitations drove requests for costly out-of-country transplants between 2005 and 2010. It recommends that all adult transplants be done in Ontario and investment be made to build capacity in the province.
2012–2014 • Meeting minutes from CCO’s Stem Cell Transplant Steering Committee indicate that hospitals repeatedly expressed concerns about capacity issues, increased demand and long wait times.
• Transplant data continues to show that percentage of transplants performed within wait-time targets remain consistently low.
2015 • CCO and the Ministry receive a letter from clinical leaders at transplant centres declaring a stem cell crisis. • In response, CCO established a streamlined out-of-country referral process that began sending allogenic
transplant patients to the United States.• Four hospitals submitted capital project requests to the Ministry beginning in December 2015.
2016–2017• The Province continues to send more allogenic transplant patients to the United States.• The Ministry approves four capital projects to expand transplant programs in Ontario.

156
Chap
ter 3
• VF
M S
ectio
n 3.
02
While inadequate capacity for stem cell trans-plants has been raised as an issue since 2009, the Ministry, CCO and hospitals only developed a capital-investment plan in 2016 to address the issue. For example, we noted that:
• The Ministry approved capital-expansion projects at three hospitals (Princess Margaret Hospital in Toronto, Hamilton Health Sciences and The Ottawa Hospital) in 2016, seven years after the transplant capacity concern was first raised in 2009. These projects were expected to be completed by 2019/20.
• Similarly, the Ministry in 2016 approved Sunnybrook Health Sciences Centre in Toronto to become a new transplant centre, seven years after CCO recommended it. Sunnybrook is expected to start doing trans-plants in 2020/21.
The four capital expansions approved in 2016 require further approvals for each phase of the projects. However, these subsequent approvals have been delayed even through the Ministry indicated that stem cell capital projects are its top priority.
Figure 11 shows the estimated capacity and demand for allogenic (donor) stem cell transplants.
The capital projects approved by the Ministry at the time of our audit will not provide sufficient capacity to meet demand. Subsequent to our audit field-work, CCO informed us that the Ministry approved additional capital projects to address capacity con-cerns. However, capacity still will not meet demand in Ontario until after 2020/21.
Given the limited capacity for allogenic trans-plants in Ontario, Ontario has consistently per-formed fewer allogenic transplants per 10 million population than other jurisdictions (see Figure 12).
4.4.2 Long Wait Times for Stem Cell Transplants
Wait times for stem cell transplants have been consistently long since CCO began tracking them in 2011/12. CCO’s Stem Cell Steering Commit-tee, comprised of clinical experts, sets wait-time targets for stem cell transplants. For autologous transplants, wait time is measured from the start of cancer drug therapy to the date of transplant. For allogenic transplants, wait time is measured from the date a match is found to the date of transplant.
Figure 11: Estimated Capacity and Demand for Allogenic Stem Cell Transplants, 2015/16–2024/25Source of data: Cancer Care Ontario
Estimated capacity based on capital projects approved at the time of auditEstimated demand
Additional capacity based on new capital projects approved subsequent to audit
0
100
200
300
400
500
600
700
800
900
2015/16 2016/17 2017/18 2018/19 2019/20 2020/21 2021/22 2022/23 2023/24 2024/25
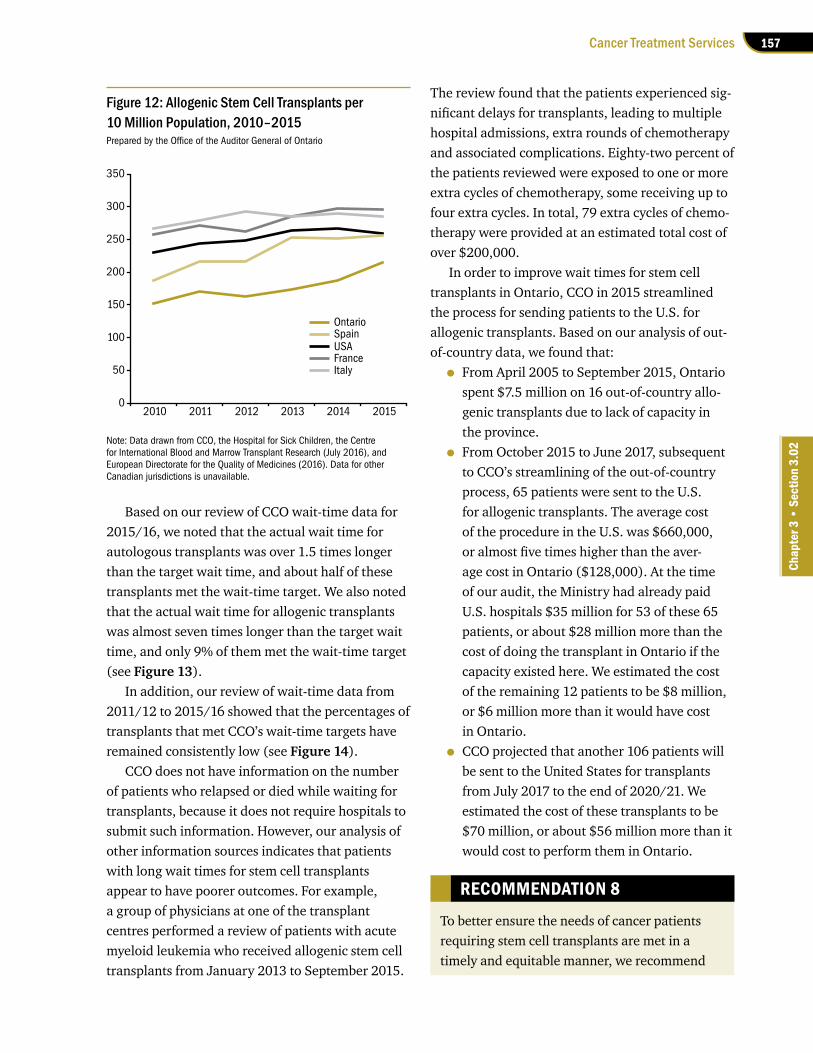
157Cancer Treatment Services
Chap
ter 3
• S
ectio
n 3.
02
Based on our review of CCO wait-time data for 2015/16, we noted that the actual wait time for autologous transplants was over 1.5 times longer than the target wait time, and about half of these transplants met the wait-time target. We also noted that the actual wait time for allogenic transplants was almost seven times longer than the target wait time, and only 9% of them met the wait-time target (see Figure 13).
In addition, our review of wait-time data from 2011/12 to 2015/16 showed that the percentages of transplants that met CCO’s wait-time targets have remained consistently low (see Figure 14).
CCO does not have information on the number of patients who relapsed or died while waiting for transplants, because it does not require hospitals to submit such information. However, our analysis of other information sources indicates that patients with long wait times for stem cell transplants appear to have poorer outcomes. For example, a group of physicians at one of the transplant centres performed a review of patients with acute myeloid leukemia who received allogenic stem cell transplants from January 2013 to September 2015.
The review found that the patients experienced sig-nificant delays for transplants, leading to multiple hospital admissions, extra rounds of chemotherapy and associated complications. Eighty-two percent of the patients reviewed were exposed to one or more extra cycles of chemotherapy, some receiving up to four extra cycles. In total, 79 extra cycles of chemo-therapy were provided at an estimated total cost of over $200,000.
In order to improve wait times for stem cell transplants in Ontario, CCO in 2015 streamlined the process for sending patients to the U.S. for allogenic transplants. Based on our analysis of out-of-country data, we found that:
• From April 2005 to September 2015, Ontario spent $7.5 million on 16 out-of-country allo-genic transplants due to lack of capacity in the province.
• From October 2015 to June 2017, subsequent to CCO’s streamlining of the out-of-country process, 65 patients were sent to the U.S. for allogenic transplants. The average cost of the procedure in the U.S. was $660,000, or almost five times higher than the aver-age cost in Ontario ($128,000). At the time of our audit, the Ministry had already paid U.S. hospitals $35 million for 53 of these 65 patients, or about $28 million more than the cost of doing the transplant in Ontario if the capacity existed here. We estimated the cost of the remaining 12 patients to be $8 million, or $6 million more than it would have cost in Ontario.
• CCO projected that another 106 patients will be sent to the United States for transplants from July 2017 to the end of 2020/21. We estimated the cost of these transplants to be $70 million, or about $56 million more than it would cost to perform them in Ontario.
RECOMMENDATION 8
To better ensure the needs of cancer patients requiring stem cell transplants are met in a timely and equitable manner, we recommend
Figure 12: Allogenic Stem Cell Transplants per 10 Million Population, 2010–2015Prepared by the Office of the Auditor General of Ontario
Note: Data drawn from CCO, the Hospital for Sick Children, the Centre for International Blood and Marrow Transplant Research (July 2016), and European Directorate for the Quality of Medicines (2016). Data for other Canadian jurisdictions is unavailable.
OntarioSpain
0
50
100
150
200
250
300
350
2010 2011 2012 2013 2014 2015
USAFranceItaly

158
Chap
ter 3
• VF
M S
ectio
n 3.
02
4.4.3 Inadequate Symptom-Management Support for Cancer Patients
Cancer patients in Ontario have not received adequate symptom-management support, which is important to help those with less severe symptoms avoid unnecessary visits to hospital emergency rooms.
A 2013 study published by Cancer Quality Council of Ontario (CQCO) found that worsening symptoms contributed to increased emergency-room visits. However, a 2014 study by CCO found that breast-cancer patients whose symptoms were monitored went to emergency rooms 43% fewer times than historical rates.
CCO developed a symptom-management survey tool that patients could use to identify and report on their symptoms to their hospital cancer-care teams. However, we noted that:
• CCO data from 2016 indicates 61% of cancer patients used the CCO survey tool at least once per month, less than the target rate of 70%.
• According to a 2016 Symptom Management Patient Experience Survey, about one in three cancer patients using the tool to report symp-toms indicated that their health-care teams did not discuss with them the symptoms they reported.
that the Ministry of Health and Long-Term Care work with Cancer Care Ontario and hospitals to assess the need for additional capital projects, and streamline and expedite the review and approval processes for capital funding to expand capacity for stem cell transplants in Ontario.
MINISTRY AND CANCER CARE ONTARIO RESPONSE
The Ministry and CCO have convened a consul-tation group composed of clinicians, administra-tors and patients and family representatives to assist the Ministry and CCO to plan for a multi-prong approach to increase stem cell transplant access and build in-province capacity. Consist-ent with this strategy, in the past two years, the Ministry has announced investments in capital funding for projects across five hospitals to expand stem cell transplant and acute leukemia capacity for patients. Cancer Care Ontario, hospitals and LHINs have worked closely with the Ministry to expedite the planning and con-struction of these projects. To ensure quality of the resulting patient-care facilities, compliance with health-care-space standards and prudent use of public funds, health service providers are required to undertake appropriate capital plan-ning steps, which takes time.
Figure 13: Wait Times for Stem Cell Transplants in Ontario, 2015/16Source of data: Cancer Care Ontario
Target 80th Percentile 80th PercentileWait Time Wait Time Wait Time Longer % of Transplants
Types of Stem Cell Transplants Volume (Days) (Days)1 than Target by: That Met Target2
Autologous—multiple myeloma3 341 161 234 1.5 times 44
Autologous—lymphoma4 and other cancers 64 203 359 1.8 times 56
Allogenic—related donors 112 42 285 6.8 times 9
Allogenic—unrelated donors 138 No Target 207 – –
1. 80th percentile wait time means that 80% of patients waited some amount of time up to this number of days while the remaining 20% of patients waited more than this number of days.
2. Percentage completed within target is benchmarked against 80%.
3. Multiple myeloma is a cancer of plasma cells, a type of white blood cell that normally produces antibodies.
4. Lymphoma is a cancer of the lymphatic system, which is part of the body's immune system.

159Cancer Treatment Services
Chap
ter 3
• S
ectio
n 3.
02
We analyzed data published by CQCO between 2010 and 2014, and noted that 51% of lymphoma patients, 47% of colon-cancer patients who received in-hospital drug therapy, and 44% of breast-cancer patients visited hospital emergency rooms at least once during their treatments.
More than 35% of these patients visited emer-gency rooms a second time, and more than 15% went a third time. Between 2010 and 2014, the number of emergency-department visits by these patients also increased by 21%. However, 72% of them were discharged after receiving treatment in the emergency room because their symptoms did not warrant admission to hospital.
CCO indicated that emergency rooms are not the most appropriate care setting for support, treatment or management of less severe cancer-related side effects. Instead, patients could have been treated at other areas within hospitals, such as Urgent Care Centres (UCCs), where patients can be treated for less severe symptoms. However, we found the availability of UCCs and telephone hotlines for cancer patients varied among hospitals. For example:
• Only half of the 14 regional cancer centres even have UCCs to help cancer patients man-age their symptoms.
• Ontarians have access to a registered nurse through Telehealth to get health advice or information over the phone 24 hours a day. However, Telehealth provides no oncology specialty to manage side effects of cancer treatment. Cancer patients are often directed to hospital emergency rooms for help, espe-cially after hours, when the regional cancer centres and oncology clinics at community hospitals are closed.
• A pilot project at the regional cancer pro-gram of Central LHIN provided after-hours symptom-management support to cancer patients through a dedicated telephone hotline staffed by an oncology nurse. The pilot project, which ran from August 2016 to April 2017, received a total of 460 calls, and only 7% of these warranted emergency-room visits. A survey found that about 40% of call-ers would otherwise have made unnecessary
Figure 14: Percentage of Stem Cell Transplants That Met Wait-Time Targets, 2011/12–2015/16Source of data: Cancer Care Ontario
Note: Since there is no wait-time target for unrelated-donor allogenic transplants, no analysis is possible.
Autologous—lymphoma and other cancersAllogenic—related donors
Autologous—multiple myeloma
30%34% 32%
44%
60%
49%54% 56%
4%
13%9% 10% 9%
Benchmark 80%
0%
10%
20%
30%
40%
50%
60%
70%
80%
90%
2011/12 2012/13 2013/14 2014/15 2015/16
44%42%
160
Chap
ter 3
• VF
M S
ectio
n 3.
02
emergency-department visits, and 90% of callers reported that the hotline was helpful. Due to positive results, the pilot was subse-quently expanded into a program covering 11 hospitals in five LHINs across the province. However, funding to continue this program after December 2017 was uncertain at the time of our audit.
We also found that Ontario lagged behind other jurisdictions with respect to symptom-management support. For example:
• Cancer Care Manitoba launched a UCC clinic and a centralized hotline for cancer patients in 2013. According to the Government of Mani-toba, the clinic and the hotline helped avoid an estimated 13 hospitalizations and more than 100 emergency-room visits in its first few weeks of operation. In addition, average wait time at the UCC clinic was only 25 minutes, compared to an average of two hours at Mani-toba emergency rooms.
• Johns Hopkins Hospital in Baltimore launched its UCC for cancer patients in 2014, and reported that hospitalizations of cancer patients subsequently dropped by 50%.
RECOMMENDATION 9
To better ensure cancer patients’ symptoms are monitored, managed and treated properly and in a timely manner, we recommend that Cancer Care Ontario work with hospitals to assess symptom-management programs in other jurisdictions and determine whether similar programs can be implemented in Ontario to divert cancer patients from emergency rooms.
CANCER CARE ONTARIO RESPONSE
Cancer Care Ontario agrees with this recom-mendation and will continue to work to improve symptom-management programs for cancer patients across Ontario.
This work is aided by an electronic patient survey tool, which empowers patients to report
their symptoms in real-time. The tool has been implemented in over 90 hospitals. Using this tool, to date 350,000 unique patients have been screened and 6.5 million assessments have been completed.
Cancer Care Ontario recognizes that more work needs to be done, however, and has high-lighted the need for additional investments to adequately manage and properly treat patients’ symptoms related to their cancer. A proposal has been submitted to the Ministry on this topic.
In 2014/15, Cancer Care Ontario completed scans of programs in other jurisdictions and is now working with researchers to determine an optimal model of care. Pending additional investment, Cancer Care Ontario will work with Regional Cancer Programs to spread and scale best practice initiatives (for example, 24/7 access to an oncology provider by phone or an urgent-care clinic within the cancer centre; home monitoring of symptoms; self-management support; and coaching). The aim is to decrease avoidable emergency department visits and unplanned admissions.
4.4.4 Insufficient and Inconsistent Psychosocial Oncology Services for Cancer Patients
Cancer patients in Ontario have not received sufficient psychosocial oncology services, which are provided by such specialists as psychiatrists, social workers, occupational therapists, physio-therapists, registered dietitians, psychologists and speech-language pathologists.
According to the Canadian Association of Psychosocial Oncology’s Standards of Psychosocial Health Services for Persons with Cancer and their Families, all patients entering the cancer system require some level of psychosocial services. The Standards also say that about 35% to 40% of cancer patients require specialized intervention from psychosocial oncology professionals to manage symptoms or psychosocial distress. However, CCO

161Cancer Treatment Services
Chap
ter 3
• S
ectio
n 3.
02
surveyed indicated that they mostly provided psychosocial services to cancer patients only at the treatment stage due to lack of funding and resources.
RECOMMENDATION 10
To help ensure cancer patients receive sufficient and consistent psychosocial services across the province, we recommend that Cancer Care Ontario work with hospitals to:
• develop and implement a long-term strategy to finance and expand psychosocial oncology services available to cancer patients; and
• establish provincial standards for the deliv-ery of psychosocial services in Ontario.
MINISTRY AND CANCER CARE ONTARIO RESPONSE
Cancer Care Ontario agrees that psychosocial oncology (PSO) services are an essential com-ponent of care for cancer patients and their fam-ilies, and we are continuing to work to improve access to these services.
PSO resources have been embedded in several funding models (for example, systemic treatment quality based procedure, stem cell transplant and acute leukemia) and will be included in future models developed by Cancer Care Ontario. However, Cancer Care Ontario recognizes that more resources are required. By March 2019, Cancer Care Ontario will have completed work with hospitals to understand the extent of the gap between funding allocated to hospitals by Cancer Care Ontario and the hos-pitals’ investments in PSO services. Cancer Care Ontario will then work with hospitals and the Ministry to adjust current funding mechanisms where appropriate.
Cancer Care Ontario has developed recom-mendations for the delivery of PSO services in Ontario (currently being reviewed by external PSO experts). The goal of the recommendations is to ensure the range of necessary PSO services
data indicated that in 2016/17, only 5.8% and 6.6% of cancer patients received consultations from dietitians and social workers, within the cancer centre, respectively.
Dietitian services are particularly important for head-and-neck-cancer patients, who are at high risk for malnutrition. Early intervention can minimize weight loss, reduce symptoms (such as nausea, vomiting and dry mouth) and reduce admission to hospital. CCO’s clinical practice guidelines require that at least 80% of head-and-neck patients receive dietitian services within two weeks of starting can-cer treatment. However, only 60% of these patients actually received the service.
We also found that psychosocial oncology services were not consistently available across the province, especially in terms of scope and level of service:
• Scope of Service: A 2016 CCO survey showed that more than half of the regional cancer centres did not have a dedicated psychiatrist, occupational therapist, psychologist, speech language pathologist or physiotherapist on site. Social workers and dietitians were the only psychosocial oncology providers consist-ently available at all regional cancer centres. Our analysis of actual 2015/16 expenditures found that regional cancer centres received $14.4 million from CCO for psychosocial services, but Ministry data showed that only $10.8 million was spent on those services.
• Level of Service: Psychosocial care can be administered along all phases of cancer, from screening, diagnosis and treatment, through to post-treatment and end-of-life care. However, the level of psychosocial services available varies from centre to centre based on funding, resources and local priorities. Our survey of regional cancer centres shows that 89% of them offered psychosocial services to patients at all stages of the can-cer journey, including post-treatment and end-of-life stages. However, more than half (54%) of the other community hospitals we

162
Chap
ter 3
• VF
M S
ectio
n 3.
02
are provided consistently and in a timely fash-ion to all cancer patients and their families in Ontario who require them. This service delivery framework will serve as the backbone to assess and measure the delivery of PSO services within each Regional Cancer Programs.
4.5 Cancer Diagnostic Procedures 4.5.1 Ontario Slow to Adopt Advances in Positron Emission Tomography (PET) Scans
Positron emission tomography (PET) scans, which inject radioactive substances in the body to cre-ate detailed images, have become an increasingly important diagnostic tool in other jurisdictions. We found that PET scans that are insured under OHIP generally meet the needs of Ontarians. For example, in 2015, 81% of patients with a specific type of lung cancer received a PET scan prior to treatment. However, Ontario has not updated eligibility criteria or OHIP coverage rules for PET scans since 2013 and has been slow to adopt new radioactive tracers although a number of them are now available in other jurisdictions.
PET scans can show changes in biochemical pro-cesses before they become visible to other imaging tools such as CT scans or MRIs. PET scans are used mainly to diagnose and classify a cancer’s stage in order to determine treatment.
Ontario has one PET scanner and 12 PET/CT scanners, the latter being more advanced machines that make a PET scan first, then a CT scan, and then merge the two images using specialized software. In 2016/17, more than 13,000 PET scans were performed in Ontario, almost all of them (96%) on cancer patients.
Based on our analysis of PET scan rates in Ontario and other jurisdictions, we found that Ontario’s rate was lower than most other countries, including Canada as a whole (see Figure 15). According to the Canadian Agency for Drugs and Technologies in Health, an independent, not-for-profit organization created by the Government of Canada, Ontario performed fewer PET scans per 1,000 people than any other Canadian province (see Figure 16).
Our analysis of CCO data indicated that 41% of the province’s PET scan capacity was unused in 2016/17, suggesting that more patients could
Figure 15: PET Scan Rate per 1,000 Population in Ontario and Other Jurisdictions, 2014Source of data: Organization of Economic Co-operation and Development, Cancer Care Ontario
Note: PET scan data for other jurisdictions from the Organization of Economic Co-operation and Development. PET scan data for Ontario from CCO.
0
1
2
3
4
5
6
7
8
Finl
and
Ont
ario
Slov
ak R
epub
lic
Hung
ary
Turk
ey
Pola
nd
Cana
da
Spai
n
Czec
h Re
publ
ic
Luxe
mbo
urg
Net
herla
nds
Unite
d St
ates
Isra
el
Den
mar
k
Kore
a
Aust
ralia
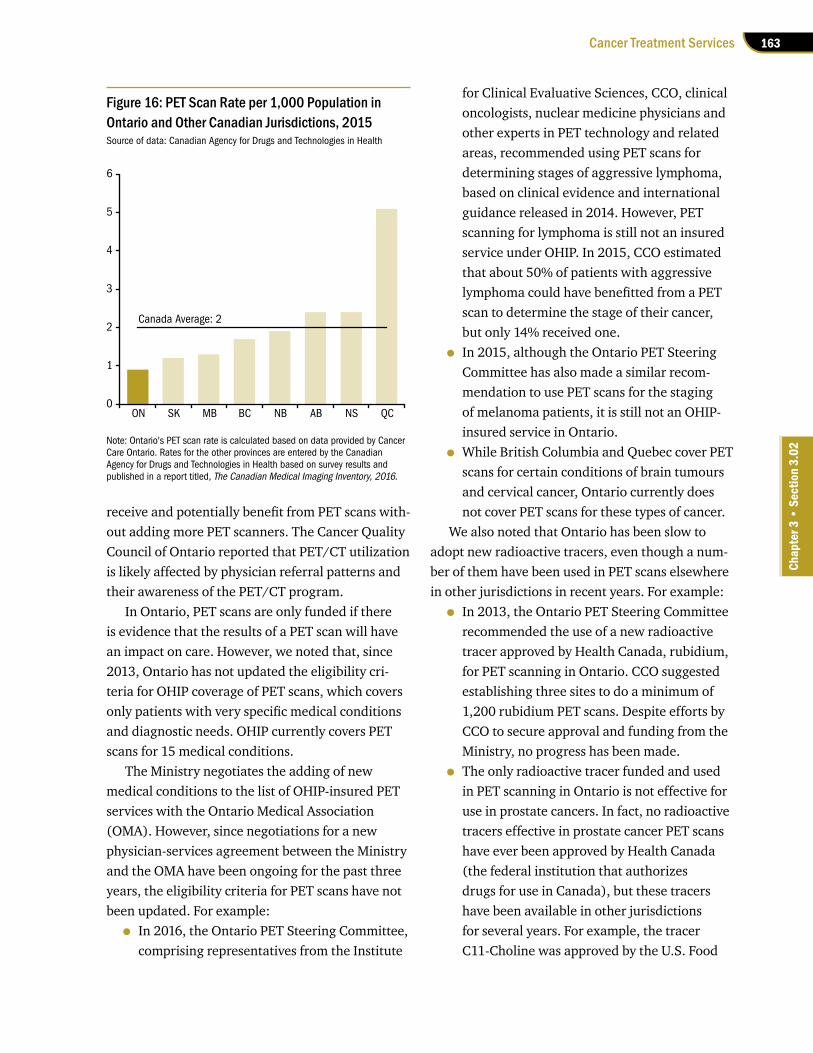
163Cancer Treatment Services
Chap
ter 3
• S
ectio
n 3.
02
receive and potentially benefit from PET scans with-out adding more PET scanners. The Cancer Quality Council of Ontario reported that PET/CT utilization is likely affected by physician referral patterns and their awareness of the PET/CT program.
In Ontario, PET scans are only funded if there is evidence that the results of a PET scan will have an impact on care. However, we noted that, since 2013, Ontario has not updated the eligibility cri-teria for OHIP coverage of PET scans, which covers only patients with very specific medical conditions and diagnostic needs. OHIP currently covers PET scans for 15 medical conditions.
The Ministry negotiates the adding of new medical conditions to the list of OHIP-insured PET services with the Ontario Medical Association (OMA). However, since negotiations for a new physician-services agreement between the Ministry and the OMA have been ongoing for the past three years, the eligibility criteria for PET scans have not been updated. For example:
• In 2016, the Ontario PET Steering Committee, comprising representatives from the Institute
for Clinical Evaluative Sciences, CCO, clinical oncologists, nuclear medicine physicians and other experts in PET technology and related areas, recommended using PET scans for determining stages of aggressive lymphoma, based on clinical evidence and international guidance released in 2014. However, PET scanning for lymphoma is still not an insured service under OHIP. In 2015, CCO estimated that about 50% of patients with aggressive lymphoma could have benefitted from a PET scan to determine the stage of their cancer, but only 14% received one.
• In 2015, although the Ontario PET Steering Committee has also made a similar recom-mendation to use PET scans for the staging of melanoma patients, it is still not an OHIP-insured service in Ontario.
• While British Columbia and Quebec cover PET scans for certain conditions of brain tumours and cervical cancer, Ontario currently does not cover PET scans for these types of cancer.
We also noted that Ontario has been slow to adopt new radioactive tracers, even though a num-ber of them have been used in PET scans elsewhere in other jurisdictions in recent years. For example:
• In 2013, the Ontario PET Steering Committee recommended the use of a new radioactive tracer approved by Health Canada, rubidium, for PET scanning in Ontario. CCO suggested establishing three sites to do a minimum of 1,200 rubidium PET scans. Despite efforts by CCO to secure approval and funding from the Ministry, no progress has been made.
• The only radioactive tracer funded and used in PET scanning in Ontario is not effective for use in prostate cancers. In fact, no radioactive tracers effective in prostate cancer PET scans have ever been approved by Health Canada (the federal institution that authorizes drugs for use in Canada), but these tracers have been available in other jurisdictions for several years. For example, the tracer C11-Choline was approved by the U.S. Food
Figure 16: PET Scan Rate per 1,000 Population in Ontario and Other Canadian Jurisdictions, 2015Source of data: Canadian Agency for Drugs and Technologies in Health
Note: Ontario's PET scan rate is calculated based on data provided by Cancer Care Ontario. Rates for the other provinces are entered by the Canadian Agency for Drugs and Technologies in Health based on survey results and published in a report titled, The Canadian Medical Imaging Inventory, 2016.
Canada Average: 2
0
1
2
3
4
5
6
ON SK MB BC NB AB NS QC
164
Chap
ter 3
• VF
M S
ectio
n 3.
02
and Drug Administration for use in PET scans for prostate cancer in 2012. A newer tracer to detect prostate-specific membrane antigen in PET imaging has been used in the United Kingdom since 2016. However, neither of these radioactive tracers has been approved by Health Canada.
Recognizing the benefits as well as the limita-tions of PET scans for prostate cancer in Ontario, the Province has been sending some patients out-of-country since 2014 to get PET scans in other jurisdictions that use the newer radioactive tracers. Patients are approved on a case-by-case basis, and the cost of the scans is covered through the Ministry’s out-of-country program. We noted that the cost of these out-of-country PET scans is significant—our analysis of data between 2014 and 2016 found that the average out-of-country cost was about $8,500, which is likely to be higher than the cost of providing the service in Ontario.
Since new radioactive tracers are not being used in Ontario, CCO expected that the volume of out-of-country requests for PET scans with these radioactive tracers will increase. In 2016, CCO sub-mitted a report to the Ministry to highlight the risks of Ontario not being able to meet the growing need for PET scans and to remain up-to-date according to the best available clinical evidence.
RECOMMENDATION 11
To better ensure that cancer patients benefit from PET scans for diagnosis and treatment, we recommend that the Ministry of Health and Long-Term Care work with Cancer Care Ontario to:
• streamline and expedite the processes for adopting and funding new radioactive tracers in PET scanning, including updating the eligibility criteria for OHIP-insured PET scan services; and
• increase awareness of the availability of PET scanning and its usage in some clinical scenarios.
MINISTRY RESPONSE
The Ministry accepts this recommendation and will make best efforts to work with our partners, including Cancer Care Ontario, to adopt and fund new indications for PET scanning, includ-ing the use of new radioactive tracers. The eligibility criteria for OHIP-insured PET scan services may be updated as part of the negotia-tions between the OMA and the Ministry.
CANCER CARE ONTARIO RESPONSE
Cancer Care Ontario agrees with this recom-mendation and has been working with the Min-istry to streamline and expedite the processes for adopting and funding new technologies in PET scanning.
The Ministry is transitioning oversight of all insured PET services to Cancer Care Ontario. This will include funding for new technologies, which will expedite the processes for adopting new technologies.
To address gaps in the use of PET scanning for clinical scenarios where it has been recom-mended for use in Ontario, Cancer Care Ontario will continue to leverage its provincial clinical advisory networks and partnerships with relevant stakeholders to improve referring phys-ician awareness, as well as identify and address potential barriers to patient access.
4.5.2 Significant Regional Variations in Wait Times for CT Scans and MRIs
Computerized tomography (CT) scans and mag-netic resonance imaging (MRIs) are two of the most common diagnostic-imaging procedures for cancer patients.
CT scanning uses a computer linked to an x-ray machine, while MRIs use a magnetic field and pulses of radio waves, to produce images of areas (such as organs, soft tissues and bones) inside the body.

165Cancer Treatment Services
Chap
ter 3
• S
ectio
n 3.
02
CT scans and MRIs performed in Ontario are classified according to four priority levels: emer-gency, urgent, less urgent, and non-urgent. Cancer-related imaging procedures are rarely prioritized as emergency, and mostly fall under less urgent. We reviewed wait-time data related to urgent, less urgent and non-urgent cancer-related CT scans and MRIs from 2012/13 to 2016/17 and found that:
• The percentage of cancer-related CT scans performed within the Ministry’s wait-time targets decreased from 64% to 59% over that period. In particular, in 2016/17, 48% of patients did not receive their less urgent CT scans within wait-time target of 10 days. We also found that the 90th percentile wait time for less urgent cases was 31 days—more than three times longer than target. This means that 10% of patients waited longer than 31 days, and 90% waited some amount of time under 31 days. We also noted that CT scans for non-cancer patients were completed within wait-time targets more often than for cancer patients.
• The percentage of cancer-related MRIs per-formed within the Ministry’s wait-time targets decreased from 56% to 51%. In particular, in 2016/17, 47% of less urgent MRIs for cancer patients were not completed within the wait-time target of 10 days. We also found that the 90th percentile wait time for less urgent cases was 37 days—almost four times longer than target. This means that 10% of patients waited longer than 37 days, and 90% waited some amount of time under 37 days.
We also reviewed funding data for diagnostic procedures in the past five years. In May 2017, the Ministry announced one-time MRI funding for 2017/18 of $7.3 million, of which $2.5 million was targeted toward cancer-staging and diagnosis.
However, we questioned the effectiveness of one-time funding, which helps reduce wait times temporarily, but has not led to sustained wait-time reductions. Between 2010/11 and 2013/14, the Ministry provided hospitals with similar one-time
funding totalling $15 million, which did temporar-ily reduce wait times for MRIs through 2013/14. But wait times have been on the rise again since then. Hospitals we visited informed us that one-time funding can create difficulties in hiring and training as hospitals must ramp up staff to accom-modate additional funded hours—and then ramp down again when the funding ends.
Since cancer-related imaging procedures mostly fall under the less urgent category, we analyzed wait times for CT scans and MRIs done in 2016/17 in this category and noted that cancer patients experienced significant variations in wait times, depending on the hospital. In addition, many waited longer than the Ministry’s target of 10 days. For example:
• The 90th percentile wait time was 49 days for CT scans at one hospital, compared to 11 days at another in the same LHIN and just five kilometres away.
• The 90th percentile wait time was 50 days for CT scans at one hospital, compared to 12 days at another 25 kilometres away.
• The 90th percentile wait time was 29 days for MRIs at one hospital, compared to 10 days at another in the same LHIN and 20 kilometres away.
• The 90th percentile wait time was 42 days for MRIs at one hospital, compared to 15 days at another 25 kilometres away.
The significant wait-time variations were due mainly to the lack of a centralized referral and booking system to help smooth volumes among hospitals across the province and within LHINs. We noted that only three of the 14 LHINs were in the process of planning and implementing a centralized referral and booking system for CT scans and MRIs.
RECOMMENDATION 12
To better ensure cancer patients receive timely and equitable access to CT scans and MRIs, we recommend that the Ministry of Health and

166
Chap
ter 3
• VF
M S
ectio
n 3.
02
hip and knee, and the Interprofessional Spine Assessment and Education Clinics for acute low back pain.
These models create a process where primary-care providers have one point of contact for all referrals, surgical wait lists are managed centrally, and patients are rapidly tri-aged to the most appropriate provider. Patients who require specialist care are given their choice of surgeon or next available appoint-ment. Patients who do not require surgery are supported with education, self-management plans and referrals to community services for conservative management.
Recognizing that the musculoskeletal mod-els of care offer a way to manage demand for critical health services by improving appropri-ateness of referrals, the Ministry is monitoring local efforts to test central intake for other areas of high demand services, including diagnostic imaging. The Ministry is also supporting the expansion of tools and supports, like eReferral, to improve appropriateness of diagnostic-imaging referrals, and reduce demand growth for MRI and CT scans.
4.5.3 No Provincial Peer Review Program for Diagnostic-Imaging Results
Peer review of diagnostic-imaging results remains inadequate even though misinterpretation of such images has resulted in past cancer cases going undiagnosed several years ago.
A 2013 review of a radiologist’s work at one hospital uncovered issues related to about 600 CT scans, some of which involved undiagnosed can-cers. Due to the progressive nature of some cancers, misinterpretation of scans can have severe conse-quences for patients whose cancer is diagnosed later, after it has become more advanced.
To address this issue, the Ministry in 2013 confirmed that peer review is an effective method for enhancing safety and accuracy in diagnostic imaging in many jurisdictions around
Long-Term Care work with Cancer Care Ontario and hospitals to:
• analyze the reasons for delays in schedul-ing CT scans and MRIs and take corrective actions to reduce wait times for cancer patients; and
• implement centralized referral and book-ing processes for cancer-related CT scans and MRIs.
MINISTRY RESPONSE
The Ministry works closely with the Diagnostic Imaging Access To Care (DI-ATC) group at Can-cer Care Ontario to examine and understand the causes of scheduling delays and long wait times for imaging services. Through knowledge sharing, LHINs and hospitals are provided with recommendations to improve patients wait lists and reduce queue lengths on a regular basis.
In addition, the DI-ATC group has identi-fied key patient cohorts, which include cancer patients, for whom targeted funding will help reduce wait times. Acting on this advice, in 2017/18, the Ministry provided LHINs with funding to help reduce wait times for MRIs for cancer patients. The 90th percentile wait times of priority level 2-4 [urgent, less urgent and non-urgent] cancer patients have declined from 54 days in March 2017 to 48 days in August 2017. Further improvements in wait times are expected in the third quarter and fourth quarter of 2017/18.
Both the Ministry and Cancer Care Ontario accept the recommendation to establish centralized referral and booking processes, which would be part of an overall co-ordinated programmatic approach to address the appro-priateness and timeliness of imaging in Ontario. The Ministry is currently in the process of roll-ing out across Ontario musculoskeletal intake, assessment and management models that include leveraging existing models of care, such as Central Intake and Assessment Centres for

167Cancer Treatment Services
Chap
ter 3
• S
ectio
n 3.
02
the world. The Ministry also confirmed that a province-wide physician-peer-review program would be implemented in all facilities that offer diagnostic imaging.
A June 2015 Health Quality Ontario report outlined an implementation plan for a structured, mandatory province-wide peer-review program, but we noted that the Ministry has taken no steps to date to implement it.
Our survey of hospitals showed that 48% did not perform regularly scheduled peer reviews of diagnostic images. The main reasons for this include a lack of radiologists, funding issues and a lack of guidance on how to implement peer-review programs.
RECOMMENDATION 13
To better ensure cancer patients receive quality diagnostic-imaging services, we recommend that the Ministry work with Cancer Care Ontario and the hospitals to implement a province-wide mandatory peer-review program based on the recommendations of Health Quality Ontario.
MINISTRY RESPONSE
The Ministry accepts this recommendation and will work with Health Quality Ontario and other partners to implement a province-wide mandatory peer-review program for diagnostic imaging.
4.5.4 Long Wait Times for Cancer Patients to Receive Biopsy
Biopsies are a common procedure to diagnose can-cer by taking a sample of tissue or cells for testing. Biopsies can be performed in clinics, or in proced-ure rooms or operating rooms of hospitals.
In 2016/17, about 9% of biopsies (22,000) were performed in hospital operating rooms because they required more invasive surgery, larger tissue samples and the use of anaesthetic. The remaining
91% were less invasive and performed in clinics or hospital procedure rooms.
Based on our review of the best available wait-time data for biopsies performed in hospital operat-ing rooms, we found that fewer than half (46%) of those performed in 2016/17 met the Ministry’s tar-geted wait time of 14 days, with the 90th percentile wait time being 78 days —almost six times longer than target. This means that 10% of patients wait longer than 78 days and 90% waited some amount of time under 78 days.
Of the common types of cancer, biopsies for colorectal cancers had the longest wait times, with the 90th percentile wait time being 125 days, or almost nine times longer than the Ministry’s target of 14 days (see Figure 17). Over the last five years, wait times remained long and did not meet the Ministry’s targets.
Although CCO has regularly collected biopsy wait-time data since 2006, it still has not confirmed the completeness and accuracy of this data, and has not compared it to its wait-time targets.
We also noted that limited wait-time data is available in Ontario, because CCO only tracked wait times for biopsies performed in hospital
Figure 17: Wait Time for Biopsies by Types of Cancers, 2016/17 (Days)Source of data: Cancer Care Ontario
Note: Wait times measured for 90% of cases.
35
125
28
60 58
Target:14 days
0
20
40
60
80
100
120
140
Breast Colorectal Lung Genitourinary(includingProstate)
All OtherCancers

168
Chap
ter 3
• VF
M S
ectio
n 3.
02
operating rooms, not those done in clinics or hos-pital procedure rooms. In addition, CCO has not publicly reported wait times of biopsies performed in hospital operating rooms.
After a sample of tissue is taken, it must be sent to a laboratory for analysis. We noted that the turnaround time for biopsy results is generally close to the provincial wait-time target. In 2016/17, 83% of patients received biopsy results within the provincial wait-time target of 14 days, with the 90th percentile wait time being 18 days.
RECOMMENDATION 14
To better ensure cancer patients receive timely diagnostic services, we recommend that the Ministry of Health and Long-Term Care work with Cancer Care Ontario and the hospitals to:
• regularly track and monitor wait times of biopsies performed in clinics and hospital procedure rooms, as well as those done in hospital operating rooms; and
• develop strategies to reduce the wait times for biopsies performed in hospital operating rooms.
MINISTRY AND CANCER CARE ONTARIO RESPONSE
The Ministry and Cancer Care Ontario agree that timely access to biopsy services is an important component of quality care.
Cancer Care Ontario’s initial focus for cancer surgery was aimed at improving wait times for treatment. Now, working with our Regional Cancer Program partners, Cancer Care Ontario is expanding our focus to a multi-year initiative focused on biopsy procedures. The project will focus on improving the quality and completeness of data about biopsies performed in hospitals; helping hospitals submit the data appropriately; and upgrading the Wait Time Information System. As each phase of work is completed, we will use the data to reduce the
wait times for biopsies performed in hospital operating rooms.
Due to the complexity, location and resour-ces involved, it may not be feasible to capture biopsy data performed in clinics outside of hospitals. The Ministry and Cancer Care Ontario will explore strategies in this area in 2018/19.
4.6 Funding Cancer-Treatment Services 4.6.1 Inequitable Funding for Radiation Services among Hospitals
In Ontario, both the Ministry and CCO fund hospitals for radiation services, but they do not use a consistent method or rate to determine amounts, which results in inequitable funding among hospitals.
Seventeen hospitals were funded $213 million to provide radiation treatment in 2015/16. The Ministry paid about $115 million of this and CCO $98 million.
Inconsistent Funding Methodologies UsedFigure 18 shows different funding methods for radiation services, depending on the hospital and on whether funding comes from the Ministry, CCO, or both. We observed that:
• Ten hospitals receive funding from both CCO and the Ministry, which provides additional money to hospitals that are expanding or have expanded their radiation capacity.
• Four hospitals receive funding only from CCO.
• Three hospitals receive funding only from the Ministry.
Typically, a cancer patient receives only one initial consultation, but can have more than one course of radiation treatment over several visits. Thus, funding based on the number of consulta-tions could be significantly different than that based on the number of radiation treatments or visits.

169Cancer Treatment Services
Chap
ter 3
• S
ectio
n 3.
02
visits, to CCO’s funding, which is based on consulta-tions, we estimated that the Ministry’s funding rate was equivalent to about $6,200 per consultation, or about 1.7 times more than the CCO’s rate of $3,700 per consultation.
CCO acknowledged that the current funding approach for radiation treatment is not based on the activities at hospitals, does not consider the complexity of cases, and needs to be revised to ensure that hospitals are funded consistently and equitably.
Funding for Radiation Treatment Not Based on Services Provided
CCO provides funding to 13 hospitals based on the number of consultations. However, we noted that this funding method is not appropriate because hospitals are not funded based on actual radiation treatments provided to patients.
Radiation funding from CCO is intended to cover the average cost of all radiation-related services, including consultation, treatment and follow-up care. Since OHIP pays oncologists directly for consultations with patients, hospitals incur the majority of the costs after radiation treatment actually begins.
In 2015/16, CCO funded 14 hospitals for radia-tion services, 13 of them based on the number of radiation consultations, and one on the number of radiation courses delivered. The one hospital funded based on radiation courses received about $4.9 million for treating about 600 cases. If CCO had instead funded these treated cases based on radiation consultations, we estimated that it would have received about $2.6 million, or just over half of what it actually got. We also noted that this hos-pital, unlike the other 13 hospitals, did not receive funding for consultations that did not proceed to treatment (discussed below).
In 2015/16, 12 hospitals that expanded existing facilities or built new ones received radiation fund-ing from the Ministry through a capital program that also provided operational funding to treat additional patients. However, unlike CCO, the Min-istry funded these hospitals based on the number of patient visits, not the number of radiation consulta-tions or treatments.
We also noted that the Ministry used a signifi-cantly higher funding rate than CCO. For example, in 2015/16, the Ministry provided one hospital about $17.5 million in total radiation funding based on the number of patient visits. When we converted the Ministry’s funding, which is based on patient
Figure 18: Different Methods Used to Fund Radiation CasesPrepared by the Office of the Auditor General of Ontario
Funding SourceCCO ($98 million) Ministry ($115 million)
Based on # of Based on # of Based on # of Through Hospital’sConsultations1 Radiation Courses2 Patient Visits3 Overall Budget
# of Hospitals ($ million) ($ million) ($ million) ($ million)9 52.1 43.5
4 41.1
3 42.3
1 4.9 28.8
Total 93.2 4.9 85.8 28.8
1. A consultation is a clinical visit by a patient with a specific diagnosis to a physician at a specific hospital.
2. A radiation course is a consecutive series of scheduled radiation treatments with a distinct radiation dose.
3. A patient visit is actual radiation treatment and any planning visits, including preparation of anti-radiation mask, radiation simulation, dosage assessment, radiation review, and post-treatment follow-up.

170
Chap
ter 3
• VF
M S
ectio
n 3.
02
MINISTRY AND CANCER CARE ONTARIO RESPONSE
Under the current Cancer Care Ontario radia-tion funding model, hospitals receive a payment based on the average cost of caring for a patient from consultation through radiation treatment and follow-up (and any re-treatments due to recurrence of disease). This model acknow-ledges that while some patients may receive only consultation, others will receive multiple courses of treatment.
The Ministry has a different funding model for eligible hospitals, the Post Construction Operating Plan (PCOP), which funds radiation treatment on a per visit rate. A patient visit is actual radiation treatment and any planning visits, including preparation of anti-radiation mask, radiation simulation, dosage assess-ment, and radiation review and post-treatment follow-up. The PCOP typically uses a hospital’s historical costs or that of a comparator hospital to arrive at a rate per radiation visit.
Both the Ministry and Cancer Care Ontario agree that a new, single radiation funding model should be implemented to fund all hospitals and is evaluating approaches for this funding model. This revised approach would apply consistently to all radiation treatment activity and eliminate issues of multiple funding models. By March 2018, Cancer Care Ontario will submit a business plan to the Ministry for consideration of a new funding model for radiation services. Pending Ministry approval, the implementation of the new model would ensure consistent rates across all hospitals offer-ing radiation treatment and reflect variation in complexity of care delivered.
We reviewed CCO data for 2014/15 and noted that the current funding method based on the aver-age cost does not equitably address the multiple scenarios where some patients do not go on to treatment while other patients receive more than one course of treatment. For example:
• Hospitals received funding for consultations that did not proceed to treatments. Province-wide about 30% of patients who had con-sultations with radiation oncologists did not proceed to treatments within about two years following the consultation. We estimated that CCO paid hospitals about $30 million (about one-third of its total radiation expenditures) for these consultations in 2015/16, even though the hospitals incurred limited direct costs. The percentage of consultations that did not proceed to radiation treatment also varied across cancer centres. For example, one hospital provided about 920 consultations in 2014/15 and received funding for all of them. However, only about half of these patients eventually received radiation therapy.
• Some patients require more than the aver-age course of radiation treatment after consultations. Therefore, hospitals providing services to these patients would have received more funding if they had been funded based on actual treatments delivered rather than consultations.
RECOMMENDATION 15
To better ensure radiation funding is equitable and reflects the actual services delivered by hospitals, we recommend that the Ministry of Health and Long-Term Care work with Cancer Care Ontario to evaluate and revise existing funding methods for radiation treatment so as to fund hospitals based on a consistent rate and actual services delivered.

171Cancer Treatment Services
Chap
ter 3
• S
ectio
n 3.
02
4.6.2 Funding for Cancer Drug Therapy Not Based on Services Provided
Funding for cancer drug therapy is not based on services provided despite the implementation of a new funding model, the Quality Based Procedure (QBP), which is intended to reflect the actual cost of treatments.
Prior to 2014/15, both CCO and the Ministry funded hospitals for cancer drug therapy, such as chemotherapy. However, as with funding for radia-tion treatment, the use of inconsistent methods led to funding inequities among hospitals—for example, CCO funded hospitals based on consulta-tions, and the Ministry based on patient visits (see Figure 18).
Since 2014/15, CCO assumed full responsibility for funding cancer drug therapy, and implemented the new QBP model. Under QBP, hospital funding is calculated based on the number, type or complexity of activities performed at the hospital, as well as the funding rates established collaboratively by CCO, clinical experts and hospitals.
The purpose of QBP is to ensure equitable fund-ing and reflect the actual cost of treatment so as to avoid overfunding low-complexity cases and under-funding high-complexity ones.
Some Funding Still Based on Historical Levels Rather than Service Volumes
In 2015/16, 82% ($152.4 million) of cancer-drug- therapy funding was based on QBP, while the remaining 18% ($32.6 million) was based on his-torical funding.
We noted that half of the hospitals still received funding that was not based on their activities. We also found that the proportion of historical fund-ing varied among hospitals, from zero to 53%. For example, one hospital received about $3.3 million for cancer drug therapy, with $1.5 million of it from QBP and the remaining $1.8 million not tied to any service volumes.
Since the implementation of QBP in 2014/15, CCO has provided hospitals a total of $107 million
based on historical funding. CCO informed us that it will continue to refine QBP, with the eventual goal of eliminating all funding based on historical levels.
Incomplete Treatment Cycles FundedCCO overfunded hospitals by about $12 million during 2014/15 and 2015/16 by paying the full cost of treatment courses that were not completed. CCO’s analysis completed in 2015/16 found that on average, more than half (58%) of patients receiving intravenous cancer drug therapy at hospital out-patient clinics did not complete the recommended number of visits for a full course of treatment because of severe side effects and/or changes to treatment plans.
We estimated that CCO overfunded hospitals by about $12 million for incomplete treatment courses during 2014/15 and 2015/16. Although CCO modified the funding formula in 2016/17 to fund hospitals only when a patient receives care, its contractual agreement with the hospitals has prevented it from recovering the $12 million.
Funding Consultations for Non-Malignant CasesFrom 2014/15 to 2016/17, CCO provided $3.1 mil-lion to hospitals for consultations that did not proceed to cancer drug therapy.
CCO began in 2014/15 to fund hospitals using the QBP model, which calculates funding based on the type, number and complexity of activities performed. One of the activities is the number of consultations provided to patients. Typically, consultation for drug therapy refers to a patient’s first meeting with a medical oncologist to confirm whether the patient has cancer. If the patient learns at the consultation that they have non-malignant tumours rather than cancer, obviously there is no drug therapy.
Since OHIP pays oncologists directly for provid-ing consultations to patients, hospitals incur the majority of the costs after patients begin drug therapy. However, we noted that CCO still provided
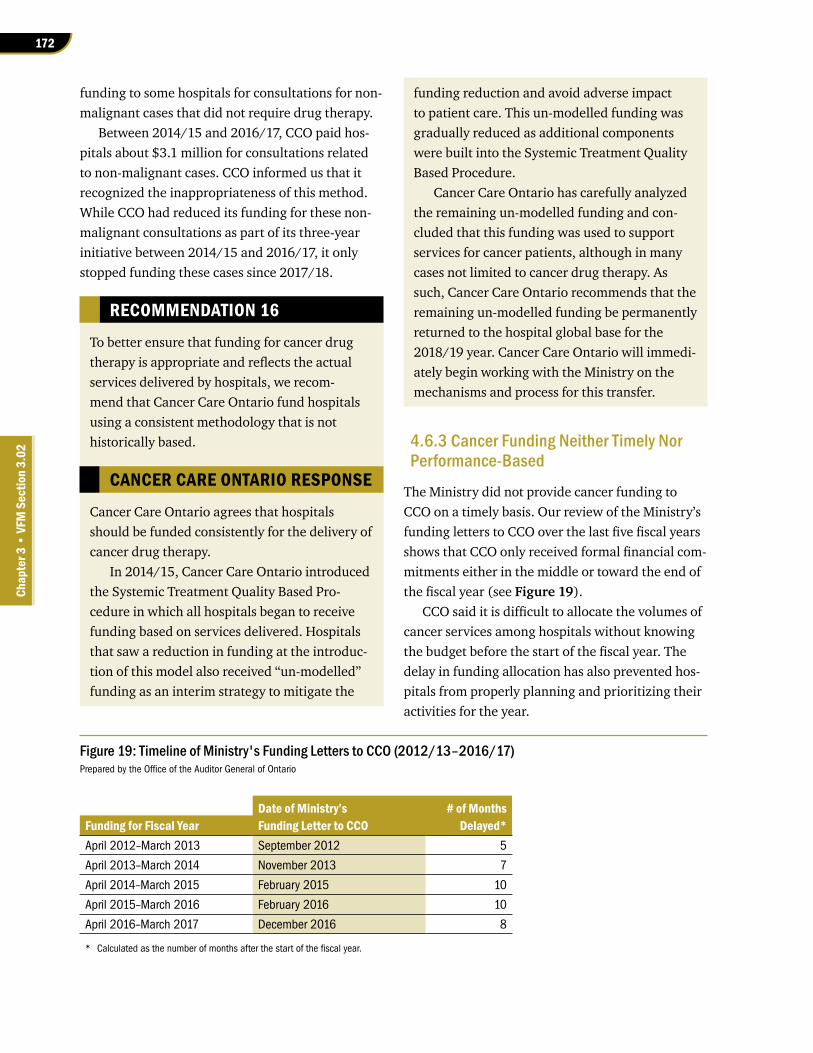
172
Chap
ter 3
• VF
M S
ectio
n 3.
02
funding to some hospitals for consultations for non-malignant cases that did not require drug therapy.
Between 2014/15 and 2016/17, CCO paid hos-pitals about $3.1 million for consultations related to non-malignant cases. CCO informed us that it recognized the inappropriateness of this method. While CCO had reduced its funding for these non-malignant consultations as part of its three-year initiative between 2014/15 and 2016/17, it only stopped funding these cases since 2017/18.
RECOMMENDATION 16
To better ensure that funding for cancer drug therapy is appropriate and reflects the actual services delivered by hospitals, we recom-mend that Cancer Care Ontario fund hospitals using a consistent methodology that is not historically based.
CANCER CARE ONTARIO RESPONSE
Cancer Care Ontario agrees that hospitals should be funded consistently for the delivery of cancer drug therapy.
In 2014/15, Cancer Care Ontario introduced the Systemic Treatment Quality Based Pro-cedure in which all hospitals began to receive funding based on services delivered. Hospitals that saw a reduction in funding at the introduc-tion of this model also received “un-modelled” funding as an interim strategy to mitigate the
funding reduction and avoid adverse impact to patient care. This un-modelled funding was gradually reduced as additional components were built into the Systemic Treatment Quality Based Procedure.
Cancer Care Ontario has carefully analyzed the remaining un-modelled funding and con-cluded that this funding was used to support services for cancer patients, although in many cases not limited to cancer drug therapy. As such, Cancer Care Ontario recommends that the remaining un-modelled funding be permanently returned to the hospital global base for the 2018/19 year. Cancer Care Ontario will immedi-ately begin working with the Ministry on the mechanisms and process for this transfer.
4.6.3 Cancer Funding Neither Timely Nor Performance-Based
The Ministry did not provide cancer funding to CCO on a timely basis. Our review of the Ministry’s funding letters to CCO over the last five fiscal years shows that CCO only received formal financial com-mitments either in the middle or toward the end of the fiscal year (see Figure 19).
CCO said it is difficult to allocate the volumes of cancer services among hospitals without knowing the budget before the start of the fiscal year. The delay in funding allocation has also prevented hos-pitals from properly planning and prioritizing their activities for the year.
Figure 19: Timeline of Ministry's Funding Letters to CCO (2012/13–2016/17)Prepared by the Office of the Auditor General of Ontario
Date of Ministry’s # of MonthsFunding for Fiscal Year Funding Letter to CCO Delayed*April 2012–March 2013 September 2012 5
April 2013–March 2014 November 2013 7
April 2014–March 2015 February 2015 10
April 2015–March 2016 February 2016 10
April 2016–March 2017 December 2016 8
* Calculated as the number of months after the start of the fiscal year.

173Cancer Treatment Services
Chap
ter 3
• S
ectio
n 3.
02
We also noted that cancer funding from CCO to hospitals, and from the Ministry to CCO, is volume-based or fixed. None of the CCO funding to hospitals is tied to how well they perform compared to others in areas such as wait times, quality of services and so on. Similarly, none of the Ministry funding to CCO is linked to CCO meeting provincial cancer-program targets.
RECOMMENDATION 17
To better ensure that cancer treatment services are delivered effectively and efficiently to meet patient needs, we recommend that the Ministry of Health and Long-Term Care:
• incorporate a component of performance-based funding in the current funding model to provide incentives for improving the performance of the cancer system in Ontario; and
• provide Cancer Care Ontario with timely funding decisions for proper planning and budgeting of cancer services.
CANCER CARE ONTARIO RESPONSE
Cancer Care Ontario agrees that a pay-for-performance framework may be beneficial for facilitating performance improvement.
As part of all current volume funding agree-ments with hospitals, Cancer Care Ontario outlines quality expectations and links to fund-ing through a performance and issues manage-ment process. However, financial incentives or disincentives for performance are not applied to the funding agreements, as a provincial framework does not currently exist to enable performance-based funding.
Cancer Care Ontario supports the efforts that have been undertaken by the Ministry to develop a quality overlay framework that would enable Cancer Care Ontario to provide financial incentives to hospitals for meeting the quality expectations already outlined in the agreements.
MINISTRY RESPONSE
Building on lessons learned internationally and from Ontario’s Emergency Department Pay-for-Results program, the Ministry, together with its partners, is exploring opportunities to incorpor-ate performance-based funding in its current hospital funding model as part of the next phase of Ontario’s Health System Funding Reform. It is envisioned that such an initiative would be piloted first before any decisions are being made about full implementation.
The Ministry accepts this recommenda-tion and will work with Cancer Care Ontario to ensure that the agency receives timely funding decisions.
New funding for the CCO-managed Quality Based Procedures for the 2017/18 year was con-firmed in funding letters on April 27, 2017, the day after LHINs received their hospital funding allocations; the earliest this funding has been confirmed within a fiscal year. The Ministry will endeavour to continue to provide this funding confirmation as early in the year as possible.
4.7 Accountability and Oversight of Ontario’s Cancer Programs4.7.1 Accountability Structure of Regional Vice Presidents Needs Improvement
Regional vice presidents (RVPs) are responsible for managing regional cancer centres and their cancer programs. They are accountable to CCO and to the hospitals where the regional cancer centres are located. As a result, the hospitals and CCO jointly agree on RVPs’ terms of appointment, compensa-tion and responsibilities.
The RVPs receive joint appointment letters, from CCO and the hospitals, outlining the RVPs’ cancer-care related responsibilities and expectations. How-ever, we noted that CCO was not able to provide the joint appointment letter for one of the RVPs.
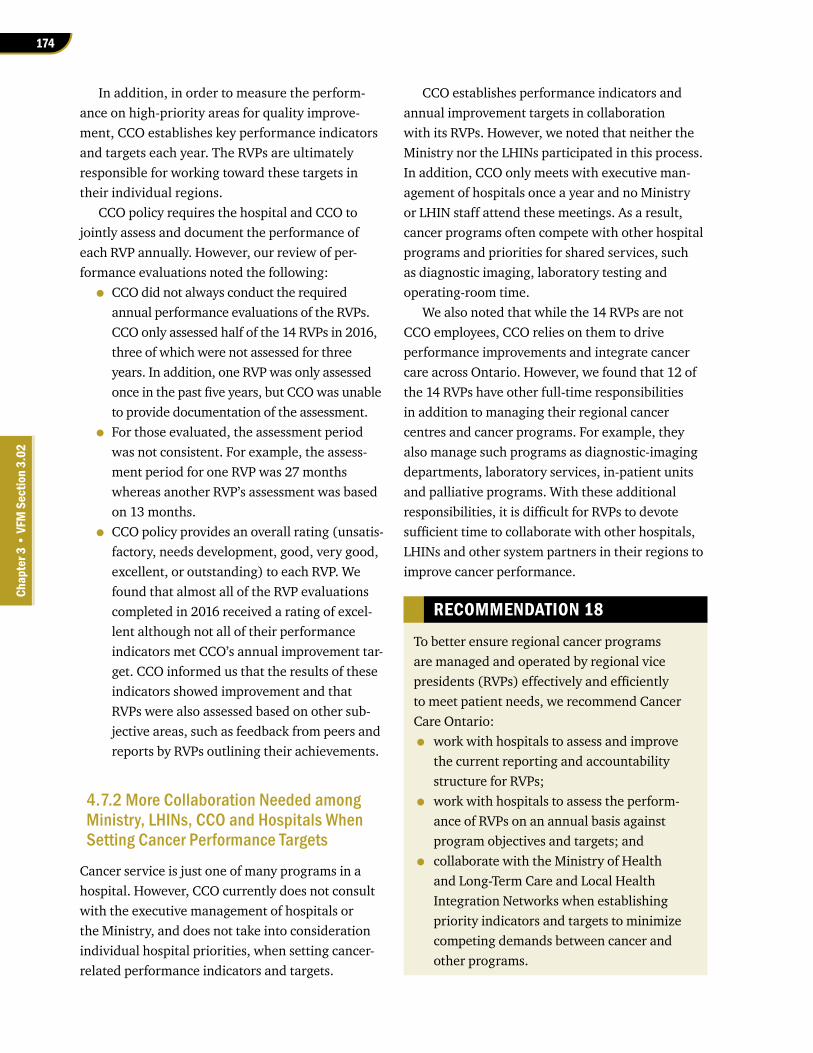
174
Chap
ter 3
• VF
M S
ectio
n 3.
02
In addition, in order to measure the perform-ance on high-priority areas for quality improve-ment, CCO establishes key performance indicators and targets each year. The RVPs are ultimately responsible for working toward these targets in their individual regions.
CCO policy requires the hospital and CCO to jointly assess and document the performance of each RVP annually. However, our review of per-formance evaluations noted the following:
• CCO did not always conduct the required annual performance evaluations of the RVPs. CCO only assessed half of the 14 RVPs in 2016, three of which were not assessed for three years. In addition, one RVP was only assessed once in the past five years, but CCO was unable to provide documentation of the assessment.
• For those evaluated, the assessment period was not consistent. For example, the assess-ment period for one RVP was 27 months whereas another RVP’s assessment was based on 13 months.
• CCO policy provides an overall rating (unsatis-factory, needs development, good, very good, excellent, or outstanding) to each RVP. We found that almost all of the RVP evaluations completed in 2016 received a rating of excel-lent although not all of their performance indicators met CCO’s annual improvement tar-get. CCO informed us that the results of these indicators showed improvement and that RVPs were also assessed based on other sub-jective areas, such as feedback from peers and reports by RVPs outlining their achievements.
4.7.2 More Collaboration Needed among Ministry, LHINs, CCO and Hospitals When Setting Cancer Performance Targets
Cancer service is just one of many programs in a hospital. However, CCO currently does not consult with the executive management of hospitals or the Ministry, and does not take into consideration individual hospital priorities, when setting cancer-related performance indicators and targets.
CCO establishes performance indicators and annual improvement targets in collaboration with its RVPs. However, we noted that neither the Ministry nor the LHINs participated in this process. In addition, CCO only meets with executive man-agement of hospitals once a year and no Ministry or LHIN staff attend these meetings. As a result, cancer programs often compete with other hospital programs and priorities for shared services, such as diagnostic imaging, laboratory testing and operating-room time.
We also noted that while the 14 RVPs are not CCO employees, CCO relies on them to drive performance improvements and integrate cancer care across Ontario. However, we found that 12 of the 14 RVPs have other full-time responsibilities in addition to managing their regional cancer centres and cancer programs. For example, they also manage such programs as diagnostic-imaging departments, laboratory services, in-patient units and palliative programs. With these additional responsibilities, it is difficult for RVPs to devote sufficient time to collaborate with other hospitals, LHINs and other system partners in their regions to improve cancer performance.
RECOMMENDATION 18
To better ensure regional cancer programs are managed and operated by regional vice presidents (RVPs) effectively and efficiently to meet patient needs, we recommend Cancer Care Ontario:
• work with hospitals to assess and improve the current reporting and accountability structure for RVPs;
• work with hospitals to assess the perform-ance of RVPs on an annual basis against program objectives and targets; and
• collaborate with the Ministry of Health and Long-Term Care and Local Health Integration Networks when establishing priority indicators and targets to minimize competing demands between cancer and other programs.

175Cancer Treatment Services
Chap
ter 3
• S
ectio
n 3.
02
development of new clinical programs to the region, capacity planning, capital infrastruc-ture implementation, and improvements in performance.
In alignment with our current approach to performance improvement, Cancer Care Ontario is reviewing the role description of the RVPs, which will be completed by March 2018. Cancer Care Ontario is reviewing literature and structures for performance management in other cancer system jurisdictions, which will inform any future opportunities to improve the current reporting and accountability structure.
Currently, Cancer Care Ontario submits a subset of performance indicators to the Ministry as part of our accountability reporting and, beginning next fiscal year, will consult with the Ministry on the complete selection of Regional Performance Scorecard indicators.
CANCER CARE ONTARIO RESPONSE
Cancer Care Ontario agrees that performance management is a foundational component of the performance improvement cycle, and has a robust performance management and account-ability process in place, including quarterly performance discussions with the leadership teams of each Regional Cancer Program, a Regional Performance Scorecard to monitor improvements and a guideline for managing performance issues.
Cancer Care Ontario and the CEOs of the Regional Cancer Centre hospitals assess the overall performance of the RVPs on an annual basis. This process considers the multiple complex elements of the RVP role description, including management of system issues, success of furthering provincial and regional priorities,

176
Chap
ter 3
• VF
M S
ectio
n 3.
02
Appendix 1: Audit CriteriaPrepared by the Office of the Auditor General of Ontario
1. Effective procedures and co-ordination among service providers are in place to ensure patients have timely and equitable access to safe and evidence-based cancer treatments that meet patient needs.
2. Effective controls are in place to ensure cancer patients who apply for financial support are assessed on a timely and consistent basis in accordance with the eligibility criteria.
3. Analysis and research are performed periodically to assess whether cancer treatments and drug coverage in other jurisdictions can be made available in Ontario.
4. Effective procedures are in place to ensure cancer funding and resources are allocated in a timely and equitable manner to service providers to meet patient needs, used for the purposes intended, and administered with due regard for economy and efficiency.
5. Performance measures and targets are established, monitored and compared against actual results to ensure that the intended outcomes are achieved and that corrective actions are taken on a timely basis when issues are identified.
6. Financial and operational data are collected to provide accurate, complete and timely information to help guide management decision-making and assist with performance management and public reporting.

177Cancer Treatment Services
Chap
ter 3
• S
ectio
n 3.
02
Appendix 2: Hospitals Providing Cancer Treatment Services in OntarioPrepared by the Office of the Auditor General of Ontario
Cancer Treatment ServicesHospital LHIN Radiation Surgery Drug TherapyAlexandra Marine And General Hospital South West ü
Almonte General Hospital Champlain ü
Arnprior Regional Health Champlain ü
Atikokan General Hospital North West ü
Bluewater Health1 Erie St. Clair ü ü
Brant Community Healthcare System Hamilton Niagara Haldimand Brant ü ü
Brockville General Hospital South East ü ü
Cambridge Memorial Hospital Waterloo Wellington ü ü
Carleton Place District Memorial Hospital Champlain ü
Chatham-Kent Health Alliance Erie St. Clair ü ü
Children’s Hospital of Eastern Ontario Champlain ü
Collingwood General and Marine Hospital North Simcoe Muskoka ü
Cornwall Community Hospital Champlain ü ü
Dryden Regional Health Centre North West ü
Georgian Bay General Hospital North Simcoe Muskoka ü
Geraldton District Hospital North West ü
Grand River Hospital (Grand River Regional Cancer Centre)1,2
Waterloo Wellingtonü ü ü
Grey Bruce Health Services South West ü ü
Groves Memorial Community Hospital Waterloo Wellington ü
Guelph General Hospital Waterloo Wellington ü ü
Haldimand War Memorial Hospital Hamilton Niagara Haldimand Brant ü
Halton Healthcare Services Corporation Central West/Mississauga Halton ü ü
Hamilton Health Sciences (Juravinski Cancer Centre)1,2
Hamilton Niagara Haldimand Brantü ü ü
Hanover and District Hospital South West ü
Headwaters Health Care Centre Central West/Mississauga Halton ü ü
Health Sciences North/Horizon Santé – Nord (Northeast Cancer Centre)1,2
North Eastü ü ü
Hopital General de Hawkesbury and District General Hospital Inc.
Champlainü ü
Hopital General de Nipissing Ouest/The West Nipissing General Hospital
North Eastü
Hôpital Montfort Champlain ü
Hôpital Notre-Dame Hospital (Hearst) North East ü
Hornepayne Community Hospital North East ü
Humber River Hospital Central ü ü
Huron Perth Healthcare Alliance (Stratford General Hospital)
South Westü ü
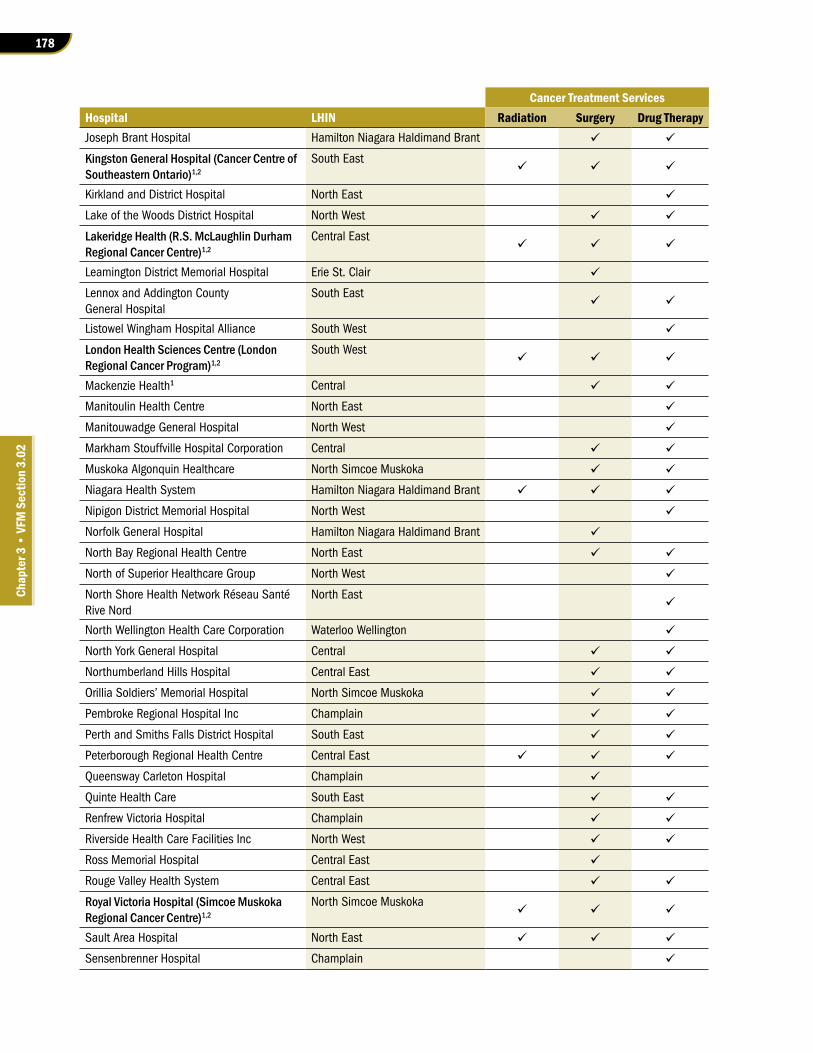
178
Chap
ter 3
• VF
M S
ectio
n 3.
02
Cancer Treatment ServicesHospital LHIN Radiation Surgery Drug TherapyJoseph Brant Hospital Hamilton Niagara Haldimand Brant ü ü
Kingston General Hospital (Cancer Centre of Southeastern Ontario)1,2
South Eastü ü ü
Kirkland and District Hospital North East ü
Lake of the Woods District Hospital North West ü ü
Lakeridge Health (R.S. McLaughlin Durham Regional Cancer Centre)1,2
Central Eastü ü ü
Leamington District Memorial Hospital Erie St. Clair ü
Lennox and Addington County General Hospital
South Eastü ü
Listowel Wingham Hospital Alliance South West ü
London Health Sciences Centre (London Regional Cancer Program)1,2
South Westü ü ü
Mackenzie Health1 Central ü ü
Manitoulin Health Centre North East ü
Manitouwadge General Hospital North West ü
Markham Stouffville Hospital Corporation Central ü ü
Muskoka Algonquin Healthcare North Simcoe Muskoka ü ü
Niagara Health System Hamilton Niagara Haldimand Brant ü ü ü
Nipigon District Memorial Hospital North West ü
Norfolk General Hospital Hamilton Niagara Haldimand Brant ü
North Bay Regional Health Centre North East ü ü
North of Superior Healthcare Group North West ü
North Shore Health Network Réseau Santé Rive Nord
North Eastü
North Wellington Health Care Corporation Waterloo Wellington ü
North York General Hospital Central ü ü
Northumberland Hills Hospital Central East ü ü
Orillia Soldiers’ Memorial Hospital North Simcoe Muskoka ü ü
Pembroke Regional Hospital Inc Champlain ü ü
Perth and Smiths Falls District Hospital South East ü ü
Peterborough Regional Health Centre Central East ü ü ü
Queensway Carleton Hospital Champlain ü
Quinte Health Care South East ü ü
Renfrew Victoria Hospital Champlain ü ü
Riverside Health Care Facilities Inc North West ü ü
Ross Memorial Hospital Central East ü
Rouge Valley Health System Central East ü ü
Royal Victoria Hospital (Simcoe Muskoka Regional Cancer Centre)1,2
North Simcoe Muskokaü ü ü
Sault Area Hospital North East ü ü ü
Sensenbrenner Hospital Champlain ü

179Cancer Treatment Services
Chap
ter 3
• S
ectio
n 3.
02
Cancer Treatment ServicesHospital LHIN Radiation Surgery Drug TherapySinai Health System Toronto Central South ü ü
Sioux Lookout Meno-Ya-Win Health Centre North West ü ü
South Bruce Grey Health Centre South West ü
Southlake Regional Health Centre (Stronach Regional Cancer Centre at Southlake)1,2
Centralü ü ü
St. Joseph’s Healthcare Hamilton, a division of the St. Joseph’s Health System
Hamilton Niagara Haldimand Brantü
St. Joseph’s General Hospital Elliot Lake North East ü ü
St. Joseph’s Health Care London South West ü
St. Joseph’s Health Centre (Toronto) Toronto Central South ü ü
St. Mary’s General Hospital, a division of the St. Joseph’s Health System
Waterloo Wellingtonü
St. Michael’s Hospital Toronto Central South ü ü
St. Thomas Elgin General Hospital South West ü ü
Stevenson Memorial Hospital Central ü
Strathroy Middlesex General Hospital South West ü
Sunnybrook Health Sciences Centre (Odette Cancer Centre)1,2
Toronto Centralü ü ü
Temiskaming Hospital North East ü ü
The Hospital for Sick Children Toronto Central South ü
The Lady Minto Hospital North East ü
The Ottawa Hospital (The Ottawa Hospital Cancer Centre)1,2
Champlainü ü ü
The Red Lake Margaret Cochenour Memorial Hospital Corporation
North Westü
The Scarborough Hospital Central East ü ü
Thunder Bay Regional Health Sciences Centre (Regional Cancer Care – Northwest)1,2
North Westü ü ü
Tillsonburg District Memorial Hospital South West ü
Timmins and District Hospital North East ü ü
Toronto East Health Network Toronto Central North ü ü
Trillium Health Partners-Credit Valley Site (Carlo Fidani Peel Regional Cancer Centre)1,2
Central West and Mississauga Halton ü ü ü
University Health Network (Princess Margaret Cancer Centre)1,2
Toronto Centralü ü ü
West Parry Sound Health Centre North East ü ü
William Osler Health System Central West/Mississauga Halton ü ü
Winchester District Memorial Hospital Champlain ü ü
Windsor Regional Hospital (Windsor Regional Cancer Program)1,2
Erie St. Clairü ü ü
Women’s College Hospital Toronto Central South ü
Woodstock General Hospital Trust South West ü ü
1. We either visited or spoke with key personnel from this hospital as part of our audit
2. Regional Cancer Centre (also indicated in bold)