Embed Size (px)
Citation preview

3.0 CONCRETE STRUCTURES 3.1 Material Properties 3.2 Fatigue Limit State 3.3 Strength Limit State 3.4 Flexure 3.5 Flexure Design Example 3.6 Flexural, Design Example of Negative Moment Region 3.7 Shear 3.8 Horizontal Interface Shear 3.9 Design Example. AASHTO-PCI Bulb-Tee BT-72, Single Span With
Composite Deck, Designed According to AASHTO LRFD Specifications

3-1
3.0 CONCRETE STRUCTURES 3.1 Material Properties. (LRFD Art. 5.4) Loss of prestress can be characterized as that due to instantaneous loss and time-dependent loss. Losses due to anchorage set, friction and elastic shortening are instantaneous. Losses due to creep, shrinkage and relaxation are time-dependent. Immediate losses before transfer ΔfpT = ΔfpES + ΔfpSR + ΔfpCR + ΔfpR2 Where: ΔfpES = loss due to elastic shortening (ksi)
ΔfpSR = loss due to shrinkage (ksi) ΔfpCR = loss due to creep of concrete (ksi) ΔfpR2 = loss due to relaxation of steel after transfer (ksi)
Notice that an additional loss occurs during the time between jacking of the strands and transfer. This component is the loss due to the relaxation of steel at transfer, ΔfpR1
Three methods of estimating time-dependent losses are provided in the LRFD Specifications: (1) the approximate lump sum estimate, (2) a refined estimate, and (3) the background necessary to perform a rigorous time-step analysis.
3.1.1 Creep (LRFD Art. 5.4.2.3.2) The Creep Coefficient
118.09.1, itdfhcsi tkkkktt (LRFD Eq. 5.4.2.3.2-1)
for which:
0.1/13.045.1 SVks (LRFD Eq. 5.4.2.3.2-2)
Hkhc 008.056.1 (LRFD Eq. 5.4.2.3.2-3)
ci
f fk
1
5 (LRFD Eq. 5.4.2.3.2-4)
t
tk
ci
ci
fftd
20410012
(LRFD Eq. 5.4.2.3.2-5)
ks is factor for volume-to-surface ratio; khc is the humidity factor; kf is the factor of concrete strength; ktd is the development factor
3-2
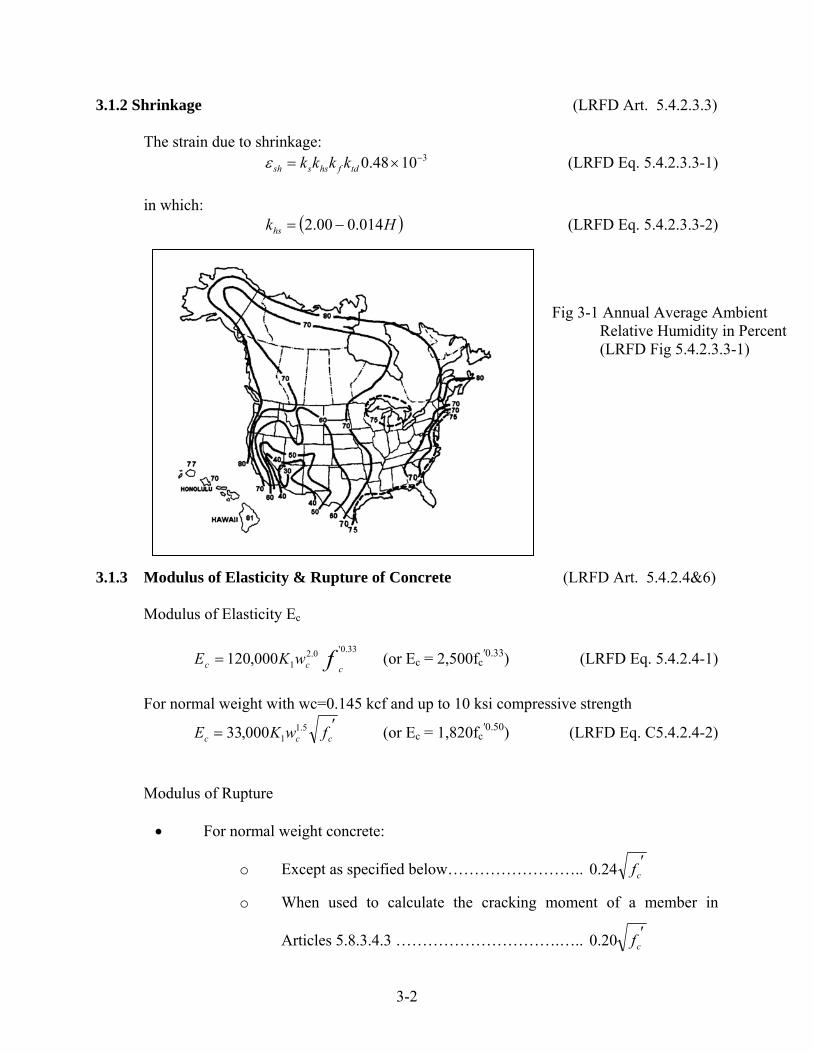
3.1.2 Shrinkage (LRFD Art. 5.4.2.3.3) The strain due to shrinkage: 31048.0 tdfhsssh kkkk (LRFD Eq. 5.4.2.3.3-1)
in which: Hkhs 014.000.2 (LRFD Eq. 5.4.2.3.3-2)
3.1.3 Modulus of Elasticity & Rupture of Concrete (LRFD Art. 5.4.2.4&6) Modulus of Elasticity Ec
fccc wKE
33.0'0.21000,120 (or Ec = 2,500fc
′0.33) (LRFD Eq. 5.4.2.4-1)
For normal weight with wc=0.145 kcf and up to 10 ksi compressive strength
ccc fwKE 5.11000,33 (or Ec = 1,820fc
′0.50) (LRFD Eq. C5.4.2.4-2)
Modulus of Rupture
For normal weight concrete:
o Except as specified below…………………….. cf24.0
o When used to calculate the cracking moment of a member in
Articles 5.8.3.4.3 ………………………….….. cf20.0
Fig 3-1 Annual Average Ambient Relative Humidity in Percent (LRFD Fig 5.4.2.3.3-1)
3-3
For light weight concrete:
o For sand-lightweight concrete…………. cf20.0
o For all-lightweight concrete …………… cf17.0
3.1.4 Prestressing Steel (LRFD Art. 5.4.4)
Material Grade or Type Dia. IN Tensile Strength, fpu (KSI)
Yield Strength, fpy (KSI)
Strand 250 KSI 270 KSI
1/4 to 0.6 3/8 to 0.6
250 270
90% of fpu
Bar Type 1, Plain Type 2, Deformed
3/4 to 1-3/8 5/8 to 1-3/8
150 150
85% of fpu 80% of fpu
Table 3-1 Properties of Prestressing Strand and Bar (LRFD Table 5.4.4.1-1)
3.2 Fatigue Limit State (LRFD Art. 5.5.3) γ(Δf) ≤ (ΔF)TH (LRFD Eq 5.5.3.1-1)
Reinforcing Bars
without a cross weld in the high-stress region:
fy
THfF min2024)( (LRFD Eq 5.5.3.2-1)
with a cross weld in the high-stress region:
min33.016)( fF TH (LRFD Eq 5.5.3.2-2)
Prestressing Tendons
18ksi for R>30
10ksi for R<12
A linear interpretation may be used for radii between 12 and 30 ft.
3-4
3.3 Strength Limit State (LRFD Art. 5.5.4)
Conventional Construction:
Resistance Factors
o For tension-controlled reinforced concrete sections as specified in Art.
5.7.2.1. .........................................................................................................0.90
o For tension-controlled prestressed concrete sections as specified in Art.
5.7.2.1 ..........................................................................................................1.00
o For shear and torsion:
normal weight concrete ........................................................................0.90
lightweight concrete .............................................................................0.80
o For compression-controlled sections with spirals or ties, as specified in
Article 5.7.2.1, except as specified in Articles 5.10.11.3 and 5.10.11.4.1b for
Seismic Zones 2, 3 and 4 at the extreme event limit state ...........................0.75
o For bearing on concrete ...............................................................................0.70
o For compression in strut-and-tie models .....................................................0.70
o For compression in anchorage zones:
normal weight concrete ........................................................................0.80
lightweight concrete .............................................................................0.65
o For tension in steel in anchorage zones .......................................................1.00
o For resistance during pile driving ................................................................1.00
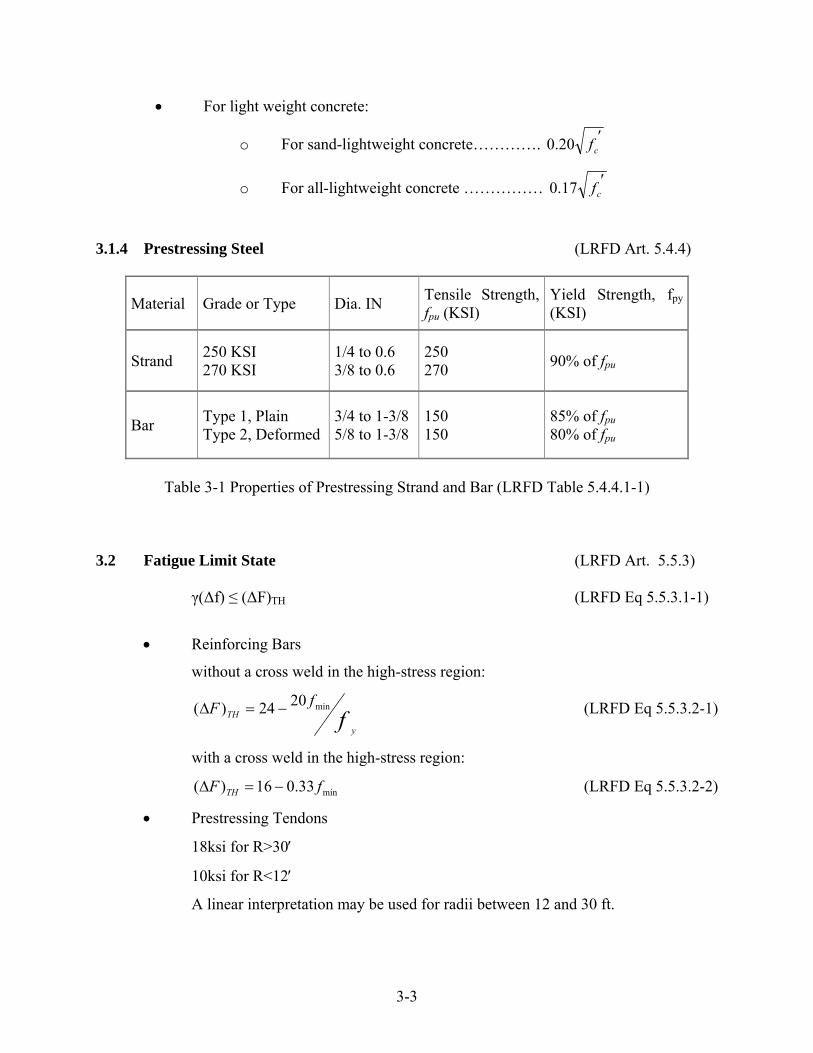
o For a prestressed members:
0.1
)(
25.075.075.0
cltl
clt (LRFD Eq 5.5.4.2.1-1)
o For nonprestressed members:
9.0
)(
15.075.075.0
cltl
clt (LRFD Eq 5.5.4.2.1-2)
εt = net tensile strain in the extreme tension steel
εcl = compression-controlled strain limit in the extreme tension steel
εtl = tension-controlled strain limit in the extreme tension steel
3-5
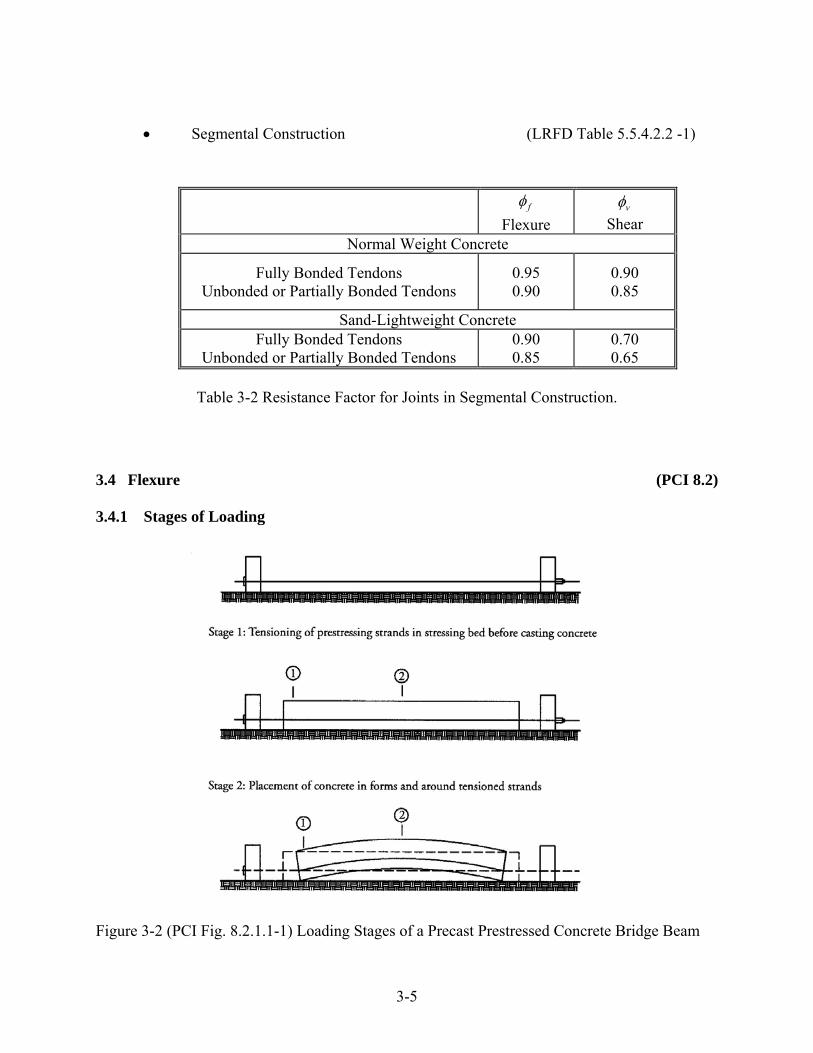
Segmental Construction (LRFD Table 5.5.4.2.2 -1)
Table 3-2 Resistance Factor for Joints in Segmental Construction.
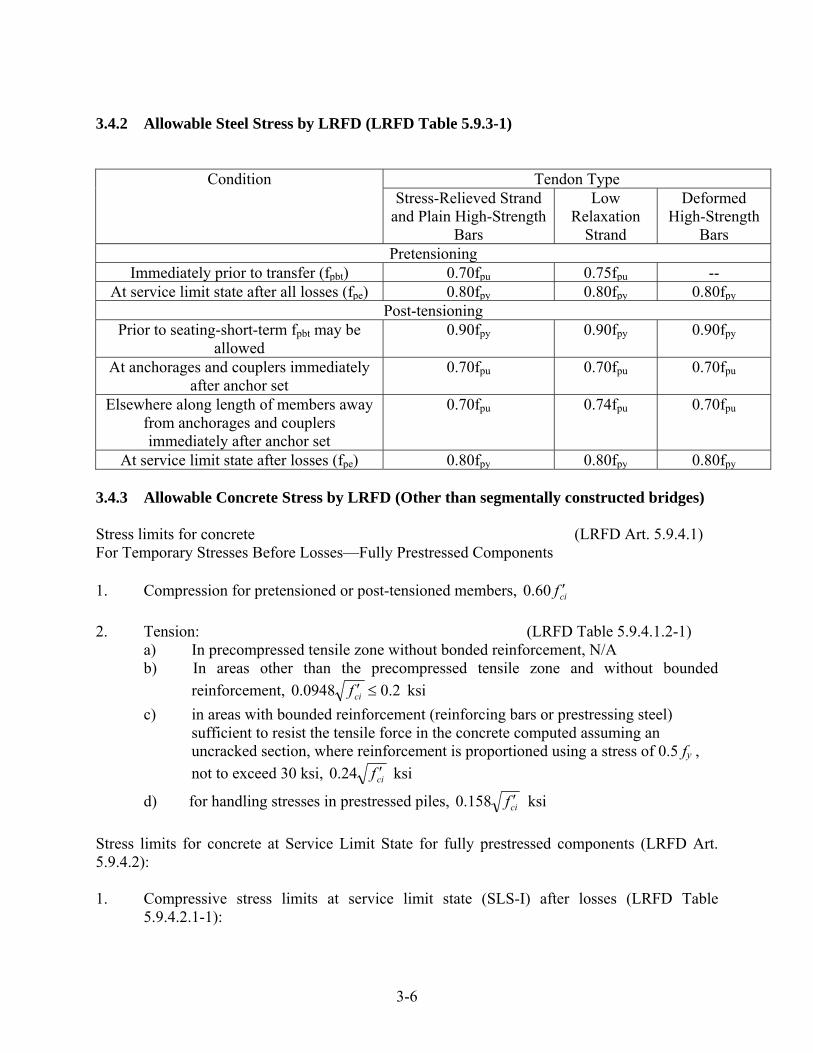
3.4 Flexure (PCI 8.2) 3.4.1 Stages of Loading
Figure 3-2 (PCI Fig. 8.2.1.1-1) Loading Stages of a Precast Prestressed Concrete Bridge Beam
f
Flexure v
Shear Normal Weight Concrete
Fully Bonded Tendons Unbonded or Partially Bonded Tendons
0.95 0.90
0.90 0.85
Sand-Lightweight Concrete Fully Bonded Tendons
Unbonded or Partially Bonded Tendons 0.90 0.85
0.70 0.65
3-6
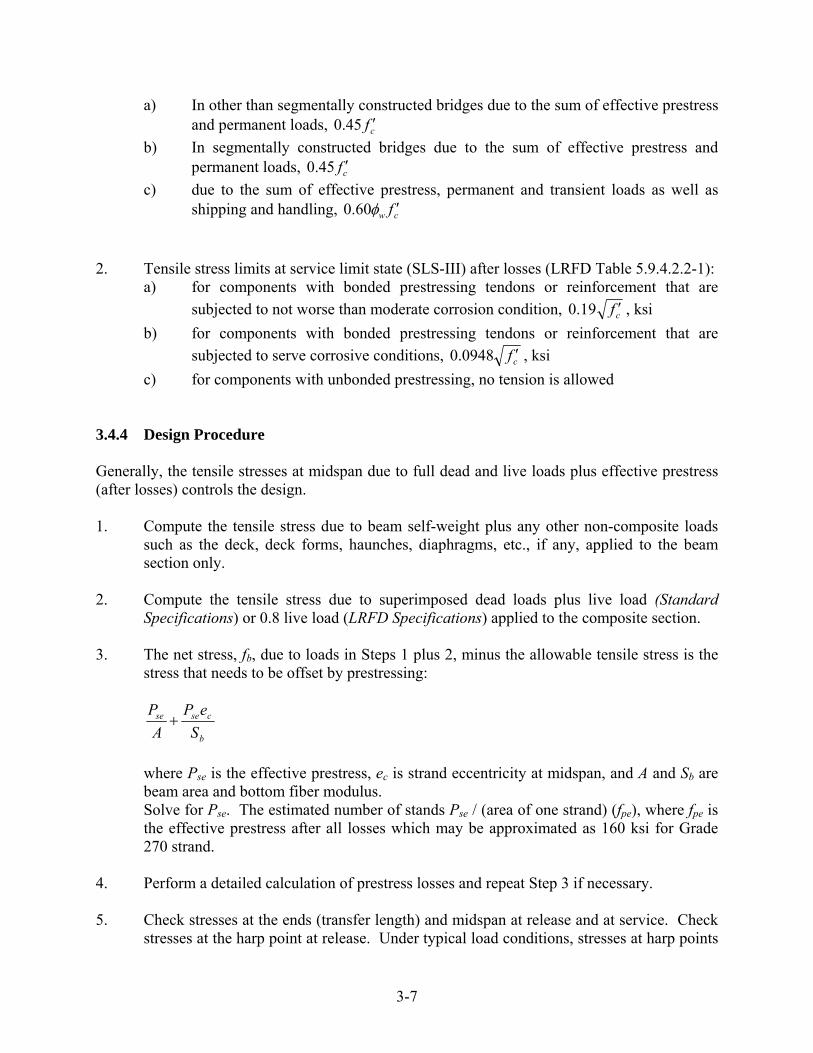
3.4.2 Allowable Steel Stress by LRFD (LRFD Table 5.9.3-1)
Condition Tendon Type Stress-Relieved Strand
and Plain High-Strength Bars
Low Relaxation
Strand
Deformed High-Strength
Bars Pretensioning
Immediately prior to transfer (fpbt) 0.70fpu 0.75fpu -- At service limit state after all losses (fpe) 0.80fpy 0.80fpy 0.80fpy
Post-tensioning Prior to seating-short-term fpbt may be
allowed 0.90fpy 0.90fpy 0.90fpy
At anchorages and couplers immediately after anchor set
0.70fpu 0.70fpu 0.70fpu
Elsewhere along length of members away from anchorages and couplers immediately after anchor set
0.70fpu 0.74fpu 0.70fpu
At service limit state after losses (fpe) 0.80fpy 0.80fpy 0.80fpy 3.4.3 Allowable Concrete Stress by LRFD (Other than segmentally constructed bridges) Stress limits for concrete (LRFD Art. 5.9.4.1) For Temporary Stresses Before Losses—Fully Prestressed Components 1. Compression for pretensioned or post-tensioned members, cif 60.0
2. Tension: (LRFD Table 5.9.4.1.2-1)
a) In precompressed tensile zone without bonded reinforcement, N/A b) In areas other than the precompressed tensile zone and without bounded
reinforcement, 2.00948.0 cif ksi
c) in areas with bounded reinforcement (reinforcing bars or prestressing steel) sufficient to resist the tensile force in the concrete computed assuming an uncracked section, where reinforcement is proportioned using a stress of 0.5 fy ,
not to exceed 30 ksi, cif 24.0 ksi
d) for handling stresses in prestressed piles, cif 158.0 ksi
Stress limits for concrete at Service Limit State for fully prestressed components (LRFD Art. 5.9.4.2): 1. Compressive stress limits at service limit state (SLS-I) after losses (LRFD Table
5.9.4.2.1-1):
3-7
a) In other than segmentally constructed bridges due to the sum of effective prestress and permanent loads, cf 45.0
b) In segmentally constructed bridges due to the sum of effective prestress and permanent loads, cf 45.0
c) due to the sum of effective prestress, permanent and transient loads as well as shipping and handling, cw f 60.0
2. Tensile stress limits at service limit state (SLS-III) after losses (LRFD Table 5.9.4.2.2-1):
a) for components with bonded prestressing tendons or reinforcement that are
subjected to not worse than moderate corrosion condition, cf 19.0 , ksi
b) for components with bonded prestressing tendons or reinforcement that are
subjected to serve corrosive conditions, cf 0948.0 , ksi
c) for components with unbonded prestressing, no tension is allowed 3.4.4 Design Procedure Generally, the tensile stresses at midspan due to full dead and live loads plus effective prestress (after losses) controls the design. 1. Compute the tensile stress due to beam self-weight plus any other non-composite loads
such as the deck, deck forms, haunches, diaphragms, etc., if any, applied to the beam section only.
2. Compute the tensile stress due to superimposed dead loads plus live load (Standard
Specifications) or 0.8 live load (LRFD Specifications) applied to the composite section. 3. The net stress, fb, due to loads in Steps 1 plus 2, minus the allowable tensile stress is the
stress that needs to be offset by prestressing:
b
csese
S
eP
A
P
where Pse is the effective prestress, ec is strand eccentricity at midspan, and A and Sb are beam area and bottom fiber modulus. Solve for Pse. The estimated number of stands Pse / (area of one strand) (fpe), where fpe is the effective prestress after all losses which may be approximated as 160 ksi for Grade 270 strand.
4. Perform a detailed calculation of prestress losses and repeat Step 3 if necessary. 5. Check stresses at the ends (transfer length) and midspan at release and at service. Check
stresses at the harp point at release. Under typical load conditions, stresses at harp points
3-8
do not govern at service loads and are therefore not checked. Determine the amount of harping and/or debonding required to control stresses at the end of the beam. This may be done by computing a required “e” for the selected Pse when draping is used, or by computing the required Pse for a given “e” when debonding is used.
6. Check strength. 7. If necessary, revise number of stands and repeat Steps 4 and 5. 3.4.5 Strand Considerations 3.4.5.1 Harped Strand
When concrete stresses exceed allowable limits, strand harping becomes an attractive option to reduce prestress eccentricity. The designer should be familiar with the practice and limitations of local producers when considering whether or not the calculated force and harp angle can be tolerated. The following are some options to consider if the hold-down force exceeds that which the fabricators can accommodate:
1. Split the strands into two groups with separate hold-downs.
2. Change slope of harp by moving harp points closer to centerline of the beam, or by lowering harp elevation at beam ends, or both. Also, consider uplift force and harp angle.
3. Decrease the number of harped strands.
4. Use debonding instead of harping or combine debonding with harping to reduce
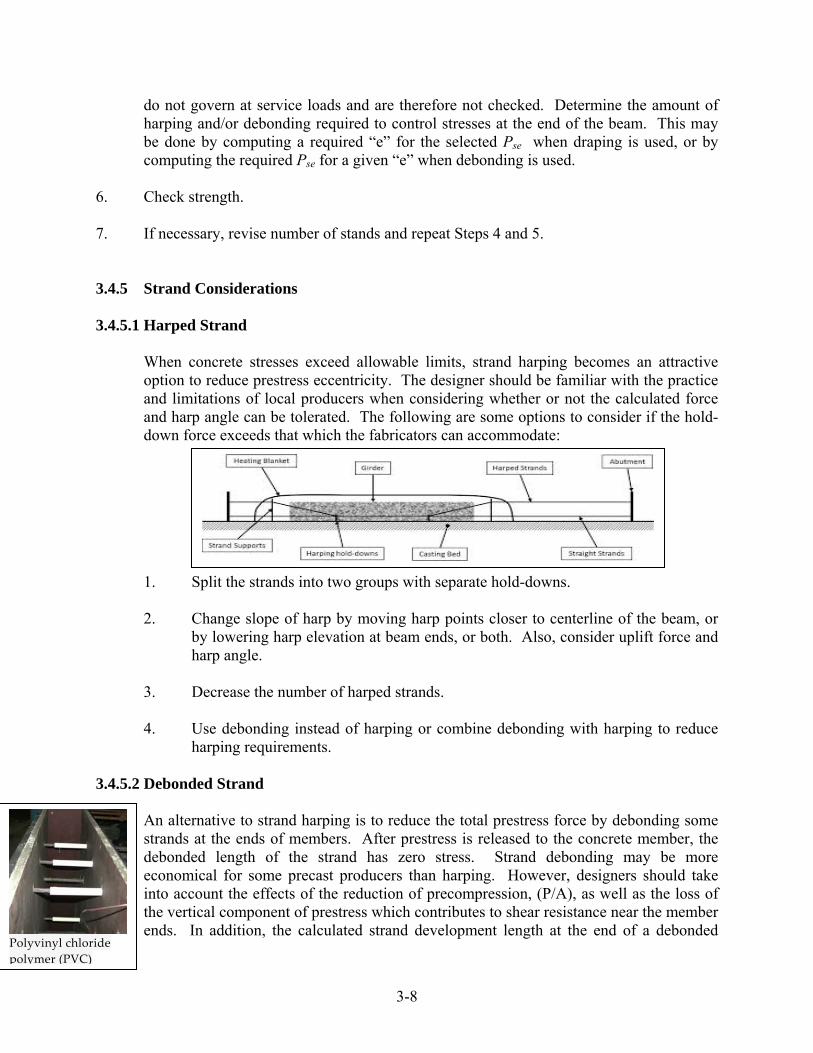
harping requirements. 3.4.5.2 Debonded Strand
An alternative to strand harping is to reduce the total prestress force by debonding some strands at the ends of members. After prestress is released to the concrete member, the debonded length of the strand has zero stress. Strand debonding may be more economical for some precast producers than harping. However, designers should take into account the effects of the reduction of precompression, (P/A), as well as the loss of the vertical component of prestress which contributes to shear resistance near the member ends. In addition, the calculated strand development length at the end of a debonded
Polyvinyl chloride
polymer (PVC)

3-9
strand is required to be doubled by the Standard Specifications. Debonded strands have been shown by recent studies, Russell and Burns (1993, 1994-A and 1994-B), to perform well and their use is encouraged whenever possible. The Standard Specifications do not contain specific requirements regarding the maximum number and distribution of debonded strands. However, Article 5.11.4.2 of the LRFD Specifications provides the following rules if debonded prestressing strands are used:
1. The number of partially debonded strands should not exceed 25% of the total
number of strands.
2. The number of debonded strands in any horizontal row shall not exceed 40% of the strands in that row.
3. Debonded strands should be symmetrically distributed about the centerline of the
member.
4. Exterior strands in each horizontal row should be fully bonded.
However, these rules appear to be too conservative according to current practice in several states and the recent studies by Russell and Burns (1993, 1994-A and 1994-B), and others.
3.4.5.3 Minimum Strand Cover and Spacing
The Standard Specifications require a minimum concrete cover over strands of 1.50 in. The LRFD Specifications are unclear regarding concrete cover over prestressing stand in precast concrete beams. For precast soffit form panels (stay-in-place deck panels), the minimum cover is 0.80 in. and for members subject to exterior exposure, the minimum is 2.0 in. regardless of whether the member is precast or cast-in-place. It is recommended here to use the 1.50 in. minimum cover specified in the Standard Specifications for bridge beams.
The Federal Highway Administration has approved use of ½ in. diameter strand at a spacing of 1.75 in., and 0.6 in. diameter strand at 2.00 in. on center. As a result, box beams, for example, may have two layers of ½ in. diameter strands in the bottom flange using one of the alternative patterns. If the vertical strand spacing is desired to be 2 in., the bottom flange thickness may have to be increased to satisfy the minimum cover requirements.
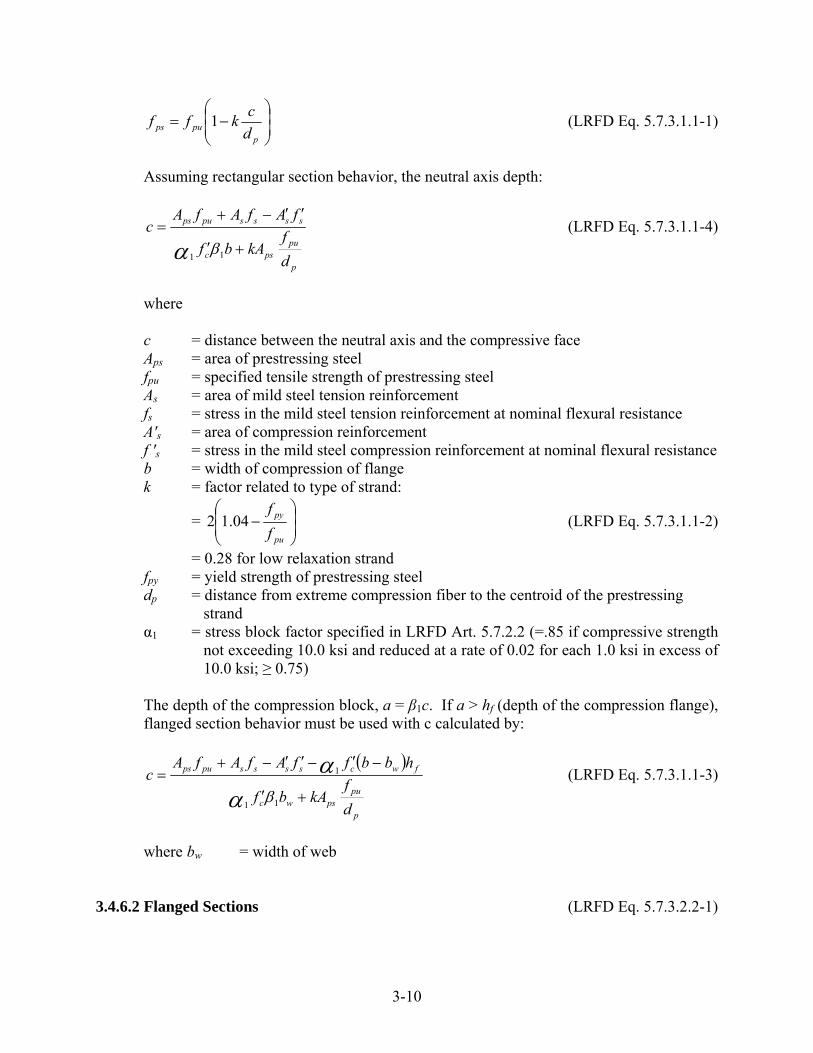
3.4.6 Nominal Flexural Resistance 3.4.6.1 Required Parameters The average stress in bonded prestressing steel,
3-10
ppups d
ckff 1 (LRFD Eq. 5.7.3.1.1-1)
Assuming rectangular section behavior, the neutral axis depth:
p
pupsc
sssspups
d
fkAbf
fAfAfAc
11
(LRFD Eq. 5.7.3.1.1-4)
where c = distance between the neutral axis and the compressive face Aps = area of prestressing steel fpu = specified tensile strength of prestressing steel As = area of mild steel tension reinforcement fs = stress in the mild steel tension reinforcement at nominal flexural resistance A′s = area of compression reinforcement f ′s = stress in the mild steel compression reinforcement at nominal flexural resistance b = width of compression of flange k = factor related to type of strand:
=
pu
py
f
f04.12 (LRFD Eq. 5.7.3.1.1-2)
= 0.28 for low relaxation strand fpy = yield strength of prestressing steel dp = distance from extreme compression fiber to the centroid of the prestressing
strand α1 = stress block factor specified in LRFD Art. 5.7.2.2 (=.85 if compressive strength
not exceeding 10.0 ksi and reduced at a rate of 0.02 for each 1.0 ksi in excess of 10.0 ksi; ≥ 0.75)
The depth of the compression block, a = β1c. If a > hf (depth of the compression flange), flanged section behavior must be used with c calculated by:
p
pupswc
fwcsssspups
d
fkAbf
hbbffAfAfAc
11
1
(LRFD Eq. 5.7.3.1.1-3)
where bw = width of web 3.4.6.2 Flanged Sections (LRFD Eq. 5.7.3.2.2-1)
3-11
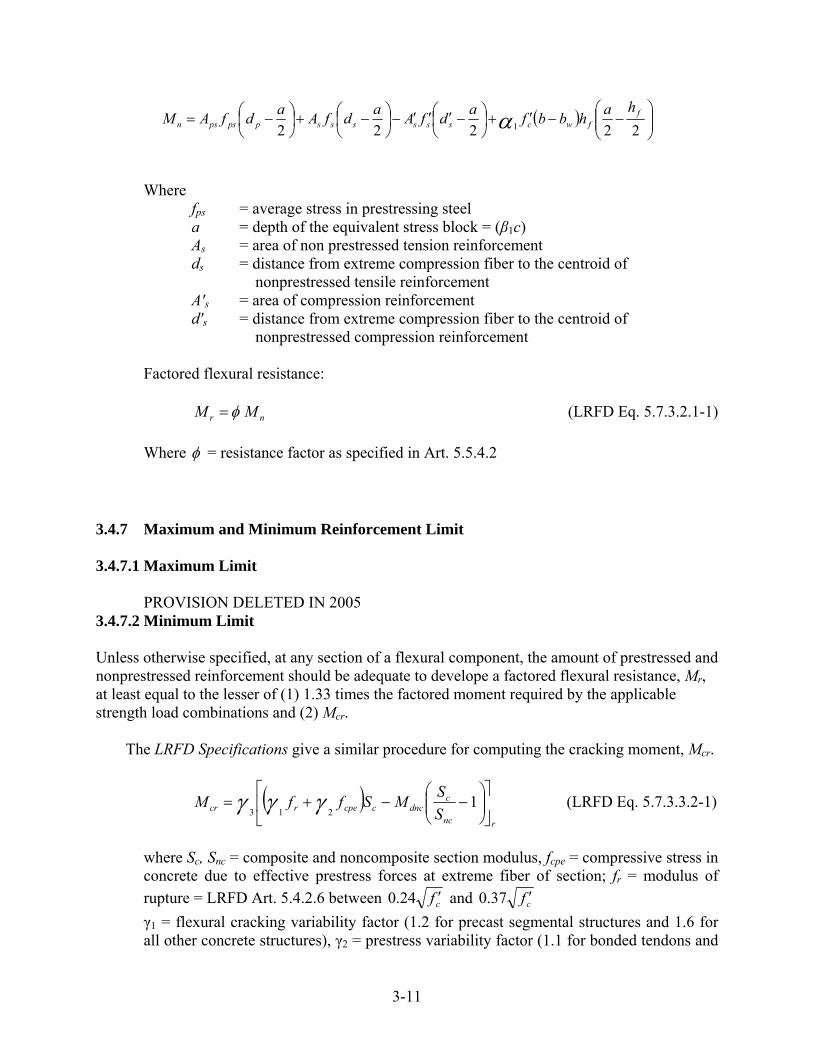
22222 1
ffwcssssssppspsn
hahbbf
adfA
adfA
adfAM
Where fps = average stress in prestressing steel a = depth of the equivalent stress block = (β1c) As = area of non prestressed tension reinforcement ds = distance from extreme compression fiber to the centroid of
nonprestressed tensile reinforcement A′s = area of compression reinforcement d′s = distance from extreme compression fiber to the centroid of
nonprestressed compression reinforcement Factored flexural resistance: nr MM (LRFD Eq. 5.7.3.2.1-1)
Where = resistance factor as specified in Art. 5.5.4.2 3.4.7 Maximum and Minimum Reinforcement Limit 3.4.7.1 Maximum Limit
PROVISION DELETED IN 2005 3.4.7.2 Minimum Limit Unless otherwise specified, at any section of a flexural component, the amount of prestressed and nonprestressed reinforcement should be adequate to develope a factored flexural resistance, Mr, at least equal to the lesser of (1) 1.33 times the factored moment required by the applicable strength load combinations and (2) Mcr.
The LRFD Specifications give a similar procedure for computing the cracking moment, Mcr.
rnc
cdncccpercr S
SMSffM
1
213 (LRFD Eq. 5.7.3.3.2-1)
where Sc, Snc = composite and noncomposite section modulus, fcpe = compressive stress in concrete due to effective prestress forces at extreme fiber of section; fr = modulus of
rupture = LRFD Art. 5.4.2.6 between cf 24.0 and cf 37.0
γ1 = flexural cracking variability factor (1.2 for precast segmental structures and 1.6 for all other concrete structures), γ2 = prestress variability factor (1.1 for bonded tendons and
3-12
1,0 for unbonded tendons), γ3 = ratio of specified minimum yield strength to ultimate tensile strength of the reinforcement (0.67 for A615, Grade 60 reinforcement, 0.75 for A706, Grade 60 reinforcement, 1.0 for prestressed concrete structures). Contrary to the Standard Specifications, the LRFD Specifications require that this criterion be met at all sections.
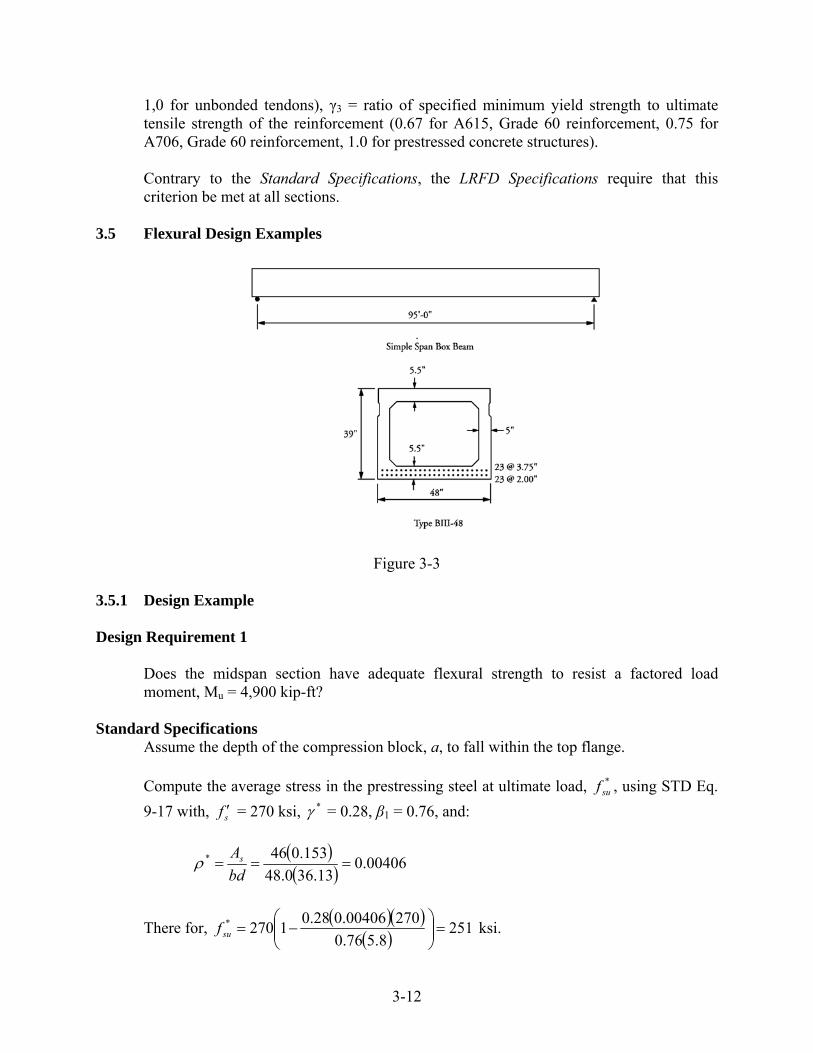
3.5 Flexural Design Examples
Figure 3-3 3.5.1 Design Example Design Requirement 1
Does the midspan section have adequate flexural strength to resist a factored load moment, Mu = 4,900 kip-ft?
Standard Specifications Assume the depth of the compression block, a, to fall within the top flange.
Compute the average stress in the prestressing steel at ultimate load, *suf , using STD Eq.
9-17 with, sf = 270 ksi, * = 0.28, β1 = 0.76, and:
00406.0
13.360.48
153.046* bd
As
There for,
2518.576.0
27000406.028.01270*
suf ksi.
3-13
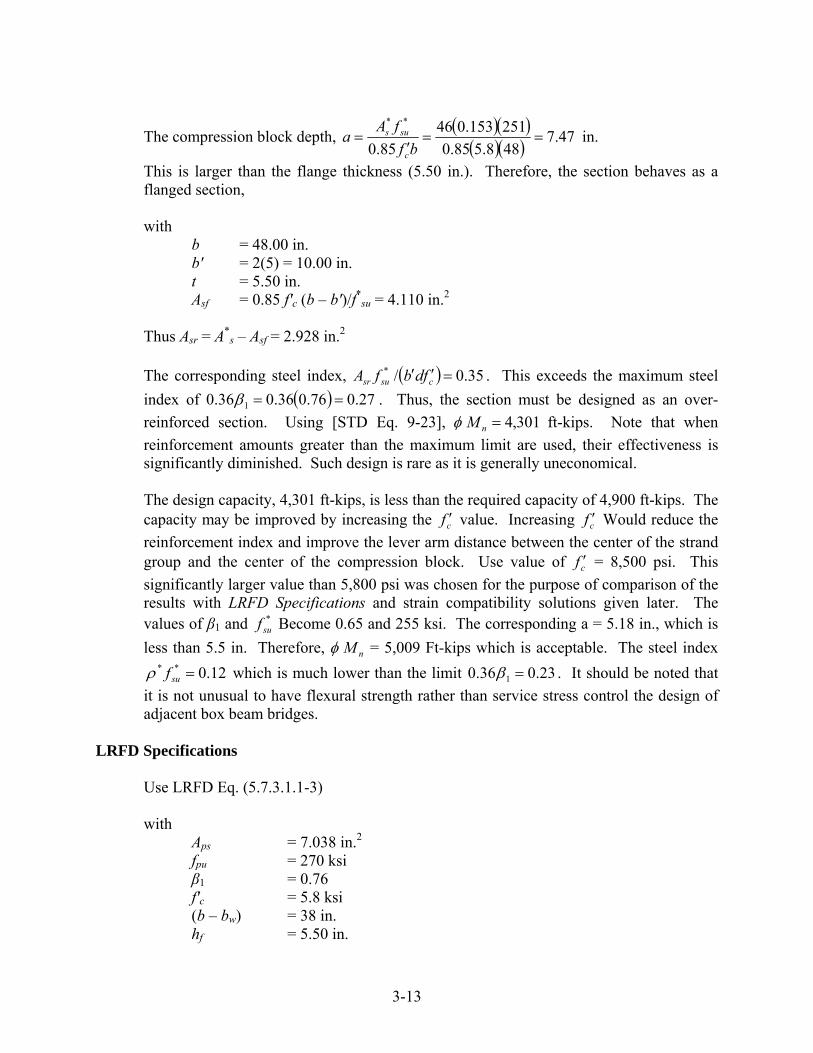
The compression block depth, 47.7
488.585.0
251153.046
85.0
**
bf
fAa
c
sus in.
This is larger than the flange thickness (5.50 in.). Therefore, the section behaves as a flanged section,
with b = 48.00 in. b′ = 2(5) = 10.00 in. t = 5.50 in. Asf = 0.85 f′c (b – b′)/f*
su = 4.110 in.2 Thus Asr = A*
s – Asf = 2.928 in.2
The corresponding steel index, 35.0/* csusr fdbfA . This exceeds the maximum steel
index of 27.076.036.036.0 1 . Thus, the section must be designed as an over-
reinforced section. Using [STD Eq. 9-23], 301,4 nM ft-kips. Note that when
reinforcement amounts greater than the maximum limit are used, their effectiveness is significantly diminished. Such design is rare as it is generally uneconomical.
The design capacity, 4,301 ft-kips, is less than the required capacity of 4,900 ft-kips. The capacity may be improved by increasing the cf value. Increasing cf Would reduce the
reinforcement index and improve the lever arm distance between the center of the strand group and the center of the compression block. Use value of cf = 8,500 psi. This
significantly larger value than 5,800 psi was chosen for the purpose of comparison of the results with LRFD Specifications and strain compatibility solutions given later. The values of β1 and *
suf Become 0.65 and 255 ksi. The corresponding a = 5.18 in., which is
less than 5.5 in. Therefore, nM = 5,009 Ft-kips which is acceptable. The steel index
12.0** suf which is much lower than the limit 23.036.0 1 . It should be noted that
it is not unusual to have flexural strength rather than service stress control the design of adjacent box beam bridges.
LRFD Specifications Use LRFD Eq. (5.7.3.1.1-3) with Aps = 7.038 in.2 fpu = 270 ksi β1 = 0.76 f′c = 5.8 ksi (b – bw) = 38 in. hf = 5.50 in.
3-14
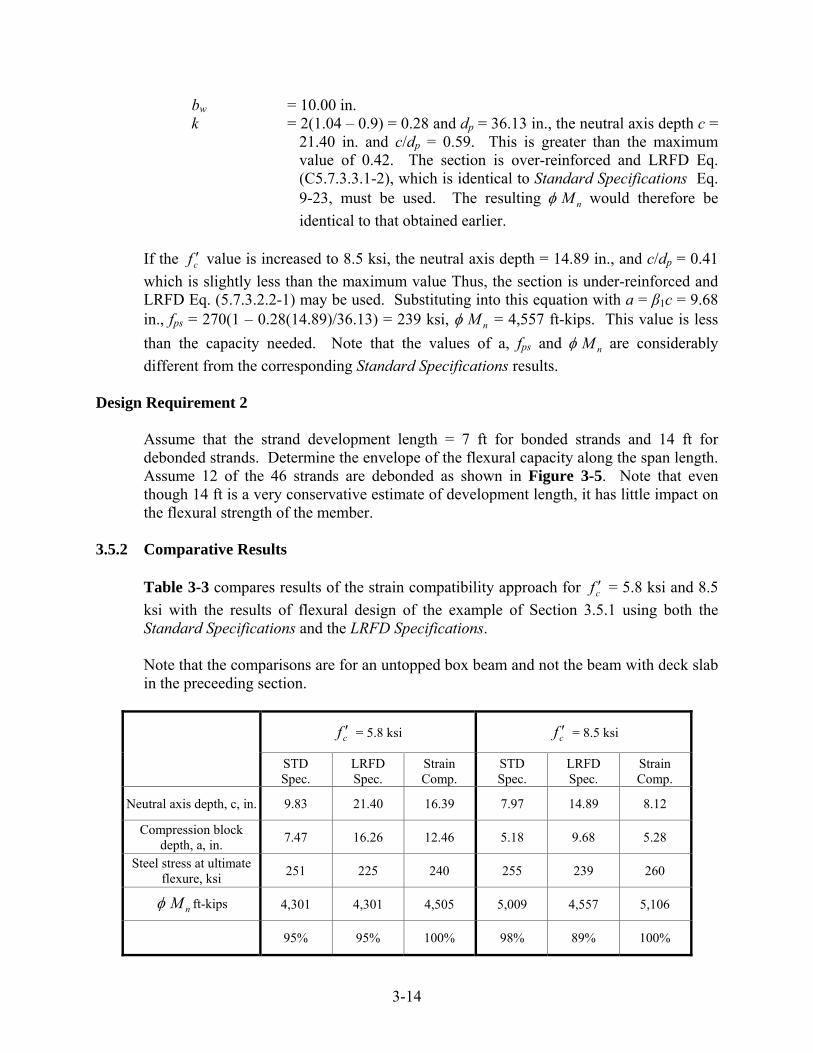
bw = 10.00 in. k = 2(1.04 – 0.9) = 0.28 and dp = 36.13 in., the neutral axis depth c =
21.40 in. and c/dp = 0.59. This is greater than the maximum value of 0.42. The section is over-reinforced and LRFD Eq. (C5.7.3.3.1-2), which is identical to Standard Specifications Eq. 9-23, must be used. The resulting nM would therefore be
identical to that obtained earlier.
If the cf value is increased to 8.5 ksi, the neutral axis depth = 14.89 in., and c/dp = 0.41
which is slightly less than the maximum value Thus, the section is under-reinforced and LRFD Eq. (5.7.3.2.2-1) may be used. Substituting into this equation with a = β1c = 9.68 in., fps = 270(1 – 0.28(14.89)/36.13) = 239 ksi, nM = 4,557 ft-kips. This value is less
than the capacity needed. Note that the values of a, fps and nM are considerably
different from the corresponding Standard Specifications results. Design Requirement 2
Assume that the strand development length = 7 ft for bonded strands and 14 ft for debonded strands. Determine the envelope of the flexural capacity along the span length. Assume 12 of the 46 strands are debonded as shown in Figure 3-5. Note that even though 14 ft is a very conservative estimate of development length, it has little impact on the flexural strength of the member.
3.5.2 Comparative Results
Table 3-3 compares results of the strain compatibility approach for cf = 5.8 ksi and 8.5
ksi with the results of flexural design of the example of Section 3.5.1 using both the Standard Specifications and the LRFD Specifications.
Note that the comparisons are for an untopped box beam and not the beam with deck slab in the preceeding section.
cf = 5.8 ksi cf = 8.5 ksi
STD Spec.
LRFD Spec.
Strain Comp.
STD Spec.
LRFD Spec.
Strain Comp.
Neutral axis depth, c, in. 9.83 21.40 16.39 7.97 14.89 8.12
Compression block depth, a, in.
7.47 16.26 12.46 5.18 9.68 5.28
Steel stress at ultimate flexure, ksi
251 225 240 255 239 260
nM ft-kips 4,301 4,301 4,505 5,009 4,557 5,106
95% 95% 100% 98% 89% 100%
3-15
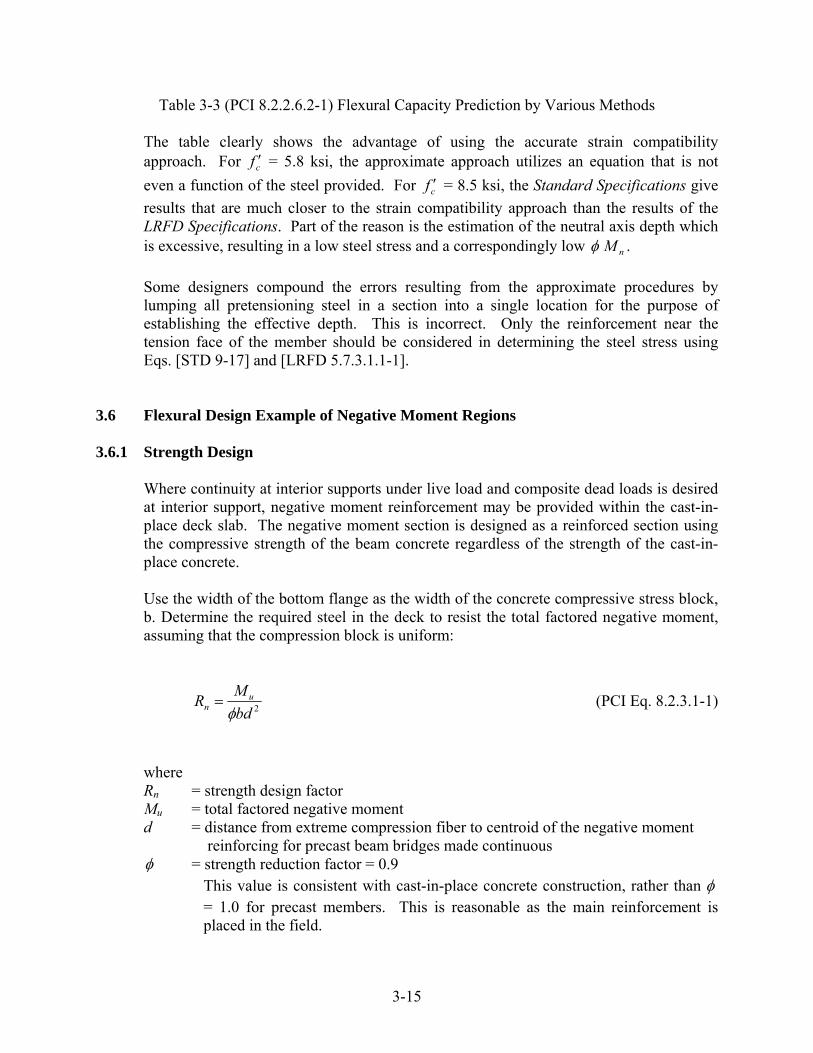
Table 3-3 (PCI 8.2.2.6.2-1) Flexural Capacity Prediction by Various Methods
The table clearly shows the advantage of using the accurate strain compatibility approach. For cf = 5.8 ksi, the approximate approach utilizes an equation that is not
even a function of the steel provided. For cf = 8.5 ksi, the Standard Specifications give
results that are much closer to the strain compatibility approach than the results of the LRFD Specifications. Part of the reason is the estimation of the neutral axis depth which is excessive, resulting in a low steel stress and a correspondingly low nM .
Some designers compound the errors resulting from the approximate procedures by lumping all pretensioning steel in a section into a single location for the purpose of establishing the effective depth. This is incorrect. Only the reinforcement near the tension face of the member should be considered in determining the steel stress using Eqs. [STD 9-17] and [LRFD 5.7.3.1.1-1].
3.6 Flexural Design Example of Negative Moment Regions 3.6.1 Strength Design
Where continuity at interior supports under live load and composite dead loads is desired at interior support, negative moment reinforcement may be provided within the cast-in-place deck slab. The negative moment section is designed as a reinforced section using the compressive strength of the beam concrete regardless of the strength of the cast-in-place concrete.
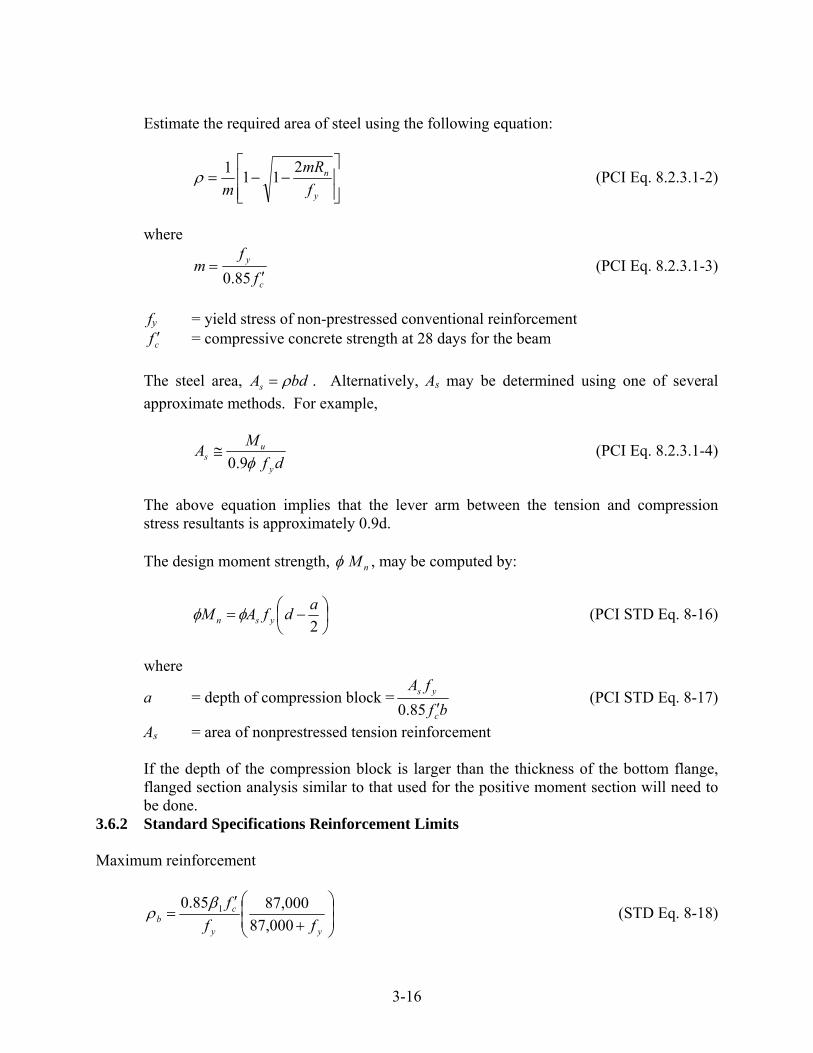
Use the width of the bottom flange as the width of the concrete compressive stress block, b. Determine the required steel in the deck to resist the total factored negative moment, assuming that the compression block is uniform:
2bd
MR u
n (PCI Eq. 8.2.3.1-1)
where Rn = strength design factor Mu = total factored negative moment d = distance from extreme compression fiber to centroid of the negative moment
reinforcing for precast beam bridges made continuous = strength reduction factor = 0.9
This value is consistent with cast-in-place concrete construction, rather than = 1.0 for precast members. This is reasonable as the main reinforcement is placed in the field.
3-16
Estimate the required area of steel using the following equation:
y
n
f
mR
m
211
1 (PCI Eq. 8.2.3.1-2)
where
c
y
f
fm
85.0 (PCI Eq. 8.2.3.1-3)
fy = yield stress of non-prestressed conventional reinforcement cf = compressive concrete strength at 28 days for the beam
The steel area, bdAs . Alternatively, As may be determined using one of several
approximate methods. For example,
df
MA
y
us 9.0 (PCI Eq. 8.2.3.1-4)
The above equation implies that the lever arm between the tension and compression stress resultants is approximately 0.9d.
The design moment strength, nM , may be computed by:
2
adfAM ysn (PCI STD Eq. 8-16)
where
a = depth of compression block =bf
fA
c
ys
85.0 (PCI STD Eq. 8-17)
As = area of nonprestressed tension reinforcement
If the depth of the compression block is larger than the thickness of the bottom flange, flanged section analysis similar to that used for the positive moment section will need to be done.
3.6.2 Standard Specifications Reinforcement Limits Maximum reinforcement
yy
cb ff
f
000,87
000,8785.0 1 (STD Eq. 8-18)

3-17
b 75.0max (STD Art. 8.16.3.1.1)
Minimum reinforcement
The total amount of nonprestressed reinforcement should be adequate to develop an ultimate moment at the critical section at least 1.2 times the cracking moment. The cracking moment may be calculated as for a prestressed concrete section except fpe = 0.
crn MM 2.1
3.6.3 LRFD Specifications Reinforcement Limits Maximum reinforcement
PROVISION DELETED IN 2005 Minimum reinforcement [LRFD Art. 5.7.3.3.2] Requirements for minimum reinforcement in the negative moment region are the same as in the positive moment region in Section 8.2.2.3.3. 3.6.4 Serviceability
The deck slab is not prestressed and therefore is not subjected to the tensile stress limits specified under service load conditions for prestressed concrete members. Distribution of the flexural reinforcement in the deck slab should be checked in order to control cracking. The best crack control is obtained when the steel reinforcement is well distributed over the zone of maximum concrete tension [STD 8.17.2.1]. Several bars at moderate spacing are more effective in controlling cracking than one or two larger bars of equivalent area. Crack width is controlled by:
steel stress
thickness of concrete cover area of concrete surrounding each individual reinforcing bar surface condition of the reinforcing bars
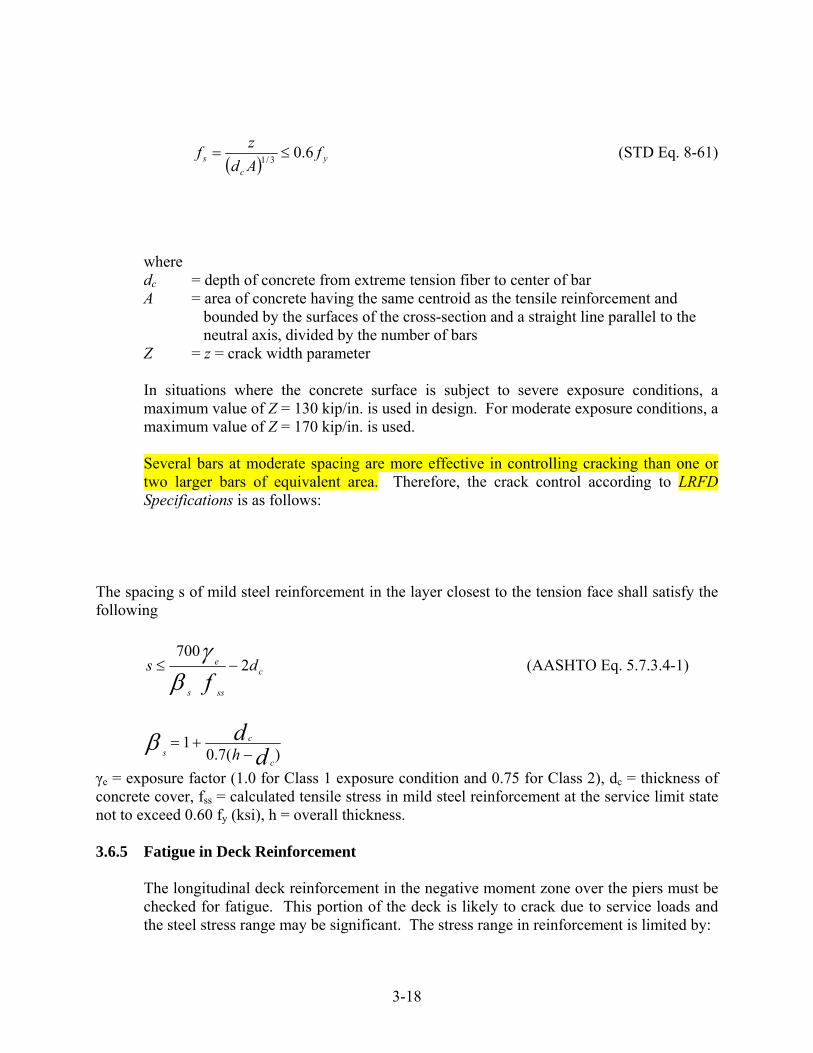
The Standard Specifications use the following approach for crack control. The tensile stress in the mild reinforcement at service loads, fs should not exceed:
3-18
y
c
s fAd
zf 6.0
3/1 (STD Eq. 8-61)
where dc = depth of concrete from extreme tension fiber to center of bar A = area of concrete having the same centroid as the tensile reinforcement and
bounded by the surfaces of the cross-section and a straight line parallel to the neutral axis, divided by the number of bars
Z = z = crack width parameter
In situations where the concrete surface is subject to severe exposure conditions, a maximum value of Z = 130 kip/in. is used in design. For moderate exposure conditions, a maximum value of Z = 170 kip/in. is used. Several bars at moderate spacing are more effective in controlling cracking than one or two larger bars of equivalent area. Therefore, the crack control according to LRFD Specifications is as follows:
The spacing s of mild steel reinforcement in the layer closest to the tension face shall satisfy the following
c
sss
e dsf
2700
(AASHTO Eq. 5.7.3.4-1)
)(7.01
dd
c
c
s h
γe = exposure factor (1.0 for Class 1 exposure condition and 0.75 for Class 2), dc = thickness of concrete cover, fss = calculated tensile stress in mild steel reinforcement at the service limit state not to exceed 0.60 fy (ksi), h = overall thickness.
3.6.5 Fatigue in Deck Reinforcement
The longitudinal deck reinforcement in the negative moment zone over the piers must be checked for fatigue. This portion of the deck is likely to crack due to service loads and the steel stress range may be significant. The stress range in reinforcement is limited by:
3-19
h
rff f 833.021 min (STD Eq. 8-60)
where ff = stress range fmin = algebraic minimum stress level, positive if tension, negative if compression r/h = ratio of base radius to height of rolled-on transverse deformations; if the actual
value is not known, 0.3 may be used.
For stress calculation according to the LRFD Specifications, the special fatigue truck loading must be introduced to the continuous structure.
3.7 Shear
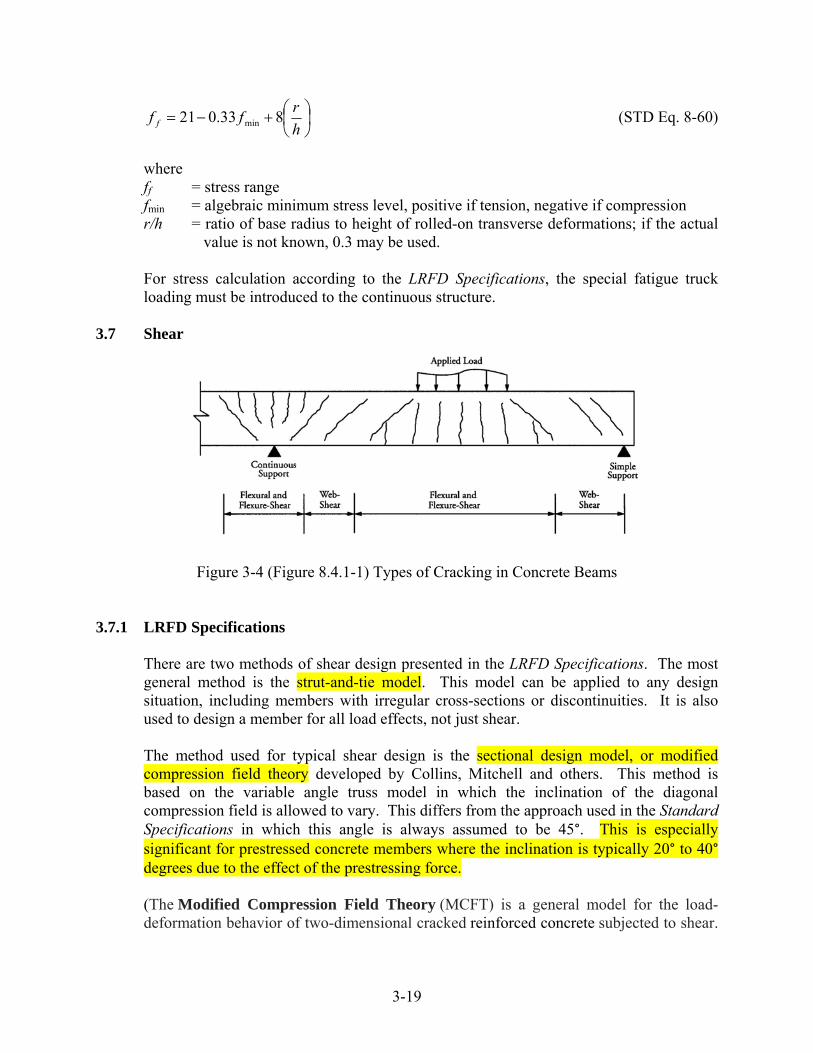
Figure 3-4 (Figure 8.4.1-1) Types of Cracking in Concrete Beams 3.7.1 LRFD Specifications
There are two methods of shear design presented in the LRFD Specifications. The most general method is the strut-and-tie model. This model can be applied to any design situation, including members with irregular cross-sections or discontinuities. It is also used to design a member for all load effects, not just shear.
The method used for typical shear design is the sectional design model, or modified compression field theory developed by Collins, Mitchell and others. This method is based on the variable angle truss model in which the inclination of the diagonal compression field is allowed to vary. This differs from the approach used in the Standard Specifications in which this angle is always assumed to be 45°. This is especially significant for prestressed concrete members where the inclination is typically 20° to 40° degrees due to the effect of the prestressing force.
(The Modified Compression Field Theory (MCFT) is a general model for the load-deformation behavior of two-dimensional cracked reinforced concrete subjected to shear.
3-20
It models concrete considering concrete stresses in principal directions summed with reinforcing stresses assumed to be only axial.) This model also differs from the shear design method found in the Standard Specifications because the concrete contribution, Vc, is attributed to tension being carried across the compression diagonals. The contribution has been determined experimentally and has been related to the strain in the tension side of the member. In general, the higher the strain in the tension side at ultimate, the wider the shear cracks, and in turn the smaller the concrete contribution.
It is significant to note that the concrete contribution, Vc, is what sets the sectional design model apart from the strut-and-tie model. Both models are based on the variable-angle truss analogy in which a concrete member resists loads by a truss composed of concrete “compression struts” and steel “tension ties.” While this model is an effective tool in estimating the shear capacity of concrete members, it has been found to underestimate Vc when compared to test results. Therefore, the sectional design method can be expected to give higher capacities than the strut-and-tie model.
- LRFD 5.8.2.4 Regions required transverse reinforcement:
Vu > 0.5 (Vc + Vp) (LRFD Eq. 5.8.2.4-1)
- LRFD 5.8.2.5 Minimum transverse reinforcement:
y
vcv f
sbfA 0316.0 (LRFD Eq. 5.8.2.5-1)
- LRFD 5.8.2.7 Maximum spacing of transverse reinforcement:
If vu < 0.125f’c, then smax = 0.8dv 24 inch (LRFD Eq. 5.8.2.7-1) If vu 0.125f’c, then smax = 0.4dv 12 inch (LRFD Eq. 5.8.2.7-2)
- LRFD 5.8.2.9 Shear Stress on Concrete:
vv
pu
u db
VVv
(LRFD Eq. 5.8.2.9-1)
3-21
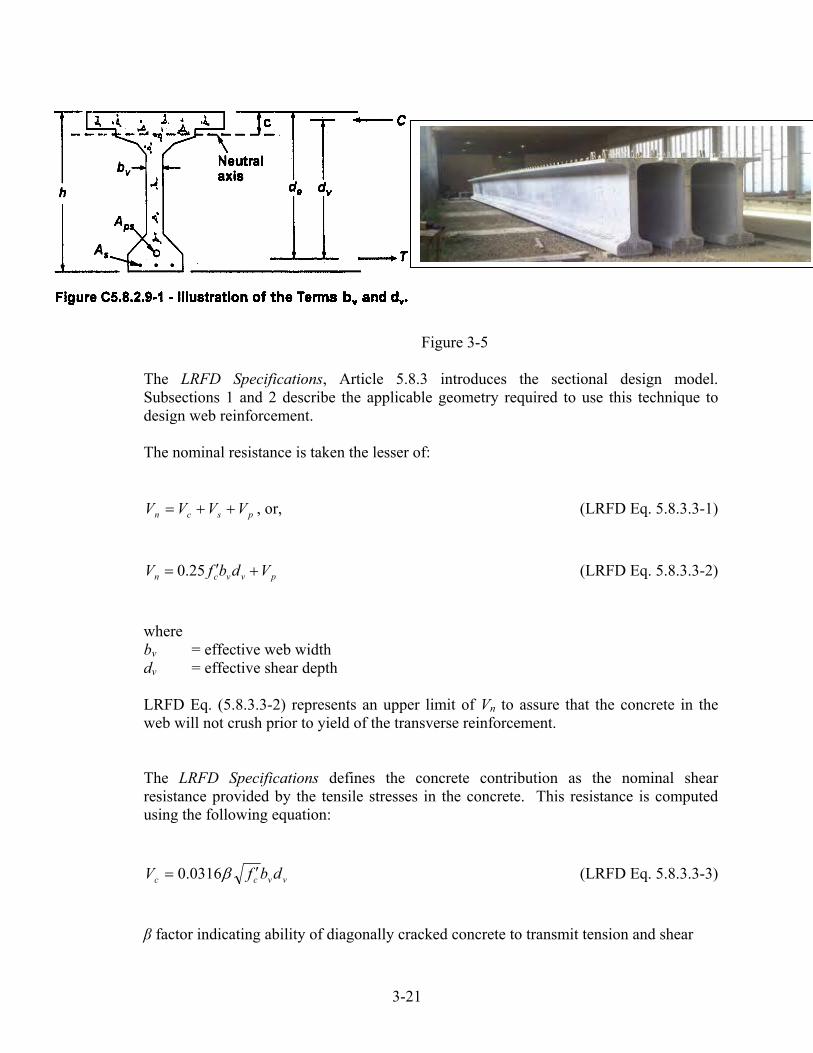
Figure 3-5
The LRFD Specifications, Article 5.8.3 introduces the sectional design model. Subsections 1 and 2 describe the applicable geometry required to use this technique to design web reinforcement.
The nominal resistance is taken the lesser of:
pscn VVVV , or, (LRFD Eq. 5.8.3.3-1)
pvvcn VdbfV 25.0 (LRFD Eq. 5.8.3.3-2)
where bv = effective web width dv = effective shear depth
LRFD Eq. (5.8.3.3-2) represents an upper limit of Vn to assure that the concrete in the web will not crush prior to yield of the transverse reinforcement.
The LRFD Specifications defines the concrete contribution as the nominal shear resistance provided by the tensile stresses in the concrete. This resistance is computed using the following equation:
vvcc dbfV 0316.0 (LRFD Eq. 5.8.3.3-3)
β factor indicating ability of diagonally cracked concrete to transmit tension and shear
3-22
If minimum amount of transverse reinforcement,
)7501(
8.4
s
(LRFD Eq. 5.8.3.4.2-1)
If not,
)39(
51
)7501(
8.4
xcs s
(LRFD Eq. 5.8.3.4.2-2)
s 350029 (LRFD Eq. 5.8.3.4.2-3)
The units used in the LRFD Specifications are kips and inches. The factor 0.0316 is equal to
000,1
1
which coverts the expression from psi to ksi units for the concrete compressive strength. The contribution of the web reinforcement is given by the general equation:
s
dfAV vyv
s
sincotcot (LRFD Eq. 5.8.3.3-4)
where the angles, and , represent the inclination of the diagonal compressive stresses measured from the horizontal beam axis and the angle of inclination of transverse reinforcement to longitudinal axis..
For cases of vertical web reinforcement, the expression for Vs simplifies to:
s
dfAV vyv
s
cot (LRFD Eq. C5.8.3.3-1)
Transverse shear reinforcement should be provided when: pcu VVV 5.0 (LRFD Eq. 5.8.2.4-1)
3-23
Where the reaction force in the direction of the applied shear introduces compression into the end region of a member, the location of the critical section for shear shall be take as dv from the internal face of the support.
To determine the nominal resistance, the design engineer must determine and from the LRFD Specifications, Article 5.8.3.4. For mildly reinforced concrete sections, the values of and are and 45 respectively. These will produce results similar to the Standard Specifications. However, for prestressed concrete, the engineer can take advantage of the precompression and use lower angles of , which optimizes the web reinforcement.
3.7.2 Design Procedure
To design the member for shear, the designer first determines the factored shear due to applied loads at the section under investigation. The value for dv is generally taken from midspan flexural capacity calculations, where dv = d – a/2. The shear contribution from any harped strand, Vp, is then computed.
In lieu of more involved procedures, s shall be determined as:
002.0
cot5.05.0
pspss
popspuuv
u
s AEAE
fAVVNd
M
(LRFD Eq.5.8.3.4.2-4)
The specifications indicate that the area of prestressing steel, Aps, must account for lack of development near the ends of prestressed beams. Any mild reinforcement or strand in the compression zone of the member, which is takenas one-half of the overall depth (h/2), should be neglected when computing As and Aps for use in this calculation. This is very important when evaluating members with harped strand, since near the end of typical beams, harped strands are near the top of the beam. Because of this, it is recommended that the straight and harped strands be considered separately in the analysis. It is the physical location of each strand that is important and not the centroid of the group.
The variable, fpo, represents the stress in the prestressing strand when the stress in the surrounding concrete is zero. For the usual level of prestressing, 0.7fpu may be used.
3-24
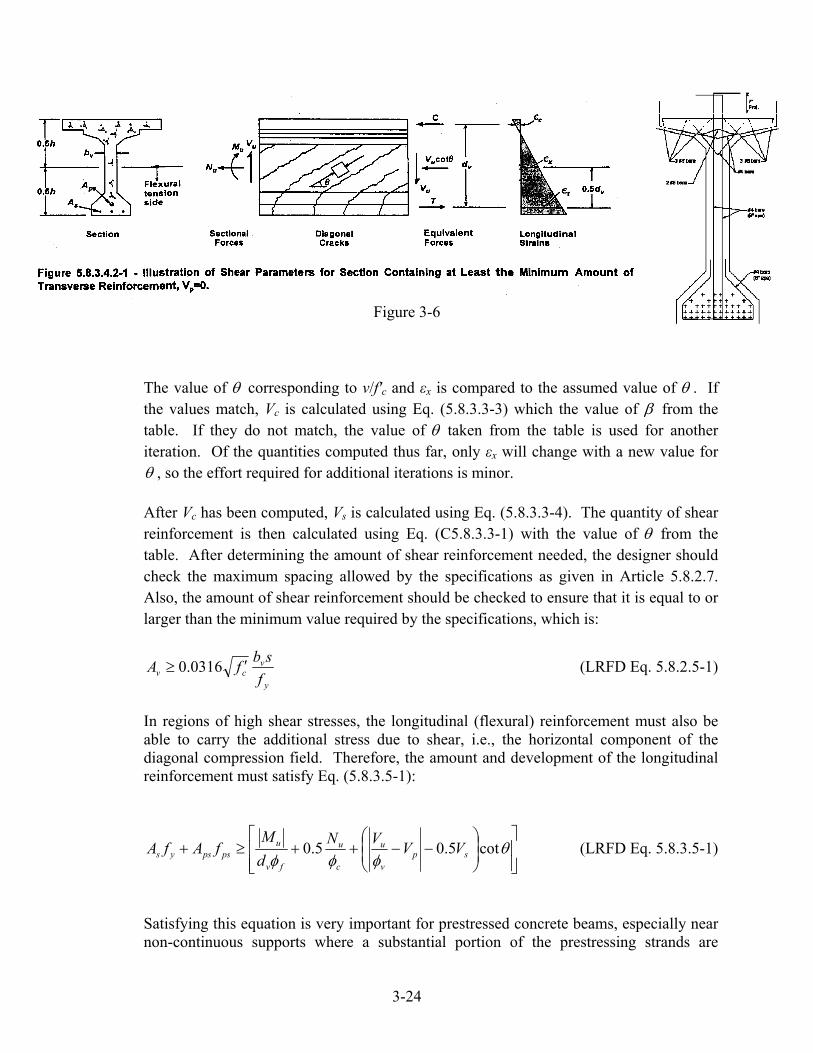
Figure 3-6
The value of corresponding to v/f′c and εx is compared to the assumed value of . If the values match, Vc is calculated using Eq. (5.8.3.3-3) which the value of from the table. If they do not match, the value of taken from the table is used for another iteration. Of the quantities computed thus far, only εx will change with a new value for , so the effort required for additional iterations is minor.
After Vc has been computed, Vs is calculated using Eq. (5.8.3.3-4). The quantity of shear reinforcement is then calculated using Eq. (C5.8.3.3-1) with the value of from the table. After determining the amount of shear reinforcement needed, the designer should check the maximum spacing allowed by the specifications as given in Article 5.8.2.7. Also, the amount of shear reinforcement should be checked to ensure that it is equal to or larger than the minimum value required by the specifications, which is:
y
vcv f
sbfA 0316.0 (LRFD Eq. 5.8.2.5-1)
In regions of high shear stresses, the longitudinal (flexural) reinforcement must also be able to carry the additional stress due to shear, i.e., the horizontal component of the diagonal compression field. Therefore, the amount and development of the longitudinal reinforcement must satisfy Eq. (5.8.3.5-1):
cot5.05.0 sp
v
u
c
u
fv
upspsys VV
VN
d
MfAfA (LRFD Eq. 5.8.3.5-1)
Satisfying this equation is very important for prestressed concrete beams, especially near non-continuous supports where a substantial portion of the prestressing strands are

3-25
harped and the transfer length of the strand extends into the span. Harped strands are not effective in contributing to this longitudinal reinforcement requirement since they are above midheight of the member.
The LRFD Specifications require that this criterion be checked at the face of the bearing. At this section, which usually lies within the transfer length of the strands, the effective prestressing force in the strands is not fully developed. Thus, the term fps should be calculated as a portion of the effective prestress force based on linear variation starting from zero at the end of the beam to full effective prestress at the transfer length. The designer should not be confused by the term fps, which generally refers to the prestress force at Strength Limit State, because the strands at this section do not have enough development length to provide such level of prestress. If the strands are well anchored in a diaphragm at the end of the member, the stress in the strands, fps, can be considered to equal the stress in the strands at Strength Limit State. This approach of varying fps to account for lack of development is preferred over the method implied by the definition of Aps for the lack of development.
3.8 Horizontal Interface Shear – Shear Friction (PCI 8.5) 3.8.1 Theory
Cast-in-place concrete decks designed to act compositely with precast concrete beams must be able to resist the horizontal shearing forces at the interface between the two elements. The basic strength equation for the design of the interface between the deck and beam is:
nhu VV (STD Eq. 9-31a)
where Vu = factored shear force acting on the interface = strength reduction factor Vnh = nominal shear capacity of the interface
Design is carried out at various locations along the span, similar to vertical shear design. Theoretical calculation of the shearing force acting on the interface at a given section is not simple because the section does not behave as a linear elastic material near ultimate capacity. If it did, the shear stress, horizontal or vertical, at any fiber in a cross-section would be calculated from the familiar equation:
Ib
VQvh (PCI Eq. 8.5.1-1)
Where V = vertical shear force at the section I = moment of inertia b = section width at the fiber being considered
3-26
Q = first moment of the area above (or below) the fiber being considered
However, at ultimate conditions, the material is no longer elastic and the concrete may be cracked at the section being considered. Further, the composite cross-section consists of two different types of concrete with different properties. Therefore, application of the above equation to design at ultimate, without modification, would yield questionable results.
Loov and Patnaik (1994) determined that the above equation may yield adequate results if both the cracked section moment of inertia and area moment of a transformed composite section are used. The section would be transformed using the slab-to-beam modular ratio used in flexural design by the allowable stress method. However, this approach is still too complicated. It confuses the calculations at two limit states: service and ultimate.
Kamel (1996) used equilibrium of forces to show that: vh bjdVv / (PCI Eq. 8.5.1-2)
where V = factored vertical shear at the section in question d = effective depth of the member jd = distance between the tension and compression resultant stresses in the section.
This is the same distance as dv used in the LRFD Specifications. bv = section width at the interface between the precast and the cast-in-place concrete.
It is important to understand that bv is not the web width.
Another important issue is which loads should be used to calculate Vu at a section. Neither the Standard Specifications nor the LRFD Specifications give guidance in this regard. While most designers would use all loads to compute Vu, a strong case can be made for excluding the self-weight of the precast concrete member, and the weight of the deck since they are present prior to composite action taking effect. Some designers and agencies, such as the Illinois Department of Transportation, use only the composite loads, which include the superimposed dead loads (barriers, wearing surface, etc.) and the live loads. Fortunately, the amount of reinforcement required, even with consideration of all loads, is reasonable in practical applications.
To determine the shear capacity of the interface, the LRFD Specifications use a form of the well-established shear friction theory, while the Standard Specifications use an empirical approach based on several investigations, for example, Birkeland and Birkeland (1966), Mast (1968), Kriz and Raths (1965) and Hofbeck, et al (1969).
It is not possible to directly compare the results of the two specifications because the method used in the Standard Specifications is stated in terms of vertical shear while in the LRFD Specifications is stated in terms of horizontal (interface) shear.
3-27
3.8.2 LRFD Specifications
LRFD Specifications give no guidance for computing horizontal shear due to factored loads. The following formula may be used as discussed in Section 3.8.1 with the substitution dv for jd:
vv
uuh bd
Vv or
v
uh d
VV (PCI Eq. 8.5.3-1)
where vuh = horizontal factored shear force per unit area of interface Vu = factored vertical shear force at specified section due to superimposed loads dv = the distance between resultants of tensile and compressive forces = bv = interface width Vh = factored horizontal shear force per unit length of interface Required strength ≤ nominal strength, or: ncvuh VAv
Equivalent to: Vh ≤ Vn (PCI Eq. 8.5.3-2) where Vn = nominal shear resistance of the interface surface = cyvfcv PfAcA (LRFD Eq. 5.8.4.1-3)
where c = cohesion factor = 0.10 for this case μ = friction factor = 1.0 for this case Acv = interface area of concrete engaged in shear transfer Avf = area of shear reinforcement crossing the shear plane within area Pc = permanent net compressive force normal to the shear plane (may be
conservatively neglected) fy = yield strength of shear reinforcement
Typically, the top surface of beam is intentionally roughened to an amplitude of 1/4 in.
Therefore, for normal weight concrete cast against hardened, roughened, normal weight concrete, the above relationships may be reduced to the following formula:
cvyvfuh AfAv /1.0 (PCI Eq. 8.5.3-3)
where the minimum yvvf fbA /05.0
Nominal shear resistance of the interface plane is the lesser of:
3-28
cvcni AfKV 1 , and, (LRFD Eq. 5.8.4.1-4)
cvni AKV 2 (LRFD Eq. 5.8.4.1-5)
While the LRFD Specifications require that minimum reinforcement be provided regardless of the stress level at the interface, designers may choose to limit this reinforcement to cases where
/uhv is greater than 0.10 ksi. This would be consistent with the Standard Specifications, the
ACI Code and other references. It would seem to be impractical and an unnecessary expense to provide connectors in a number of common applications, such as precast stay-in-place panels if the interface stress is lower than 0.10 ksi. K1 = fraction of concrete strength available to resist interface shear (LRFD Art. 5.8.4.3) K2 = limiting interface shear resistance (LRFD Art. 5.8.4.3)
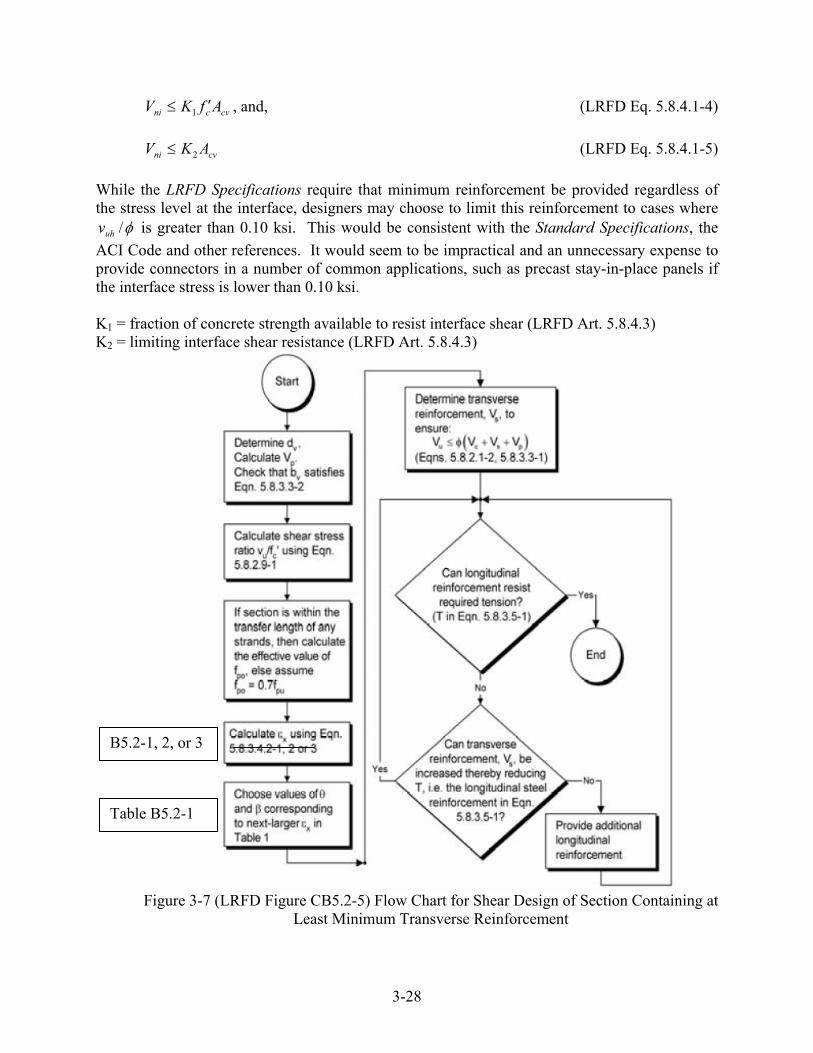
Figure 3-7 (LRFD Figure CB5.2-5) Flow Chart for Shear Design of Section Containing at
Least Minimum Transverse Reinforcement
B5.2-1, 2, or 3
Table B5.2-1
3-29
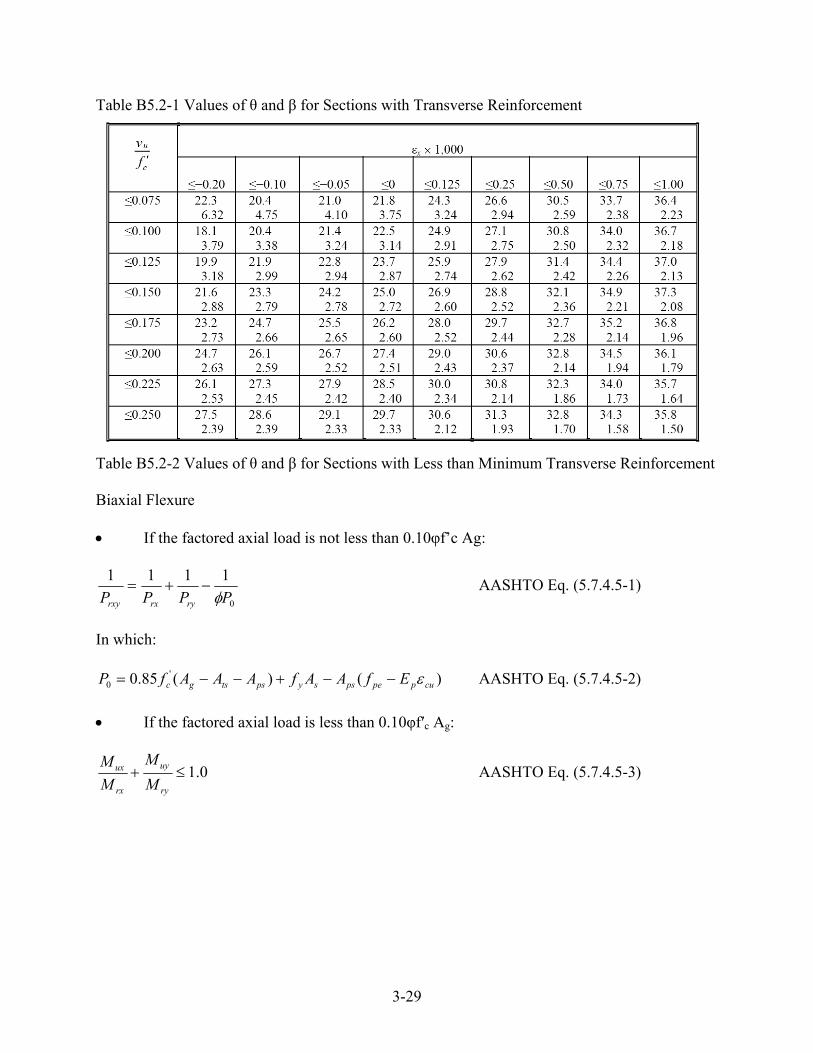
Table B5.2-1 Values of θ and β for Sections with Transverse Reinforcement
Table B5.2-2 Values of θ and β for Sections with Less than Minimum Transverse Reinforcement Biaxial Flexure If the factored axial load is not less than 0.10φf’c Ag:
0
1111
PPPP ryrxrxy AASHTO Eq. (5.7.4.5-1)
In which:
)()(85.0 '0 cuppepssypstsgc EfAAfAAAfP AASHTO Eq. (5.7.4.5-2)
If the factored axial load is less than 0.10φf′c Ag:
0.1ry
uy
rx
ux
M
M
M
M AASHTO Eq. (5.7.4.5-3)