Embed Size (px)
Citation preview
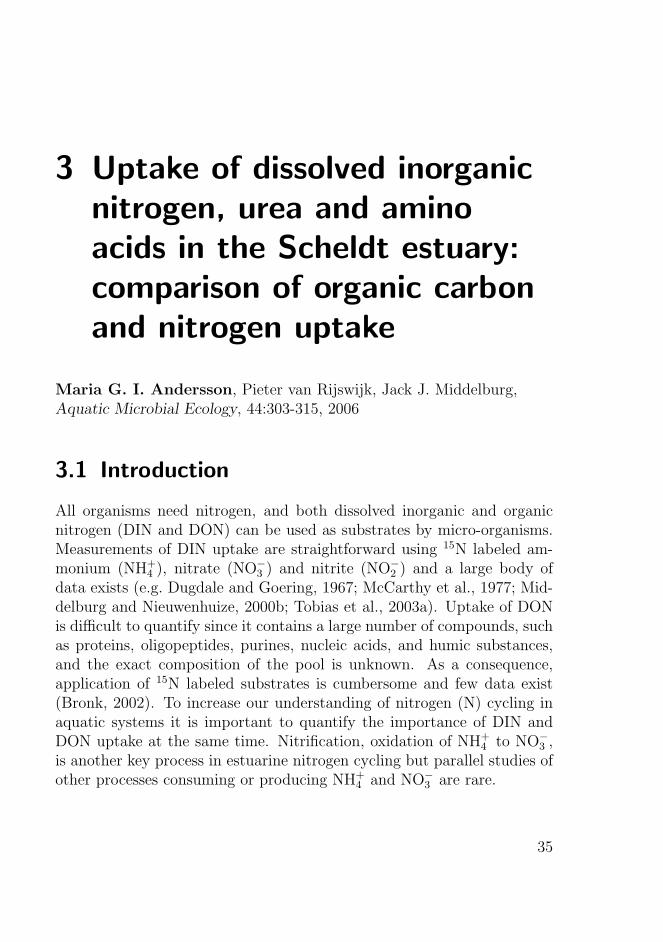
3 Uptake of dissolved inorganicnitrogen, urea and aminoacids in the Scheldt estuary:comparison of organic carbonand nitrogen uptake
Maria G. I. Andersson, Pieter van Rijswijk, Jack J. Middelburg,Aquatic Microbial Ecology, 44:303-315, 2006
3.1 Introduction
All organisms need nitrogen, and both dissolved inorganic and organicnitrogen (DIN and DON) can be used as substrates by micro-organisms.Measurements of DIN uptake are straightforward using 15N labeled am-monium (NH+
4 ), nitrate (NO−3 ) and nitrite (NO−
2 ) and a large body ofdata exists (e.g. Dugdale and Goering, 1967; McCarthy et al., 1977; Mid-delburg and Nieuwenhuize, 2000b; Tobias et al., 2003a). Uptake of DONis difficult to quantify since it contains a large number of compounds, suchas proteins, oligopeptides, purines, nucleic acids, and humic substances,and the exact composition of the pool is unknown. As a consequence,application of 15N labeled substrates is cumbersome and few data exist(Bronk, 2002). To increase our understanding of nitrogen (N) cycling inaquatic systems it is important to quantify the importance of DIN andDON uptake at the same time. Nitrification, oxidation of NH+
4 to NO−3 ,
is another key process in estuarine nitrogen cycling but parallel studies ofother processes consuming or producing NH+
4 and NO−3 are rare.
35

3 Uptake of dissolved inorganic nitrogen, urea and amino acids
Many studies have shown DON to be an important N source for phyto-plankton (Palenik and Morel, 1990; Bronk and Glibert, 1993; Berman andChava, 1999; Fan and Glibert, 2005) as well as for heterotrophic bacte-ria (Wheeler and Kirchman, 1986; Hoch and Kirchman, 1995; Middelboeet al., 1995; Rosenstock and Simon, 2001). The majority of these studieseither measured uptake of total DON in laboratory cultures or quantifiedthe uptake of well-defined substrates (e.g. amino acids) in batch culturesor in natural samples. Some micro-organisms can use DON-derived N di-rectly (Berg et al., 1997; Mulholland et al., 2002) while others use DONindirectly, i.e. by using extracellular enzymes to mobilize N from DON(Palenik and Morel, 1990; Berg et al., 2002; Mulholland et al., 2003).NH+
4 can also be released from DON through inorganic reactions, such asphotochemical oxidation (Bushaw et al., 1996). It is not clear whether N-containing dissolved organic compounds are used as substrates exclusivelyfor N, for carbon (C), or for both. Previous studies addressing this ques-tion on natural samples are few. Petersen et al. (2004) showed that bothheterotrophic and nitrifying bacteria can incorporate a small amount of Cfrom urea. Jørgensen (2006) reported urea uptake by estuarine bacteriaand concluded that uptake is variable and rather unpredictable. For phy-toplankton, the results are variable and sometimes conflicting (Mulhollandet al., 2002, 2003, 2004; Fan and Glibert, 2005). Fan and Glibert (2005)found urea to be a C substrate during a dinoflagellate bloom, while Mul-holland et al. (2004) concluded that urea was not used as a substrate for Cduring a phytoplankton bloom. Mulholland et al. (2003) reported uncou-pled uptake of amino acid, i.e. N was taken up preferentially to C alongan estuarine gradient. This contradicted their previous findings regard-ing uptake in the phytoplankton Aureococcus anophagefferens, wherebyboth C and N were incorporated from amino acids (Mulholland et al.,2002). Clearly, more observations are required to identify the differentialassimilation of C and N by natural communities.
Another key question is to what extent dissolved organic matter (DOM)contributes to N uptake by bacteria and phytoplankton compared to dis-solved inorganic nutrients, since there are few data on this. In a recentreview, Berman and Bronk (2003) stated that there is still a need forgreater appreciation and understanding of the potential role of DON inaquatic systems. Estuaries receive DIN and DON via riverine input, di-rect land runoff, atmosphere inputs and from the sea. Moreover, during
36
3.2 Materials and Methods
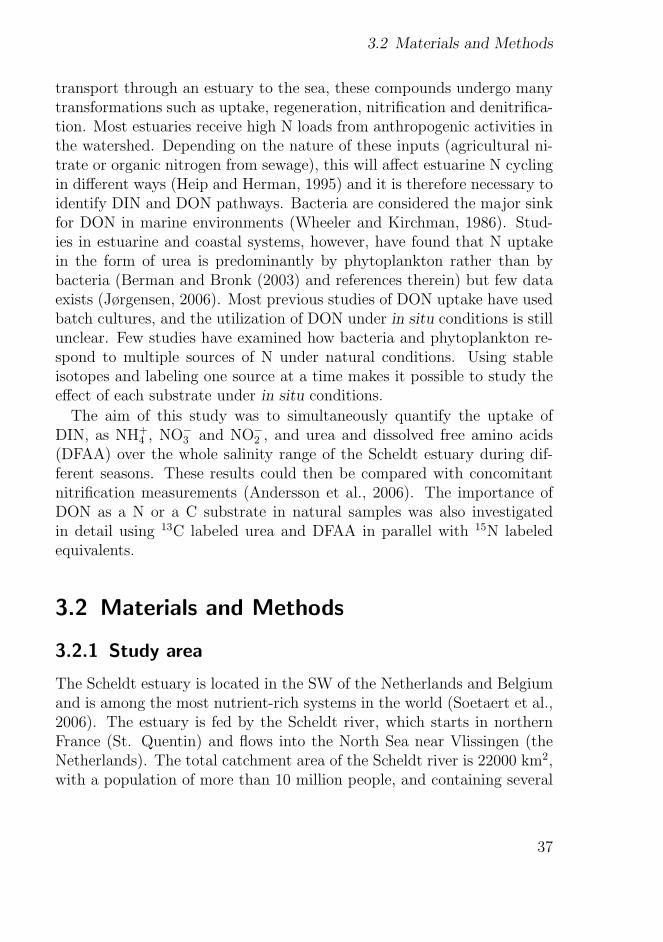
transport through an estuary to the sea, these compounds undergo manytransformations such as uptake, regeneration, nitrification and denitrifica-tion. Most estuaries receive high N loads from anthropogenic activities inthe watershed. Depending on the nature of these inputs (agricultural ni-trate or organic nitrogen from sewage), this will affect estuarine N cyclingin different ways (Heip and Herman, 1995) and it is therefore necessary toidentify DIN and DON pathways. Bacteria are considered the major sinkfor DON in marine environments (Wheeler and Kirchman, 1986). Stud-ies in estuarine and coastal systems, however, have found that N uptakein the form of urea is predominantly by phytoplankton rather than bybacteria (Berman and Bronk (2003) and references therein) but few dataexists (Jørgensen, 2006). Most previous studies of DON uptake have usedbatch cultures, and the utilization of DON under in situ conditions is stillunclear. Few studies have examined how bacteria and phytoplankton re-spond to multiple sources of N under natural conditions. Using stableisotopes and labeling one source at a time makes it possible to study theeffect of each substrate under in situ conditions.
The aim of this study was to simultaneously quantify the uptake ofDIN, as NH+
4 , NO−3 and NO−
2 , and urea and dissolved free amino acids(DFAA) over the whole salinity range of the Scheldt estuary during dif-ferent seasons. These results could then be compared with concomitantnitrification measurements (Andersson et al., 2006). The importance ofDON as a N or a C substrate in natural samples was also investigatedin detail using 13C labeled urea and DFAA in parallel with 15N labeledequivalents.
3.2 Materials and Methods
3.2.1 Study area
The Scheldt estuary is located in the SW of the Netherlands and Belgiumand is among the most nutrient-rich systems in the world (Soetaert et al.,2006). The estuary is fed by the Scheldt river, which starts in northernFrance (St. Quentin) and flows into the North Sea near Vlissingen (theNetherlands). The total catchment area of the Scheldt river is 22000 km2,with a population of more than 10 million people, and containing several
37
3 Uptake of dissolved inorganic nitrogen, urea and amino acids
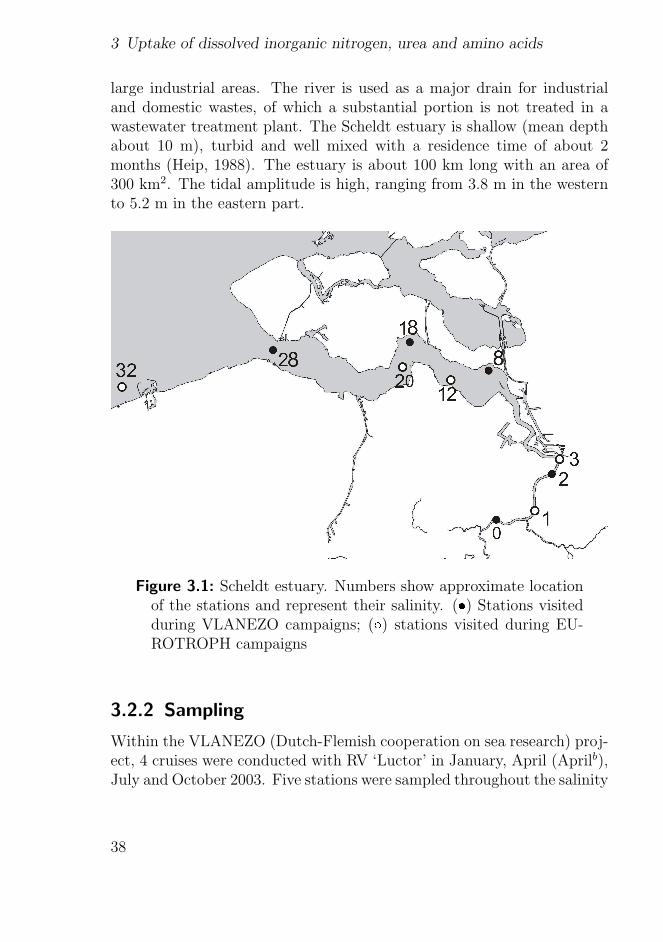
large industrial areas. The river is used as a major drain for industrialand domestic wastes, of which a substantial portion is not treated in awastewater treatment plant. The Scheldt estuary is shallow (mean depthabout 10 m), turbid and well mixed with a residence time of about 2months (Heip, 1988). The estuary is about 100 km long with an area of300 km2. The tidal amplitude is high, ranging from 3.8 m in the westernto 5.2 m in the eastern part.
Figure 3.1: Scheldt estuary. Numbers show approximate locationof the stations and represent their salinity. (�) Stations visitedduring VLANEZO campaigns; (�) stations visited during EU-ROTROPH campaigns
3.2.2 Sampling
Within the VLANEZO (Dutch-Flemish cooperation on sea research) proj-ect, 4 cruises were conducted with RV ‘Luctor’ in January, April (Aprilb),July and October 2003. Five stations were sampled throughout the salinity
38
3.2 Materials and Methods
range during every cruise: Stations 0, 2, 8, 18 and 28, with the numbersreflecting their salinity (Figure 3.1). Water samples were taken with a 20L Niskin bottle from approximately 2 m depth and were subsampled onboard immediately after retrieval of the Niskin bottle. Samples were alsotaken from 17 fixed monitoring stations along a transect covering the wholesalinity gradient from freshwater in the inner estuary to marine conditionsat the mouth. Additional data for DON uptake originate from 2 cruisesconducted within the EUROTROPH project (Gazeau et al., 2005), 1 inNovember 2002 and 1 in early April 2003 (Aprila), 2 weeks before the RV‘Luctor’ cruise. During these cruises 5 or 6 stations were also sampled,covering the whole salinity range (Figure 3.1).
3.2.3 Nutrients
Water was filtered through pre-weighed, pre-combusted Whatman GF/Ffilters (47 mm), stored frozen, and analyzed for NH+
4 , NO−3 and NO−
2 usingautomated colorimetric techniques. The filters were weighed for suspendedparticulate matter (SPM) analysis and concentrations of particulate or-ganic nitrogen (PON) and carbon (POC) were measured with a CarloErba NA 1500 elemental analyzer (Nieuwenhuize et al., 1994). At all sta-tions, salinity, temperature and oxygen were measured. At the VLANEZOstations, DFAA concentrations were measured by HPLC (Fitznar et al.,1999) from the cruises in July and October. Concentrations of urea weremeasured from the cruises in January, July and October using automatedcolorimetric techniques (Middelburg and Nieuwenhuize, 2000a). Waterwas filtered through GF/F filters, which were stored frozen until analysisof chlorophyll a (chl a) by HPLC (Barranguet et al., 1997).
3.2.4 Nitrification measurement
Nitrification rates were measured using 15N labeled NH+4 as described in
Andersson et al. (2006). Briefly, water samples were spiked with 15Nlabeled NH+
4 and, after incubation, the appearance of 15N in NO−3 was
measured based on the diffusion technique of Sigman et al. (1997) andHolmes et al. (1998). NH+
4 and subsequently NO−3 (converted into NH+
4
using Devarda’s alloy) in the sample was trapped on a GF/D filter. The15N content of the GF/D filters was determined using a Fison NA 1500
39
3 Uptake of dissolved inorganic nitrogen, urea and amino acids
elemental analyzer coupled to a Finnigan Delta S masspectrometer via aConflo II interface.
3.2.5 Uptake measurements
N uptake was measured using 15N labeled NH+4 , NO−
3 and NO−2 , urea and
a mixture of 17 algal amino acids (Cambridge Isotope Laboratories, NLM-2161). The amino acid mixture consisted of alanine (7%), arginine (7%),aspartic acid (10%), glutamic acid (10%), glycine (6%), histidine (2%),isoleucine (4%), leucine (10%), lysine (14%), methionine (1%), phenylala-nine (4%), proline (7%), serine (4%), threonine (5%), tyrosine (4%) andvaline (5%) (giving an average C:N ratio of 4 in the amino acid mix).Urea and DFAA uptake was also quantified using 13C labeled urea andDFAA with the same composition as mentioned above. The water sam-ples were spiked with the tracer to a final concentration of 0.1 µM (exceptfor 1 µM of NO−
3 ) and incubated for approximately 2 h in polystyrenebottles at in situ water temperature in the dark and at ambient lightconditions. The incubations were terminated by filtration through pre-combusted (450 ◦C for 4 h) Whatman GF/F filters (20 mm). The filterswere stored frozen until analysis of isotope content of the SPM using aFisons NA 1500 elemental analyzer coupled to a Finnigan Delta S isotoperatio mass spectrometer (EA-IRMS). Rates for specific uptake (V, h−1)of NH+
4 , NO−3 and NO−
2 , urea and DFAA were calculated by dividing theexcess 15N or 13C on the Whatman GF/F filter by the excess 15N or 13Cin the solution h−1 incubation time according to Dugdale and Wilkerson(1986). Absolute uptake rates U, (µmol N L−1 h−1 or µmol C L−1 h−1)were calculated by multiplying V with PON or POC (µmol l−1), depend-ing on which label was added. The rates reported are average values forlight and dark incubations since these showed no statistically significantdifference, consistent with previous studies in this and other turbid, tidalestuaries (Middelburg and Nieuwenhuize, 2000a,b). The errors reportedherein represent the standard deviation of replicate incubations (in boththe dark and light [n = 4], except for January [n = 2]). Uptake rates werenot corrected for isotope dilution because we lacked measurements, andestimated correction factors (based on the Kanda et al., 1987, approach)were very small, as we have reported earlier (Middelburg and Nieuwen-huize, 2000b,a).
40
3.3 Results
3.3 Results
3.3.1 Concentrations
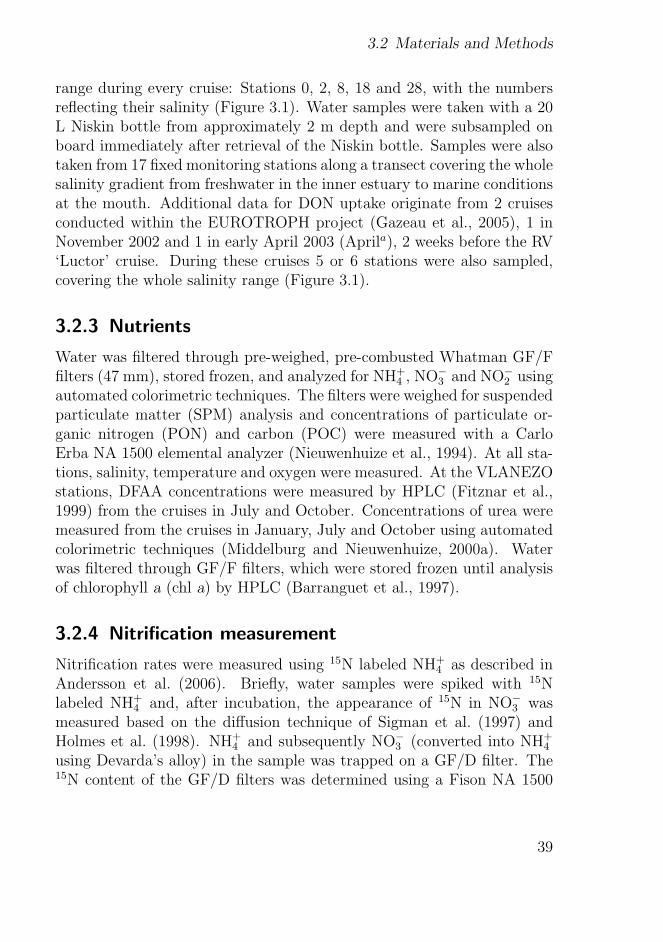
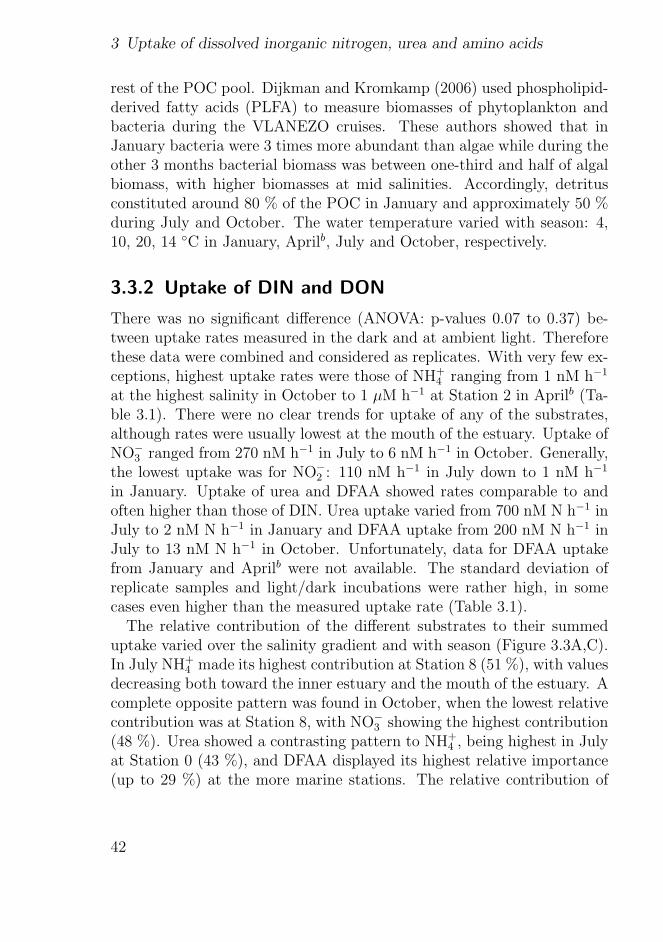
The concentration versus salinity plots show the dynamic cycling of nitro-gen in the Scheldt estuary (Figure 3.2). NH+
4 concentrations were highestin the inner part of the estuary, with concentrations up to 150 µM, andthen rapidly decreased with increasing salinity. The decrease was high-est during July and October. NO−
3 concentrations in the inner part werearound 300 µM and either increased or were uniform until a salinity ofaround 10, thereafter decreasing throughout the estuary. The decrease inNH+
4 and increase in NO−3 in the inner estuary reflect intensive nitrifica-
tion (Andersson et al., 2006). NO−2 levels were low throughout the estuary,
with high concentrations (up to 30 µM) in the inner part. Urea and DFAAconcentrations varied with season, with a fairly stable concentration overthe salinity gradient (around 4 µM N for urea, 2 µM N for DFAA).
O2 concentration varied between seasons and also along the salinitygradient of the estuary. The general trend was low concentrations (evenhypoxic during July and October) in the inner part with increasing concen-trations toward the mouth of the estuary, reaching saturation levels andeven super saturation (415 µM) in Aprilb. SPM varied from 250 mg L−1 inthe fall in the inner part of the estuary to 10 mg L−1 in the marine part inJanuary. POC followed the pattern of SPM and varied from 1200 µM inthe fall in the inner stations to 30 µM at the marine stations in January.pH values were around 7.5 at the inner stations and increased throughoutthe estuary to above 8 at the marine stations. Chl a levels were below10 µg L−1 throughout the whole estuary in January and at the more ma-rine stations in July and October. In the inner estuary the concentrationsof chl a reached values of up to 100 µg L−1 in July and October, and10 to 40 µg L−1 were measured throughout the estuary in Aprilb . Com-paring algal C (converted from chl a using a carbon:chl a ratio of 30;Wetsteyn and Kromkamp, 1994) with total POC we obtained a first-orderestimate of the algal contribution to the POC pool. A bloom of algaewas measured in the marine part of the estuary in Aprilb (Dijkman andKromkamp, 2006), with algae contributing about 75 % to POC. Duringthe other months and in the inner part in Aprilb, algae contributed be-tween 2 and 30 % of the POC, bacteria and detritus accounting for the
41
3 Uptake of dissolved inorganic nitrogen, urea and amino acids
rest of the POC pool. Dijkman and Kromkamp (2006) used phospholipid-derived fatty acids (PLFA) to measure biomasses of phytoplankton andbacteria during the VLANEZO cruises. These authors showed that inJanuary bacteria were 3 times more abundant than algae while during theother 3 months bacterial biomass was between one-third and half of algalbiomass, with higher biomasses at mid salinities. Accordingly, detritusconstituted around 80 % of the POC in January and approximately 50 %during July and October. The water temperature varied with season: 4,10, 20, 14 ◦C in January, Aprilb, July and October, respectively.
3.3.2 Uptake of DIN and DON
There was no significant difference (ANOVA: p-values 0.07 to 0.37) be-tween uptake rates measured in the dark and at ambient light. Thereforethese data were combined and considered as replicates. With very few ex-ceptions, highest uptake rates were those of NH+
4 ranging from 1 nM h−1
at the highest salinity in October to 1 µM h−1 at Station 2 in Aprilb (Ta-ble 3.1). There were no clear trends for uptake of any of the substrates,although rates were usually lowest at the mouth of the estuary. Uptake ofNO−
3 ranged from 270 nM h−1 in July to 6 nM h−1 in October. Generally,the lowest uptake was for NO−
2 : 110 nM h−1 in July down to 1 nM h−1
in January. Uptake of urea and DFAA showed rates comparable to andoften higher than those of DIN. Urea uptake varied from 700 nM N h−1 inJuly to 2 nM N h−1 in January and DFAA uptake from 200 nM N h−1 inJuly to 13 nM N h−1 in October. Unfortunately, data for DFAA uptakefrom January and Aprilb were not available. The standard deviation ofreplicate samples and light/dark incubations were rather high, in somecases even higher than the measured uptake rate (Table 3.1).
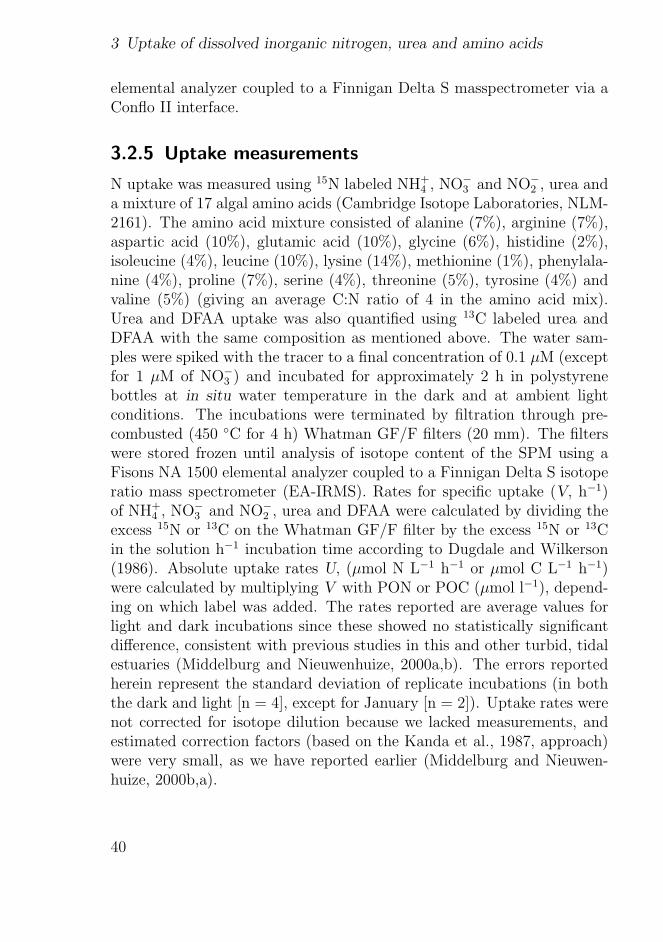
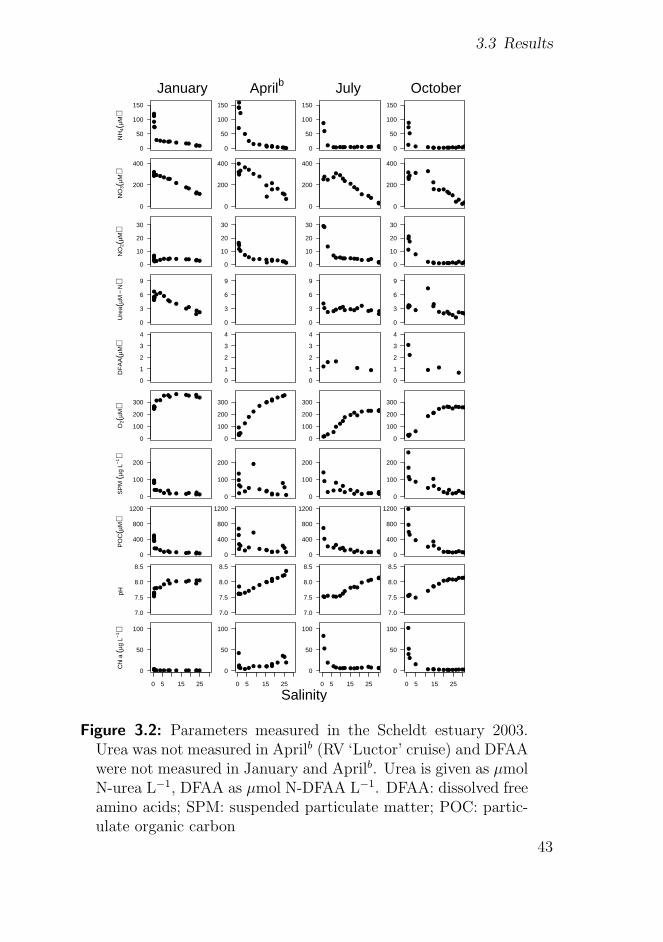
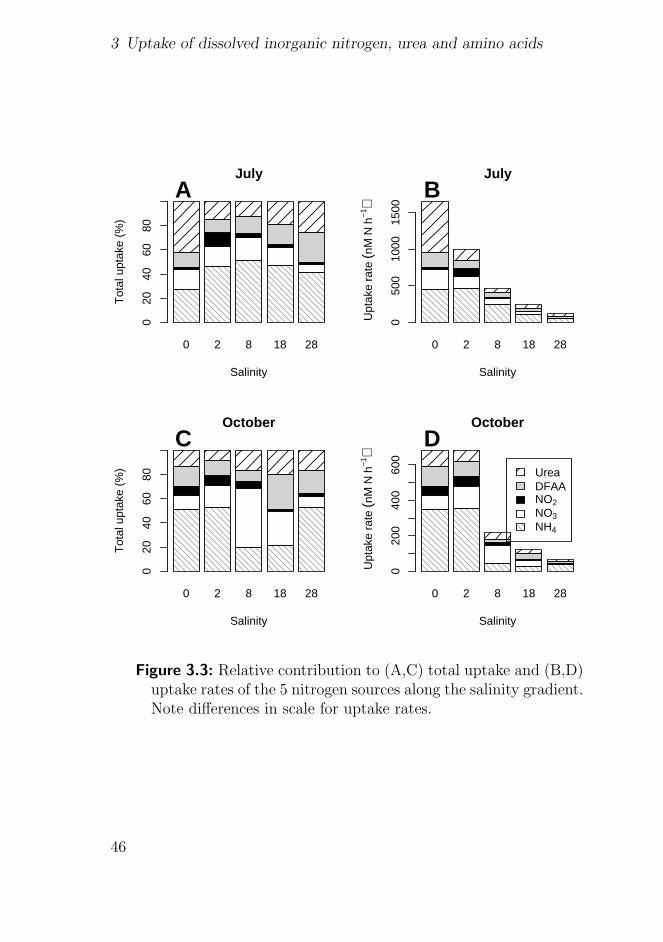
The relative contribution of the different substrates to their summeduptake varied over the salinity gradient and with season (Figure 3.3A,C).In July NH+
4 made its highest contribution at Station 8 (51 %), with valuesdecreasing both toward the inner estuary and the mouth of the estuary. Acomplete opposite pattern was found in October, when the lowest relativecontribution was at Station 8, with NO−
3 showing the highest contribution(48 %). Urea showed a contrasting pattern to NH+
4 , being highest in Julyat Station 0 (43 %), and DFAA displayed its highest relative importance(up to 29 %) at the more marine stations. The relative contribution of
42
3.3 Results
●●●●●●●●●●●
●●
●
●●●
0
50
100
150
●●●●●●●●●●
●
●
●
●
●
●
●
0
50
100
150
●●●●●●●●●●●●●●●
●
●
0
50
100
150
●●●●●●●●●●●●●
●
●●
●
0
50
100
150
January Aprilb July October
●●●●●
●●●●●●●●●●●
●
NO
3
0
200
400
●●●
●●
●
●
●
●●
●●
●●●●
●
NO
30
200
400
●●●
●●●
●●
●●
●●●
●●
●●
NO
3
0
200
400
●●●
●
●●●
●●
●
●
●●●●●
●
NO
3
0
200
400
●●●●●●●●●●●●●●●●●
0
10
20
30
●●●●●●●●●●
●●
●●●●●
0
10
20
30
●●●●●●●●●●●●●
●
●
●●
0
10
20
30
●●●●●●●●●●●●
●
●
●●
●
0
10
20
30
●●●
●●
●●●
●●●
●●●●●
●
0
3
6
9
0
3
6
9
●
●
●●●
●●
●●●●●●●●
●●
0
3
6
9
●●●
●●●
●●●
●●
●
●●●●●
0
3
6
9
0
1
2
3
4
0
1
2
3
4
●●
●●●
0
1
2
3
4
●
●●
●
●
0
1
2
3
4
●●●●●●●●●
●●
●●●●●●
0
100
200
300
●
●●●●●●●
●
●
●
●
●●●●
●
0
100
200
300●●●●●●●
●●●
●●
●
●●
●●
0
100
200
300●●●●
●●●●●●●
●
●●●●●
0
100
200
300
●●●●●●●●●
●●●
●●●●●
0
100
200
●
●●
●●●●●
●
●
●●
●●
●
●
●
0
100
200
●●●●●●●
●●●
●●
●
●●
●
●
0
100
200
●●●●●
●●●
●
●
●●
●●●
●
●
0
100
200
●●●●●●●●●●●●
●●●●
●
0
400
800
1200
●●
●
●●●●●●
●
●●
●●
●
●
●
0
400
800
1200
●●●●●●●●●●●●
●●●
●
●
0
400
800
1200
●●●●●●●●●
●●●
●
●●
●
●
0
400
800
1200
●●●●●●●
●●●●●
●●●●●
7.0
7.5
8.0
8.5
●●●
●●●●●
●●
●●●
●
●●●
7.0
7.5
8.0
8.5
●●●●●●●●●
●●
●●●●●●
7.0
7.5
8.0
8.5
●●●●●●●●●
●●●
●●●●●
7.0
7.5
8.0
8.5
●●●●●●●●●●●●●●●●●
0 5 15 25
0
50
100
●
●●
●●●●●●●●●●●
●
●
0 5 15 25
0
50
100
●●●●●●●●●●●●●●●
●
●
0 5 15 25
0
50
100
●●●●●●●●●●●●
●
●
●
●
●
0 5 15 25
0
50
100
NH
4(µM
)N
O3(µ
M)
NO
2(µM
)U
rea(
µM−
N)
DF
AA(µ
M)
O2(µ
M)
SP
M (µ
g L−1
)P
OC
(µM
)pH
Chl
a (µ
g L−1
)
Salinity
Figure 3.2: Parameters measured in the Scheldt estuary 2003.Urea was not measured in Aprilb (RV ‘Luctor’ cruise) and DFAAwere not measured in January and Aprilb. Urea is given as µmolN-urea L−1, DFAA as µmol N-DFAA L−1. DFAA: dissolved freeamino acids; SPM: suspended particulate matter; POC: partic-ulate organic carbon
43

3 Uptake of dissolved inorganic nitrogen, urea and amino acidsTable
3.1
:U
ptake
rates(n
Mh−
1)of
NH
+4,N
O−3,N
O−2,urea
and
DFA
Aat
5salin
itiesdurin
g4
seasons.
Data
arem
eans±
SD
of2
replicate
samples
eachfrom
light
and
dark
incu
bation
s,ex
cept
forJan
uary
when
single
samples
were
incu
bated
inligh
tan
ddark
.D
FA
A:dissolved
freeam
ino
acids;
nd:
no
data
SalinityN
H+4
NO−3
NO−2
Urea-N
Urea-C
DFA
A-N
DFA
A-C
nMh−
1nM
h−
1nM
h−
1nM
Nh−
1nM
Ch−
1nM
Nh−
1nM
Ch−
1
January0
438±
25490±
6332±
2421±
1259±
41nd
nd2
195±
1795±
335.7
±2.3
20±
8.815±
8.7nd
nd8
154±
10146±
443.7
±2.9
29±
2039±
55nd
nd18
61±
2515±
4.84.2
±3.4
5.7±
1.30.8
±0.5
ndnd
2811±
0.68.0
±7.6
1.0±
0.32.3
±0.3
1.1±
1.2nd
ndA
pril b
0464
±172
66±
6.77.4
±3.9
ndnd
ndnd
21283
±525
35±
245.9
±8.5
ndnd
ndnd
8248
±26
188±
1322±
2.0nd
ndnd
nd18
94±
3544±
4.95.7
±0.8
ndnd
ndnd
2835±
1330±
322.4
±1.7
ndnd
ndnd
July0
452±
146268
±51
34±
2.0701
±86
208±
139195
±44
226±
962
461±
139161
±51
113±
53148
±175
6.0±
5.4110
±18
228±
1038
239±
5487±
3617±
5.558±
437.9
±11
66±
10115
±68
18112
±47
35±
225.8
±2.3
45±
227.0
±9.6
40±
5.0116
±30
2848±
217.0
±1.5
2.3±
0.330±
9.73.7
±4.2
29±
2.354±
7.5O
ctober0
348±
12279±
1853±
1893±
3729±
37110
±29
775±
3552
355±
39125
±10
55±
1157±
1313±
8.986±
26213
±68
843±
7105
±15
13±
1.036±
4.810±
1120±
4.155±
2318
26±
2.236±
5.82.0
±0.8
25±
7.84.9
±6.1
37±
18108
±17
281.3
±1.8
6.0±
6.21.9
±2.0
11±
128.9
±7.1
13±
1445±
17
44
3.3 Results
NO−2 was low throughout the estuary (11 % at highest) with lowest values
at the mouth (2 %). The absolute uptake rates were higher at stationswith lower salinities (Figure 3.3B,D). Uptake of NH+
4 and NO−3 was similar
in July and October while uptake of urea was higher in July, resulting ina higher total N uptake in July.
3.3.3 Uptake of dissolved organic matter
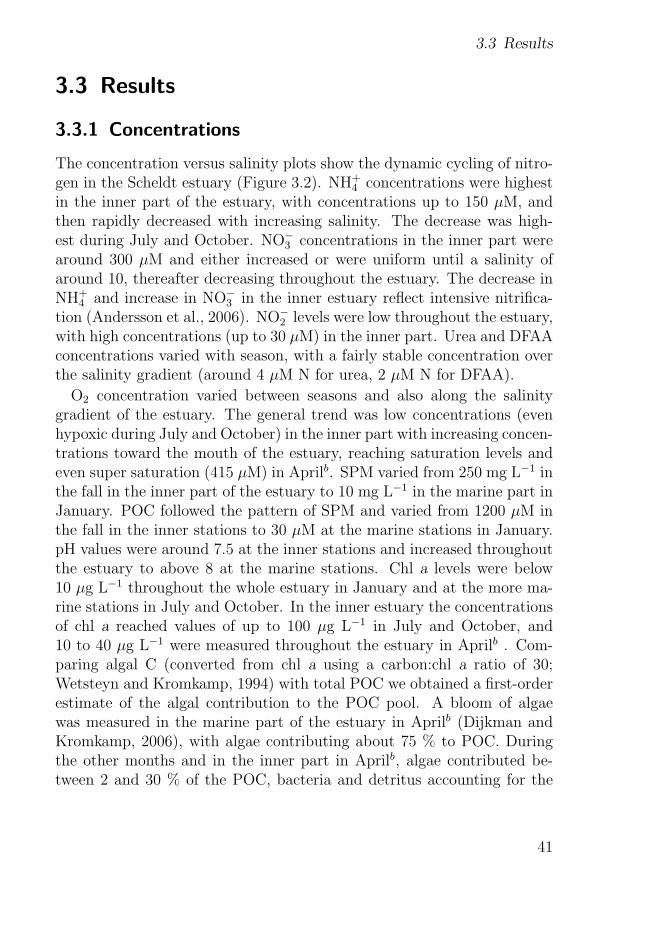
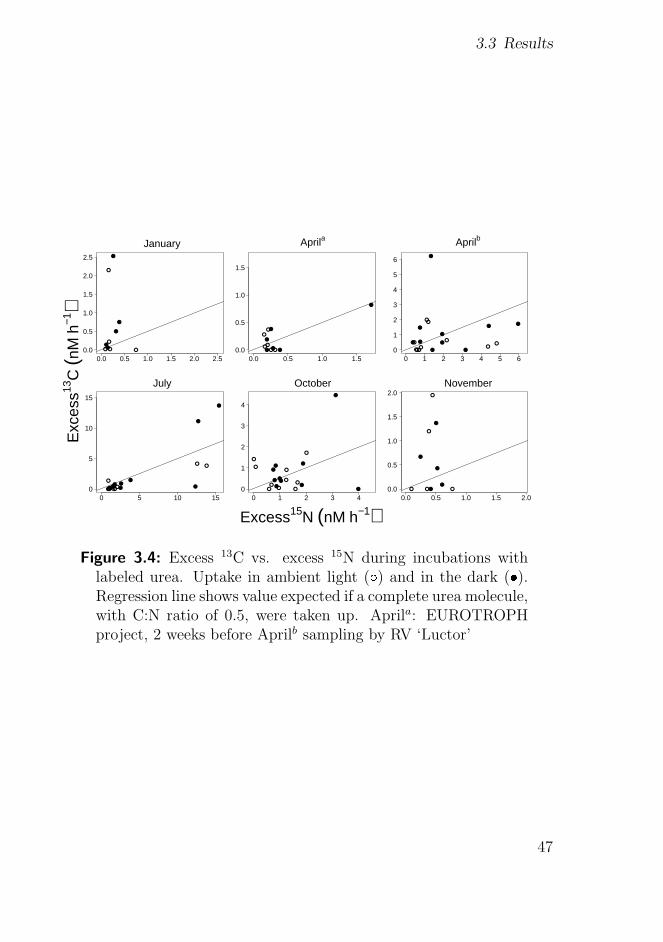
Absolute uptake rates of urea and DFAA are only available for the Julyand October cruises (Table 3.1, Figure 3.3). However, for all cruises resultscan be presented as excess 15N or 13C after incubation (nM h−1), andthese allow a direct comparison of N and C uptake. The regression linesin Figure 3.4 show the expected relationship between excess 13C and 15Nwere the whole urea molecule (with a C:N ratio of 0.5) to be taken upand both C and N to remain in the cell and be assimilated during the 2h incubation. Large differences can be seen for the 6 sampling occasions(Figure 3.4). In November and January urea uptake rates were low andurea was mainly used as a C source. In early spring, Aprila uptake ofurea was lower than later the same month, Aprilb. In July the highestutilization of urea was measured, with rates decreasing again in October.Throughout April to October urea was used as a substrate for both N andC. Moreover, no differences were found for samples incubated in ambientlight and samples incubated in dark (data not shown).
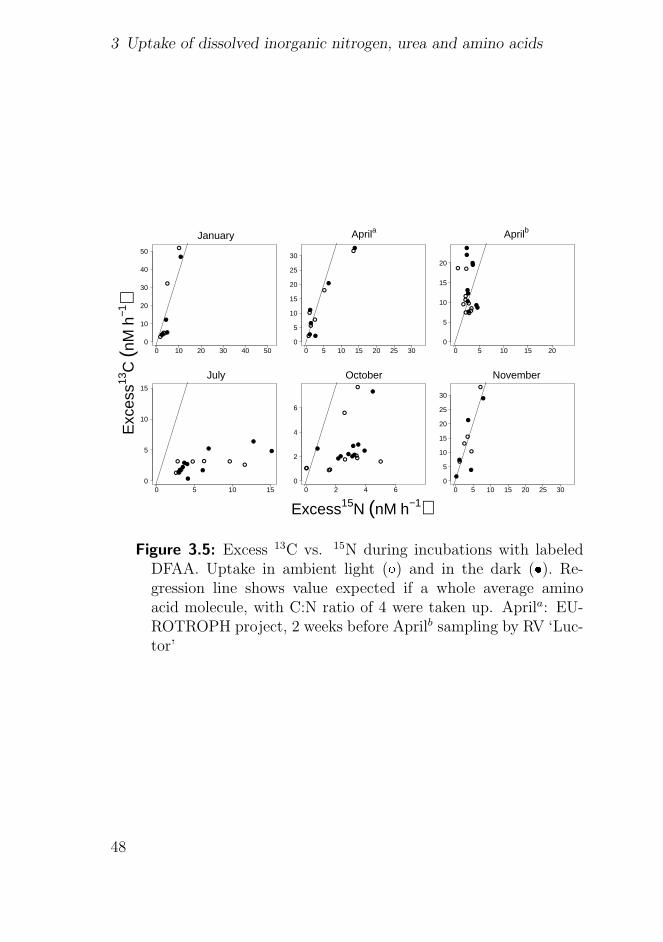
The algal amino acid mixture used in this study had on average a C:Nratio of 4; the regression lines in Figure 3.5 represent the values expectedif the whole amino acid molecule were taken up and both C and N assim-ilated. DFAA utilization of N and C was diametrically to that of urea.In November, January and April the whole molecule seems to have beenused. Later in the season, particularly in July and October, there was ashift toward using DFAA as a N substrate. Remarkably, those monthswith low urea uptake (January, Aprila and November) all had a higheruptake of DFAA than the other three months.
3.3.4 Nitrification
Highest nitrification activity was measured in the inner part of the estuary,with rates decreasing toward the mouth. Nitrification was generally higher
45
3 Uptake of dissolved inorganic nitrogen, urea and amino acids
0 2 8 18 28
July
Salinity
Tot
al u
ptak
e (%
)
020
4060
80
A
0 2 8 18 28
October
Salinity
Tot
al u
ptak
e (%
)
020
4060
80
C
0 2 8 18 28
July
SalinityU
ptak
e ra
te (n
M N
h−1
)
050
010
0015
00
B
0 2 8 18 28
UreaDFAANO2NO3NH4
October
Salinity
Upt
ake
rate
(nM
N h
−1)
020
040
060
0
D
Figure 3.3: Relative contribution to (A,C) total uptake and (B,D)uptake rates of the 5 nitrogen sources along the salinity gradient.Note differences in scale for uptake rates.
46
3.3 Results
●
●
●
●
●
●●●
●●
0.0 0.5 1.0 1.5 2.0 2.50.0
0.5
1.0
1.5
2.0
2.5
●
●
●
●
●●
●●
●●
●
●
0.0 0.5 1.0 1.50.0
0.5
1.0
1.5
●
●
●●
●
●
●●
●
●
●●
●
●
●●
●●
●●
0 1 2 3 4 5 60
1
2
3
4
5
6
●
●
●●
●●
●●
●
●●● ●●●
●
●●
●●
0 5 10 150
5
10
15
●
●
●
●●
●
●
●●
●
●●
●
●
●●
●
●
●
●
0 1 2 3 40
1
2
3
4
●
● ●
●
●
●●
●
●
●
0.0 0.5 1.0 1.5 2.00.0
0.5
1.0
1.5
2.0
January Aprila Aprilb
July October November
Excess15N (nM h−1)
Exc
ess13
C (n
M h
−1)
Figure 3.4: Excess 13C vs. excess 15N during incubations withlabeled urea. Uptake in ambient light (�) and in the dark (�).Regression line shows value expected if a complete urea molecule,with C:N ratio of 0.5, were taken up. Aprila: EUROTROPHproject, 2 weeks before Aprilb sampling by RV ‘Luctor’
47
3 Uptake of dissolved inorganic nitrogen, urea and amino acids
●
●
●
●
●●●●●●
0 10 20 30 40 500
10
20
30
40
50
●●
●●
●
●
●
●
●●
●●
0 5 10 15 20 25 300
5
10
15
20
25
30
●●
●
●
●
●
● ●
●●
●●
●
●
●
●●●
●●
0 5 10 15 200
5
10
15
20
●
●
●●
●
●
●●
●
●
●●●●
●
●
●●●●
0 5 10 150
5
10
15
●
●
●
●
●●
●●
●●
●●
●●
●●●●
●●
0 2 4 60
2
4
6
●●
●
●
●
●
●
●
●
●
0 5 10 15 20 25 300
5
10
15
20
25
30
January Aprila Aprilb
July October November
Excess15N (nM h−1)
Exc
ess13
C (n
M h
−1)
Figure 3.5: Excess 13C vs. 15N during incubations with labeledDFAA. Uptake in ambient light (�) and in the dark (�). Re-gression line shows value expected if a whole average aminoacid molecule, with C:N ratio of 4 were taken up. Aprila: EU-ROTROPH project, 2 weeks before Aprilb sampling by RV ‘Luc-tor’
48
3.4 Discussion
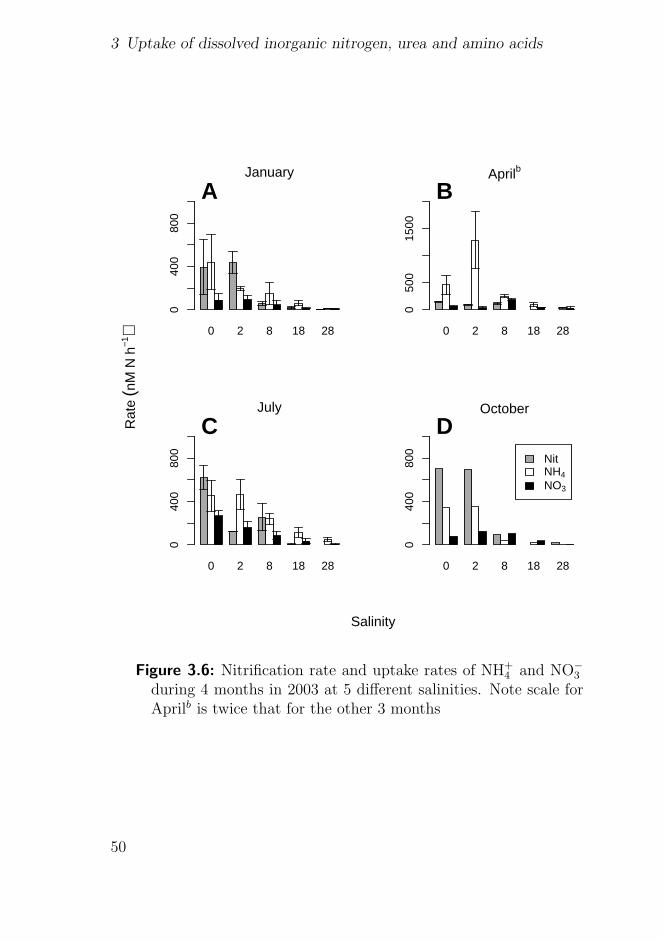
in July and October, corresponding to higher temperature and lower NH+4
concentration, which ranged from 700 in October to 150 nM h−1 in Aprilb
in the fresh water stations and from 20 nM h−1 to undetectable in themarine stations. Nitrification rates were in the same order of magnitudeas NH+
4 uptake rates. The most obvious difference was at Stations 0 and2 in Aprilb, when NH+
4 uptake was much higher than both nitrificationand NO−
3 uptake (Figure 3.6).
3.4 Discussion
The Scheldt estuary is a turbid, tidal, heterotrophic system (Goosen et al.,1999; Boschker et al., 2005) with high nutrient concentrations and organicloading (Kromkamp et al., 1995). Algal C constituted a small part of thePOC (on average 15 % during our study) and bacteria were 3 times moreabundant than algae in January while during the other months bacterialbiomass made up between one-third and half of the algal biomass (Dijk-man and Kromkamp, 2006). Input of allochthonous organic matter andnutrients in the inner estuary are high (Kromkamp et al., 1995), and dur-ing our study most N pools did not show a conservative behaviour due tomixing (Figure 3.2) during transport to the sea, but were clearly affectedby processes within the estuary. Two major transformation pathways forNH+
4 in the estuary are nitrification, whereby NH+4 is oxidized to NO−
3 viaNO−
2 , and uptake by phytoplankton and bacteria. NO−3 and NO−
2 can alsobe taken up by phytoplankton and bacteria or be denitrified to N2 gas (inthe sediment). Urea and DFAA can be taken up by phytoplankton andbacteria as a substrate for N, C or both.
Comparison of our NH+4 uptake rates with parallel measurements of
nitrification rates during the same cruises (Andersson et al., 2006) showthem to be of the same order of magnitude (Figure 3.6). The ratio of NH+
4
uptake to nitrification ranges from 0.5 to 25 (where 1 represents equal up-take and nitrification rates). In Aprilb, during the spring bloom, NH+
4
uptake was much higher than NH+4 oxidation by the nitrifiers. In July the
community of nitrifiers had time to develop, and roughly the same amountof NH+
4 was taken up as was nitrified. There are few parallel studies ofnitrification and NH+
4 uptake. Lipschultz et al. (1986) showed nitrifica-tion to be the major process affecting NH+
4 distribution in the Delaware
49
3 Uptake of dissolved inorganic nitrogen, urea and amino acids
0 2 8 18 28
January0
400
800
A
0 2 8 18 28
Aprilb
050
015
00
B
0 2 8 18 28
July
040
080
0
C
0 2 8 18 28
NitNH4
NO3
October0
400
800
DRat
e (n
M N
h−1
)
Salinity
Figure 3.6: Nitrification rate and uptake rates of NH+4 and NO−
3
during 4 months in 2003 at 5 different salinities. Note scale forAprilb is twice that for the other 3 months
50
3.4 Discussion
River. Ward (2005) investigated NH+4 oxidation and assimilation in the
upper 70 m of Monterey Bay, California, USA, an eastern boundary up-welling system, and found that NH+
4 assimilation was much larger thanNH+
4 oxidation in the upper 25 m, but that rates were similar at greaterdepths. Depth-integrated rates of NH+
4 assimilation (5.1 µmol m−2 d−1)were higher than those of NH+
4 oxidation (2.0 µmol m−2 d−1). Compari-son the NO−
3 production rate via nitrification with the NO−3 uptake rate
(Figure 3.6) revealed that, with a few exceptions, most NO−3 produced via
nitrification was not taken up, consistent with the NO−3 vs. salinity plots
of net NO−3 production in Figure 3.2).
Uptake rates in the light were not significantly different from those in thedark for all substrates and light and dark incubation data were thereforecombined. This similarity between light and dark uptake rates has beenreported before, in particular for turbid systems with relatively low algalbiomass and high concentrations of bacteria with respect to total commu-nity uptake (Middelburg and Nieuwenhuize, 2000b,a). The Scheldt estu-ary is a prototype heterotrophic, turbid estuary in which particle-attachedbacteria play a dominant role in moderating C and N flows (e.g Boschkeret al., 2005). Partitioning of nitrogen uptake between phytoplankton andheterotrophic bacteria in turbid estuaries such as the Scheldt Estuary isdifficult since size fractionation by pre- or post-incubation filtration is notfeasible because of filter clogging and is not appropriate because of thetight association of the bacteria with particles. Alternatively, prokaryoticinhibitors might be used to distinguish between eukaryotic and prokary-otic activity, although these are never 100 % selective or 100 % effective(Oremland and Capone, 1988). Although we have already used this ap-proach successfully in the turbid Loire and Thames estuaries (Middelburgand Nieuwenhuize, 2000b,a), we obtained highly variable, inconclusive re-sults in the Scheldt estuary. We were therefore unable to partition nitro-gen uptake among the bacteria and phytoplankton but, given the lack oflight-dark difference, the heterotrophic status of this estuary, and its highbacterial biomass (Boschker et al., 2005), we believe bacteria to be majorcontributors to the nitrogen uptake.
In regards to the absolute uptake rates of the different substrates, therates of NH+
4 uptake were highest, with a few exceptions, partly due tothe much higher concentrations of NH+
4 compared to DFAA and urea. Toinvestigate preference for different substrates, many authors (Phillips and
51
3 Uptake of dissolved inorganic nitrogen, urea and amino acids
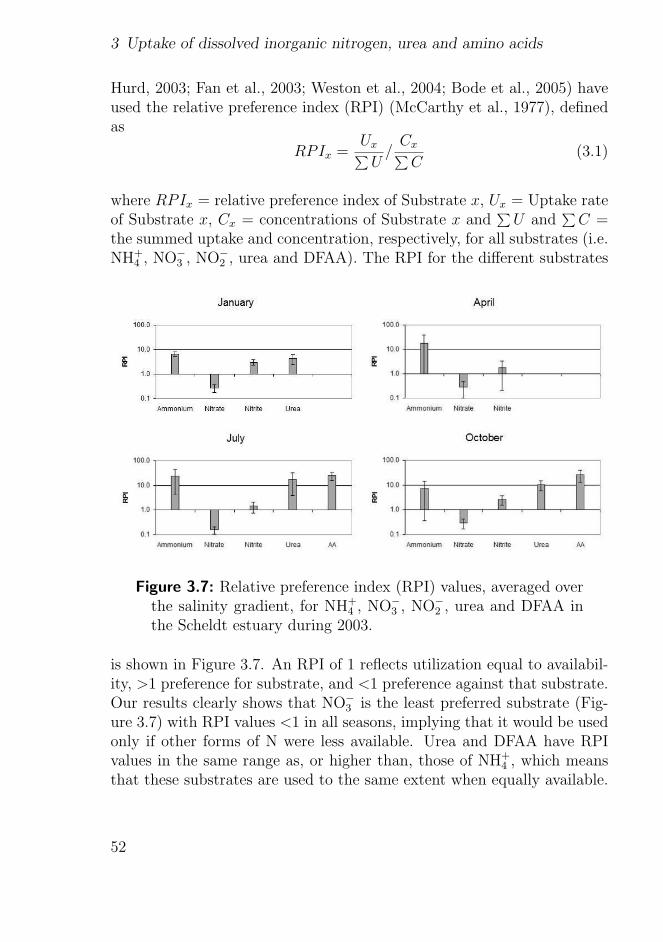
Hurd, 2003; Fan et al., 2003; Weston et al., 2004; Bode et al., 2005) haveused the relative preference index (RPI) (McCarthy et al., 1977), definedas
RPIx =Ux∑
U/
Cx∑C
(3.1)
where RPIx = relative preference index of Substrate x, Ux = Uptake rateof Substrate x, Cx = concentrations of Substrate x and
∑U and
∑C =
the summed uptake and concentration, respectively, for all substrates (i.e.NH+
4 , NO−3 , NO−
2 , urea and DFAA). The RPI for the different substrates
Figure 3.7: Relative preference index (RPI) values, averaged overthe salinity gradient, for NH+
4 , NO−3 , NO−
2 , urea and DFAA inthe Scheldt estuary during 2003.
is shown in Figure 3.7. An RPI of 1 reflects utilization equal to availabil-ity, >1 preference for substrate, and <1 preference against that substrate.Our results clearly shows that NO−
3 is the least preferred substrate (Fig-ure 3.7) with RPI values <1 in all seasons, implying that it would be usedonly if other forms of N were less available. Urea and DFAA have RPIvalues in the same range as, or higher than, those of NH+
4 , which meansthat these substrates are used to the same extent when equally available.
52

3.4 Discussion
NO−2 was less preferred than NH+
4 , urea and DFAA but more preferredthan NO−
3 . The utilization of RPI has been questioned as being stronglydependent on substrate concentration and weakly related to physiologi-cal preferences (Dortch, 1990; Stolte and Riegman, 1996). This could bethe case for our findings of NO−
3 rejection arising from high NO−3 concen-
tration, but the differences recorded for the other substrates were likelydue to physiological preferences, since their concentrations were similar(except for NH+
4 in the freshwater).Our uptake rates are similar to and often higher than previous rates
recorded in the literature for estuarine systems. Our uptake rates of NH+4
and NO−3 fall within the range found by Middelburg and Nieuwenhuize
(2000b) in 6 turbid, tidal estuaries including the Scheldt estuary. Otherstudies showed lower uptake of NH+
4 and higher or similar uptake of NO−3
(Lipschultz et al., 1986; Bronk and Glibert, 1993; Bronk et al., 1998; Mid-delburg and Nieuwenhuize, 2000a; Veuger et al., 2004), corresponding tolower and higher substrate concentrations, respectively. The uptake ratesof urea and DFAA in our study are within the range reported in an ex-tensive comparison of urea and DFAA uptake rates from various systemsby Bronk (2002), and compare best to rates found in the Chesapeake bayestuary. The importance of urea as a N substrate varies (depending onthe system) from 5 to 64 % of total N uptake (Bronk, 2002) and on av-erage urea contributes more to total N uptake than does DFAA. DFAAcontributes approximately 10 % to total N uptake (Bronk, 2002), but cancontribute more than this, e.g. in the marine part of the Thames estu-ary DFAA accounted for about 90 % of total N uptake (Middelburg andNieuwenhuize, 2000a). In the Scheldt estuary, urea contributed between8 and 43 % and DFAA between 9 and 29 % to total N uptake in Julyand October (the only months where absolute uptake rates for urea andDFAA were available).
DON comprises a diverse mixture of compounds such as proteins, oligo-peptides, purines, nucleic acids and humic substances. Usually < 20 %of the DON pool can be identified, including urea and DFAA, while upto 70 % of DON is often potentially bioavailable (Seitzinger et al., 2002;Stepanauskas et al., 2002). Since urea and DFAA constitute a small frac-tion of DON, we have very likely underestimated total DON uptake us-ing our approach. In previous studies, 7 to 30 % of DON uptake arosefrom urea utilization in the spring and 74 % in the fall (Bronk and Glib-
53
3 Uptake of dissolved inorganic nitrogen, urea and amino acids
ert, 1993). Despite our likely underestimation of total DON uptake, it isobvious that calculation of DON uptake is necessary for accurate quan-tification of total N uptake and that some of the compounds within theDON pool are used preferentially. A few previous studies used 15N labeledDON found that this complex DON was taken up in the same order ofmagnitude as DIN (Bronk and Glibert, 1993; Veuger et al., 2004). Whenstudying the importance of total ambient DON as a source of N comparedto DIN, this may be a more useful approach, where as the use of individualDON compounds such as urea and DFAA can increase our knowledge ofthe mechanisms of DON uptake.
Having shown urea and DFAA to be similar in importance to DIN formicrobial N acquisition, we further investigated whether urea and DFAAconstitute a N substrate only, or if they also can be used as an energysource. It has been shown that both heterotrophic bacteria (Middelboeet al., 1995; Rosenstock and Simon, 2001) and microalgae (Palenik andMorel, 1990; Bronk and Glibert, 1993; Berman and Chava, 1999; Fan andGlibert, 2005; Linares, 2006) utilize DON, although the questions as tohow, why and when they do so remain unclear. Utilization of urea requiresenergy, since urease needs to be synthesized to enable hydrolyzation of thissubstrate. The importance of urea as a N source for phytoplankton andbacteria has been well documented (Berman and Bronk, 2003; Jørgensen,2006). However, the importance of urea as a C source is unclear, and hasbeen studied rarely and with contradictory results (Petersen et al., 2004;Jørgensen, 2006). In the 1980s, investigators used radioactive 14C labeledurea in parallel with 15N labeled urea (Price and Harrison, 1988, andreferences therein) to measure urea uptake, and an uncoupling betweenN and C uptake from urea was often found. More recent literature hasalso shown variable results, depending on the system or organism studied.During a bloom of a brown tide pelagophyte on the east coast of theUSA, urea was used as a source for N but not for C (Mulholland et al.,2004). However, during a bloom of a dinoflagellate in Chesapeake Bay,urea was used mostly as a source of C (with a molar C:N uptake ratioof 2.3; Fan and Glibert, 2005), indicating greater retention of C thanN. During phytoplankton blooms, uptake measurements of DFAA haveshown that these are used as a substrate for N as well as C to a variableextent (Mulholland et al., 2002).
One urea molecule contains 1 C and 2 N atoms and, when taken up,
54
3.4 Discussion
is split into 1 CO2 molecule and 2 NH+4 molecules by the enzyme urease
(Price and Harrison, 1988; Mobley and Hausinger, 1989; Zehr and Ward,2002). If urea were utilized as a whole molecule, 2 N atoms per 1 C wouldbe taken up (indicated by regression line in Figure 3.4. Our results forurea uptake were not easily interpreted. In January and November, C wasincorporated to a much larger extent than would be expected throughuptake of whole molecules, implying that N was released, probably asNH+
4 . In the other months the data generally followed the same trend asfor uptake of the whole molecule and we thus cannot conclude that ureawas used preferentially as a source of N or C. Additional research willbe required to attain a more complete understanding of the utilization ofurea as a substrate for N and C.
The importance of DFAA for N uptake has been well studied (Wheelerand Kirchman, 1986; Palenik and Morel, 1990; Hoch and Kirchman, 1995;Nilsson and Sundback, 1996; Middelburg and Nieuwenhuize, 2000a; Mul-holland et al., 2002), and a few of studies have addressed the question asto whether DFAA constitute a N or a C source (Jørgensen et al., 1993;Middelboe et al., 1995; Jørgensen et al., 1999; Mulholland et al., 2002).Bacteria are still considered to be most important for DFAA uptake (Hochand Kirchman, 1995); however, it is now apparent that many phytoplank-ton also can use DFAA as N source (Berman and Bronk, 2003). DFAAcan be incorporated via direct uptake of the whole molecule or can beoxidized extracellularly and the released NH+
4 and organic carbon cansubsequently be utilized (uncoupled uptake). To our knowledge Mulhol-land et al. (2002) were the first to use dually labeled DFAA to estimate Cand N uptake by natural communities of the algae Aureococcus anophag-efferens. These authors showed both coupled and uncoupled uptake inthis pelagophyte,with DFAA constituting 50 % of the total N uptake andabout half of the associated C being taken up. In a later study, Mulhol-land et al. (2003) found uncoupled uptake rates of DFAA C and N, withDFAA N being taken up preferentially to C along an estuarine gradientin the Chesapeake Bay. In Lake Constance, Germany, DFAA and proteinsupported 58 % and 80 % of the bacterial C and N demand, respectively,making them the most important bacterial C and N sources (Rosenstockand Simon, 2001). Using a combination of 15N and 13C labeled DFAA itis possible to distinguish between uptake of the whole molecule and sto-ichiometric assimilation on the one hand and partial uptake or selective
55
3 Uptake of dissolved inorganic nitrogen, urea and amino acids
assimilation of N or C on the other hand.Our results support previous findings that DFAA are used as a source
for both C and N. Moreover we observed seasonal variation in the couplingor uncoupling of N or C uptake. The regression lines in Figure 3.5 show theratio expected between C and N uptake if the whole amino acid moleculewere utilized (based on an average C:N ratio of 4 in the labeled algalmixture). In January, April and November, the uptake data were scatteredaround this line, indicating that DFAA were used as both a N source anda C source. In July and October, DFAA were used as a N rather thana C source, likely through extracellular amino acid oxidation. It shouldbe noted, however, that the activities were lower during these months.The most striking difference between July and October and the othermonths was the availability of NH+
4 (Figure 3.2). When NH+4 availability
was low, bacteria, phytoplankton or both utilized the N content of DFAAto a larger extent. High amino acid oxidase activities in phytoplanktonhave been shown to coincide with low NH+
4 levels and with high biomasslevels indicating an algal bloom (Mulholland et al., 1998). Furthermore,Pantoja and Lee (1994) showed that extracellular amino acid oxidationonly occurs at higher temperature, consistent with our findings that inJuly and October the N portion of the DFAA was preferentially used.
Urea and DFAA may be preferred as substrates under limited growthconditions, such as reduced light intensity or lowered temperature (Berget al., 1997), since they can supply the cell with both organic C and N.This might explain why in November, January and April DFAA wereparticularly used as a source of both C and N (Figure 3.5). During thesemonths low water temperature and reduced light were limiting autotrophicgrowth. During the months when DFAA were used as a source for both Nand C, urea was, in general, used primarily as a C source. When uptakerates of DFAA were high (in January, Aprila and November), uptake ratesof urea were lower than in the 3 other months. This seasonal variabilitymight be related to seasonal changes in the community of phytoplank-ton and bacteria, but nutrient concentrations, light availability, oxygenconditions also vary during the year.
Since the C and N of urea and DFAA may or may not be taken up inproportion to their occurrence, and since this may depend on the organ-isms involved (photoautotrophs vs. heterotrophs) and their physiologicalstatus, C-based uptake rates cannot always be converted into N units, or
56
3.5 Conclusions
vice versa. The use of dually labeled substrates is necessary to increase ourinsight into the role of DON cycling in pelagic ecosystems and to furtherour understanding of DON acquisition strategies by microbes. To take thisrelatively unexplored field of research one step further and study in detailwhich organisms are involved in the uptake of inorganic versus organicsubstrates, biomarkers such as PLFA (Boschker and Middelburg, 2002;Petersen et al., 2004) and D-alanine (Veuger et al., 2005) can be valuabletools in combination with dually labeled substrates. Heterotrophs (bac-teria) and photoautotrophs differ with respect to their uptake of C andN. Photoautotrophs can assimilate DIC during photosynthesis in the lightand incorporate N throughout the entire day, resulting in a temporarilyuncoupled uptake of C and N. Heterotrophs grow on organic substratesand usually take up C and N at the same time, but their relative use of Cand N may differ. It is likely that during the summer months uptake byphotoautotrophs was more important in our study than during the othermonths, since uptake rates of C and N in DFAA were uncoupled. Duringthe other months heterotrophic uptake may have been of greater impor-tance. This is consistent with the findings of Dijkman and Kromkamp(2006), especially for January, when bacteria were more abundant thanin the other months. Organisms that are most suited to utilize DON aremixotrophs, which can use inorganic nutrients and light energy (as pho-toautotrophs) for growth during the day, and organic substrates for bothnutrients and energy (as heterotrophs) during the day and night (Mulhol-land et al., 2004). The Scheldt estuary constitutes a perfect environmentfor such organisms, with limited light availability below the surface andboth high nutrient and DOM availability.
3.5 Conclusions
DON uptake contributes significantly to total N uptake by natural estu-arine communities and should therefore be included in N uptake studies.Like urea and DFAA, it can constitute a source for both N and C, andthus the use of single labeled substrates might result in a biased uptakeestimate and incomplete understanding of DON cycling.
The uptake of C and N from DON varies seasonally: in January, Apriland November, C is taken up to a larger extent than during July and Octo-
57
3 Uptake of dissolved inorganic nitrogen, urea and amino acids
ber, periods when NH+4 availability is relatively low. Rates of nitrification
and uptake of NH+4 are of similar of magnitude.
58