Embed Size (px)
Citation preview
8/9/2019 Study of the Wind Speed Rainfall and Storm Surges for the Scheldt Estuary in Belgium
http://slidepdf.com/reader/full/study-of-the-wind-speed-rainfall-and-storm-surges-for-the-scheldt-estuary-in 1/5
INTERNATIONAL JOURNAL OF SCIENTIFIC & TECHNOLOGY RESEARCH VOLUME 4, ISSUE 01, JANUARY 2015 ISSN 2277-8616
130IJSTR©2015www.ijstr.org
Study Of The Wind Speed, Rainfall And StormSurges For The Scheldt Estuary In Belgium
Mohammad Abul Hossen, Farjana Akhter
Abstract: The Belgian coast and the Scheldt estuary are important for the Belgian economy. Coastal flood risks tend to increase due to climate change.This study was set out to investigate the wind speed, surges and rainfall in the Scheldt estuary. The study explored the changes in mean and extremewinds according to the recent ENSEMBLES climate models and examined the dependency of extremes between surge with wind speed and surge withrainfall. The dependence analysis between surge and wind speed aimed to investigate whether climatic changes in wind speed can be transferred tochanges in surge, while the existence of dependence between surge and rainfall would require climate scenarios for rainfall upstream in the Scheldtbasin to be correlated with climate scenarios for the downstream surge boundary. A special dependence measure χ, developed by Buishand (1984) andColes et al (2000) was followed. Data was extracted and processed using Matlab and CDO. The analysis of wind speeds showed that future windspeeds in the estuary (based on the climate models) will remain stable in comparison with the past wind speeds. Also, wind direction will be mainly from180°-300°, although slight shifts might appear towards more frequent south western winds. From the study of dependency, there was no significandependency between sea surge at Oostende coast and rainfall at different stations. The definition of significant dependency is strong or conservative.Above all, the extremes events are more or less dependent. While the study has not found significant changes in wind speed and only slight changes inwind direction, it is important to further investigate the impact of these changes on the Scheldt estuary using hydrodynamic models. The assessment ofchanges in extreme rainfall and sea surge need to be further studied.
Index Terms: Climate Data Operator, Global Climate Models, ENSEMBLES climate models, IPCC, MATLAB, Regional Climate Models, RoyaMeteorological Institute.
————————————————————
1 INTRODUCTION COASTAL populations around the world are increasingsignificantly. It was estimated in 2000 that, 10% of the globalpopulation lived on 2% of the Earth’s land area adjacent to thecoast, which is less than 10 m above mean sea level(McGranahan et al. 2007, cited in McInnes et al. 2009). TheScheldt estuary and Belgian coast are important not only forhousing and industry but also for trade and commerce. Due toclimate change, coastal flood risks tend to increase becauseof an increase in the frequency and/or level of storm surges.The difference in water level between the observed sea leveland the predicted astronomical tide is termed as sea surge.
The storm surges are related with the changes in the windclimate (pressure, wind speed and wind direction). Afterextensive scientific research of the effects of increasedgreenhouse gas concentrations the focus is shifting tochanges in the statistics of weather extremes on regional orlocal scale. Besides changes in temperature and precipitation,a burning question is whether the storm climate changes ornot. Although the determination of a definite forecast in windclimate is not possible, it is wise to investigate the impact ofthese extremes on society, for instance flooding of low-lyingcountries like the Netherlands and Bangladesh due to stormsurges. This study explored the changes in mean and extremewinds according to the ENSEMBLES climate models at theScheldt estuary and addresses the question whether storm
climate changes (according to these models) or not. Then wetried to find the relationship between surge with wind speedand surge with rainfall.
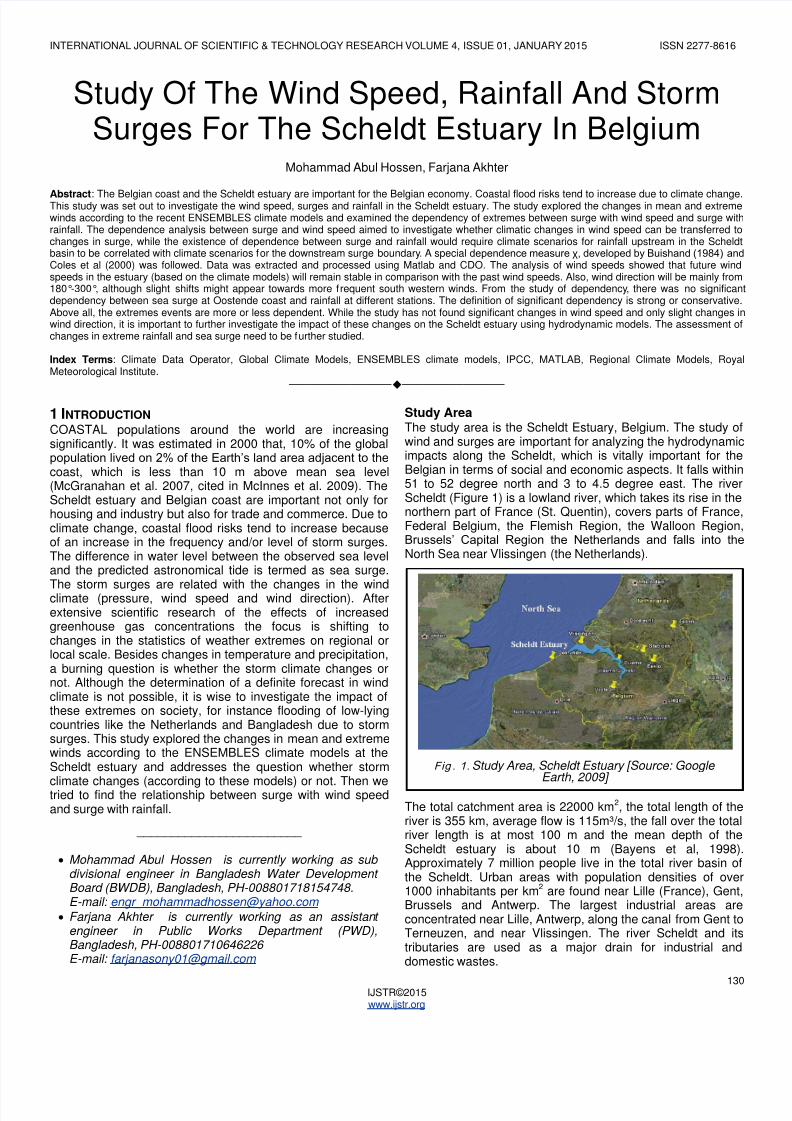
Study AreaThe study area is the Scheldt Estuary, Belgium. The study ofwind and surges are important for analyzing the hydrodynamicimpacts along the Scheldt, which is vitally important for theBelgian in terms of social and economic aspects. It falls within51 to 52 degree north and 3 to 4.5 degree east. The riverScheldt (Figure 1) is a lowland river, which takes its rise in thenorthern part of France (St. Quentin), covers parts of FranceFederal Belgium, the Flemish Region, the Walloon RegionBrussels’ Capital Region the Netherlands and falls into theNorth Sea near Vlissingen (the Netherlands).
The total catchment area is 22000 km2, the total length of the
river is 355 km, average flow is 115m³/s, the fall over the totariver length is at most 100 m and the mean depth of theScheldt estuary is about 10 m (Bayens et al, 1998)Approximately 7 million people live in the total river basin ofthe Scheldt. Urban areas with population densities of ove1000 inhabitants per km
2 are found near Lille (France), Gent
Brussels and Antwerp. The largest industrial areas areconcentrated near Lille, Antwerp, along the canal from Gent toTerneuzen, and near Vlissingen. The river Scheldt and itstributaries are used as a major drain for industrial anddomestic wastes.
Fig . 1. Study Area, Scheldt Estuary [Source: GoogleEarth, 2009]
________________________
Mohammad Abul Hossen is currently working as subdivisional engineer in Bangladesh Water DevelopmentBoard (BWDB), Bangladesh, PH-008801718154748.E-mail: [email protected]
Farjana Akhter is currently working as an assistantengineer in Public Works Department (PWD),Bangladesh, PH-008801710646226E-mail: [email protected]
8/9/2019 Study of the Wind Speed Rainfall and Storm Surges for the Scheldt Estuary in Belgium
http://slidepdf.com/reader/full/study-of-the-wind-speed-rainfall-and-storm-surges-for-the-scheldt-estuary-in 2/5
INTERNATIONAL JOURNAL OF SCIENTIFIC & TECHNOLOGY RESEARCH VOLUME 4, ISSUE 01, JANUARY 2015 ISSN 2277-8616
131IJSTR©2015www.ijstr.org
ObjectivesThe main objective of this paper is to find out the changes inmean and extreme winds according to the ENSEMBLESclimate models at the Scheldt estuary and addresses thequestion whether storm climate changes (according to thesemodels) or not.
2 METHODOLOGY
Available DataWind speed data from 19 climate models were available fromthe ENSEMBLES project and the 6 h data were available atWorld Data Center for the climate (WDCC) CERA database.Precipitation data for Uccle from 1925 to 2005 and forVlissingen from 1925 to 2010 were also gathered. Theprecipitation data for Deurne, Eeklo, Essen and Stabroek wereobtained from 1976 to 2005 from the Royal MeteorologicalInstitute (RMI) website (http://www.meteo.be/).The data weresecondary data. That means, data were collected fromHydraulic section, Katholieke University Leuven (KUL) andKUL got the data from RMI. The data was in NetCDF (NC)format. Matlab was used to read NetCDF data.
Processing 6h dataThere are only two climate models where 6 h data areavailable, called CLM. These models contain muchinformation. Therefore, only the relevant data were selectedfor further processing. The dimensions of the original climatemodels were a 4D matrix. The climate models do not provideabsolute wind speed, but a u-, v-component of wind speed.Thus, the u-component wind speed corresponds to thelocation by latitude and the v-component according to thelongitude. The absolute wind speed could easily be calculatedusing the Pythagorean rule.
Study method of wind speed and wind direction
The objective was to analyze the wind speed for the Scheldtregion to determine the potential future changes in theextremes. Therefore, models from the 16 ENSEMBLESprojects were first analyzed at a daily scale to establish therange and direction of future change. The data was availablefrom 1951 to 2100 for most of the simulations. The data wasdivided into different decade (for every 10 years) after whichthe extreme values for the wind speed were calculated. Thevalues above a threshold (99th percentile) were termed asextreme values. Different percentile thresholds were analyzedto examine whether the extreme changes with intensity. At firstthe historical variability and trends were analyzed. Then futuretrends were projected.
Identification/quantification of dependencies
First, the extremes were extracted for all the variables usingMatlab. For dependency analysis, the 90th percentile was setas the threshold value and the values above threshold aretermed as extreme. Then the dependence between high seasurge, wind speed and precipitation was studied using ameasure of dependence for dependency of extremes. Thedependence was investigated for:
i. Wind and Surgeii. Precipitation and Surge.
At first, the dependency between wind speed and surge wasstudied. Then the dependency between precipitation andsurge was also examined.
3 ILLUSTRATIONS The values above 99th percentile were termed as extremevalues for wind speed analysis; therefore, the 99th percentilevalue was first identified. The monthly analysis is essential fo
understanding seasonal variability. So the percentage oextreme values was calculated for each month. The resultsfrom the full range of 19 model simulations were analyzedThe list of models can be seen from Table 1.
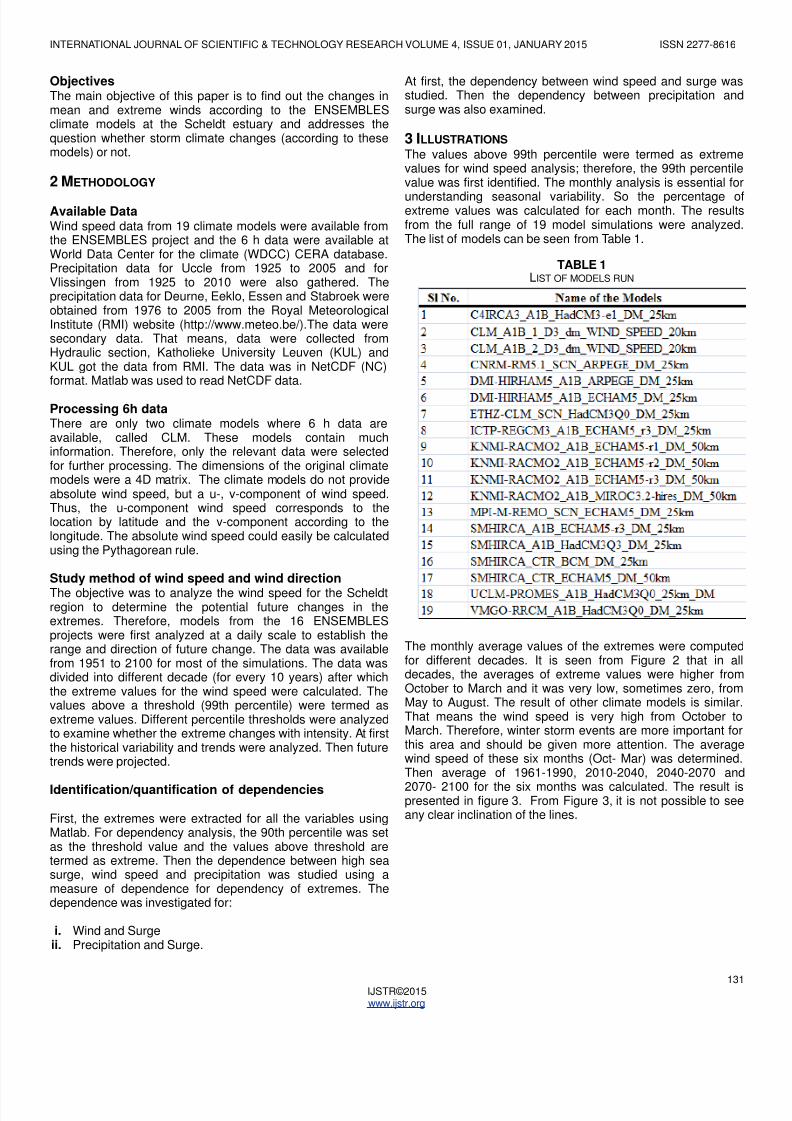
The monthly average values of the extremes were computedfor different decades. It is seen from Figure 2 that in aldecades, the averages of extreme values were higher fromOctober to March and it was very low, sometimes zero, fromMay to August. The result of other climate models is similarThat means the wind speed is very high from October toMarch. Therefore, winter storm events are more important forthis area and should be given more attention. The averagewind speed of these six months (Oct- Mar) was determinedThen average of 1961-1990, 2010-2040, 2040-2070 and
2070- 2100 for the six months was calculated. The result ispresented in figure 3. From Figure 3, it is not possible to seeany clear inclination of the lines.
TABLE 1 LIST OF MODELS RUN
8/9/2019 Study of the Wind Speed Rainfall and Storm Surges for the Scheldt Estuary in Belgium
http://slidepdf.com/reader/full/study-of-the-wind-speed-rainfall-and-storm-surges-for-the-scheldt-estuary-in 3/5
INTERNATIONAL JOURNAL OF SCIENTIFIC & TECHNOLOGY RESEARCH VOLUME 4, ISSUE 01, JANUARY 2015 ISSN 2277-8616
132IJSTR©2015www.ijstr.org
According to some models wind speed will increase in future.On the other hand, some models are showing decrease ofwind speed. Moreover, the variation of wind speed is also veryhigh, which indicates high uncertainty. The whole procedurewas done for 90th percentile and 80th percentile. Then,comparison was performed between models. An assessmentwas done between higher resolution and lower resolution. Itcan be said that smaller resolution may give higher value.Next to the wind speed, the wind direction was assessed toestablish how the wind direction in the Scheldt changes. This
time 6h data was taken. Data from only two CLM models wasavailable. The data was found for the following time series.
History 1981-2000Near-Future 2016-2035Mid-Future 2046-2065Long-Future 2076-2095
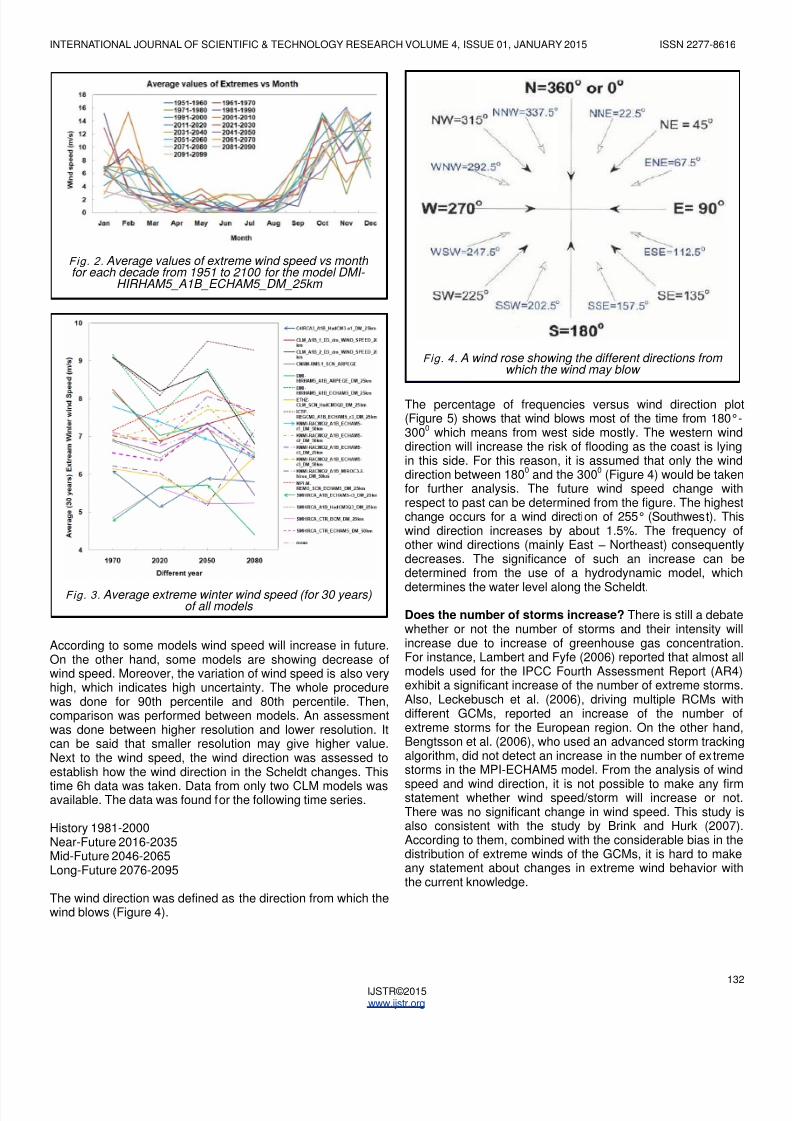
The wind direction was defined as the direction from which thewind blows (Figure 4).
The percentage of frequencies versus wind direction plo(Figure 5) shows that wind blows most of the time from 180°-300
0 which means from west side mostly. The western wind
direction will increase the risk of flooding as the coast is lyingin this side. For this reason, it is assumed that only the winddirection between 180
0 and the 300
0 (Figure 4) would be taken
for further analysis. The future wind speed change withrespect to past can be determined from the figure. The higheschange occurs for a wind direction of 255° (Southwest). Thiswind direction increases by about 1.5%. The frequency ofother wind directions (mainly East – Northeast) consequentlydecreases. The significance of such an increase can bedetermined from the use of a hydrodynamic model, which
determines the water level along the Scheldt.
Does the number of storms increase? There is still a debatewhether or not the number of storms and their intensity wilincrease due to increase of greenhouse gas concentrationFor instance, Lambert and Fyfe (2006) reported that almost almodels used for the IPCC Fourth Assessment Report (AR4)exhibit a significant increase of the number of extreme stormsAlso, Leckebusch et al. (2006), driving multiple RCMs withdifferent GCMs, reported an increase of the number ofextreme storms for the European region. On the other handBengtsson et al. (2006), who used an advanced storm trackingalgorithm, did not detect an increase in the number of extremestorms in the MPI-ECHAM5 model. From the analysis of wind
speed and wind direction, it is not possible to make any firmstatement whether wind speed/storm will increase or notThere was no significant change in wind speed. This study isalso consistent with the study by Brink and Hurk (2007)According to them, combined with the considerable bias in thedistribution of extreme winds of the GCMs, it is hard to makeany statement about changes in extreme wind behavior withthe current knowledge.
Fig. 2. Average values of extreme wind speed vs monthfor each decade from 1951 to 2100 for the model DMI-
HIRHAM5_A1B_ECHAM5_DM_25km
Fig. 3. Average extreme winter wind speed (for 30 years)of all models
Fig. 4. A wind rose showing the different directions fromwhich the wind may blow
8/9/2019 Study of the Wind Speed Rainfall and Storm Surges for the Scheldt Estuary in Belgium
http://slidepdf.com/reader/full/study-of-the-wind-speed-rainfall-and-storm-surges-for-the-scheldt-estuary-in 4/5
INTERNATIONAL JOURNAL OF SCIENTIFIC & TECHNOLOGY RESEARCH VOLUME 4, ISSUE 01, JANUARY 2015 ISSN 2277-8616
133IJSTR©2015www.ijstr.org
Then the dependency between wind speed and surge wasstudied. It was observed that the relationship is stronger forwinter than other seasons. After that the dependency betweenprecipitation and surge was also examined. There is no
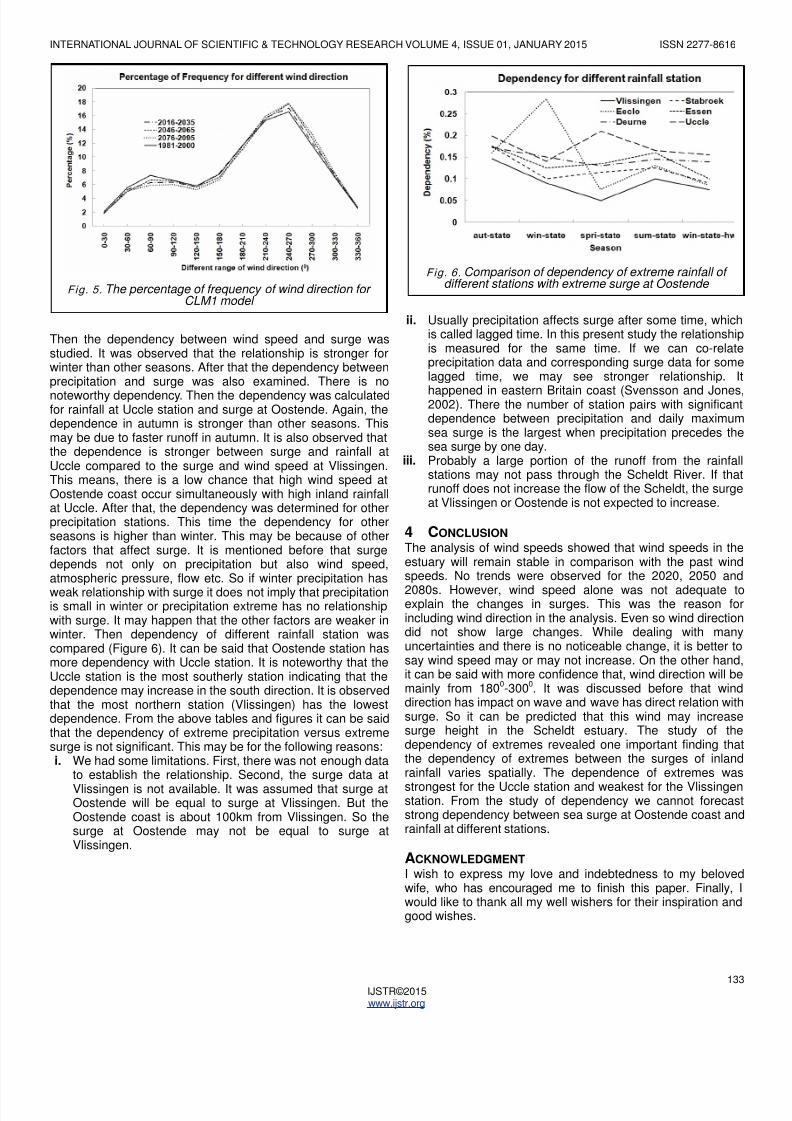
noteworthy dependency. Then the dependency was calculatedfor rainfall at Uccle station and surge at Oostende. Again, thedependence in autumn is stronger than other seasons. Thismay be due to faster runoff in autumn. It is also observed thatthe dependence is stronger between surge and rainfall atUccle compared to the surge and wind speed at Vlissingen.This means, there is a low chance that high wind speed atOostende coast occur simultaneously with high inland rainfallat Uccle. After that, the dependency was determined for otherprecipitation stations. This time the dependency for otherseasons is higher than winter. This may be because of otherfactors that affect surge. It is mentioned before that surgedepends not only on precipitation but also wind speed,atmospheric pressure, flow etc. So if winter precipitation has
weak relationship with surge it does not imply that precipitationis small in winter or precipitation extreme has no relationshipwith surge. It may happen that the other factors are weaker inwinter. Then dependency of different rainfall station wascompared (Figure 6). It can be said that Oostende station hasmore dependency with Uccle station. It is noteworthy that theUccle station is the most southerly station indicating that thedependence may increase in the south direction. It is observedthat the most northern station (Vlissingen) has the lowestdependence. From the above tables and figures it can be saidthat the dependency of extreme precipitation versus extremesurge is not significant. This may be for the following reasons:i. We had some limitations. First, there was not enough data
to establish the relationship. Second, the surge data at
Vlissingen is not available. It was assumed that surge atOostende will be equal to surge at Vlissingen. But theOostende coast is about 100km from Vlissingen. So thesurge at Oostende may not be equal to surge atVlissingen.
ii. Usually precipitation affects surge after some time, whichis called lagged time. In this present study the relationshipis measured for the same time. If we can co-relateprecipitation data and corresponding surge data for somelagged time, we may see stronger relationship. It
happened in eastern Britain coast (Svensson and Jones2002). There the number of station pairs with significantdependence between precipitation and daily maximumsea surge is the largest when precipitation precedes thesea surge by one day.
iii. Probably a large portion of the runoff from the rainfal
stations may not pass through the Scheldt River. If thatrunoff does not increase the flow of the Scheldt, the surgeat Vlissingen or Oostende is not expected to increase.
4 CONCLUSION The analysis of wind speeds showed that wind speeds in theestuary will remain stable in comparison with the past windspeeds. No trends were observed for the 2020, 2050 and
2080s. However, wind speed alone was not adequate toexplain the changes in surges. This was the reason forincluding wind direction in the analysis. Even so wind directiondid not show large changes. While dealing with manyuncertainties and there is no noticeable change, it is better tosay wind speed may or may not increase. On the other handit can be said with more confidence that, wind direction will bemainly from 180
0-300
0. It was discussed before that wind
direction has impact on wave and wave has direct relation withsurge. So it can be predicted that this wind may increasesurge height in the Scheldt estuary. The study of thedependency of extremes revealed one important finding thathe dependency of extremes between the surges of inlandrainfall varies spatially. The dependence of extremes was
strongest for the Uccle station and weakest for the Vlissingenstation. From the study of dependency we cannot forecaststrong dependency between sea surge at Oostende coast andrainfall at different stations.
ACKNOWLEDGMENT I wish to express my love and indebtedness to my belovedwife, who has encouraged me to finish this paper. Finally, would like to thank all my well wishers for their inspiration andgood wishes.
Fig. 5. The percentage of frequency of wind direction forCLM1 model
Fig. 6. Comparison of dependency of extreme rainfall ofdifferent stations with extreme surge at Oostende
8/9/2019 Study of the Wind Speed Rainfall and Storm Surges for the Scheldt Estuary in Belgium
http://slidepdf.com/reader/full/study-of-the-wind-speed-rainfall-and-storm-surges-for-the-scheldt-estuary-in 5/5
INTERNATIONAL JOURNAL OF SCIENTIFIC & TECHNOLOGY RESEARCH VOLUME 4, ISSUE 01, JANUARY 2015 ISSN 2277-8616
134IJSTR©2015www.ijstr.org
REFERENCES [1] Baeyens, W., et al. 1998. General description of the
Scheldt estuary. Hydrobiologia, 366, pp. 1 –14.
[2] Bengtsson, L.B., Hodges, K.I., and Roeckner E., 2006,Storm tracks and climate change, Journal of Climate,19(15), pp. 3518-3543.
[3]
Brink, H.W., Hurk, B.J.J.M., 2007. Future changes inwinter wind-climate over Europe. Climate Dynamic, 2007,pp. 7-8.
[4] Buishand TA., 1984. Bivariate extreme-value data and thestation-year method. Journal of Hydrology, 69, pp. 77 –95.
[5] Coles S, Heffernan J, and Tawn J.A., 2000. Dependencemeasures for extreme value analyses. Extremes, 2, pp.339 –365.
[6] ENSEMBLES, The ENSEMBLES project RT3, [online]available at http://ensemblesrt3.dmi.dk/ [accessed on11/11/2010].
[7] IPCC, 2007. Climate Change 2007. The Physical ScienceBasis. Cambridge University Press, Cambridge, p. 940.
[8] Lambert, S., Fyfe, J.C., 2006. Changes in winter cyclonefrequencies and strengths simulated in enhancedgreenhouse gas experiments: Results from the modelsparticipating in the IPCC diagnostic exercise. ClimateDynamics, 26, (7-8). pp. 713-728.
[9] Leckebusch, G.D. et al., 2006. Analysis of frequency andintensity of winter storm events in Europe on synoptic andregional scales from a multi-model perspective. ClimateResearch, 31, pp. 59-74.
[10] McInnes, K. L., Macadam, I., Hubbert, G. D., and O’Grady, J. G., 2009. A modelling approach for estimating thefrequency of sea level extremes and the impact of climatechange in southeast Australia. Nat Hazards, 51, pp. 115 –137.
[11] Sangireddy H. Reading NetCDF files in MATLAB andAnalyzing the Precipitation Data. [online] available athttps://webspace.utexas.edu/hs8238/www/surfacehydrology/surfacehydrology_Project.htm, [Accessed on26/02/2011].
[12] Svensson C., Jones D.A., 2002. Dependence between
extreme sea surge, river flow and precipitation in easternBritain. International Journal of Climatology, 22, pp. 1149-1168.