Embed Size (px)
Citation preview
17UK Economic Outlook July 2016
3 – UK Housing market outlook
Introduction and key findingsIn this section, we review recent trends in the housing market and present projections for house price growth in the UK and its regions. We also present new research that outlines the dramatic changes in the affordability of housing for 20-39 year olds (who we refer to as “generation rent”).
Ourkeyfindingsare:
• The decision by the UK public to leave the EU (‘Brexit’) has shaken the property market. We anticipate a marked slowdown as a result, with house price growth decelerating to 3% in 2016 and 1% in 2017 in our main scenario. But prices should still rise – we are not projecting a house price crash in our main scenario, although there are considerable uncertainties around any such projection and risks appear to be weighted to the downside at present.
• After this initial dip in UK house price growth, our main scenario projects a gradual recovery, with price growth picking up again to around 4% in 2018 and 6% in 2019. Thereafter, we expect growth to average around 5-6% per annum from 2020 to 2025 as persistent supply shortages keep house prices rising faster than earnings on average.
• The impact of Brexit will vary by region, but we expect it to be most acute in the London market. By 2018, we estimate house prices in London could be around £60,000 lower than if the UK had voted to remain; this contrasts to a difference of around £10,000 in Scotland and just £8,000 in the North East.
• But we would stress that these are estimated differences from an expected steady upward path for regional house prices without Brexit. In our main scenario, the absolute level of house prices should still be higher in all regions in 2018 than in 2015 despite the dampening effect of the Brexit vote.
• Our new research into housing affordability for generation rent shows that buyers may now have to save for 19 years in order to buy their firsthome(assumingthedeposithasto be raised entirely from their own savings without family assistance). In 2000, the same group would have been able to buy after saving for just 6 years; and in 1990 it took only around 2 years.
• The affordability analysis shows a huge disparity in outcomes between renters and those 20-39 year olds who have already managed to get a foot on the housing ladder. This group has been largely insulated from the deterioration in affordability due to capital gains made on their existing homes.
• The good news for generation renters is that Brexit may actually help them get on the ladder slightly sooner as we expect it to slow the pace of house price growth. Unfortunately, the effect is small, as we estimate a generation renter starting to save in 2016 can now buy in 2035, rather than 2037 if the UK had voted to remain.
Thediscussionbelowbeginsbybrieflyreviewing recent housing market developments (Section 3.1) and then goes on to assess future UK and regional house price prospects, taking into account the potential impact of Brexit (Section 3.2). Section 3.3 presents our new research into the affordability of housing for generation rent. Further details of our modelling work are contained in the technical annex.
18 UK Economic Outlook July 2016
3.1 Recent housing market developmentsThe EU referendum result has been a shock to the UK economy and the housing market. Shares in homebuilders have been amongst the worst performers on the FTSE. Some estate agents have issued profitwarningsandpredictedsignificantlylowerrevenuethisyearbecause of the referendum result. Anecdotal evidence suggests that buyers are pulling out of transactions and sellers are cutting asking prices on UK property.
The main reason for this is increased political and economic uncertainty, which could impact the housing market through four key channels:
1. The deterrence of foreign investment in the UK (which particularly affects the central London market, but also has wider economic impacts).
2. Uncertainty regarding the future of EU nationals in the UK (and those considering moving to the UK).
3. Areductioninconsumerconfidenceleading to buyers deferring or renegotiating transactions.
4. Turbulence in the UK banking sector, which provides the vast majority of mortgage funding for housing transactions.
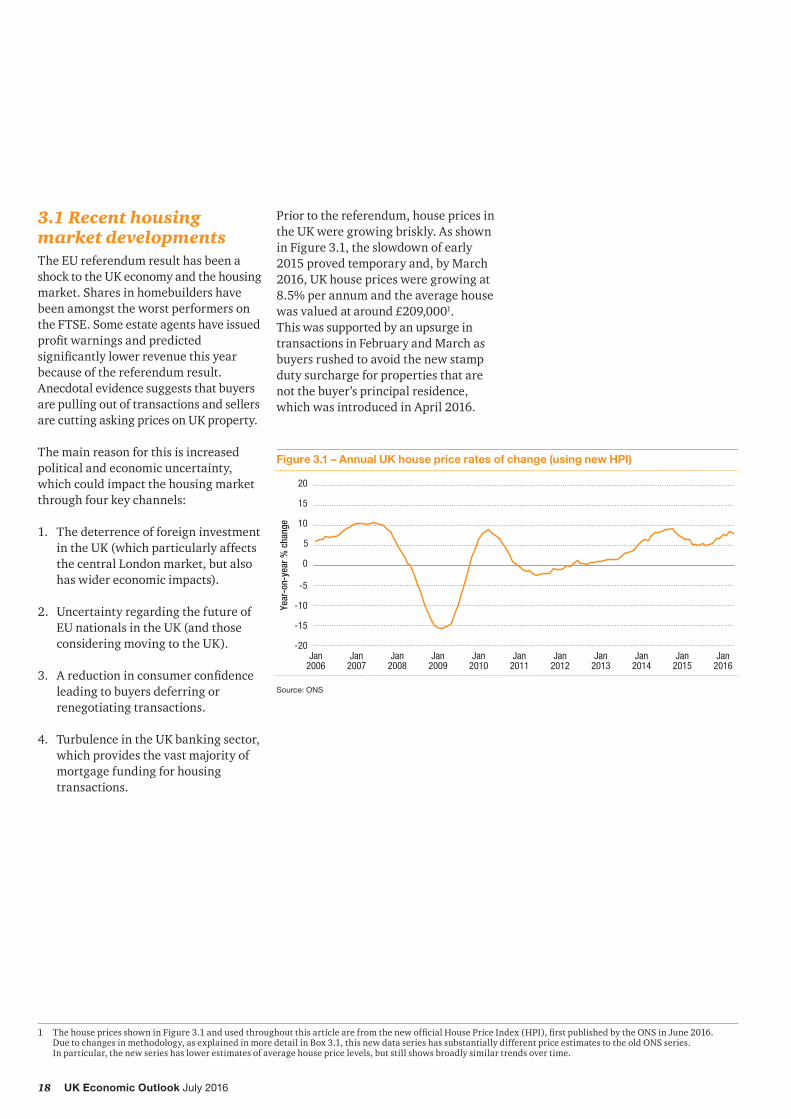
Prior to the referendum, house prices in the UK were growing briskly. As shown in Figure 3.1, the slowdown of early 2015 proved temporary and, by March 2016, UK house prices were growing at 8.5% per annum and the average house was valued at around £209,0001. This was supported by an upsurge in transactions in February and March as buyers rushed to avoid the new stamp duty surcharge for properties that are not the buyer’s principal residence, which was introduced in April 2016.
Figure 3.1 – Annual UK house price rates of change (using new HPI)
Source: ONS
-20
-15
-10
-5
0
5
10
15
20
Jan2016
Jan2015
Jan2014
Jan2013
Jan2012
Jan2011
Jan2010
Jan2009
Jan2008
Jan2007
Jan2006
Year
-on-
year
% c
hang
e
1 ThehousepricesshowninFigure3.1andusedthroughoutthisarticlearefromthenewofficialHousePriceIndex(HPI),firstpublishedbytheONSinJune2016. Due to changes in methodology, as explained in more detail in Box 3.1, this new data series has substantially different price estimates to the old ONS series. In particular, the new series has lower estimates of average house price levels, but still shows broadly similar trends over time.
19UK Economic Outlook July 2016
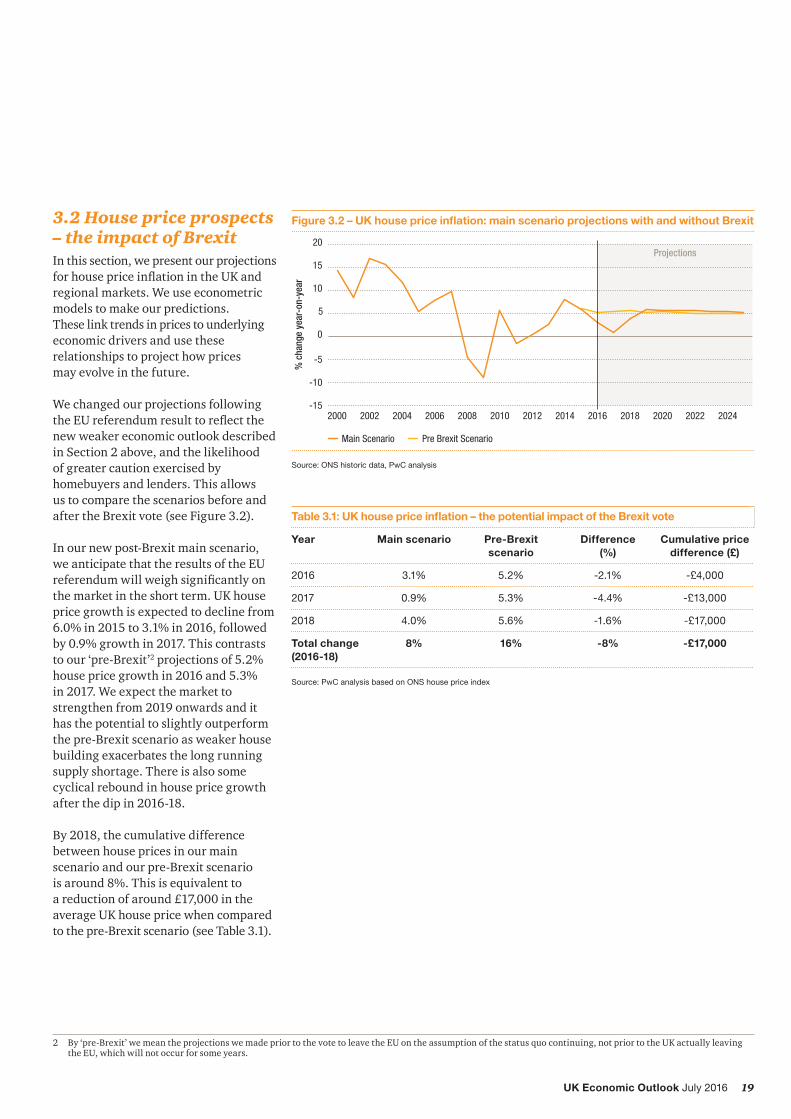
3.2 House price prospects – the impact of BrexitIn this section, we present our projections forhousepriceinflationintheUKandregional markets. We use econometric models to make our predictions. These link trends in prices to underlying economic drivers and use these relationships to project how prices may evolve in the future.
We changed our projections following theEUreferendumresulttoreflectthenew weaker economic outlook described in Section 2 above, and the likelihood of greater caution exercised by homebuyers and lenders. This allows us to compare the scenarios before and after the Brexit vote (see Figure 3.2).
In our new post-Brexit main scenario, we anticipate that the results of the EU referendumwillweighsignificantlyonthe market in the short term. UK house price growth is expected to decline from 6.0% in 2015 to 3.1% in 2016, followed by 0.9% growth in 2017. This contrasts to our ‘pre-Brexit’2 projections of 5.2% house price growth in 2016 and 5.3% in 2017. We expect the market to strengthen from 2019 onwards and it has the potential to slightly outperform the pre-Brexit scenario as weaker house building exacerbates the long running supply shortage. There is also some cyclical rebound in house price growth after the dip in 2016-18.
By 2018, the cumulative difference between house prices in our main scenario and our pre-Brexit scenario is around 8%. This is equivalent to a reduction of around £17,000 in the average UK house price when compared to the pre-Brexit scenario (see Table 3.1).
Figure 3.2 – UK house price inflation: main scenario projections with and without Brexit
Source: ONS historic data, PwC analysis
Table 3.1: UK house price inflation – the potential impact of the Brexit vote
Year Main scenario Pre-Brexit scenario
Difference (%)
Cumulative price difference (£)
2016 3.1% 5.2% -2.1% -£4,000
2017 0.9% 5.3% -4.4% -£13,000
2018 4.0% 5.6% -1.6% -£17,000
Total change (2016-18)
8% 16% -8% -£17,000
Source: PwC analysis based on ONS house price index
Projections
-15
-10
-5
0
5
10
15
20
2024202220202018201620142012201020082006200420022000
Pre Brexit ScenarioMain Scenario
% c
hang
e ye
ar-o
n-ye
ar
2 By ‘pre-Brexit’ we mean the projections we made prior to the vote to leave the EU on the assumption of the status quo continuing, not prior to the UK actually leaving the EU, which will not occur for some years.

20 UK Economic Outlook July 2016
Looking at the regional picture, we expect Brexit will affect the London market more severely than other parts of the UK. London has a greater share of international buyers and residents, plus our regional GVA projections (see Figure 2.6 in Section 2) suggest thatLondoncouldseeamoresignificantshort term reduction in growth than elsewhere due to Brexit.
Figure 3.3 shows the contrast in projected regional house prices in 2018 between the pre-Brexit scenario and our new main scenario. In London, we estimate that prices will be around £60,000 lower than if the UK had voted to remain (although they are still expected to grow relative to their 2015 level). The estimated difference is around £30,000 in the South East and £23,000 in the East of England. The relative fall in prices is expected to be under £20,000 for the South West, around £15,000 for the Midlands, and closer to £10,000 for other regions.
Figure 3.3 – Cumulative house price impact of Brexit vote relative to pre-Brexit outlook (by 2018)
Source: PwC analysis based on ONS house price index
-70,000
-60,000
-50,000
-40,000
-30,000
-20,000
-10,000
0
NorthEast
NorthernIreland
ScotlandWalesNorthWest
Yorkshireand
The Humber
EastMidlands
WestMidlandsRegion
SouthWest
East ofEngland
SouthEast
London
Chan
ge in
ave
rage
hou
se p
rice
rela
tive
to p
re-B
rexi
t sce
nario
(£)
Despite this, our main scenario is that house prices will continue to grow in most regions. As set out in Table 3.2, Scotland is the only region where we anticipate prices declining in 2016-17 and this is only temporary.
Our regional projections for 2017 show a subdued market compared to the past three years. House price growth in 2017 is expected to be under 2% for all regions, and negative for Scotland, the Midlands, the North West and Yorkshire. From 2018 to 2020 we project in this main scenario that house prices will recover consistently across the UK. This is driven by an assumed recovery in credit conditions, earningsgrowthandalsoreflectsunderlying housing supply constraints.

21UK Economic Outlook July 2016
Table 3.3 shows how these growth rates translate into projected regional house price values under our main scenario. Despite experiencing a relatively sharp downturn in price growth, London house prices remain on an upward track. Average prices in the capital are expected to reach around £530,000 by 2020, over three times the price of the average home in Yorkshire & the Humber and the North of England.
Allofthefigurespresentedabovearethose for our main scenario, but projecting housepricesalwaysinvolvessignificantuncertainties – particularly in the current environment after the Brexit vote. In the following sub-section we therefore present high and low house price growth scenarios out to 2025.
Table 3.2: Regional house price growth in PwC main scenario
Region 2015 2016 2017 2018 2019 2020
East of England 9.8% 5.7% 1.9% 4.0% 6.1% 6.0%
Yorkshire & The Humber 4.0% 1.1% -0.6% 3.9% 5.2% 5.2%
South West 6.0% 3.7% 1.8% 4.1% 5.7% 5.7%
West Midlands 4.8% 1.6% -0.2% 3.9% 5.3% 5.3%
London 10.2% 5.9% 0.6% 4.1% 6.0% 6.0%
North West 3.7% 0.6% -0.7% 3.9% 5.3% 5.2%
South East 8.9% 5.2% 1.0% 3.9% 6.0% 6.0%
North East 2.3% 0.4% 0.0% 3.9% 5.0% 4.9%
East Midlands 5.5% 1.9% -0.3% 4.0% 5.9% 5.8%
Wales 2.8% 1.3% 0.8% 3.9% 5.8% 5.8%
Scotland 4.0% -1.6% -0.4% 4.2% 5.7% 5.7%
Northern Ireland 7.3% 1.7% 0.2% 4.3% 4.8% 4.7%
UK average 6.0% 3.1% 0.9% 4.0% 5.9% 5.8%
Source: PwC analysis based on ONS house price index
Table 3.3: Regional house price values (£000’s) in the main scenario
Region 2015 2016 2017 2018 2019 2020
East of England 240 254 258 269 285 302
Yorkshire & The Humber 142 143 143 148 156 164
South West 219 227 231 240 254 269
West Midlands 165 167 167 173 183 192
London 425 450 452 471 500 530
North West 140 141 140 145 153 161
South East 277 291 294 306 324 344
North East 121 122 122 127 133 139
East Midlands 160 163 162 169 179 189
Wales 139 140 142 147 156 165
Scotland 137 135 134 140 148 156
Northern Ireland 115 117 118 122 129 135
UK average 198 204 206 214 227 240
Source: PwC analysis based on ONS house price index
22 UK Economic Outlook July 2016
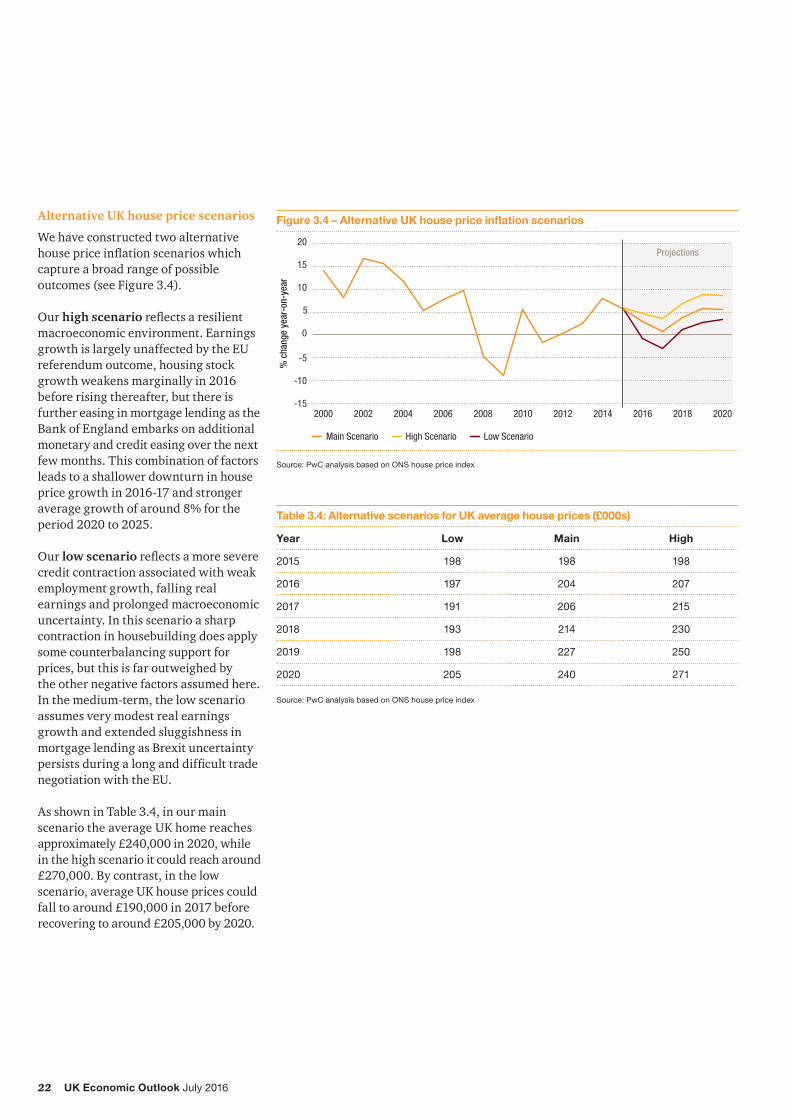
Alternative UK house price scenarios
We have constructed two alternative housepriceinflationscenarioswhichcapture a broad range of possible outcomes (see Figure 3.4).
Our high scenarioreflectsaresilientmacroeconomic environment. Earnings growth is largely unaffected by the EU referendum outcome, housing stock growth weakens marginally in 2016 before rising thereafter, but there is further easing in mortgage lending as the Bank of England embarks on additional monetary and credit easing over the next few months. This combination of factors leads to a shallower downturn in house price growth in 2016-17 and stronger average growth of around 8% for the period 2020 to 2025.
Our low scenarioreflectsamoreseverecredit contraction associated with weak employment growth, falling real earnings and prolonged macroeconomic uncertainty. In this scenario a sharp contraction in housebuilding does apply some counterbalancing support for prices, but this is far outweighed by the other negative factors assumed here. In the medium-term, the low scenario assumes very modest real earnings growth and extended sluggishness in mortgage lending as Brexit uncertainty persistsduringalonganddifficulttradenegotiation with the EU.
As shown in Table 3.4, in our main scenario the average UK home reaches approximately £240,000 in 2020, while in the high scenario it could reach around £270,000. By contrast, in the low scenario, average UK house prices could fall to around £190,000 in 2017 before recovering to around £205,000 by 2020.
Figure 3.4 – Alternative UK house price inflation scenarios
Source: PwC analysis based on ONS house price index
Projections
-15
-10
-5
0
5
10
15
20
20202018201620142012201020082006200420022000
High ScenarioMain Scenario Low Scenario
% c
hang
e ye
ar-o
n-ye
ar
Table 3.4: Alternative scenarios for UK average house prices (£000s)
Year Low Main High
2015 198 198 198
2016 197 204 207
2017 191 206 215
2018 193 214 230
2019 198 227 250
2020 205 240 271
Source: PwC analysis based on ONS house price index

23UK Economic Outlook July 2016
Box 3.1 – The revised ONS house price index
InJune,theOfficeforNationalStatistics(ONS)publishedthefirsteditionoftheirnewofficialHousePrice Index (HPI). Previously, the Land Registry and ONS published separate indices but in recent years these have been diverging. The new HPI will replace both these indices by providing a single consistent series.
This new index was developed following a consultation in 2014, which highlighted the limitations of the previous ONS measure. The new methodology aims to address this with the following new features:
1. Inclusion of both cash sales and new dwellings to provide full coverage of the market.
2. Use of the geometric rather than the arithmetic mean when calculating average prices – this reduces the sensitivity of the index to very high value property transactions and, as a result, reduces average prices compared to the old ONS index.
3. A revised calculation process to ensure the index is representative of the current housing market.
4. Publication of average prices which are now comparable over time.
As Figure 3.5 shows, the new HPI lies in between the two previous indices.
Compared with the previous ONS HPI, this new index is consistently lower and suggests that house prices
have grown at a slower rate in the past 5years.Thedifferenceissignificantasaverage prices for the new measure are £75,000 lower than the old ONS series.Thisseemsprimarilytoreflectthelower weight given to high value property transactions (particularly in London) due to switching from arithmetic to geometric averaging. This switch was also a feature of the move from RPI to CPI to measure consumer price inflationandisgenerallyregarded as more methodologically robust.
Compared with the old Land Registry index, the new HPI is slightly higher but has a similar trend over time. The main difference is due to the updated composition of properties on which the index is based. Previously, the Land Registry index was based on a set of properties from April 2000, whereas the new HPI is representative of the current market. The Land Registry index was also only for England & Wales.
The new HPI index will be published on a monthly basis going forward but there is a time lag, so the latest available data at the time ofwritingisforApril2016.Thefirstofficialpost-referendumdataforJuly will not be published until mid-September, although other less comprehensive house price indices will be published before then by mortgage lenders and estate agents.
Figure 3.5 – Comparison of new UK HPI with old ONS and Land Registry (LR) indices
Source: ONS
0
50
100
150
200
250
300
350
Jan2016
Jan2015
Jan2014
Jan2013
Jan2012
Jan2011
Jan2010
Jan2009
Jan2008
Jan2007
Jan2006
Jan2005
Previous ONS HPI (England and Wales)New UK HPI (England and Wales)
Previous LR (England and Wales)
Hous
e pr
ice
inde
x (£
thou
sand
s)

24 UK Economic Outlook July 2016
3.3 Renting for a generation? Housing affordability trends for first time buyersOver the past 12 months, we have published a series of pieces of research highlighting the housing situation for generation rent: the group of 20-39 year olds for whom home ownership is increasingly hard to reach. Since the millennium, the share of 20-39 year olds who rent privately has more than doubled from 20% to 50% and we anticipate that this rise will continue.
To better understand this fundamental change, we have developed a new measure of affordability that considers a broad range of drivers (see Table 3.5). As well as looking at house prices and earnings, we also consider bank lending behaviour and household savings rates.
The measure allows us to estimate how many years it would take a 20-39 year oldfirst-timebuyertosaveadepositfortheirfirsthome.Wehavealsoconsidered20-39 year old “second steppers” who already own a property and wish to upgrade (e.g. due to getting married or starting a family). The difference in our results for these two groups is clear.
Table 3.5: Key drivers of affordability
Impact on first-time buyer affordability
Impact on second stepper affordability
Rising house prices Leads to higher deposit and income requirements to buy
Broadly neutral due to capital gains made on current property
Stricter bank lending criteria
Results in lower loan to value ratios offered, driving up deposit requirements
Results in lower loan to value ratios offered, driving up deposit requirements
Interest rates Savings grow more slowly due to poor interest returns (though this does also make repaying mortgages easier once you have one)
Savings grow more slowly due poor interest returns, but this also results in lower mortgage rates, allowing more capital repayments to be made on the mortgage
Falling income growth Reduces the amount that people can save
Reduces the amount that people can save

25UK Economic Outlook July 2016
Renters looking to buy their first home
For a 20-39 year old on an average incomewhoislookingtobuytheirfirsthome, we estimate that, if they start saving in 2016, it will take around 19 years – almost two decades – to save the £115,000 average deposit that will be required to buy a property in 20353.
As Figure 3.6 illustrates, the affordability situation for those in generation rent has changed fundamentally over time, both due to the rapid house price increases either side of the millennium, and due to the credit crunch after 2007.
We can usefully divide the trends shown in Figure 3.6 into four sub-periods.
3 This analysis assumes no family assistance towards deposit saving. It is based on a household of one full time employee and one part time employee. At present we have only done the analysis based on UK average data, but we may look at regional trends in subsequent research as data allows. See the methodological annex for more details of how we made these estimates.
Figure 3.6 – Average number of years of saving required for deposit on first home (by first year of saving)
Source: PwC analysis based on ONS data (assuming no family assistance in saving for a deposit)
02
4
6
8
10
12
14
16
18
20
2024202220202018201620142012201020082006200420022000199819961994199219901988
Golden years Soaring house prices Credit crunched Renting for a generation?
Year
s to
sav
e
Period 1: Early-to-mid 1990s - the golden years for new home-buyers
Duringthefirsthalfofthe1990s,housing market conditions were strongly in favour of those looking to buy their firsthome(providedtheykepttheirjobsthrough the recession). House prices were subdued for some years following the economic downturn of the early 1990s, but credit conditions were still reasonably supportive, with banks still offering relatively high loan-to-value ratios, so keeping the amount required for a deposit relatively low. Meanwhile a high interest rate on savings deposits and strong nominal earnings growth
helped 20-39 year olds accumulate money for their deposits. As a result, we estimate that, on average, renters wereabletosaveforafirsthome deposit in just 2-3 years (assuming, as we do throughout this analysis, no family assistance). Having said that, they did then face a high mortgage interest rate when repaying their loans.
Period 2: Mid-1990s to mid-2000s - Soaring house prices offset only partly by easy credit
House prices began to rise rapidly in the late 1990s and this continued largely unabateduntilthefinancialcrisisof
2007/8 as supply-side constraints became increasinglysevere.Asaresult,firsttimebuyer deposits rose 6-fold over the period and this drove a steady increase in the years needed to get onto the housing ladder for 20-39 year olds. On average, weestimatethatafirst-timebuyerwithno family assistance would have needed 4 years to save for their house at the beginning of the period, but this had increased to almost 9 years on the eve oftheglobalfinancialcrisis.Butatleastcredit was still reasonably readily available in this period, with continuing relatively high loan-to-value (LTV) ratios being offered by lenders.
26 UK Economic Outlook July 2016
Period 3: 2008 to 2014 - first time buyers are ‘credit crunched’
First time buyers may have been forgiven for hoping that, so long as they kept their jobs, falling house prices during the 2008-9 recession might help them to get onto the property ladder more easily. But this was not the case. Banks withdrew high LTV mortgages, driving up deposits at a time when earnings stagnated and almost no interest was being earned on savings. The housing market started to accelerate again from 2012, but earnings did not. The estimated average time takentosaveforafirsttimebuyerdepositwith no family assistance more than doubled from around 9 years in 2007 to around 20 years in 2014.
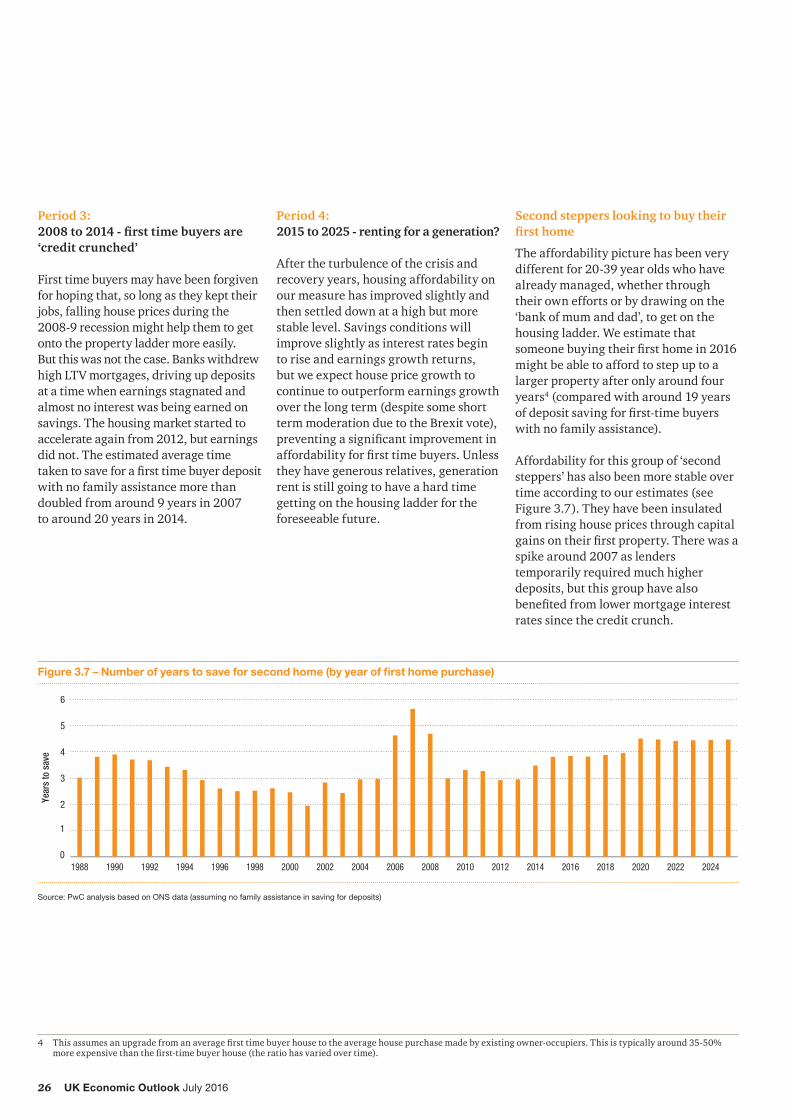
Second steppers looking to buy their first home
The affordability picture has been very different for 20-39 year olds who have already managed, whether through their own efforts or by drawing on the ‘bank of mum and dad’, to get on the housing ladder. We estimate that someonebuyingtheirfirsthomein2016might be able to afford to step up to a larger property after only around four years4 (compared with around 19 years ofdepositsavingforfirst-timebuyerswith no family assistance).
Affordability for this group of ‘second steppers’ has also been more stable over time according to our estimates (see Figure 3.7). They have been insulated from rising house prices through capital gainsontheirfirstproperty.Therewasaspike around 2007 as lenders temporarily required much higher deposits, but this group have also benefitedfromlowermortgageinterestrates since the credit crunch.
Period 4: 2015 to 2025 - renting for a generation?
After the turbulence of the crisis and recovery years, housing affordability on our measure has improved slightly and then settled down at a high but more stable level. Savings conditions will improve slightly as interest rates begin to rise and earnings growth returns, but we expect house price growth to continue to outperform earnings growth over the long term (despite some short term moderation due to the Brexit vote), preventingasignificantimprovementinaffordabilityforfirsttimebuyers.Unlessthey have generous relatives, generation rent is still going to have a hard time getting on the housing ladder for the foreseeable future.
Figure 3.7 – Number of years to save for second home (by year of first home purchase)
Source: PwC analysis based on ONS data (assuming no family assistance in saving for deposits)
0
1
2
3
4
5
6
2024202220202018201620142012201020082006200420022000199819961994199219901988
Year
s to
sav
e
4 Thisassumesanupgradefromanaveragefirsttimebuyerhousetotheaveragehousepurchasemadebyexistingowner-occupiers.Thisistypicallyaround35-50%moreexpensivethanthefirst-timebuyerhouse(theratiohasvariedovertime).
27UK Economic Outlook July 2016
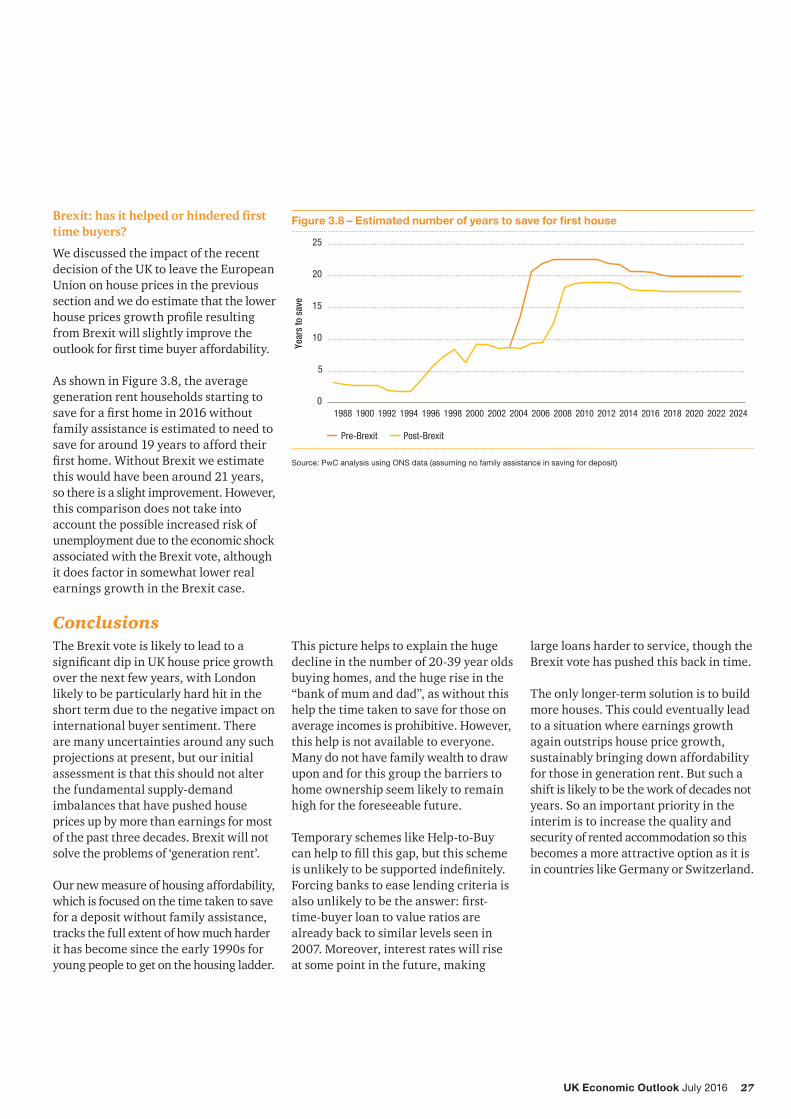
Brexit: has it helped or hindered first time buyers?
We discussed the impact of the recent decision of the UK to leave the European Union on house prices in the previous section and we do estimate that the lower housepricesgrowthprofileresultingfrom Brexit will slightly improve the outlookforfirsttimebuyeraffordability.
As shown in Figure 3.8, the average generation rent households starting to saveforafirsthomein2016withoutfamily assistance is estimated to need to save for around 19 years to afford their firsthome.WithoutBrexitweestimatethis would have been around 21 years, so there is a slight improvement. However, this comparison does not take into account the possible increased risk of unemployment due to the economic shock associated with the Brexit vote, although it does factor in somewhat lower real earnings growth in the Brexit case.
ConclusionsThe Brexit vote is likely to lead to a significantdipinUKhousepricegrowthover the next few years, with London likely to be particularly hard hit in the short term due to the negative impact on international buyer sentiment. There are many uncertainties around any such projections at present, but our initial assessment is that this should not alter the fundamental supply-demand imbalances that have pushed house prices up by more than earnings for most of the past three decades. Brexit will not solve the problems of ‘generation rent’.
Our new measure of housing affordability, which is focused on the time taken to save for a deposit without family assistance, tracks the full extent of how much harder it has become since the early 1990s for young people to get on the housing ladder.
This picture helps to explain the huge decline in the number of 20-39 year olds buying homes, and the huge rise in the “bank of mum and dad”, as without this help the time taken to save for those on average incomes is prohibitive. However, this help is not available to everyone. Many do not have family wealth to draw upon and for this group the barriers to home ownership seem likely to remain high for the foreseeable future.
Temporary schemes like Help-to-Buy canhelptofillthisgap,butthisschemeisunlikelytobesupportedindefinitely.Forcing banks to ease lending criteria is alsounlikelytobetheanswer:first-time-buyer loan to value ratios are already back to similar levels seen in 2007. Moreover, interest rates will rise at some point in the future, making
large loans harder to service, though the Brexit vote has pushed this back in time.
The only longer-term solution is to build more houses. This could eventually lead to a situation where earnings growth again outstrips house price growth, sustainably bringing down affordability for those in generation rent. But such a shift is likely to be the work of decades not years. So an important priority in the interim is to increase the quality and security of rented accommodation so this becomes a more attractive option as it is in countries like Germany or Switzerland.
Figure 3.8 – Estimated number of years to save for first house
Source: PwC analysis using ONS data (assuming no family assistance in saving for deposit)
0
5
10
15
20
25
2024202220202018201620142012201020082006200420022000199819961994199219001988
Post-BrexitPre-Brexit
Year
s to
sav
e

28 UK Economic Outlook July 2016
Technical annex: Modelling methodologiesUK house price projections
Our analysis focuses on the new ONS house price indices. Data from the ONS vary from those provided by Nationwide and Halifax, though broad trends tend to be similar over time. We focus on the ONS data as they cover a larger sample size, given that Nationwide and Halifax base their indices on only their own mortgage approvals.
The PwC house price model consists of two parts: a long run equilibrium equation and a short run error correction model that indicates how house prices adjust back towards this equilibrium level.
In the long run, real house prices are driven by three key variables: real annual earnings, the ratio of the housing stock to the population (‘supply’) and a variable whichreflectsgeneralcreditconditions.Monetaryvaluesaredeflatedintoreal(inflationadjusted)termsusingCPI.
In the short run, changes in real house prices are driven by: deviations from the long run equilibrium; changes in real annual earnings; changes in credit conditions; and the previous period’s mortgage interest rate (cost of borrowing). Thecoefficientsforthesemodelvariablesand other summary statistics for both models are shown in the tables below.
The parameters of the model were estimated using the standard ordinary least squares (OLS) econometric technique based on annual data from 1975-2015.
Long run model (Cointegrating equation)
R-squared = 0.93
Dependent variable: Real house prices
No. of observations=41
Coefficient t-statistics
Earnings 16.4 10.2
Supply -1214.1 -4.4
Credit 12992.5 2.5
Constant 281622.6 3.3
Short run model
R-squared = 0.64
Dependent variable: Change in Real house prices
No. of observations=40
Coefficient t-statistics
L. co-integrating equation residual -0.13 -1.8
D.Credit 18908.3 4.6
D.Earnings 7.6 3.8
L.Mortgage rate -424.2 -2.1
Constant 4410.1 2.3
Note: ‘D’ refers to the first difference of a variable (i.e. change on previous year). ‘L’ refers to the lagged value of a variable in the previous year.
28 UK Economic Outlook July 2016

29UK Economic Outlook July 2016
Affordability modelling methodology and projections
We carried out the affordability analysis at the UK level, using data on income, house prices and mortgage lending from the ONS. We also conducted a survey of 2,000 UK adults to gain further insight into savings behaviour.
Our measure focused on the affordability of housing deposits since this has been the main barrier to home ownership in recent years. We calculated the number of years that both current renters and current homeowners would need to save for a deposit at average earnings and savings rates. We assumed no family assistance, with all savings coming from household earnings.
• Thenumberofyearsthatfirst-timebuyers must save for a deposit is driven by (a) house prices, (b) cash savings accumulation and (c) the loan-to-value ratio. Our survey indicated that renters aged 20-39 save approximately 9% of their income a year. We compared the yearly accumulation of renters’ savings to the amount required for theaveragefirsthousedepositineach year to determine the number of years of savings required.
• Oncefirst-timebuyershavepurchased their home, the funds available for a deposit are no longer cash savings alone. Homeowners accumulate wealth through the increase in the value of their current house, the capital repayments and the deposit on the current home. We compared the yearly accumulation of savings and wealth of homeowners to the amount required for the average movers’ house deposit in each year to determine the number of years of savings required.
Our projections used the housing-related projections from the PwC house price model as well as income projections from the OBR (extrapolated forward from 2020 assuming constant real income growth thereafter).
29UK Economic Outlook July 2016

www.pwc.co.uk/economics
At PwC, our purpose is to build trust in society and solve important problems. PwC is a network of firms in 157 countries with more than 208,000 people who are committed to delivering quality in assurance, advisory and tax services. Find out more and tell us what matters to you by visiting us at www.pwc.com/UK.
This publication has been prepared for general guidance on matters of interest only, and does not constitute professional advice. You should not act upon the information contained in this publication without obtaining specific professional advice. No representation or warranty (express or implied) is given as to the accuracy or completeness of the information contained in this publication, and, to the extent permitted by law, PricewaterhouseCoopers LLP, its members, employees and agents do not accept or assume any liability, responsibility or duty of care for any consequences of you or anyone else acting, or refraining to act, in reliance on the information contained in this publication or for any decision based on it.
© 2016 PricewaterhouseCoopers LLP. All rights reserved. In this document, "PwC" refers to the UK member firm, and may sometimes refer to the PwC network. Each member firm is a separate legal entity. Please see www.pwc.com/structure for further details.
The Design Group 30811 (07/16)

![BREXI BG: TI RSKI LI, TTLE REWARD THE UK REFERENDUM ON … · THE UK REFERENDUM ON EUROPE FEBRUARY 2016 [2] UK REFERENDUM ON EUROPE ... We see volatility in UK and European assets](https://img.pdfslide.us/doc/110x75/5f03de137e708231d40b289f/brexi-bg-ti-rski-li-ttle-reward-the-uk-referendum-on-the-uk-referendum-on-europe.jpg)