Embed Size (px)
Citation preview
East Tennessee Technology Park 3-1
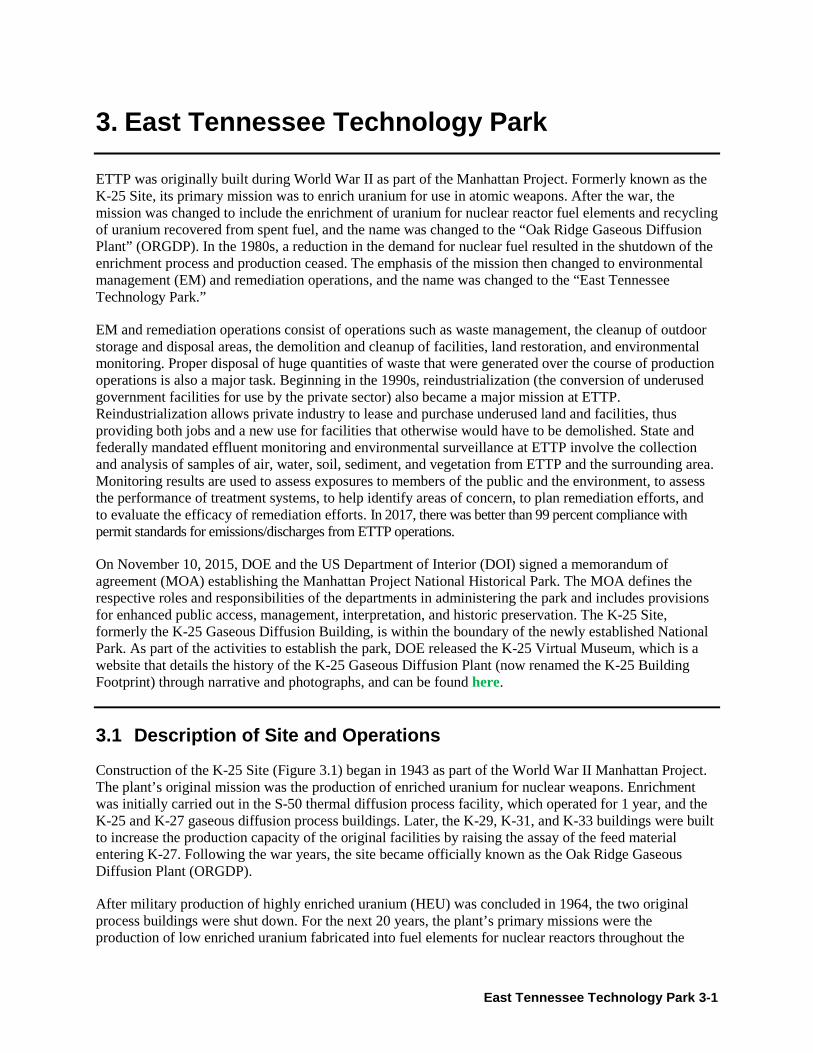
3. East Tennessee Technology Park
ETTP was originally built during World War II as part of the Manhattan Project. Formerly known as the K-25 Site, its primary mission was to enrich uranium for use in atomic weapons. After the war, the mission was changed to include the enrichment of uranium for nuclear reactor fuel elements and recycling of uranium recovered from spent fuel, and the name was changed to the “Oak Ridge Gaseous Diffusion Plant” (ORGDP). In the 1980s, a reduction in the demand for nuclear fuel resulted in the shutdown of the enrichment process and production ceased. The emphasis of the mission then changed to environmental management (EM) and remediation operations, and the name was changed to the “East Tennessee Technology Park.”
EM and remediation operations consist of operations such as waste management, the cleanup of outdoor storage and disposal areas, the demolition and cleanup of facilities, land restoration, and environmental monitoring. Proper disposal of huge quantities of waste that were generated over the course of production operations is also a major task. Beginning in the 1990s, reindustrialization (the conversion of underused government facilities for use by the private sector) also became a major mission at ETTP. Reindustrialization allows private industry to lease and purchase underused land and facilities, thus providing both jobs and a new use for facilities that otherwise would have to be demolished. State and federally mandated effluent monitoring and environmental surveillance at ETTP involve the collection and analysis of samples of air, water, soil, sediment, and vegetation from ETTP and the surrounding area. Monitoring results are used to assess exposures to members of the public and the environment, to assess the performance of treatment systems, to help identify areas of concern, to plan remediation efforts, and to evaluate the efficacy of remediation efforts. In 2017, there was better than 99 percent compliance with permit standards for emissions/discharges from ETTP operations.
On November 10, 2015, DOE and the US Department of Interior (DOI) signed a memorandum of agreement (MOA) establishing the Manhattan Project National Historical Park. The MOA defines the respective roles and responsibilities of the departments in administering the park and includes provisions for enhanced public access, management, interpretation, and historic preservation. The K-25 Site, formerly the K-25 Gaseous Diffusion Building, is within the boundary of the newly established National Park. As part of the activities to establish the park, DOE released the K-25 Virtual Museum, which is a website that details the history of the K-25 Gaseous Diffusion Plant (now renamed the K-25 Building Footprint) through narrative and photographs, and can be found here.
3.1 Description of Site and Operations Construction of the K-25 Site (Figure 3.1) began in 1943 as part of the World War II Manhattan Project. The plant’s original mission was the production of enriched uranium for nuclear weapons. Enrichment was initially carried out in the S-50 thermal diffusion process facility, which operated for 1 year, and the K-25 and K-27 gaseous diffusion process buildings. Later, the K-29, K-31, and K-33 buildings were built to increase the production capacity of the original facilities by raising the assay of the feed material entering K-27. Following the war years, the site became officially known as the Oak Ridge Gaseous Diffusion Plant (ORGDP).
After military production of highly enriched uranium (HEU) was concluded in 1964, the two original process buildings were shut down. For the next 20 years, the plant’s primary missions were the production of low enriched uranium fabricated into fuel elements for nuclear reactors throughout the

Oak Ridge Reservation Annual Site Environmental Report—2017
East Tennessee Technology Park 3-2
world. Other missions during the latter part of this 20-year period included developing and testing the gas centrifuge method of uranium enrichment and laser isotope separation research and development.
Figure 3.1. East Tennessee Technology Park
By 1985, the demand for enriched uranium had declined, and the gaseous diffusion cascades at ORGDP were placed in standby mode. That same year, the gas centrifuge program was canceled. The decision to permanently shut down the diffusion cascades was announced in late 1987 and actions necessary to implement that decision were initiated soon thereafter. Because of the termination of the original and primary missions, ORGDP was renamed the “Oak Ridge K-25 Site” in 1989. Figure 3.2 shows the ETTP site areas before the start of decontamination and decommissioning (D&D) activities. In 1996, the K-25 Site was renamed the “East Tennessee Technology Park” to reflect its new mission.

Oak Ridge Reservation Annual Site Environmental Report—2017
East Tennessee Technology Park 3-3
Figure 3.2. East Tennessee Technology Park before the start of decontamination and
decommissioning activities in 1991

Oak Ridge Reservation Annual Site Environmental Report—2017
East Tennessee Technology Park 3-4
Figure 3.3. East Tennessee Technology Park in 2017, showing progress in reindustrialization

Oak Ridge Reservation Annual Site Environmental Report—2017
East Tennessee Technology Park 3-5
Figure 3.3 shows the ETTP areas designated for D&D activities through 2017. The ETTP mission is to reindustrialize and reuse site assets through leasing and/or transferring excess or underutilized land and facilities and through incorporating commercial industrial organizations as partners in the ongoing environmental restoration, D&D, and waste treatment and disposal.
The site is undergoing environmental cleanup of its land, as well as D&D of most of its buildings. The cleanup approach makes land and various types of buildings (e.g., office, manufacturing) suitable for private industrial use and for title transfer to the Community Reuse Organization of East Tennessee (CROET) or other entities such as the City of Oak Ridge (COR). The long-term DOE goal for ETTP is to transfer as much of the site property as practicable out of DOE ownership and into CROET’s control for the development of a commercial business and industrial park. The facilities may then be subleased or sold, with the goal of stimulating private industry and recruiting business to the area. These transfers also reduce maintenance costs for DOE, which frees up additional money for environmental cleanup. The reuse of key facilities through title transfer is part of the site’s closure plan.
UCOR, the lead environmental management contractor for ETTP, supports DOE in the reindustrialization program as part of the continuing effort to transform ETTP into a private-sector industrial park. Unless otherwise noted, information on non-DOE entities located on the ETTP site is not provided in this document.
3.2 Environmental Management System The UCOR Environmental Management System (EMS) is integrated with the UCOR Integrated Safety Management System (ISMS). UCOR’s EMS is based on a graded approach for a closure and remediation contract and reflects the elements and framework contained in International Organization for Standardization (ISO) Standard 14001:2004 (ISO 2004), Environmental management systems—Requirements with guidance for use. UCOR is committed to incorporating sound environmental management, protection, and sustainability practices in all work processes and activities that are part of the DOE EM program in Oak Ridge, Tennessee. UCOR’s environmental policy states in part, “Our commitment to protect and sustain human, natural, and cultural resources is inherent in our mission to complete environmental cleanup safely with reduced risks to the public, workers, and the environment.” To achieve this, UCOR’s environmental policy adheres to the following principles:
• Management Commitment—Integrate responsible environmental practices into project operations.
• Environmental Compliance and Protection (EC&P)—Comply with all environmental regulations and standards.
• Sustainable Environmental Stewardship—Minimize the effects of our operations on the environment through a combination of source reduction, recycling, and reuse; sound waste management practices; and pollution prevention (P2).
• Partnership/Stakeholder Involvement—Maintain partnerships through effective two-way communications with our customers and other stakeholders.
3.2.1 Environmental Stewardship Scorecard
The Environmental Stewardship Scorecard is used to track and measure site-level EMS performance. During 2017 UCOR received “green scores” for EMS performance. As an example, Figure 3.4 presents information on UCOR’s 2017 P2 recycling activities related to solid waste reduction at ETTP. UCOR recycles office and mixed paper, cardboard, phone books, newspapers, magazines, aluminum cans, antifreeze, engine oils, batteries (lead [Pb] acid, universal waste, and alkaline), universal waste bulbs,

Oak Ridge Reservation Annual Site Environmental Report—2017
East Tennessee Technology Park 3-6
plastic bottles, all types of #1 and #2 plastics, and surplus electronic assets, such as computers (CPUs and laptops) and monitors (cathode ray tubes [CRTs] and liquid crystal displays [LCDs]). Other recycling opportunities include unique structural steel, stainless-steel structural members, transformers, and electrical breakers.
UCOR’s exceptional electronics stewardship earned it an award in 2017 from the Green Electronics Council for its use of Electronic Product Environmental Assessment Tool (EPEAT) methods. There are two categories at the two-star level—one for computers and displays, and one for imaging equipment. EPEAT purchasers earn a star for each product category for which they have a policy in place and purchase EPEAT-registered electronics. EPEAT is a free and trusted source of environmental product ratings that help purchasers select high-performance electronics that meet their organizations’ IT and sustainability goals. Manufacturers register products based on the devices’ ability to meet various criteria developed and agreed upon by diverse stakeholders to address the full life cycle of an electronic product.
Figure 3.4. Pollution prevention recycling activities related to solid waste reduction at East Tennessee Technology Park in Calendar Year 2017
Additionally, UCOR internally recognized six projects for their P2/waste minimization (P2/WMin) accomplishments in 2017, which are summarized below.
• The EMWMF team was recognized for implementing a berm in Cell 6 covering part of the cell that is clean, to divert water from a portion of the waste cell when it opens in 2018. This action will avoid the creation of millions of gallons of projected leachate water that would have to be managed, mitigating adverse impacts on the environment, avoiding treatment and its associated transportation, and will provide $745,000 in savings annually.
• The ETTP Fleet Management and Operations and Real Estate Services organizations were recognized for the first addition of hybrid vehicles to its fleet. The increased mileage of the sedans is estimated to save 160 gal of fuel in the first year, avoiding 1,606 lb of CO2 emissions. There are plans to procure more such vehicles.
• The ORNL Nuclear and High Hazard Operations (NHHO) project identified and recycled 5,000 lb of lead that would otherwise have gone to a landfill. In addition, it saved $5,000 in disposal costs.
• The UCOR ETTP Reindustrialization, Business Assurance and Compliance, Decontamination & Demolition, and Environmental Remediation and Closure organizations and the K-1007 Local Site

Oak Ridge Reservation Annual Site Environmental Report—2017
East Tennessee Technology Park 3-7
Improvement Team Preparation, Institution, Listening and Learning Leads to Safety groups together harnessed a number of programs, to identify valuable glass cases for use, conserving landfill space, avoiding carpentry and virgin materials to build them and increasing work efficiencies by providing central locations for communications.
• The ORNL NHHO project worked with the Environmental Compliance Group to negotiate with regulators an alternate calculation that would avoid continually adding costly fans to increase stack flow to the 3039 Stack, as buildings continually go offline in 2018. This avoided $1.4 million in the first year alone.
• The UCOR ETTP Personal Property Management and Receiving and Disposition organizations recycled 600,690 lb of metal in FY 2017, saving landfill space, conserving virgin material, and generating $41,000 in revenues to go back into projects.
ETTP also continually strives to find new avenues for waste diversion. In 2016, a significant improvement in the diversion of scrap metal was made. In the course of demolition and environmental cleanup, one challenge has been the ability to divert large volumes of construction and demolition debris from disposal in landfills due to radiological contamination. However, despite the radiological challenge, a substantial amount of scrap metal located inside of Comprehensive Environmental Response, Compensation, and Liability Act of 1980 (CERCLA)-designated areas is still eligible for recycling because it is not radiologically contaminated. For the nonradiological areas, a second challenge was identified due to the CERCLA Offsite Rule that requires all disposal and recycle facilities receiving CERCLA waste be reviewed and approved by the EPA for acceptability. UCOR conducted a nationwide search for scrap metal recyclers that EPA had determined to be acceptable with the CERCLA Offsite Rule requirements all the way through the required smelter/foundry process step; however, none were located. Therefore, the only available option for disposal of the noncontaminated CERCLA scrap metal was land disposal.
In 2017 UCOR continued to work with EPA and the Tennessee Department of Environment and Conservation (TDEC) to apply the CERCLA screening process that allows noncontaminated scrap metal from CERCLA areas to be shipped to commercial scrap-metal dealers for recycle. Effectively, the screening process removes the noncontaminated scrap metal from regulation under CERCLA; therefore, any non-CERCLA commercial scrap-metal recyclers can receive the material for recycle. This unprecedented agreement allowed approximately an additional 181,200 lb (82 metric tons [MT] of scrap metal to be recycled in FY 2017 in lieu of land disposal and provides a path forward for additional waste diversion for the duration of the contract.
Some of the significant benefits of the scrap-metal recycling under this approval include:
• Provides funds from the recycling payments that are available to go back into the programs and support further actions in the Oak Ridge cleanup program.
• Conserves valuable landfill space. To date, the scrap-metal recycled as a result of the screening process has saved approximately 216 yd3 of valuable landfill space at an estimated cost savings of approximately $46,200, which takes into consideration capital cost, landfill capacity, historical operating costs, packing, and transportation.
• Supports EPA, TDEC, and DOE programmatic environmental stewardship goals for waste diversion.
The CERCLA screening process will continue to be used as more demolition and cleanup are continued at ETTP, ORNL, and Y-12.

Oak Ridge Reservation Annual Site Environmental Report—2017
East Tennessee Technology Park 3-8
In the area of alternative energy, Restoration Services, Inc. (RSI), in concert with UCOR, continued operations of ETTP’s first solar farm on the east end of the plant property. Brightfield 1 (Figure 3.5), as it is known, is a 200-kW solar array located on a 0.405-ha (1-acre) tract purchased from CROET and built by RSI as part of UCOR’s commitment to the revitalization of the former K-25 Site.
Figure 3.5. Brightfield 1 Solar Farm
RSI self-financed the project, using solar panels manufactured in Tennessee, and partnering with other local small businesses for the installation. Power generated from Brightfield 1 is being sold to the Tennessee Valley Authority (TVA) through the City of Oak Ridge Electric Department using a TVA Generation Partners contract. The completed project was commissioned in April 2012 and is part of RSI’s Brownfields to Brightfields (B2B) initiative that works to develop restricted use properties into solar farms. Brightfield 1 energy production in its first year was 110 percent more than projected, with no downtime due to maintenance issues. In calendar year (CY) 2017, Brightfield 1 produced approximately 250,000 kWh of energy.
In addition, through the cooperative efforts of DOE, UCOR, RSI, Vis Solis, Inc., CROET, and COR, a second solar farm—the Powerhouse 6 Solar Farm—was constructed on the west end of the park. It is a 1-MW solar farm that became operational in April 2015 and provides renewable energy, long-term lease income to CROET and boosters development at ETTP. This project provides numerous benefits to the environment and the community at large, and includes the following:
• Generates enough clean energy to power more than 100 homes. • Prevents pollution by removing the equivalent of 240 cars from the road annually (1,141 MT of
carbon dioxide). • Provides brownfield reuse/redevelopment at ETTP. • Supports the COR renewable energy goals. • Supports the TVA renewable energy initiative. • Offers community economic development jobs and property tax income to COR. • Demonstrates benefits of ETTP reindustrialization. • Supports DOE renewable energy goals.

Oak Ridge Reservation Annual Site Environmental Report—2017
East Tennessee Technology Park 3-9
• Demonstrates collaborative success between DOE and a public utility for renewable energy development.
UCOR also continued to use green products whenever possible and evaluated large quantity purchases for less toxic alternatives. In addition, UCOR maintained its extensive recycling program, which helps provide employment to beneficiaries of local charities who are employed by the local recycling facility for the county.
3.2.2 Environmental Compliance
UCOR maintains various layers of oversight to ensure compliance with legal and other requirements. The methods of evaluation include independent assessments by outside parties, management assessments conducted by functional or project organizations, and routine field walkdowns conducted by a variety of functional and project personnel. Management and independent assessments are performed in accordance with Management Assessment, PROC-PQ-1420, and Independent Assessment, PROC-PQ-1401. Assessments are scheduled on the UCOR Quality Assurance System (QAS) in accordance with PROC-PQ-1420. Records are maintained for all formal assessments and audits. Issues identified in assessments are handled, as required, by ISO 14001:2015, Section 4.5.3, “Nonconformity, Corrective Action, and Preventive Action” (ISO 2015).
3.2.3 Environmental Aspects/Impacts
Using a graded approach appropriate for EMS includes an environmental policy that provides a unified strategy for the management, conservation, and protection of natural resources; the control and attenuation of risks; and the establishment and attainment of all environment, safety, and health (ES&H) goals. UCOR works continuously to improve EMS to reduce impacts from activities and associated effects on the environment (i.e., environmental aspects) and to communicate and reinforce this policy to its internal and external stakeholders.
3.2.4 Environmental Performance Objectives and Targets
UCOR conserves and protects environmental resources by (1) incorporating environmental protection and the elements of an enabling EMS into the daily conduct of business; (2) fostering a spirit of cooperation with federal, state, and local regulatory agencies; and (3) using appropriate waste management, treatment, storage, and disposal methods.
The environmental performance objectives are to achieve zero unpermitted discharges to the environment; comply with all conditions of environmental permits, laws, regulations, and DOE orders; integrate EMS and environmental considerations as part of ISMS; and, to the extent practicable, reduce waste generation, prevent pollution, maximize recycle and reuse potential, and encourage environmentally preferable procurement of materials with recycled and bio-based content.
UCOR has established a set of core, corporate-level EMS objectives that remain relatively unchanged from year to year. These objectives are generally applicable to all operations and activities throughout UCOR’s work scope. The core environmental objectives are based on compliance with applicable legal requirements and sustainable environmental practices contained in DOE Order (O) 436.1, Departmental Sustainability (DOE 2011a), and include the following:
• Comply with all environmental regulations, permits, and regulatory agreements.

Oak Ridge Reservation Annual Site Environmental Report—2017
East Tennessee Technology Park 3-10
• Reduce or eliminate the acquisition, use, storage, generation, and/or release of toxic, hazardous, and radioactive materials; waste; and greenhouse gas emissions through acquisition of environmentally preferable products, conduct of operations, waste shipment, and P2/WMin and sustainable practices.
• Reduce degradation and depletion of environmental resources and potential impact on climate change through post-consumer material recycling, energy, fuel, and water conservation efforts, use or promotion of renewable energy, and transfer for reuse valuable real estate assets.
3.2.5 Implementation and Operations
UCOR protects the safety and health of workers and the public by identifying, analyzing, and mitigating aspects, hazards, and impacts from ETTP operations, and by implementing sound work practices. All UCOR employees and subcontractors are held responsible for complying with all ES&H requirements during all work activities and are expected to correct noncompliant conditions immediately. UCOR’s internal management assessments also provide a measure of how well EMS attributes are integrated into work activities through ISMS. UCOR has embodied its program for EC&P of natural resources in a companywide EM and protection policy. The policy is UCOR’s fundamental commitment to incorporating sound EM practices in all work processes and activities.
3.2.6 Pollution Prevention/Waste Minimization
UCOR’s work control process requires that all waste-generating activities be evaluated for source reduction and that product substitution be used to produce less toxic waste, when possible. The reuse or recycling of building debris or other wastes generated is evaluated in all cases.
The ETTP EMS program fosters P2 at every level of its operations, from routine office recycling of paper, cardboard and plastics, to unique reuse and recycling at the project-field level. UCOR’s P2 program is successful because it is tightly bound to its work control process. Thus many original applications of material reuse and recycling have resulted, many of which have been captured through its internal P2 awards program.
Total cost savings and avoidance associated with these projects were in excess of $2.1 million and resulted in conserving valuable landfill space, and resources, as well as mitigating water contamination, and greenhouse gas emissions. The internal awards will be evaluated for nomination in national-level awards (e.g., DOE Headquarters annual award program).
3.2.7 Competence, Training, and Awareness
The UCOR training and qualification process ensures that needed skills for the workforce are identified and developed. The process also documents knowledge, experience, abilities, and competencies of the workforce for key positions requiring qualification. This process is described in PROC-TC-0702, Training Program. Completion and documentation of training, including required reading, are managed by the Local Education Administration Requirements Network (LEARN).
3.2.8 Communication
UCOR communicates externally regarding environmental aspects through the UCOR public website, which includes a link to its environmental policy statement in Environmental Management and Protection, POL-UCOR-007; a list of environmental aspects; and a link to the Integrated Safety Management System Description, PPD-EH-1400.

Oak Ridge Reservation Annual Site Environmental Report—2017
East Tennessee Technology Park 3-11
A number of other documents and reports that address environmental aspects and cleanup progress are also published and made available to the public (e.g., the Annual Site Environmental Report [ASER] [DOE 2016, DOE/ORO-251] and the annual cleanup progress report [UCOR 2017b, 2017 Cleanup Progress—Annual Report to the Oak Ridge Regional Community, OREM-17-2530]).
UCOR participates in a number of public meetings related to environmental activities at the site (e.g., Oak Ridge Site Specific Advisory Board [ORSSAB] meetings, which include community stakeholders, public permit reviews, and public CERCLA decision document reviews). Written communications from external parties are tracked using the weekly Open Action Report.
3.2.9 Benefits and Successes of Environmental Management System Implementation
An EMS program provides many benefits to an organization’s success. Based upon the simplified model of Do-Act-Check, it provides a framework by which work incorporates environmental hazards into its work control and planning. This translates into many returns to the organization. UCOR uses EMS objectives and targets, an internal P2 recognition program, environmentally preferable purchasing, work control processes, and a recycle program to meet sustainability and stewardship goals and requirements. The approach is outlined in UCOR’s Pollution Prevention and Waste Minimization Program Plan for the East Tennessee Technology Park, Oak Ridge, Tennessee (UCOR 2018, UCOR-4127/R6). The EMS program is audited by a third party triennially by EO 13423, Strengthening Federal Environmental, Energy, and Transportation Management (EO 13423), for conformance to the ISO 14001:2015 standard, with the most recent having been conducted in 2015. The results of the audit were zero Findings, two Observations, and four Proficiencies.
3.2.10 Management Review
Senior management review of EMS is performed at several layers and frequencies. A formal review/presentation with UCOR senior management that addresses the requirement elements contained in this section is conducted at least once per year. At least two of the senior managers are present for management reviews. The ISMS description is updated annually to address improvements and lessons learned and to update objectives and targets as necessary and signed by the UCOR president and project manager. The environmental policy is also reviewed during the management review annually and revised as necessary.
3.3 Compliance Programs and Status During 2017, ETTP operations were conducted in compliance with contractual and regulatory environmental requirements. There was one National Pollutant Discharge Elimination System (NPDES) permit noncompliance and no Clean Air Act (CAA) noncompliances. Figure 3.6 shows the trend of NPDES compliance at ETTP since 1999. The following sections provide more detail on each compliance program and the environmental remediation-related activities in 2017.

Oak Ridge Reservation Annual Site Environmental Report—2017
East Tennessee Technology Park 3-12
Figure 3.6. East Tennessee Technology Park National Pollutant Discharge Elimination System permit
noncompliances since 1999
3.3.1 Environmental Permits
Table 3.1 contains a list of environmental permits that were in effect at ETTP in 2017.
3.3.2 Notices of Violation and Penalties
ETTP received no notices of environmental violations or penalties in 2017.
3.3.3 Audits and Oversight
Table 3.2 presents a summary of environmental audits and oversight visits conducted at ETTP in 2017.

Oak Ridge Reservation Annual Site Environmental Report—2017
East Tennessee Technology Park 3-13
Table 3.1. East Tennessee Technology Park environmental permits, 2017
Regulatory driver Permit title/description Permit number Issue date Expiration date Owner Operator Responsible
contractor CAA State permit to operate an air
contaminant source—internal combustion engine–powered emergency generators and fire water pump
069346P 03-03-2015 Amended
11-22-2016
10-01-2024 DOEa UCOR UCOR
CWA NPDES permit for storm water discharges
TN0002950 02-01-2015 03-31-2020 DOE UCOR UCOR
CWA SOP—waste transportation project; Blair Road and Portal 6 sewage pump and haul permit
SOP-05068 07-01-2014 02-28-2019 DOE TFE TFE
CWA SOP—ETTP holding tank/haul system for domestic wastewater
SOP-99033 07-01-2015 06-30-2020 UCOR UCOR UCOR
UST Authorized/certified USTs at K-1414 Garage
Customer ID 30166 Facility ID
073008
03-20-1989 Ongoing DOE UCOR UCOR
RCRA ETTP container storage and treatment units
TNHW-165 09-15-2015 09-15-2025 DOE UCOR UCOR
RCRA Hazardous waste corrective action document (encompasses entire ORR)
TNHW-164 09-15-2015 09-15-2025 DOE DOE/Alla DOE/Alla
a DOE and ORR contractors that are co-operators of hazardous waste permits.
Acronyms CAA = Clean Air Act CWA = Clean Water Act DOE = US Department of Energy ETTP = East Tennessee Technology Park ID = identification (number) NPDES = National Pollutant Discharge Elimination System ORR = Oak Ridge Reservation
RCRA = Resource Conservation and Recovery Act SOP = state operating permit TFE = Technical and Field Engineering, Inc. UCOR = URS | CH2M Oak Ridge LLC UST = underground storage tank

Oak Ridge Reservation Annual Site Environmental Report—2017
East Tennessee Technology Park 3-14
Table 3.2. Regulatory oversight, assessments, inspections, and site visits at East Tennessee Technology Park, 2017
Date Reviewer Subject Issues February 27 TDEC Annual RCRA Compliance Inspection 0 October COR Sewage Manhole Radiologic Inspection 0
November COR Visit to discuss radiologic discharges to the Rarity Ridge Collection System 0
COR = City of Oak Ridge RCRA = Resource Conservation and Recovery Act TDEC = Tennessee Department of Environment and Conservation
3.3.4 National Environmental Policy Act/National Historic Preservation Act
The National Environmental Policy Act (NEPA) provides a means to evaluate the potential environmental impact of proposed federal activities and to examine alternatives to those actions. ETTP maintains compliance with NEPA through the use of site-level procedures and program descriptions that establish effective and responsive communications with program managers and project engineers to ensure NEPA is a key consideration in the formative stages of project planning. Many of the current operations at ETTP are conducted under CERCLA. NEPA reviews are part of the CERCLA planning process to ensure that NEPA values are incorporated into CERCLA projects and documentation.
During 2017, ETTP continued to operate under site-level, site-specific procedures that provide requirements for project reviews and NEPA compliance. These procedures call for a review of each proposed project, activity, or facility to determine the potential for impacts on the environment. To streamline the NEPA review and documentation process, DOE Oak Ridge Office (ORO) has approved generic categorical exclusion (CX) determinations that cover certain proposed activities (i.e., maintenance activities, facility upgrades, personnel safety enhancements). A CX is one of a category of actions defined in 40 Code of Federal Regulations (CFR) Part 1508.4 that does not individually or cumulatively have a significant effect on the human environment and for which neither an environmental assessment nor an environmental impact statement is normally required. UCOR activities on the ORR are in full compliance with NEPA requirements, and procedures for implementing NEPA requirements have been fully developed and implemented. At ETTP, a checklist incorporating NEPA and EMS requirements has been developed as an aid for project planners. For routine, recurring activities, DOE generic CX determinations are used. During 2017, no new CX determinations for activities at ETTP were issued by DOE.
Compliance with the National Historic Preservation Act (NHPA) at ETTP is achieved and maintained in conjunction with NEPA compliance. The scope of proposed actions is reviewed in accordance with the ORR cultural resource management plan (Souza et al. 2001). At ETTP, there were 135 facilities eligible for inclusion on the National Register of Historic Places (NRHP), a National Park Service (NPS) program to identify, evaluate, and protect historic and archeological resources in the United States, as well as numerous facilities that were not eligible for inclusion on NRHP. To date, more than 800 facilities have been demolished. Artifacts of historical and/or cultural significance are identified before demolition and are catalogued in a database to aid in the historic interpretation of ETTP.
Consultation for the development of an MOA for D&D of the K-25 and K-27 buildings started in 2001; the document, approved in 2003, required a third-party analysis of the preservation and interpretive strategies for those two buildings. In 2005, DOE, the Tennessee State Historic Preservation Office (SHPO), and the Advisory Council on Historic Preservation (ACHP) entered into an MOA that included the retention of the north end tower (also known as north wing and north end) of the K-25 building and

Oak Ridge Reservation Annual Site Environmental Report—2017
East Tennessee Technology Park 3-15
Portal 4 (K-1028-45), among other features, as the “best and most cost-effective mitigation to
permanently commemorate, interpret, and preserve the significance” of ETTP. Another series of consultation meetings ensued in 2009 and DOE advised that prohibitive costs and safety considerations precluded fulfillment of three stipulations in the 2005 MOA, including the preservation of the north end tower. The parties offered a wide array of potential mitigation measures and, in the absence of consensus on how best to commemorate Building K-25, DOE, SHPO, and ACHP entered into a bridge MOA until the parties could reach a final agreement. After completing an evaluation of the structural integrity of the K-25 building and interpretative approaches for the site, DOE distributed a preferred mitigation plan to the consulting parties in October 2011. The DOE final mitigation plan, which addressed comments submitted by consulting parties in November 2011, permitted demolition of the entire K-25 building and called for, among other mitigation measures, the designation of a commemorative area around the building’s perimeter from which future surface development would largely be restricted; the retention, if possible, of the entire concrete slab or the demarcation of the building’s footprint; the construction of a viewing tower and structure for equipment display; and the development of a history center within the ETTP Fire Station. A final MOA was signed in August 2012, finalizing the aspects set forth in the mitigation plan. During 2013, a request for proposal was issued for a “Professional Design Team and Museum Professional,” as specified in the MOA. Nine firms were prequalified, and the selection and awards were executed April 1, 2014. The procurement process for the K-25 “virtual museum” web design firm was also begun in 2013 and awarded September 2, 2014.
On December 14, 2014, Congress authorized the establishment of the Manhattan Project National Historical Park to commemorate the history of the Manhattan Project (DOI 2015). It will comprise the three major sites: Los Alamos, New Mexico; Oak Ridge, Tennessee; and Hanford, Washington, which were dedicated to accomplishing the Manhattan Project mission.
The Memorandum of Agreement Between the United States Department of the Interior and the United States Department of Energy for the Manhattan Project National Historical Park was signed by DOI and DOE on November 10, 2015 (DOE 2015), creating the new Manhattan Project National Historical Park. The K-25 Virtual Museum website (K-25 Virtual Museum) was launched in conjunction with the signing of the MOA.
The Museum Preliminary Design Report was completed and provided to the Consulting Parties in July 2016. The Consulting Parties reviewed the report and plans and provided comments. The Final Design Plan was completed and sent to the consulting parties for review in January 2017. Comments from the consulting parties were received and incorporated into the Certified for Construction design package and a request for proposal was issued for construction, exhibit fabrication, and installation activities for the K-25 History Center.
At the heart of the gaseous diffusion process is a porous, metallic membrane called the barrier. In December 1947, when barrier construction was transferred to the K-25 Site, the 662 warehouse was converted into the barrier manufacturing facility and designated K-1037. Beginning in 1947, K-1037 was the only facility in the United States capable of producing barrier material. The Historic American Engineering Record (HAER) documentation for K-1037 Barrier Plant was completed and approved by the NPS in May 2017. The HAER documentation for the K-25 building is being prepared for transmittal to the NPS.
3.3.5 Clean Air Act Compliance Status
The CAA, passed in 1970 and amended in 1977 and 1990, forms the basis for the national air pollution control effort. This legislation establishes comprehensive federal and state regulations to limit air emissions and includes five major regulatory programs: the National Ambient Air Quality Standards

Oak Ridge Reservation Annual Site Environmental Report—2017
East Tennessee Technology Park 3-16
(NAAQS), State Implementation Plans (SIPs), New Source Performance Standards (NSPSs), Prevention
of Significant Deterioration permitting programs, and National Emission Standards for Hazardous Air Pollutants (NESHAPs). Airborne discharges from DOE Oak Ridge facilities, both radioactive and nonradioactive, are subject to regulation by EPA and the TDEC Division of Air Pollution Control.
Full compliance with CAA regulations and permit conditions was demonstrated in 2017. The ETTP ambient air-monitoring program, permitted source operations tracking, and record keeping provided documentation fully supporting a 100 percent compliance rate.
3.3.6 Clean Water Act Compliance Status
The objective of the Clean Water Act (CWA) is to restore, maintain, and protect the integrity of the nation’s waters. This act serves as the basis for comprehensive federal and state programs to protect the waters from pollutants (see Appendix C for water reference standards). One of the strategies developed to achieve the goals of CWA was EPA establishment of limits on specific pollutants allowed to be discharged in US waters by municipal sewage treatment plants (STPs) and industrial facilities. EPA established the NPDES permitting program to regulate compliance with pollutant limitations. The program was designed to protect surface waters by limiting effluent discharges into streams, reservoirs, wetlands, and other surface waters. EPA has delegated authority for implementation and enforcement of the NPDES program to the state of Tennessee. In 2017, ETTP discharged storm water to the waters of the state of Tennessee under the individual NPDES permit TN0002950, which regulates storm water discharges.
In 2017, sewage discharges from routine breakrooms, restrooms, and change house showers were discharged to the COR Rarity Ridge Wastewater Treatment Plant collection network and sewage holding tanks under Permits SOP-05068 and SOP-99033.
3.3.7 National Pollutant Discharge Elimination System Permit Noncompliances
In 2017, compliance with ETTP NPDES storm water permit TN0002950 was determined by more than 150 laboratory analyses, field measurements, and flow estimates. The NPDES permit compliance rate for all discharge points for 2017 was greater than 99 percent. There was one noncompliance in 2017. Sanitary wastewater from a bathroom and shower facility (K-2527-T) is routed to a 1,100-gal capacity aboveground poly tank for storage until it is pumped out by a sewage pumping subcontractor. On June 12, 2017, the sanitary wastewater was discovered to have overtopped this storage tank and filled the associated secondary containment dike. The water then flowed over a concrete surface into a storm drain catch basin. This catch basin is connected to the Storm Water Outfall 210 drainage system, which discharges into Mitchell Branch. The volume of sanitary wastewater that entered the storm drain inlet could not be accurately determined. The contents of the tank had been pumped out on June 9, 2017. Since a limited staff was working during the period from June 9, 2017, through the morning of June 12, 2017, it is likely that the vast majority of the water released was chlorinated potable water. Visual observation of Outfall 210 conducted on June 12, 2017, showed that the outfall was dry. Therefore, it is likely that no wastewater from the overflow reached Mitchell Branch. This event was determined to be a noncompliance with the ETTP NPDES permit (permit no. TN0002950) due to an unpermitted discharge of wastewater to the storm drain system. It is also considered to be a violation of State Operating Permit (SOP) SOP-99033, and was reported to TDEC in the quarterly operations report. No adverse impact on fish or other aquatic life occurred as a result of this event.

Oak Ridge Reservation Annual Site Environmental Report—2017
East Tennessee Technology Park 3-17
3.3.8 Safe Drinking Water Act Compliance Status
Since October 1, 2014, all water at the ETTP site is supplied by the COR drinking water plant, located north of the Y-12 Complex in Oak Ridge, Tennessee.
3.3.9 Resource Conservation and Recovery Act Compliance Status
ETTP is regulated as a large-quantity generator of hazardous waste because the facility generates more than 1,000 kg of hazardous waste per month. This amount includes hazardous waste generated under permitted activities (including repackaging or treatment residuals). At the end of 2017, ETTP had three generator accumulation areas for hazardous or mixed waste.
In addition, ETTP is permitted to store and treat hazardous and mixed waste under the Resource Conservation and Recovery Act (RCRA) Part B Permit TNHW-165. Hazardous waste may be treated and stored at permitted locations at the K-1065 complex. This hazardous waste permit was reissued on September 15, 2015, as a replacement for TNHW-117. The hazardous waste corrective action document, TNHW-164, which covers the ORR areas of concern and solid waste management units, was also reissued on September 15, 2015, as a replacement for TNHW-121.
In CY 2017, ETTP prepared and submitted to the TDEC Division of Solid Waste Management the CY 2016 annual report of hazardous waste activities. This report identifies the type and amount of hazardous waste that was generated, shipped offsite, or is currently in storage.
3.3.10 Resource Conservation and Recovery Act Underground Storage Tanks
Underground storage tanks (USTs) containing petroleum and hazardous substances are regulated under RCRA Subtitle I (40 CFR 280). EPA granted TDEC authority to regulate USTs containing petroleum under TDEC Rule 0400-18-01, Underground Storage Tank Program; however, EPA still regulates hazardous substance USTs. During 2017, operations of the two USTs at ETTP were in complete regulatory compliance.
3.3.11 Comprehensive Environmental Response, Compensation, and Liability Act Compliance Status
CERCLA, also known as “Superfund,” was passed in 1980 and was amended in 1986 by the Superfund Amendments and Reauthorization Act (SARA). Under CERCLA, a site is investigated and remediated if it poses significant risk to health or the environment. The EPA National Priorities List (NPL) is a comprehensive list of sites and facilities that have been found to pose a sufficient threat to human health and/or the environment to warrant cleanup under CERCLA. ORR is on the NPL and numerous CERCLA decision documents are approved for ETTP site cleanup actions for both facility demolitions and soil remediation.
3.3.12 East Tennessee Technology Park RCRA-CERCLA Coordination
The Federal Facility Agreement for the Oak Ridge Reservation (FFA, DOE 2017, DOE/OR-1014) is intended to coordinate the corrective action processes of RCRA required under the Hazardous and Solid Waste Amendments permit with CERCLA response actions.

Oak Ridge Reservation Annual Site Environmental Report—2017
East Tennessee Technology Park 3-18
3.3.13 Toxic Substances Control Act Compliance Status—Polychlorinated
Biphenyls
On April 3, 1990, DOE notified EPA headquarters (as required by 40 CFR 761.205) that ETTP is a generator with onsite storage, a transporter, and an approved disposer of polychlorinated biphenyl (PCB) wastes. ETTP is no longer a disposer of PCBs since the Toxic Substances Control Act (TSCA) Incinerator’s hazardous waste management permit TNHW-015 was terminated on September 21, 2012.
PCB waste generation, transportation, disposal, and storage at ETTP is regulated under EPA ID number TN0890090004. In 2017, ETTP operated five PCB waste storage areas in ETTP generator buildings, and when longer term storage of PCB/radioactive wastes were necessary, RCRA-permitted storage buildings were used. These facilities were operated under 40 CFR 761.65(b)(2)(iii), which allows PCB storage permitted by the state authorized under Section 3006 of RCRA to manage hazardous waste in containers, and spills of PCBs are cleaned up in accordance with Subpart G of this part. During 2017, the K-1423 Repacking Facility, which was once used for PCB storage and was in standby status, was officially closed. ETTP operated one long-term PCB waste storage area at ETTP where nonradioactive PCB waste was stored in a facility that was not a RCRA-permitted storage facility. The continued use of authorized PCBs in electrical systems and/or equipment (e.g., transformers, capacitors, rectifiers) is regulated at ETTP. At this time, no PCB-contaminated electrical equipment is in service at ETTP. Most TSCA-regulated equipment at ETTP has been disposed of. However, some ETTP facilities continue to use or store non-electrical PCB-contaminated equipment for future reuse.
Because of the age of many ETTP facilities and the varied uses for PCBs in gaskets, grease, building materials, and equipment, DOE self-disclosed unauthorized use of PCBs to EPA in the late 1980s. As a result, DOE ORO and EPA Region 4 consummated a major compliance agreement known as the Oak Ridge Reservation Polychlorinated Biphenyl Federal Facilities Compliance Agreement (DOE 2012, ORR-PCB-FFCA), which became effective December 16, 1996, and was last revised on May 23, 2012, to Revision 5. The modification in 2012 incorporated institutional controls at the TSCA Incinerator where limited areas of contamination remained in place at the facility after the facility closure actions were completed. The institutional controls will remain in place until future PCB cleanup actions, which will be addressed during CERCLA demolition actions.
The ORR-PCB-FFCA specifically addresses the unauthorized use of PCBs in ventilation ducts and gaskets, lubricants, hydraulic systems, heat transfer systems, and other unauthorized uses; storage for disposal; disposal; cleanup and/or decontamination of PCBs and PCB items, including PCBs mixed with radioactive materials; and ORR records and reporting requirements. A major focus of the agreement is the disposal of PCB waste. As a result of that agreement, DOE and UCOR continue to notify EPA when additional unauthorized uses of PCBs, such as in paint, adhesives, electrical wiring, or floor tile, are identified at ETTP. This notification process is routinely incorporated into the CERCLA documentation for demolition and remedial actions (RAs).
The ETTP site prepares a PCB Annual Document Log (PCBADL) each year per 40 CFR 761.180(a). The written PCBADL is prepared by July 1 of each year and covers the previous CY. The PCBADL documents such things as container inventory, shipments, and PCB spills at the facility. Authorized representatives of EPA may inspect the PCBADL at the facility where they are maintained during normal business hours. The PCBADL must be maintained onsite for a minimum of 3 years.
Oak Ridge Reservation Annual Site Environmental Report—2017
East Tennessee Technology Park 3-19
3.3.14 Emergency Planning and Community Right-to-Know Act Compliance
Status
The Emergency Planning and Community Right-to-Know Act (EPCRA) that is also identified as Title III of SARA requires that facilities report inventories that exceed threshold planning quantities and releases of hazardous and toxic chemicals. The reports are submitted electronically and are available online for the local emergency planning committee, the state emergency response commission, and the local fire department. ETTP complied with these requirements in 2017 through the submittal of required reports as applicable under EPCRA Sections 302, 311, 312, and 313. ETTP had no reportable releases of hazardous substances or extremely hazardous substances, as defined by EPCRA, in 2017.
3.3.14.1 Chemical Inventories (EPCRA Section 312) Inventories, locations, and associated hazards of hazardous and extremely hazardous chemicals were submitted in an annual report to state and local emergency responders, as required by EPCRA Section 312. Of the ORR chemicals identified for 2017, 13 were located at ETTP. These chemicals were nickel metal, lead metal (including large lead acid batteries), sodium metal, diesel fuel, sulfuric acid (including large lead acid batteries), Chemical Specialties Ultrapoles, creosote-treated wood, unleaded gasoline, Sakrete Type S or N mortar mix, Portland cement, CCA Type C pressure-treated wood, Flexterra FGM erosion control agent, and sodium chloride.
3.3.14.2 Toxic Chemical Release Reporting (EPCRA Section 313) EPCRA Section 313 requires facilities to complete and submit a toxic chemical release inventory (TRI) form (Form R) annually. Form R must be submitted for each TRI chemical that is manufactured, processed, or otherwise used in quantities above the applicable threshold quantity. The reports address releases of certain toxic chemicals to air, water, land, and waste management, recycling, and P2 activities. Threshold determinations and reports for each of the ORR facilities are made separately. Operations involving TRI chemicals were compared with regulatory thresholds to determine which chemicals exceeded the reporting thresholds based on amounts manufactured, processed, or otherwise used at each facility. After threshold determinations were made, releases and offsite transfers were calculated for each chemical that exceeded the threshold quantity. In 2017, the only chemicals that met the reporting requirements were diisocyanates associated with foaming activity to stabilize deposits in pipes undergoing remediation actions.
3.4 Quality Assurance Program
3.4.1 Integrated Assessment and Oversight Program
Quality assurance (QA) program implementation and procedural and subcontract compliance are verified through the UCOR integrated assessment and oversight program. The program identifies the processes for planning, conducting, and coordinating assessment and oversight of UCOR activities, including both self-performed and subcontracted activities, resulting in an integrated assessment and oversight process. The program is composed of three key elements (1) external assessments conducted by organizations external to UCOR, (2) independent assessments conducted by teams independently of the project/function being assessed, and (3) management assessments and surveillances conducted as self-assessments and surveillances by the organization or on behalf of the organization manager.
Self-assessments are performed by the organization/function with primary responsibility for the work, process, or system being assessed. Organizations and functions within the company plan and schedule self-assessments. Self-assessments encompass both formal and informal assessments. The formal self-

Oak Ridge Reservation Annual Site Environmental Report—2017
East Tennessee Technology Park 3-20
assessments include management assessments and surveillances, and subcontractor oversight. Informal
self-assessments include weekly inspections and routine walkthroughs conducted by subcontractor coordinators, ES&H and QA representatives, quality engineers, and line managers.
Conditions adverse to quality identified from internal and external assessments are documented, causal analyses are performed, and corrective actions are developed and tracked to closure. Analyses are conducted periodically to identify trends for management action. Senior management evaluates data from those processes to identify opportunities for improvement.
3.5 Air Quality Program The state of Tennessee has been delegated authority by EPA to convey the clean air requirements that are applicable to ETTP operations. New projects are governed by construction and operating permit regulatory requirements. The owner or operator of air pollutant emitting sources is responsible for ensuring full compliance with any issued permit or other generally applicable CAA requirement. During 2017, ETTP DOE EM operations were under UCOR responsibility for regulatory compliance.
3.5.1 Construction and Operating Permits
UCOR ETTP operations are subject to CAA regulations and permitting under TDEC Air Pollution Control rules that are specific to stationary fossil-fueled reciprocating internal combustion engines (RICE) for emergency use. TDEC originally issued an operating permit (069346P) covering six RICE units on March 3, 2015. An amended permit was issued on November 22, 2016, that removed one permanently shut down unit. The current operating permit was amended on November 22, 2016, and covers four RICE emergency generators and one RICE emergency firewater booster pump. Three generators have diesel-fueled engines, one generator has a natural gas-fueled engine, and the firewater booster pump engine is diesel fueled.
Compliance for all units is demonstrated by following specified maintenance schedules, limiting hours of operations for nonemergencies to 100 h per year, and record keeping. Regulations exempt any operating hours of these units during nonscheduled (emergency) power outages. All other ETTP operations that emit low levels of air pollutants have been classified as insignificant under TDEC rules. Any planned stationary sources that may emit air pollutants are evaluated and compared against applicable pollutant emission limits to document this classification and pursue permitting if required under TDEC regulations.
3.5.1.1 Generally Applicable Permit Requirements ETTP is subject to a number of generally applicable requirements that involve management and control. Asbestos, ozone-depleting substances (ODSs), and fugitive particulate emissions are specific examples.
Control of Asbestos ETTP’s asbestos management program ensures all activities involving demolitions and all other actions impacting asbestos-containing materials (ACM) are fully compliant with 40 CFR 61, Subpart M, National Emission Standards for Hazardous Air Pollutants, “National Emission Standard for Asbestos.” This includes using approved engineering controls and work practices, inspections, and monitoring for proper removal and waste disposal of ACM. ETTP has numerous buildings and equipment that contain ACMs. Major demolition activities during 2017 involved the abatement of ACM that were subject to the requirements of 40 CFR Part 61, Subpart M. Most demolition and ACM abatement activities are governed under CERCLA. Under this act, notifications of asbestos demolition or renovations, as specified in 40 CFR Part 61.145(b), are incorporated into CERCLA document regulatory notifications. All other non-CERCLA planned demolition or renovation activities were individually reviewed for applicability of the TDEC

Oak Ridge Reservation Annual Site Environmental Report—2017
East Tennessee Technology Park 3-21
notification requirements of the rule. During 2017, only one Notification of Demolition and/or Asbestos
Renovation submittals to TDEC was submitted for non-CERCLA ETTP activities. That notice involved non-asbestos demolition. The rule also requires an annual notification for all nonscheduled, minor asbestos renovations if the accumulated total amount of regulated or potentially regulated asbestos exceeds stipulated thresholds. For 2017, the total ETTP projected nonscheduled amounts were below thresholds that would require the submittal of an annual notification to TDEC. No releases of reportable quantities of ACM occurred at ETTP during 2017.
Stratospheric Ozone Protection The management of ODSs at ETTP is subject to regulations in 40 CFR Part 82, Subpart F, Recycling and Emissions Reduction; these regulations require preparation of documentation to establish that actions necessary to reduce emissions of Class I and Class II refrigerants to the lowest achievable level have been observed during maintenance activities at ETTP. The applicable actions include, but may not be limited to, the service, maintenance, repair, and disposal of appliances containing Class I and Class II refrigerants, such as motor vehicle air conditioners. In addition, the regulations apply to refrigerant reclamation activities, appliance owners, manufacturers of appliances, and recycling and recovery equipment. Figure 3.7 illustrates the historical onsite ODS inventory at ETTP.
Figure 3.7. East Tennessee Technology Park total onsite ozone-depleting substances inventory,
10-year history
3.5.1.2 Fugitive Particulate Emissions ETTP has been the location of major building demolition activities, soil remediation activities, and waste debris transportation with the potential for the release of fugitive dust. All planned and ongoing activities include the use of dust control measures to minimize the release of visible fugitive dust beyond the project perimeter. This includes the use of specialized demolition equipment and water misters. Gravel roads in and around ETTP that are under DOE control are wetted with water, as needed, to minimize airborne dusts caused by vehicle traffic.
3.5.1.3 Radionuclide National Emission Standards for Hazardous Air Pollutants Radionuclide airborne emissions from ETTP are regulated under 40 CFR Part 61, National Emission Standards for Hazardous Air Pollutants (Rad-NESHAP). Characterization of the impact on public health of radionuclides released to the atmosphere from ETTP operations was accomplished by conservatively estimating the dose to the maximally exposed member of the public. The dose calculations were

Oak Ridge Reservation Annual Site Environmental Report—2017
East Tennessee Technology Park 3-22
performed using the Clean Air Assessment Package (CAP-88) computer codes, which were developed
under EPA sponsorship for use in demonstrating compliance with the 10 mrem/year effective dose (ED) Rad-NESHAP emission standard for the entire DOE ORR. Source emissions used to calculate the dose are determined using EPA-approved methods that can range from continuous sampling systems to conservative estimations based on process and waste characteristics. Continuous sampling systems are required for radionuclide-emitting sources that have a potential dose impact of not less than 0.1 mrem per year to any member of the public. ETTP Rad-NESHAP sources that operated during 2017—the K-1407 Chromium Water Treatment System (CWTS) Volatile Organic Compound (VOC) Air Stripper and K-2500-H Segmentation Shop C—are considered minor based on emissions evaluations using EPA-approved calculation methods. A minor Rad-NESHAP source is defined as having a potential dose impact on the public that is less than 0.1 mrem/year. Compliance is demonstrated using data collected by the ETTP ambient air monitoring program described in Section 3.5.2.
Quarterly radiochemical analyses are performed on composited samples collected at all ETTP ambient air sampling stations. The selected isotopes of interest were 234U, 235U, and 238U with the 99Tc inorganic analysis results included as a dose contributor. The concentration and dose results for each of the nuclides are presented in Table 3.3 for the 2017 reporting period.
Table 3.3. Radionuclides in ambient air at East Tennessee Technology Park, January 2017 through December 2017
Station Concentration (µCi/mL)
99Tc 234U 235U 238U K2a NDb 1.12E-18 7.55E-19 1.68E-18 K6ac ND ND ND 1.03E-17 K11d 2.66E-17 1.24E-18 6.95E-19 8.20E-18 K12d 6.20E-17 5.84E-18 1.32E-18 1.39E-17
40 CFR 61, Effective Dose (mrem/year) Total Dose K2 ND < 0.001 < 0.001 < 0.001 < 0.001 K6 ND ND ND < 0.001 < 0.001
K11 < 0.001 < 0.001 < 0.001 < 0.001 0.001 K12 0.001 < 0.001 < 0.001 0.001 0.002
a K2 and K6 results represent a residential exposure. b ND = not detectable. c K6 was permanently shut down at the end of June 2017. d K11 and K12 represent an onsite business exposure equivalent to half of a yearly exposure at this location.
Figure 3.8 provides a historical dose trend for the most impacted onsite member of the public if they were located at any of the three sampling locations. Each data point represents the accumulated dose over the previous four quarterly sampling periods. Stations K11 and K12 are near onsite businesses, therefore the estimated doses based upon residential exposures were divided by 2 to account for occupational exposures following approved procedures. This conservatively assumes that the onsite member of the public is at his or her workstation for half of the year.
During 2017, the onsite dose decreased as major demolition and debris removal activities were completed. The highest annual dose impact as measured at the ambient air station K12 was only 0.002 mrem as compared to the annual limit of 10 mrem. The onsite location of K12 was in close proximity to major demolition and debris removal activities that impacted radiologically contaminated materials. The major dose contributors at K12 were 99Tc (46.1 percent) and 238U (33.6 percent). The results are based on actual ambient air sampling in a location conservatively representative of onsite

Oak Ridge Reservation Annual Site Environmental Report—2017
East Tennessee Technology Park 3-23
business locations. All data continue to show potential exposures are all well below the 10 mrem annual
dose limit.
DOE = US Department of Energy and ORR = Oak Ridge Reservation
Figure 3.8. East Tennessee Technology Park ambient air stations K11 and K12 radionuclide monitoring results: 5-year rolling 12-month dose history up through 2017
3.5.1.4 Quality Assurance QA activities for the Rad-NESHAP program are documented in the Quality Assurance Program Plan for Compliance with Radionuclide National Emission Standards for Hazardous Air Pollutants, East Tennessee Technology Park, Oak Ridge Tennessee (UCOR 2015b, UCOR-4257). The plan satisfies the QA requirements in 40 CFR Part 61, Method 114, for ensuring that the radionuclide air emission measurements from ETTP are representative of known levels of precision and accuracy and that administrative controls (ACs) are in place to ensure prompt response when emission measurements indicate an increase over normal radionuclide emissions. The requirements are also referenced in TDEC regulation 1200-3-11-08, Emission Standards for Emissions of Radionuclides Other Than Radon From Department of Energy Facilities. The plan ensures the quality of ETTP radionuclide emission measurement data from continuous samplers and minor radionuclide release points. Only EPA preapproved methods are referenced through the Compliance Plan National Emission Standards for Hazardous Air Pollutants for Airborne Radionuclides on the Oak Ridge Reservation, Oak Ridge, Tennessee (DOE/ORO/2196).
3.5.1.5 Greenhouse Gas Emissions The EPA rule for mandatory reporting of Greenhouse Gases (GHGs) (also referred to as the “Greenhouse Gas Reporting Program”) was enacted October 30, 2009, under 40 CFR Part 98. According to the rule in general, the stationary source emissions threshold for reporting is 25,000 MT of CO2 equivalent (CO2e) or more of GHGs per year. The rule defines GHGs as:
• Carbon dioxide (CO2) • Methane (CH4) • Nitrous oxide (N2O) • Hydrofluorocarbons

Oak Ridge Reservation Annual Site Environmental Report—2017
East Tennessee Technology Park 3-24
• Perfluorocarbons • Sulfur hexafluoride (SF6)
A 2017 review was performed of ETTP processes and equipment categorically identified under 40 CFR 98.2 whose emissions must be included as part of a facility annual GHG report starting with the CY 2010 reporting period. Based on total GHG emissions from all ETTP stationary sources during 2017, ETTP did not exceed the annual threshold limit and therefore was not subject to mandatory annual reporting under the GHG rule during this performance period. The total GHG emissions for any continuous 12-month period beginning with CY 2008 have not exceeded 12,390 MT of GHGs. The most significant decrease in stationary source emissions was due to the permanent shutdown of the TSCA Incinerator in 2009. The remaining sources are predominantly small comfort heating systems, hot water systems, and power generators. Figure 3.9 shows the 5-year trend up through 2017 of ETTP total GHG stationary emissions. For the 2017 CY, GHG emissions totaled only 96 MT, which is less than 1 percent of the 25,000 MT per year threshold for reporting.
in carbon dioxide equivalent [CO2e]; CFR = Code of Federal Regulations; GHG = greenhouse gas
Figure 3.9. East Tennessee Technology Park stationary source greenhouse gas emissions tracking history
Executive Order (EO) 13514, Federal Leadership in Environmental, Energy, and Economic Performance, was signed by President Barak Obama on October 5, 2009. The purpose of this order was to establish policies for federal facilities that will increase energy efficiency; measure, report, and reduce GHG emissions from direct and indirect activities; conserve and protect water resources through efficiency, reuse, and storm water management; eliminate waste; recycle; and prevent pollution at all such facilities. While the order deals with a number of environmental media, only its applicability to GHG is considered here. The EO defines three distinct scopes for purposes of reporting:
1. Scope 1 is essentially direct GHG emissions from sources that are owned or controlled by a federal agency.
2. Scope 2 encompasses GHG emissions resulting from the generation of electricity, heat, or steam purchased by a federal agency.
3. Scope 3 involves GHG emissions from sources not owned or directly controlled by a federal agency, but related to agency activities, such as vendor supply chains, delivery services, and employee business travel and commuting.

Oak Ridge Reservation Annual Site Environmental Report—2017
East Tennessee Technology Park 3-25
One goal of this order was to establish a FY 2020 Scope 1 and Scope 2 reduction target of 28 percent, as
compared to the 2008 baseline year.
EO 13693, Planning for Federal Sustainability in the Next Decade, was signed and issued on March 25, 2015. This order supersedes EO 13514 and established a new Scope 1 and Scope 2 total reduction target of 40 percent by 2025, as compared to the 2008 baseline year. For reporting purposes, GHG emission data are compared to both goals.
The information reported here includes GHG emissions from the industrial landfills at Y-12 that are managed and operated by UCOR. The landfills are not part of the contiguous ETTP site; however, DOE requested that UCOR, as the operator, include landfill GHG emissions with ETTP reporting in the Consolidated Energy Data Report. To be consistent with reporting this information, the landfill emissions are also included with ETTP ASER data. Figure 3.10 shows the trend toward meeting both the original EO 13514 28 percent total Scope 1 and 2 GHG emissions reduction target by FY 2020 and the current EO 13693 40 percent goal by FY 2025.
With respect to EO 13514, emissions for FY 2017 Scope 1 and 2 including the landfills totaled 17,894 MT CO2e, roughly 52 percent below the FY 2020 target level of 37,478 MT CO2e and a 66 percent reduction to date compared to the FY 2008 baseline year level of 52,053 MT. When compared to the EO 13693 target, FY 2017 data show that the targeted 40 percent reduction has already been achieved by comparing the FY 2017 total of 17,894 MT to the 40 percent target level of 31,232 MT.
in metric tons carbon dioxide equivalent [CO2e]; ETTP = East Tennessee Technology Park; GHG = greenhouse gas emissions
Figure 3.10. East Tennessee Technology Park greenhouse gas emissions trend and targeted reduction commitment
Figure 3.11 shows the relative distribution and amounts of all ETTP FY 2017 GHG emissions for Scopes 1, 2, and 3 including the landfills. Total GHG emissions remain well below the levels first reported in the 2008 baseline year as demolition and remediation efforts continue at ETTP. Many of the early reductions were due to lower onsite combustion of fuels (stationary and mobile sources), lower consumption of electricity, and a smaller workforce. The total amount of GHG emissions for FY 2017 was 23,709 tons, as compared to the 24,252 tons for FY 2016. Total reduction to date starting with the 2008 baseline year of 61,453 tons of GHG emissions is 61.4 percent.

Oak Ridge Reservation Annual Site Environmental Report—2017
East Tennessee Technology Park 3-26
ETTP = East Tennessee Technology Park; GHG = greenhouse gas; Y-12 = Y-12 National Security Complex; and SF6 = sulfur hexafluoride)
Figure 3.11. FY 2017 East Tennessee Technology Park greenhouse gas emissions by scope, as defined in Executive Order 13514
3.5.1.6 Source-Specific Criteria Pollutants ETTP operations included one functioning minor stationary source, the CWTS, with a potential to emit any form of criteria air pollutant. This unit is equipped with an air stripper to remove VOCs from the effluent stream. All process data records and the calculated potential maximum VOC emission rates for the CWTS air stripper were below levels that would require permitting. The calculated VOC annual emissions during 2017 for CWTS were only 0.012 ton/year as compared to an emission limit of 5 tons/year. The annual potential emissions for this facility would be well below the 5 ton/year limit assuming it operated at the maximum hourly emission rate continuously for the entire year.
Federal regulations amended in January of 2013 require TDEC permitting for existing and new stationary RICE-powered emergency generators and firewater booster pumps (i.e., emergency or e-RICE). Permitting actions do not apply to e-RICE covered under CERCLA projects. However, specific maintenance and recordkeeping requirements specified in the federal regulations are applicable to CERCLA projects operating e-RICE. 2017 operations included four e-RICE powered emergency generators (K-1007, K-1039, K-1095, and K-1652), and one e-RICE powered firewater booster pump (K-1310-RW). During 2016 the K-802 e-RICE powered firewater booster pump was permanently removed from service. TDEC issued an amended permit with an effective date of November 22, 2016. The expiration date of the amended permit is October 1, 2024.
Regulations limit e-RICE nonemergency and maintenance operations to 100 h of operations per 12-month rolling total (i.e., 100 h of running the engines for testing and maintenance purposes per year). Additionally, nonemergency operations are limited to 50 h of the 100-h annual limit. The current permit specifies conditions that must be met to demonstrate compliance. These requirements include performing scheduled maintenance, record keeping, and tracking the run times of each of the five permitted units. Copies of all maintenance activities are provided for permit compliance review, and the runtimes are entered into spreadsheets to track against annual limits. Table 3.4 provides the number of hours of operations for each unit, up through December 31, 2017.

Oak Ridge Reservation Annual Site Environmental Report—2017
East Tennessee Technology Park 3-27
Table 3.4. East Tennessee Technology Park UCOR emergency reciprocating internal combustion
engine air permit compliance demonstration, 2017
e-RICE Unit Permit limits: Total hours/year = 100 Nonemergency hours/year = 50 PM Testing Nonemergency Total Emergency (hours/year) (hours/year) (hours/year) (hours/year)
K-1007 5.9 11.8 17.7 56.6 K-1039 5.9 14.6 20.5 61.7 K-1095 6.0 6.8 12.8 20.9
K-1310-RW 4.5 27.8 32.3 1.5 K-1407a 4.8 14.4 19.2 44.0 K-1652 6.0 13.1 19.1 17.3
aK-1407 e-RICE operating under CERCLA and exempt from TDEC air emission permitting. Acronyms e-RICE = emergency reciprocating internal combustion engine PM = particulate matter TDEC = Tennessee Department of Environment and Conservation UCOR = URS | CH2M Oak Ridge LLC
ETTP operations released airborne pollutants from a variety of minor pollutant-emitting sources, such as stacks, vents, and fugitive and diffuse activities. The emissions from all stacks and vents are evaluated following approved methods to establish their low emissions potential. This is done to verify and document their minor source permit exempt status under all applicable state and federal regulations.
3.5.1.7 Hazardous Air Pollutants (Nonradionuclide) Unplanned releases of hazardous air pollutants (HAPs) are regulated through the risk management planning regulations under 40 CFR Part 68. To ensure compliance, periodic inventory reviews of ETTP operations were performed that used monthly data obtained through the EPCRA Section 311 reporting program. This program applies to any facility at which a hazardous chemical is present in an amount exceeding a specified threshold. A comparison of the EPCRA 311 monthly Hazardous Materials Inventory System (HMIS) chemical inventories at ETTP with the risk management plan (RMP) threshold quantities listed in 40 CFR 68.130 was conducted. This is an ongoing action that documents the potential applicability for maintaining and distributing an RMP and to ensure threshold quantities are not exceeded.
ETTP personnel have determined that there are no processes or facilities containing inventories of chemicals in quantities exceeding thresholds specified in rules pursuant to CAA, Title III, Section 112(r), “Prevention of Accidental Releases.” The results of this review indicated that all RMP-listed chemicals were less than 1 percent of their specific trigger thresholds. Therefore, activities at ETTP are not subject to the rule. Procedures are in place to continually review new processes, process changes, or activities with the rule thresholds.
3.5.2 Ambient Air
Compliance of fugitive and diffuse sources is demonstrated based on environmental measurements. The ETTP Ambient Air Quality Monitoring Program is designed to provide environmental measurements to accomplish the following:
• Tracking of long-term trends of airborne concentration levels of selected air contaminant species. • Measurement of the highest concentrations of the selected air contaminant species that occur in the
vicinity of ETTP operations. • Evaluation of the potential impact on air contaminant emissions from ETTP operations on ambient
air quality.

Oak Ridge Reservation Annual Site Environmental Report—2017
East Tennessee Technology Park 3-28
The three sampling programs in the ETTP area are designated as the EC&P program, TDEC program, and
the ORR perimeter air monitoring (PAM) program. Figure 3.12 shows the locations of all ambient air sampling stations in and around ETTP that were active during the 2017 reporting period. Figure 3.13 shows an example of a typical EC&P program air monitoring station.
ETTP = East Tennessee Technology Park, MT = meteorological tower, ORR = Oak Ridge Reservation, PAM = perimeter air monitoring, and TDEC = Tennessee Department of Environment & Conservation)
Figure 3.12. East Tennessee Technology Park ambient air monitoring station locations
The EC&P program consisted of four sampling locations at the beginning of 2017. Due to the shrinking footprint of DOE ETTP operations, station K6 was permanently shut down at the end of June. All projects are operating similar high-volume sampling systems. The EC&P, TDEC, and PAM samplers operate continuously with exposed filters collected weekly. The radiological monitoring results for samples collected at the one ETTP area PAM station are the responsibility of UT-Battelle, LLC (UT-Battelle). TDEC is responsible for the data collected from their two samplers. UT-Battelle and TDEC results are not included with the EC&P data presented in this section. However, periodic requests for results from the other programs are made for comparison purposes.
The analytical parameters were chosen with regard to existing and proposed regulations and with respect to activities at ETTP. The principle reason for EC&P program stations is to demonstrate that radiological emissions from the demolition of ETTP gaseous diffusion buildings, supporting structures, and associated remediation activities are in compliance with the annual dose limit to the most exposed members of the public that is either onsite (on the ORR) or offsite. K12 remained a key sampling location regarding the

Oak Ridge Reservation Annual Site Environmental Report—2017
East Tennessee Technology Park 3-29
potential dose impact on the most exposed member of the public at an onsite business location during the
demolition and debris removal of the last gaseous diffusion building on the ETTP site.
Changes of emissions from ETTP will warrant periodic reevaluation of the parameters being sampled. Ongoing ETTP reindustrialization efforts will also introduce new locations for members of the public that may require adding or relocating monitoring site locations. To ensure understanding of the potential impacts on the public and to establish any required emissions monitoring and emissions controls, a survey of all onsite tenants is reviewed every 6 months through a request for the most recent ETTP reindustrialization map.
Figure 3.13. East Tennessee Technology Park ambient air monitoring station
All EC&P program stations collected continuous samples for radiological and selected metals analyses during 2017. Inorganic analytical techniques were used to test samples for chromium (Cr), Pb, and 99technetium (99Tc). Radiological analyses of samples from the EC&P stations test for the isotopes 234uranium (234U), 235uranium (235U), and 238uranium (238U).
Figures 3.14 and 3.15 illustrate the ambient air concentrations of chromium and lead for the past 5 years, based on quarterly composites of weekly continuous samples. All samples were analyzed by the inductively coupled plasma-mass spectrometer (ICP-MS) analytical technique. The results are compared with applicable air quality standards for each pollutant. The annualized levels of Cr and Pb during 2017 were well below the indicated annual standards. Station K2 is in the prevailing topography of influenced downwind directions that are for identifying the impact to offsite members of the public. Stations K11 and K12 are located to provide a conservative measurement of the impact to onsite members of the public. Sampling results for Cr and Pb have periodically trended higher due to the proximity to major demolition sites, service roads for transporting debris, other demolition machinery, and railroad operations. Cr variations have been coincidental to activities associated with the removal of the gaseous diffusion building concrete pads. Pb variations are most likely due to the close proximity of the exhaust of diesel-burning equipment and vehicles.

Oak Ridge Reservation Annual Site Environmental Report—2017
East Tennessee Technology Park 3-30
Near the end of 2017, all debris and the concrete pad of the last gaseous diffusion building to be
demolished had been removed. The completion of this effort removed a major potential source of fugitive emissions that could include Cr and Pb. Future activities are not expected to contain Cr and Pb levels that would be distinguishable from background levels that were recorded prior to the start of the demolition campaign at ETTP. Based on this information, Cr and Pb were dropped from the analytical matrix after the third quarter of 2017. However, analyzing for 99Tc as an inorganic metal continued.
Demo = demolition
Figure 3.14. Chromium monitoring results: 5-year history through December 2017
Demo = demolition
Figure 3.15. Lead monitoring results: 5-year history through December 2017

Oak Ridge Reservation Annual Site Environmental Report—2017
East Tennessee Technology Park 3-31
3.6 Water Quality Program
3.6.1 NPDES Permit Description
The latest ETTP NPDES permit became effective on April 1, 2015. It is scheduled to expire on March 31, 2020. A total of 27 representative outfalls are monitored on an annual basis for oil and grease, total suspended solids (TSS), pH, and flow. Outfall 170 is monitored quarterly for total chromium and hexavalent chromium. ETTP NPDES permit monitoring requirements for storm water outfalls are shown in Tables 3.5 and 3.6.
Table 3.5. Representative outfalls (Outfalls 05A, 100, 142, 150, 170, 180, 190, 195, 198, 230, 280, 294, 334, 350, 430, 490, 510, 560, 660, 690, 694,
700, 710, 724, 890, 930, and 992)
Parameter Qualifier Value Unit Sample Type Frequency Statistical Base
Flow Report -
million gallons per day (MGD)
Estimate Annual Daily Maximum
Oil & Grease Report - mg/L Grab Annual Daily Maximum
Total Suspended
Solids (TSS) Report - mg/L Grab Annual Daily Maximum
pH ≥ 6.0 and ≤ 9.0 - SU Grab Annual Daily Minimum and
Daily Maximum
Table 3.6. Storm Water Outfall 170 for chromium monitoring
Parameter Qualifier Unit Sample Type Frequency Report
Chromium, hexavalent (as Cr) Report mg/L Grab Quarterly Daily Maximum
Chromium, total (as Cr) Report mg/L Grab Quarterly Daily Maximum
In addition to periodic monitoring requirements specified in the ETTP NPDES permit, several additional monitoring efforts are included to support the CERCLA actions that are ongoing at ETTP. This monitoring will be conducted as part of the Storm Water Pollution Prevention (SWPP) Program and/or the ETTP Biological Monitoring and Abatement Program (BMAP).
1. Flux Monitoring
For bioaccumulative pollutants such as mercury, a long-term monitoring of pollutant loadings (known as flux) will be conducted. This flux monitoring will include the following:
• Flow Monitoring
For Outfalls 100, 170, 180, and 190, field-installed flow meters will be used to gauge flows for the following ranges of rain events at least once during the permit term at each outfall:

Oak Ridge Reservation Annual Site Environmental Report—2017
East Tennessee Technology Park 3-32
− 0.1–0.5 in. rain event − 0.5–1.5 in. rain event − 1.5 in. or greater rain event
These flows will be used to compare against flows generated using the Natural Resources Conservation Service (NRCS) Technical Report-55 (TR-55, NRCS 1986), the current flow modeling technique used at ETTP, to increase the accuracy of the TR-55 flow modeling process. Given that the flow monitoring will occur over a variety of rain events, and multiple field variables can pose problems in collecting usable data, this monitoring will be completed any time during the permit period.
• Mercury Monitoring
Mercury will be sampled at Outfalls 180 and 190 using the flow-weighted sampling technique. Specific sample collection guidelines will be included as part of upcoming SWPP Program Sampling and Analysis Plans (SAPs).
• Flux Calculation
Flow monitoring results will be used to calibrate the variable inputs to the TR-55 flow model, which will then be used with the flow-paced mercury sampling results to determine mercury flux at the respective outfalls.
2. Remedial Activities, CERCLA, and Legacy Pollutant Monitoring
• Storm water samples have been collected at locations that are affected by RA activities prior to the initiation of these activities in order to determine the conditions present before remediation begins. In addition, storm water samples will be collected at potentially affected outfalls and storm water catch basins after remedial activities have been undertaken, and after they have been completed, to help gauge the effectiveness of the remediation efforts.
• The results of the monitoring effort at the D&D sites, which are a subset of remedial activities, are utilized in determining the effectiveness of BMPs in controlling offsite releases of legacy pollutants.
• Periodic monitoring will be performed as part of the ETTP SWPP Program to monitor the continued effectiveness of the chromium collection system.
3. Permit Renewal Sampling
• Sampling required for the completion of the NPDES permit application was initiated in FY 2015 as part of the ETTP SWPP Program. The application for this permit renewal is required to be submitted to TDEC by October 1, 2019, to allow TDEC 180 days to review it prior to permit expiration on March 31, 2020. Additionally, DOE will require time to review the permit application before it is submitted to TDEC. Based on previous TDEC guidance, composite samples were collected as time-weighted composites due to the short travel time for storm water runoff in the storm drain piping system and to site conditions within the watersheds. Monitoring was conducted to ensure all required samples were collected to complete the EPA Form 2E, Application Form 2E—Facilities Which Do Not Discharge Process Wastewater; and EPA Form 2F, Application for Permit to Discharge Storm Water Discharges Associated with Industrial Activity.
• The following sampling was conducted:
Representative outfalls meeting the requirements to complete an EPA Form 2E were sampled. Parameters that must be collected by grab sample, per analytical method or regulatory guidance

Oak Ridge Reservation Annual Site Environmental Report—2017
East Tennessee Technology Park 3-33
were collected as a grab sample only. All other required parameters will be collected as time-
weighted composites only.
Representative outfalls were sampled to ensure completion of EPA Form 2F, Section VII, Discharge Information, Parts A, B, and C, as required:
− Part A—Parameters were collected in compliance with Form 2F. Oil and grease, total nitrogen, total phosphorus, and pH were collected as grab samples per EPA guidance. Biochemical oxygen demand, chemical oxygen demand, and TSS were collected as either grab samples or as time-weighted composites.
− Part B—All facilities generating process wastewater at ETTP have been closed, and the respective NPDES permits have expired. Therefore, ETTP is no longer subject to any effluent guidelines, and there are no sampling requirements under Part B at any storm water outfall at ETTP.
− Part C—Each representative storm water outfall was sampled only for pollutants that could potentially be present based on the characteristics and uses of the drainage area for that outfall. The potential pollutants to be considered for monitoring are shown in Tables 2F-2, 2F-3, and 2F-4. Based upon historical site knowledge and analytical monitoring results, metals, mercury, and PCBs were collected from all representative outfalls. In addition, each representative outfall were evaluated, and VOCs, radionuclides, and other selected parameters were collected from the representative outfalls as required. Part C parameters that must be collected by grab sample, per analytical method or regulatory guidance, were collected as grab samples only. All other Part C parameters were collected as time-weighted composites only.
4. Investigative Sampling
• Investigative sampling will be performed as part of the ETTP SWPP Program. This will include sampling of storm drain networks for bioaccumulative parameters and investigations triggered by analytical results, CERCLA requirements, changes in site conditions, etc. (UCOR 2015, UCOR-4028/R5, East Tennessee Technology Park Storm Water Pollution Prevention Program Sampling and Analysis Plan, Oak Ridge, Tennessee).
• Storm water sampling results will be reviewed and evaluated to provide feedback for the next round of investigative sampling, generate suggested modifications and improvements to storm water runoff controls, and provide input for CERCLA project cleanup decisions.
3.6.2 Storm Water Pollution Prevention Program
3.6.2.1 Radiologic Monitoring of Storm Water ETTP conducts radiological monitoring of storm water discharges to determine compliance with applicable dose standards. ETTP also applies the as low as reasonably achievable (ALARA) process to minimize potential exposures to the public. Sampling for gross alpha and gross beta radioactivity, as well as specific radionuclides, is conducted as part of the ongoing SWPP Program sampling efforts. Analytical results are used to estimate the total discharge of each radionuclide from ETTP via the storm water discharge system.
As part of the ETTP SWPP SAP, storm water samples were collected from discharges that occurred after a storm event that (1) was greater than 0.1 in. in 24 h, and (2) occurred at least 72 h after a rain event greater than 0.1 in. in 24 h. No specified dry period was required before the samples were taken. A series of at least three manual grab samples of equal volume were collected during the first 60 min of a storm event discharge, and combined into a composite sample.

Oak Ridge Reservation Annual Site Environmental Report—2017
East Tennessee Technology Park 3-34
Table 3.7 contains the results of this sampling effort. Screening levels for individual radionuclides are
established at 4 percent of the DCS values listed in DOE Standard 1196 (DOE 2011b, DOE-STD-1196). At Outfall 240, results for alpha activity and 233/234U exceeded the screening criteria. Table 3.8 lists the cumulative activity levels of each of the major isotopes that were discharged from the overall ETTP storm water system in 2017.
Table 3.7. Analytical results for radiological monitoring at ETTP storm water outfalls, 2017
Parameter Screening
Level Outfall
100 Outfall
142 Outfall
170 Outfall
210 Outfall
240 Outfall
694 Outfall
700 Outfall
890 Outfall
992 Alpha activity (pCi/L) 10 2.69 U 0.315 U 0.952 U 6.16 47.6 4.29 U 2.61 U 3.05 U 1.33 U Beta activity (pCi/L) 30 18.1 1.91 U 1.46 U 10.1 6.04 5.93 0.606 U 3.13 U 0.987 U 99Tc (pCi/L) 1760 4.85 U 0.84 U 2.7 U 9.74 U 2.94 U -0.74 U 0.585 U 4.1 U 6.41 U 233/234U (pCi/L) 28 0.934 0.46 U 1.08 2.14 34.3 0.37 U 0.821 1.31 0.31 U 235/236U (pCi/L) 29 0.137 U 0.179 U 0.201 U 0.255 U 1.43 0.124 U 0.152 U 0.201 U 0.143 U 238U (pCi/L) 30 0.0808 0.385 U 0.432 0.476 U 3.06 0.132 U 0.608 0.912 0.122 U
*Results in bold exceed the screening level.
Screening criteria for gross alpha radiation and 233/234U were exceeded at Outfall 240. Outfall 240 receives storm water runoff from a portion of the Building K-25 pad. Operations conducted in this building included the isotopic enrichment of uranium by gaseous diffusion. Discharges from this outfall have historically contained radiological contaminants at levels above screening criteria due to past operations at the K-25 building.
No screening criteria were exceeded at Outfalls 100, 142, 170, 210, 694, 700, 890, or 992.
Table 3.8. Radionuclides released to offsite waters from the ETTP storm water system in 2017 (Ci)
Isotope 234U 235U 238U 99Tc
Activity level 4.5 E-3 4.4 E-4 3.0 E-3 2.4 E-1
3.6.2.2 D&D of the K-27 Building Initial sampling was performed at several outfall locations that drain the K-27 D&D area to provide baseline data for conditions present before demolition began. Additional monitoring has been and will continue to be performed as D&D activities are concluded. The building pad will be removed as the final part of the K-27 D&D activities. The K-27 slab removal work was completed in CY 2017.
Samples were collected at Outfalls 380 and 430 on March 2, 2017, and April 3, 2017. Table 3.9 contains information on the analytical results from the K-27 D&D monitoring effort that were over screening levels.

Oak Ridge Reservation Annual Site Environmental Report—2017
East Tennessee Technology Park 3-35
Table 3.9. Analytical results over screening levels for sampling during removal of the
K-27 building slab
Location
233/234U
Screening level 28 pCi/L
Outfall 380 32.7
No analytical results from Outfall 430 exceeded screening levels.
3.6.3 D&D of the K-1203 Sewage Treatment Plant
The K-1203 STP was previously used to treat and process all sanitary sewage waste from the ETTP. The plant was shut down on May 29, 2008, as a result of the transition of sewage treatment for ETTP to COR. COR expanded the Rarity Ridge Wastewater Treatment Plant to include capacity to treat the waste from ETTP, and the Community Reuse Organization of East Tennessee (CROET) constructed a new ETTP lift station and force main to the plant.
All samples collected as part of this effort were taken using the manual grab sampling method. Manual grab samples were collected according to the guidelines specified in Sections 3.1.2 and 3.3.1 of the EPA’s NPDES Storm Water Sampling Guidance Document (EPA 1992, EPA 833-B-92-001) and applicable procedures that have been developed by the sampling subcontractor. For collection of storm water samples at the K-1203 D&D project, a qualifying rain event was defined as a rain event that (1) produced 1 in. or greater measured rainfall within a 24-h period; (2) caused runoff to be present at the outfall; and (3) occurred after a dry period of at least 72 h. A dry period means no measurable rainfall (0.1 in. or greater) occurs within a 72-h period.
D&D activities began at the K-1230 STP facility in October 2017. As part of the ETTP SWPP Program SAP for FY 2018, Outfall 05A was monitored for contamination associated with the K-1203 facility demolition and storm water runoff. Initial sampling was performed at Outfall 05A on October 23, 2017, to provide baseline data for conditions present before demolition begins. Sampling was conducted while D&D activities were being conducted on November 7, 2017, and December 6, 2017, following rainfall events of 2.42 in. and 0.93 in., respectively. A final monitoring event occurred after a rainfall event of 1.56 in. on December 20, 2017, at the conclusion of demolition and waste handling actions. Analytical results that exceeded screening criteria as part of these sampling events are shown in Table 3.10. Of particular note are the mercury results that exceeded the screening levels before, during, and after the demolition activities. The legacy mercury discharges will be addressed in future CERCLA Remedial Actions.

Oak Ridge Reservation Annual Site Environmental Report—2017
East Tennessee Technology Park 3-36
Table 3.10. Results over screening levels for K-1203 Sewage Treatment Plant monitoring
Sampling Location Copper Lead PCB-1254 PCB-1260 Mercury Zinc Selenium
(ug/L) (µg/L) (µg/L) (µg/L) (µg /L) (µg/L) (µg/L)
Screening Level 7 1.8 Detectable Detectable 25 75 3.8
Outfall 05A
10/23/17 7.78 418 10.2
11/7/17 25.6 0.082 0.0392 1620 93.7 6.1
12/6/17 306
12/20/17 7.45 3.91 240
3.6.3.1 D&D of the K-25 Building Final D&D activities were completed for the K-25 building in July 2014. In order to assess any ongoing impacts, the remaining K-25 building slab has on the quality of the storm water runoff, monitoring of runoff from the slab will be performed on an annual basis. As shown in Table 3.11, runoff samples were collected at Outfall 490 to monitor east wing slab runoff, runoff from Outfall 334 was sampled to monitor west wing slab runoff, and Outfall 230 was sampled to monitor north end slab runoff.
Because sampling of the K-25 building slab runoff required a fairly heavy and intense rain event, samples were collected when runoff was sufficient to allow all of the samples for the given analytical parameters to be collected, regardless of the amount or intensity of the rainfall event. All samples collected as part of this effort were taken using the manual grab sampling method. Manual grab samples were collected according to the guidelines specified in Sections 3.1.2 and 3.3.1 of the EPA’s NPDES Storm Water Sampling Guidance Document (EPA 1992) and applicable procedures that have been developed by the sampling subcontractor. Samples were collected at Outfalls 230, 334, and 490 in July 2017. Results over screening levels are shown in Table 3.11.
Table 3.11. Analytical results over screening levels for K-25 building D&D annual slab runoff monitoring
Location Selenium Gross Beta
Radiation
Screening level 3.8 μg/L
Screening level 50 pCi/L
Outfall 230 6 U
Outfall 334 6.23
Outfall 490 6.51 145
To collect data for trend graphs in the Remediation Effectiveness Report (RER) and ASER, and to collect data that can be compared with information gathered by TDEC on an ongoing basis, a sample for 99Tc will be collected at Outfall 190 each time a quarterly mercury sample is collected. The analytical data

Oak Ridge Reservation Annual Site Environmental Report—2017
East Tennessee Technology Park 3-37
from this sample will assist in determining if 99Tc-contaminated groundwater from the K-25 D&D project could be migrating to the Outfall 190 drainage area and then discharging into Mitchell Branch. As shown in Table 3.12 the storm water results for the Mitchell Branch watershed area indicate that 99Tc was not detected in samples collected at Outfall 190 during FY 2017 except in July 2017. Additional outfall sampling for 99Tc conducted in February 2017 indicates levels at Outfall 210 were also below detection (9.74 U pCi/L). From this data, it does not appear that 99Tc-contaminated groundwater from the K-25 Building D&D project is discharging to Mitchell Branch via Storm Water Outfall 190 or Outfall 210.
Table 3.12. Quarterly 99Tc sampling at Outfall 190
Sampling location
99Tc (pCi/L)* 1/12/16
99Tc (pCi/L)* 4/19/16
99Tc (pCi/L)* 7/11/16
99Tc (pCi/L)* 10/17/16
99Tc (pCi/L)*
1/9/17
99Tc (pCi/L)* 4/18/17
99Tc (pCi/L)* 7/13/17
99Tc (pCi/L)* 10/12/17
Outfall 190 13.4 6.37 U 4.21 U 3.26 U 4.38 U -3.27 U 6.71 2.96 U
*Tc-99 results are provided as a reference. They do not exceed screening criteria.
As shown in Figure 3.16, the activity levels of 99Tc at the Mitchell Branch exit weir K-1700 location were below the established standards. The maximum 99Tc measurement at K-1700 in 2017 was 18.7 pCi/L, which is orders of magnitude below the 99Tc DCS value of 44,000 pCi/L and the drinking water maximum contaminant level (MCL)-DC of 900 pCi/L.
Figure 3.16. Tc-99 levels at K-1700 weir

Oak Ridge Reservation Annual Site Environmental Report—2017
East Tennessee Technology Park 3-38
3.6.3.2 Mercury Investigation Monitoring ETTP conducted activities involving mercury, including use and handling of manometers, switches, mass spectrometers, mercury diffusion pumps, mercury traps, and laboratory operations. ETTP also processed and stored large quantities of mercury-bearing wastes from the onsite gaseous diffusion plant operations and support buildings, Oak Ridge National Laboratory (ORNL), and Y-12. Mercury from soils and spill cleanups was processed onsite as well. Mercury recovery operations were conducted in a number of buildings, many of which were located in watersheds that discharged primarily to Mitchell Branch.
It was subsequently found that mercury levels exceeding the 51 ng/L ambient water quality criterion (AWQC) at ETTP were identified in the Mitchell Branch watershed, as well as in a number of storm water outfalls, surface water locations, and groundwater monitoring wells at ETTP. Knowledge of known historical mercury processes at the facility has increased substantially during RA investigations. This has led to an ongoing storm water network investigation to more precisely detect and quantify the extent of any mercury contamination that may exist.
Factors considered as part of the mercury investigation include weather conditions (wet vs. dry), RA activities (before, during, and after demolition of ETTP facilities), and types of monitoring locations chosen for sampling (in-stream, outfall, ambient, catch basin). For the purpose of the investigation activities, a dry-weather period was defined as being at least 72 h after a storm event of 0.1 in. or more. Wet weather conditions were defined as a storm event greater than 0.1 in. that occurs within a period of 24 h or less and that occurs at least 72 h after any previous rainfall greater than 0.1 in. in 24 h. In addition, manual grab samples were defined as samples collected according to the guidelines specified in Sections 3.1.2 and 3.3.1 of EPA 833-B-92-001 and applicable procedures that have been developed by the sampling subcontractor, RSI.
ETTP Monitoring Programs Several monitoring programs collected mercury data across ETTP at various locations during CY 2017. Samples were collected as specifically defined in the NPDES permit and as part of the SWPP Program. In addition, samples were also collected as part of the Environmental Monitoring Program (EMP) and in support of D&D activities.
There are numerous legacy mercury historical operations within the Outfall 180 and 190 network areas and overall Mitchell Branch watershed. Collectively, these are potential contributors to the continuing legacy mercury discharges to Mitchell Branch due to contaminated sediment within storm water networks and potential infiltration sources into the piping. These include mercury recovery operations at the K-1401 and K-1420 buildings that led to downstream waste disposal areas such as the K-1407 ponds and K-1070-B Burial Ground. Additionally, the K-1035 building instrument shop with associated mercury activities discharged liquids through building acid pits to the storm drain network. In addition to the continuing contributions from the storm drain outfalls, the instream sediments within Mitchell Branch are a potential contributor to water column measurements and fish bioaccumulation. Storm water Outfall 05A drains portions of the inactive K-1203 STP that discharge into the K-1203-10 sump. Soils and facility components from the K-1203 STP, including inactive piping, facilities, basins, etc., are contaminated with mercury from historical treatment operations from sources such as the plant laboratory discharges.
As part of previous NPDES permit compliance program monitoring activities, mercury was sampled on a quarterly basis at Outfalls 05A, 170, 180, and 190. These four locations were selected because information gathered as part of the permit application process indicated that mercury levels at these sites occasionally exceeded the AWQC level of 51 ng/L. Outfalls 170, 180, and 190 collect storm water from large areas on the north side of ETTP and discharge to Mitchell Branch. Outfall 05A is the discharge point for the former sewage treatment plant drainage basin into Poplar Creek on the east side of ETTP.
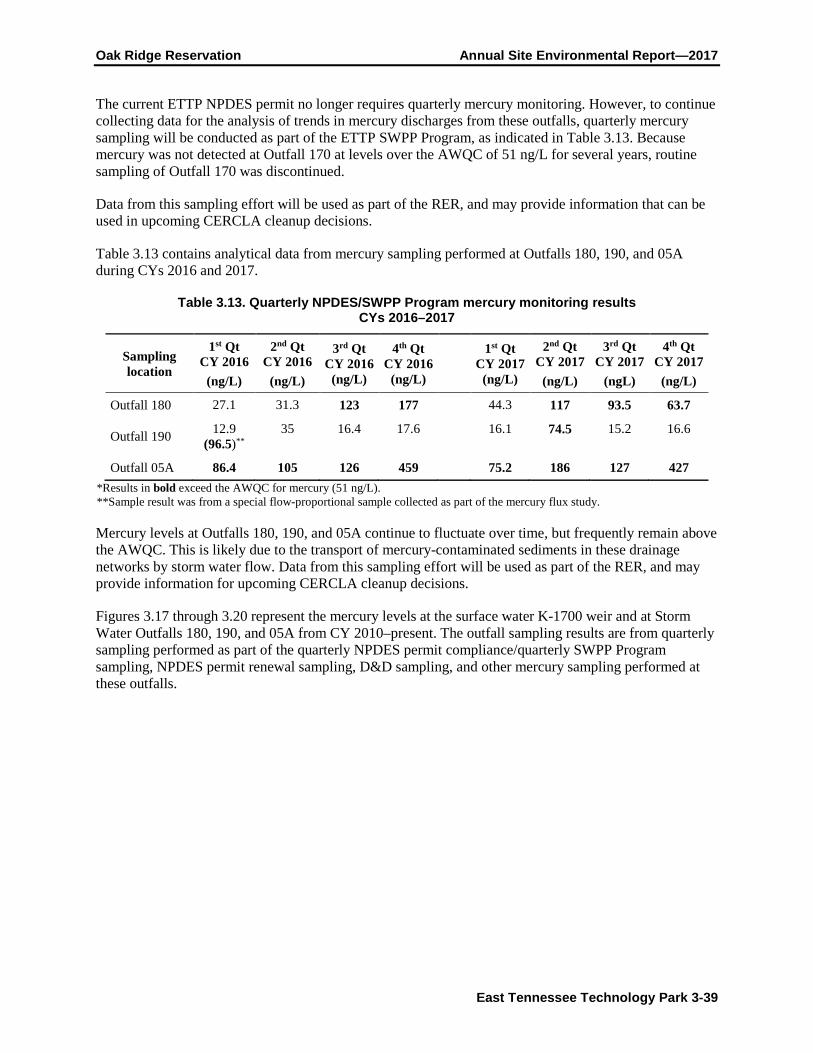
Oak Ridge Reservation Annual Site Environmental Report—2017
East Tennessee Technology Park 3-39
The current ETTP NPDES permit no longer requires quarterly mercury monitoring. However, to continue collecting data for the analysis of trends in mercury discharges from these outfalls, quarterly mercury sampling will be conducted as part of the ETTP SWPP Program, as indicated in Table 3.13. Because mercury was not detected at Outfall 170 at levels over the AWQC of 51 ng/L for several years, routine sampling of Outfall 170 was discontinued.
Data from this sampling effort will be used as part of the RER, and may provide information that can be used in upcoming CERCLA cleanup decisions.
Table 3.13 contains analytical data from mercury sampling performed at Outfalls 180, 190, and 05A during CYs 2016 and 2017.
Table 3.13. Quarterly NPDES/SWPP Program mercury monitoring results CYs 2016–2017
Sampling location
1st Qt CY 2016
(ng/L)
2nd Qt CY 2016
(ng/L)
3rd Qt CY 2016
(ng/L)
4th Qt CY 2016
(ng/L)
1st Qt CY 2017
(ng/L)
2nd Qt CY 2017
(ng/L)
3rd Qt CY 2017
(ngL)
4th Qt CY 2017
(ng/L)
Outfall 180 27.1 31.3 123 177 44.3 117 93.5 63.7
Outfall 190 12.9 (96.5)**
35 16.4 17.6 16.1 74.5 15.2 16.6
Outfall 05A 86.4 105 126 459 75.2 186 127 427 *Results in bold exceed the AWQC for mercury (51 ng/L).**Sample result was from a special flow-proportional sample collected as part of the mercury flux study.
Mercury levels at Outfalls 180, 190, and 05A continue to fluctuate over time, but frequently remain above the AWQC. This is likely due to the transport of mercury-contaminated sediments in these drainage networks by storm water flow. Data from this sampling effort will be used as part of the RER, and may provide information for upcoming CERCLA cleanup decisions.
Figures 3.17 through 3.20 represent the mercury levels at the surface water K-1700 weir and at Storm Water Outfalls 180, 190, and 05A from CY 2010–present. The outfall sampling results are from quarterly sampling performed as part of the quarterly NPDES permit compliance/quarterly SWPP Program sampling, NPDES permit renewal sampling, D&D sampling, and other mercury sampling performed at these outfalls.

Oak Ridge Reservation Annual Site Environmental Report—2017
East Tennessee Technology Park 3-40
Figure 3.17. Mercury concentrations at surface water location K-1700
Figure 3.18. Mercury concentrations at Outfall 180

Oak Ridge Reservation Annual Site Environmental Report—2017
East Tennessee Technology Park 3-41
Figure 3.19. Mercury concentrations at Outfall 190
Figure 3.20. Mercury concentrations at Outfall 05A

Oak Ridge Reservation Annual Site Environmental Report—2017
East Tennessee Technology Park 3-42
NPDES Permit Renewal Sampling Mercury has been sampled at several outfalls as part of the NPDES permit renewal process. None of the mercury results for these samples exceeded the AWQC of 51 ng/L with the exception of Outfall 694, which had a mercury level of 52.8 ng/L. The results of the NPDES permit renewal mercury sampling are in Table 3.14.
Table 3.14. NPDES permit renewal sampling - mercury results
Sampling location Mercury
(ng/L)
Outfall 280 15.3
Outfall 294 32/12.3
Outfall 334 32.6
Outfall 350 45.7
Outfall 660 13.4
Outfall 690 12.7
Outfall 694 52.8
Outfall 700 11
Outfall 890 1.55
Outfall 930 4.22
Outfall 992 7.86
*Results in bold exceed the AWQC for mercury (51 ng/L).
3.6.4 Additional Mercury Sampling at Selected Storm Water Outfalls
An evaluation of mercury data collected as part of the ETTP SWPP Program was performed to identify locations where mercury has been detected at storm water outfall locations. Mercury has been detected at numerous outfalls across ETTP at levels exceeding water quality criteria. Mercury samples were collected at each of these outfalls as part of the SWPP sampling program. This sampling was performed to determine if mercury levels at these outfalls are decreasing, increasing or stable.
Manual grab samples were collected for low-level mercury analysis at each of the outfalls shown in Table 3.15. Manual grab samples were collected according to the guidelines specified in Sections 3.1.2 and 3.3.1 of EPA 833-B-92-001 and applicable procedures that have been developed by the sampling subcontractor. All mercury samples collected as part of this effort were analyzed using the low-level mercury method, Method 1631, Revision E: Mercury in Water by Oxidation, Purge and Trap, and Cold Vapor Atomic Fluorescence Spectrometry (EPA 2002, EPA-1631). Results from this mercury monitoring effort are presented in Table 3.15.

Oak Ridge Reservation Annual Site Environmental Report—2017
East Tennessee Technology Park 3-43
Table 3.15. SWPP mercury sampling results
Sampling location Mercury
(ng/L)
Outfall 100 6.4
Outfall 195 8.77
Outfall 210 0.612
Outfall 230 31.7
Outfall 240 67.6
Outfall 250 45.7
Outfall 280 19
Outfall 350 11.9
Outfall 694 23.2
*Results in bold exceed the AWQC for mercury (51 ng/L)
Storm Water Outfall 240 drains the area of the former K-1024 building. Historically, Building K-1024 housed instrument shop operations. Mercury was commonly used in instruments, switches, and other equipment that may have been serviced in this shop. Discharges from K-1024 went to building storm water neutralization pits, which were connected to the storm drain system. Therefore, elevated mercury at Outfall 240 may be related to the K-1024 instrument shop operations. Figure 3.21 shows mercury concentrations at Outfall 240 from CY 2010 through CY 2017.
Figure 3.21. Mercury concentrations at Outfall 240
0
10
20
30
40
50
60
70
80
90
100
110
120
2010 2011 2012 2013 2014 2015 2016 2017
Con
cent
ratio
n (n
g/L)
Date
mercury at outfall 240
AWQC = 51 ng/L

Oak Ridge Reservation Annual Site Environmental Report—2017
East Tennessee Technology Park 3-44
3.6.4.1 Chromium Water Treatment System and Plume Monitoring
In 2007, the release of hexavalent chromium into Mitchell Branch from Storm Water Outfall 170 and from seeps at the headwall of Outfall 170 resulted in levels of hexavalent chromium that exceeded state of Tennessee AWQC. Immediately below Outfall 170, hexavalent chromium levels were measured at levels as high as 780 µg/L, which exceeded the state of Tennessee hexavalent chromium water quality chronic criterion of 11 µg/L for the protection of fish and aquatic life. The levels of total chromium were at approximately the same value, indicating that the bulk of the release was almost entirely hexavalent chromium at the release point. The reason that the chromium was still in a hexavalent state is unknown, considering that hexavalent chromium has not been used in ETTP operations in over 30 years. On November 5, 2007, DOE notified EPA and TDEC of their intent to conduct a CERCLA time-critical removal action to install a grout barrier wall and groundwater collection system to intercept this discharge. This action reduced the level of hexavalent chromium in Mitchell Branch from 780 µg/L to levels consistently below the AWQC value of 11 µg/L. The time-critical removal action is documented in DOE/OR/01-2598&D2 (DOE 2013), Removal Action Report for the Long-Term Reduction of Hexavalent Chromium Releases into Mitchell Branch at the East Tennessee Technology Park, Oak Ridge, Tennessee.
In 2012, the treatment of the chromium collection system water was transitioned from the Central Neutralization Facility (CNF) to the CWTS. To monitor both the continued effectiveness of the collection system as well as the effectiveness of the new CWTS, periodic monitoring is performed as part of the ETTP SWPP Program. In CY 2017, samples were collected at monitoring well TP-289, the chromium collection system wells, Outfall 170, and Mitchell Branch kilometer (MIK) 0.79. Samples are collected at TP-289 to monitor the concentrations of chromium in the contaminated groundwater plume. Samples are collected from the chromium collection system wells to monitor the chromium in the water recovered by the groundwater collection system. Samples collected at Outfall 170 monitor the concentrations of the chromium and hexavalent chromium plume being discharged directly to Mitchell Branch. Samples are collected at MIK 0.79 to monitor chromium and hexavalent chromium concentrations in Mitchell Branch. Figures 3.22 and 3.23 show the results for the analyses for total chromium and hexavalent chromium, respectively.

Oak Ridge Reservation Annual Site Environmental Report—2017
East Tennessee Technology Park 3-45
Figure 3.22. Total chromium sample results for the chromium collection system
Figure 3.23. Hexavalent chromium sample results for the chromium collection system

Oak Ridge Reservation Annual Site Environmental Report—2017
East Tennessee Technology Park 3-46
The analytical data indicate that both total and hexavalent chromium levels may fluctuate slightly at
TP-289 and the collection wells but are relatively consistent over the long term. Total chromium values at Outfall 170 and MIK 0.79 are slightly more variable. This is most likely due to the greater variability in flow rates at these two locations. Hexavalent chromium levels at Outfall 170 and MIK 0.79 have remained remarkably consistent since 2010, as shown earlier in Figure 3.24.
Additional monitoring of the CWTS will be performed as indicated in UCOR-4259, East Tennessee Technology Park Chromium Water Treatment System Sampling and Analysis Plan, Oak Ridge, Tennessee (UCOR 2017a). In addition to chromium treatment, the upgraded CWTS also has provisions for air stripping of the VOCs that are also found in the groundwater. The air stripper has demonstrated a removal efficiency of greater than 98 percent over the last several monitoring periods.
3.6.4.2 NPDES Permit Renewal Monitoring Preparations are being made for the NPDES permit application that will be submitted to TDEC in CY 2019. The submittal schedule will include time for DOE to review the application before it is submitted to TDEC. Sampling required to complete the permit application continued as part of the CY 2017 SWPP Program SAP. Table 3.16 indicates the dates when samples were collected at representative outfalls during CY 2017.
Table 3.16. NPDES permit renewal sampling conducted in CY 2017
Outfall Manual Grab Samples— Date Collected
Manual Grab or Grab-by-Compositor
Samples—Date Collected
Composite Samples—Date
Collected
280 2/7/17 2/7/17 1/11/17
294 10/23/17 10/24/17 10/23/17
334 10/23/17 10/23/17 9/5/17
350 10/23/17 10/23/17 10/24/17
560 4/3/17 --- ---
660 4/3/17 4/3/17 1/11/17
690 4/3/17 3/14/17 3/8/17
694 4/3/17 3/8/17 1/11/17
700 12/5/17 12/5/17 12/6/17
710 --- 12/21/17 1/23/17
890 2/22/17 2/22/17 2/23/17
930 12/21/17 --- 12/21/17
992 3/7/17 3/7/17 3/17/17
Table 3.17 indicates results from these NPDES permit renewal sampling efforts performed in CY 2017 that exceeded screening levels.

Oak Ridge Reservation Annual Site Environmental Report—2017
East Tennessee Technology Park 3-47
Table 3.17. Analytical results exceeding screening levels for
NPDES permit renewal sampling, CY 2017
Outfall
Copper Lead Gross Alpha
Activity 233/234U 238U Mercury PCB-1254 PCB-1260
Screening level 7 µg/L
Screening level 1.8
µg/L
Screening level 15 pCi/L
Screening level
28 pCi/L
Screening level
30 pCi/L
Screening level 51
ng/L
Screening level Detectable
Screening level Detectable
280 8.97 0.0845 0.0488
294 11.3
334 12.7 8.09
350 151 61.6 46.1
380 32.7
690 0.0386
694 52.8
Screening criteria for copper, PCB-1254, and PCB-1260 were exceeded at Outfall 280, which receives storm water runoff from a portion of the K-1064 peninsula. Past activities conducted at the K-1064 area include incineration of waste paints, organics, and waste oils in a tepee incinerator. In addition, the area was also used for the storage of drums of PCB-contaminated materials, solvents, and waste oils. PCBs identified in the storm water samples from Outfall 280 may be related to these past activities, when scrap metal and electrical equipment had been stored. The presence of copper in the storm water runoff from Outfall 280 may also be linked to these past uses of portions of the K-1064 peninsula area.
Screening criteria for copper were exceeded at Outfall 294, which receives storm water runoff from a radiologically contaminated area on the K-1064 peninsula where uranium hexafluoride (UF6) converter shells were once stored. The converter shells were removed several years ago as part of the K-1064 peninsula D&D program. Discharges from this outfall have historically contained metals and radiological contaminants at levels above screening criteria due to these converter shells.
Screening criteria for copper and lead were exceeded at Outfall 334. Outfall 334 receives runoff from a portion of the west wing of the K-25 building slab. The former K-25 building was utilized in the isotopic enrichment of uranium by gaseous diffusion. As part of this process, large quantities of copper piping, lead solder, and other metals were utilized. D&D activities at the K-25 building slab likely led to the presence of lead and copper in quantities above screening criteria in the discharge from Outfall 334.
Screening criteria for gross alpha radiation, 233/234U, and 238U were exceeded at Outfall 350. Outfall 350 receives storm water runoff from the former K-1066-D cylinder yard area. Even though this area has not been utilized for uranium operations for many years, the presence of elevated gross alpha radiation and isotopic uranium in storm water runoff from Outfall 350 was likely since K-1066-D was historically utilized in the handling of UF6.
Screening criteria for 233/234U were exceeded at Outfall 380, which receives storm water runoff from the K-27 and K-29 building slabs, as well as Building K-1131. The former K-27 and K-29 buildings were utilized in the isotopic enrichment of uranium by gaseous diffusion. Building K-1131 was utilized in the production of UF6 as well as withdrawal of UF6 tails. D&D activities at K-27 and K-1131 likely led to the presence of 233/234U in quantities above screening criteria in the discharge from Outfall 380.

Oak Ridge Reservation Annual Site Environmental Report—2017
East Tennessee Technology Park 3-48
Screening criteria for PCB-1254 were exceeded at Outfall 690. Outfall 690 receives storm water runoff
from a portion of the former K-33 building area. K-33 was used in the isotopic enrichment of uranium. A variety of oils, lubricants, and solvents were in use in the K-33 building as part of the enrichment process. Some of these materials are believed to have been contaminated with PCBs. The presence of PCBs in the storm water runoff from Outfall 690 may be related to past activities conducted in the K-33 building or with the D&D of the K-33 building.
Screening criteria for mercury were exceeded at Outfall 694. Storm Water Outfall 694 receives storm water runoff from the area near the former K-891 pump house. The pump house may have pumped mercury-contaminated water and sediments from Poplar Creek to the K-892 water treatment facility. Some of the water and sediments may have been discharged back into the creek through Outfall 694. D&D activity in early 2015 removed the K-892 building, which is located immediately to the south of the Outfall 694 drainage area. The recent increase in the mercury levels measure at Outfall 694 may be attributable to the recent D&D activities of the K-892 building.
3.6.4.3 Investigative Sampling at Storm Water Outfalls Storm Water Outfall 195 receives storm water runoff from an area that has been utilized for several years by the UCOR Power Integration Group for the storage of new power poles. Because of the potential for wood preservatives to be washed from the power poles by storm water flow, an investigation was conducted to determine if the flow from Outfall 195 contained any chemicals that might be traceable to the use of wood preservatives. In March 2017, discharge from Outfall 195 was sampled for VOCs, semivolatile organic compounds (SVOCs), metals, and other chemicals commonly utilized in the production of wood preservatives. No exceedances of screening levels were noted in the samples collected from Outfall 195. Therefore, it is likely that none of the chemical components of wood preservatives utilized in wood preservatives are being washed from power poles being stored in the Outfall 195 drainage area.
3.6.4.4 Flow Monitoring at Storm Water Outfalls Associated with NPDES Permit Requirements
Flux monitoring at selected outfalls is a part of the mercury investigation at ETTP. To properly monitor mercury flux, accurate flow estimates and mercury concentrations measured during storm events are needed. Flow monitoring was conducted or is planned at Outfalls 100, 170, 180, and 190 as part of the requirements of the ETTP NPDES permit.
At each of these four storm drain locations, the ETTP NPDES permit requires that flows for three ranges of rainfall events be monitored at least once during the permit term at each outfall. The rainfall events for which flow-monitoring data were collected and evaluated are defined as follows:
• 0.1–0.5 in. rain event • 0.5–1.5 in. rain event • 1.5 in. or greater rain event
These measured flows are being utilized to compare against modeled flows generated using TR-55, which is the model at ETTP for estimating storm water discharge flows. These compared values will be used to increase the accuracy of the TR-55 flow modeling process, if possible. Given that the flow monitoring occurs over a variety of rain events and multiple field variables could pose problems in collecting usable data, this monitoring will be completed during the permit period.

Oak Ridge Reservation Annual Site Environmental Report—2017
East Tennessee Technology Park 3-49
3.6.4.5 Results of Flow Monitoring at Outfall 170
The calculated flows obtained at Outfall 170 with the TR-55 model do not appear to correspond well with the measured flows obtained by direct measurement using a rain gauge and flow meter. In many instances, the flow values calculated using TR-55 are a fraction of the flows measured by monitoring equipment. The only situations where the calculated flows and the measured flows were reasonably close occurred when there had been a long span of time between rain events and the baseflow had returned to a minimum level. It appears the TR-55 model does not consider that a rain event may affect the amount of discharge from an outfall for several days after an event. It may be that the model treats the rain event as discrete and short term, without considering longer-term effects. This could explain the consistently low estimates of flow compared to the flow measurements collected by the automatic water sampling equipment (ISCO), which operates and records on a continuous basis. It would also explain why the TR-55 calculated flow and the measured flow are closest for a rain event that occurs after an extended dry period.
Flow data collected by the ISCO monitoring equipment indicate that rain events of as little as 0.2 in. may cause the discharge from Outfall 170 to overtop the V-notch weir if they occur over a short period of time. The Outfall 170 drainage system responds rather quickly to short-term, high-intensity rain events. Because of the size of the drainage area and due to the fact that approximately 30 percent of the area is impervious to storm water infiltration, even smaller rain events generate large quantities of runoff. It is believed that the V-notch weir at Outfall 170 can be utilized for flow measurement in storm events of up to approximately 0.5 in., as long as the rain event occurs over a long enough time period that the weir is not overtopped.
In the ETTP NPDES permit, TDEC states that only an annual estimate of the daily maximum flow is required at regulated outfalls. There is no accompanying description in the ETTP NPDES permit concerning the accuracy of the measurement. Therefore, flow measurements obtained at Outfall 170 using the TR-55 model meet the requirements of the NPDES permit as being a flow estimate. Additionally, no flux monitoring was required at Outfall 170 by the ETTP NPDES permit due to the historically low concentrations of bioaccumulative pollutants, such as mercury and PCBs that are discharged from this outfall. Therefore, it is not believed at this time that additional flow monitoring capabilities are required at Outfall 170. In the future, if more accurate flow measurement is required, an H-flume or similar flow measurement device, may be required at this outfall.
3.6.4.6 Status of Additional Flow Monitoring Activities Associated with NPDES Permit Requirements
As part of the requirements of the ETTP NPDES storm water permit that became effective on April 1, 2015, continuous flow monitoring was conducted at Outfall 190 using an H-type flume and flow meter with recorder. Flow data were collected from the monitoring equipment at the Outfall 190 flume from December 2015 through March 2017. Base flow for Outfall 190 was determined by utilizing the lowest 24-h average flow that was measured during the December 2015 through March 2017 time period. The base flow for Outfall 190 was calculated to be approximately 8500 gal/min. The measured flow data at Outfall 190 will be compared to calculated flows for Outfall 190 that will be generated using the NRCS TR-55 model. The flow comparisons are being made for three ranges of rainfall events: a 0.1–0.5 in. rain event, a 0.5–1.5 in. rain event, and a 1.5 in. or greater rain event. These compared values will be utilized to increase the accuracy of the TR-55 flow modeling process.
In addition, flow-weighted composite sampling for mercury was conducted using the flume and flow monitoring equipment installed at Outfall 190. Mercury samples were collected for each of the three ranges of rainfall events, and the results are shown in Table 3.18. The mercury sampling results will be used along with the recalibrated TR-55 flow model to determine mercury flux for Outfall 190.

Oak Ridge Reservation Annual Site Environmental Report—2017
East Tennessee Technology Park 3-50
Table 3.18. Analytical results from flow-proportional composite sampling at Outfall 190
Location Parameter Date Sampled Rain Event Sampled Results (ng/L)
Outfall 190 Mercury 2/2/16 0.1–0.5 in. 96.5
Outfall 190 Mercury 1/12/17 0.5–1.5 in. 162
Outfall 190 Mercury 9/7/17 1.5 in. or greater 566
An H-type flume was also purchased for installation at Outfall 100. Installation of the flume was completed in late CY 2017. Collection of flow data began in early CY 2018. A flume was also purchased for Outfall 180 in CY 2017. It is expected that the flume will be installed at Outfall 180 in early CY 2018.
3.6.4.7 Significant Spill Events Sanitary wastewater from a bathroom and shower facility (K-2527-T) is routed to a 1,100-gal capacity, aboveground tank for storage until it is pumped out by a sewage pumping subcontractor. On June 12, 2017, the sanitary wastewater was discovered to have overtopped this storage tank and filled the associated secondary containment dike. The water then flowed over a concrete surface into storm drain catch basin 8060, which is located approximately 15 to 20 ft to the west of the tank and dike. Flow that enters catch basin 8060 travels, through a subsurface storm water drainage piping system to Storm Water Outfall 210, which discharges into Mitchell Branch. The volume of sanitary wastewater that entered the storm drain inlet could not be accurately determined.
Corrective actions were taken immediately upon discovery of this overflow. The sewage pumping contractor pumped the contents of the tank and the secondary containment dike for treatment at a permitted sewage treatment facility. UCOR Maintenance personnel identified the causes of this incident and began taking actions to correct them. It was determined that the cause of this overflow was a shut-off valve in the change house that had failed. In addition, a urinal flap had also stuck in the open position. This allowed sanitary water to flow into the tank on a continuous basis for an unknown amount of time over the weekend.
ACs had previously been put in place in an effort to prevent overflows of this type from occurring. These ACs included shutting off the water supply to the restrooms during offshift periods, and placement of signs in the bathroom facility connected to this tank reminding employees to be sure the bathroom fixtures have stopped running before leaving the facility. However, in this instance the shut-off valve proved to be faulty. In addition, a flapper valve in one of the urinals stuck in the open position and went un-noticed by the last users.
The contents of the tank had been pumped out on June 9, 2017. Since a limited staff was working during the period of June 9, 2017, through the morning of June 12, 2017, it is likely that the vast majority of the water released was chlorinated, potable water.
Visual observation of Outfall 210 conducted on June 12, 2017, showed that the outfall was dry. Therefore, it is likely that no wastewater from the overflow reached Mitchell Branch. No adverse impact to fish or other aquatic life was observed.
This event is considered to be a noncompliance with the ETTP NPDES permit (permit no. TN0002950) due to an unpermitted discharge of wastewater to the storm drain system. An NPDES permit

Oak Ridge Reservation Annual Site Environmental Report—2017
East Tennessee Technology Park 3-51
noncompliance report was sent to TDEC as part of the Discharge Monitoring Report submitted in April
2018. The incident was also considered to be a violation of SOP-99033 and was reported to TDEC in the July 2017 quarterly report.
No impact to the fish and aquatic life in Mitchell Branch was noted immediately after this incident occurred or during subsequent inspections of the Mitchell Branch and Storm Water Outfall 210 areas. No threat to human health or the environment is believed to have occurred as a result of this incident.
3.6.5 Surface Water Monitoring
During 2017, the ETTP EMP personnel conducted environmental surveillance activities at 12 surface water locations (Figure 3.24) to monitor groundwater and storm water runoff at watershed exit pathway locations (K-1700, K-1007-B, and K-901-A) or ambient stream conditions (Clinch River kilometers [CRKs] 16 and 23; K-1710; K-716; the K-702-A slough; and MIKs 0.45, 0.59, 0.71, and 1.4). As part of monitoring the ambient stream conditions, K-1700 and MIKs 0.45, 0.59, 0.71, and 1.4 were sampled quarterly; and CRKs 16 and 23, K-716, and the K-702-A slough were sampled semiannually.
At MIKs 0.45, 0.59, and 0.71, quarterly monitoring is conducted for 99Tc only. Results of radiological monitoring were compared with the DCS values in DOE Standard 1196 (DOE 2011b). Radiological data are reported as fractions of DCSs for reported radionuclides, and the fractions for all of the isotopes are added together to produce the sum of fractions (SOF) and averaged to produce a rolling 12-month average. The average SOF is recalculated whenever new data become available. If the average SOF for a location exceeds the DCS requirement of remaining below 1.0 (100 percent) for the year, a formal source investigation is required. Sources exceeding DCS requirements would need an analysis of the best available technology to reduce the SOF of the radionuclide concentrations to less than 1.0 (100 percent). In 2017, the monitoring results yielded SOF values of less than 0.01 (1 percent of the allowable DCS) at all surface water surveillance locations at ETTP (Figure 3.25).

Oak Ridge Reservation Annual Site Environmental Report—2017
East Tennessee Technology Park 3-52
CRK = Clinch River kilometer and MIK = Mitchell Branch kilometer
Figure 3.24. East Tennessee Technology Park Environmental Monitoring Program surface water monitoring locations

Oak Ridge Reservation Annual Site Environmental Report—2017
East Tennessee Technology Park 3-53
CRK = Clinch River kilometer and MIK = Mitchell Branch kilometer
Figure 3.25. Annual average percentage of derived concentration standards (DCSs) at surface water monitoring locations, 2017
Depending on the monitoring location, water samples may be analyzed for pH, selected metals, and VOCs. In 2017, results for most of these parameters were well within the appropriate AWQC. There were five exceptions in 2017. During the second quarter of 2017, there were two exceedances of the AWQC for cadmium. At CRK-16, cadmium was measured at 0.39 µg/L, and at K-1700, cadmium was measured at 0.6 µg/L. Cadmium has a hardness-dependent AWQC of 0.28 µg/L and 0.43 µg/L for the Clinch River and Mitchell Branch, respectively. During the third quarter, there was one failure to meet the minimum level of dissolved oxygen (5.0 mg/L). Dissolved oxygen levels were measured at 4.9 mg/L at K-901-A. This reading was collected at a time of elevated temperatures and very low flow due to the drought conditions, which favor high biological activity and the resulting depletion of dissolved oxygen. In addition, due to a laboratory reporting error, the results for cadmium at K-901-A, K-1007-B, and K-1700 were reported at 0.6 µg/L, which is above the AWQC. However, in all three instances the results were reported as non-detectable. In the fourth quarter, elevated levels of zinc were detected at both CRK-23 (360 µg/L) and MIK 1.4 (1,200 µg/L). Soils in the northern portion of ETTP contain relatively high levels of naturally occurring zinc. No obvious signs of distress (e.g., dead fish) were observed to be associated with any of these exceedances in 2017.
Figures 3.26 and 3.27 illustrate the concentrations of TCE (trichloroethene) and cis-1,2-dichloroethene (cis-1,2-DCE) from the K-1700 weir (which is used to monitor Mitchell Branch), the only surface water monitoring location where VOCs are regularly detected. In the samples collected on November 22, 2016, results for several VOCs, including TCE and cis-1,2-dichloroethene, at several of the Mitchell Branch monitoring locations were reported at levels significantly higher than seen in recent monitoring. Although there had been a test of the CWTS in October 2016, in which the collection well pumps had been intentionally stopped, the test had been completed and the pumps restarted over a month before these samples were collected. The Sample Management Office (SMO) has reviewed these data points and they

Oak Ridge Reservation Annual Site Environmental Report—2017
East Tennessee Technology Park 3-54
did not discover any indication of a laboratory error, and all other sources of error have been ruled out,
leaving the investigation inconclusive. It should be noted that even at the increased levels, the results are still well within the AWQC. Concentrations of TCE and total 1,2-DCE are below the AWQCs for recreation organisms only (300 µg/L for TCE and 10,000 µg/L for trans-1,2-DCE), which are appropriate standards for Mitchell Branch. Moreover, the standards for 1,2-DCE apply only to the “trans” form of 1,2-DCE; almost all of the 1,2-DCE is in the cis- isomer. In addition, vinyl chloride has sometimes been detected in Mitchell Branch water (Figure 3.28). VOCs have been detected in groundwater in the vicinity of Mitchell Branch and in building sumps discharging into storm water outfalls that discharge into the stream; however, storm drain network monitoring generally has not detected these compounds in the storm water discharges. When detected, the concentrations are lower than in the stream. Therefore, it appears that the primary source of these compounds is contaminated groundwater.
Since CWTS was installed, chromium levels in Mitchell Branch have dropped dramatically, with levels of total chromium being routinely measured at less than 6 µg/L (Figure 3.29). In 2017, hexavalent chromium levels in Mitchell Branch were all below the detection limit of 6 µg/L.
MlK = Mitchell Branch kilometer
Figure 3.26. Trichloroethene concentrations in Mitchell Branch.

Oak Ridge Reservation Annual Site Environmental Report—2017
East Tennessee Technology Park 3-55
MlK = Mitchell Branch kilometer
Figure 3.27. Concentrations of cis-1,2-dichloroethene in Mitchell Branch
MlK = Mitchell Branch kilometer
Figure 3.28. Vinyl chloride concentrations in Mitchell Branch

Oak Ridge Reservation Annual Site Environmental Report—2017
East Tennessee Technology Park 3-56
The AWQC for Cr(III), which is hardness-dependent, is 74 µg/L, based on a hardness of 100 mg/L. The AWQC for Cr(IV) is 11 µg/L. AWQC = ambient water quality criterion, MIK = Mitchell Branch kilometer
Figure 3.29. Total chromium concentrations in Mitchell Branch
3.6.6 Groundwater Monitoring
3.6.6.1 General Groundwater Monitoring at ETTP
VOC concentrations in wells monitored downgradient of K-1070-C/D show that a broad area is affected by releases from the past disposal of liquid VOCs at G-Pit. While concentrations along one portion of the affected area associated with wells UNW-114 and UNW-064 continue to decrease, there remains a known area with very high concentrations that affect wells DPT-K1070-5 and DPT-K1070-6. The persistent, very high concentrations of these VOCs suggest an ongoing contaminant source release, possibly a DNAPL.
Contaminant conditions in the groundwater exit pathway areas are generally stable and similar to conditions in recent years. Results are compared to MCL values for comparative purposes only because MCLs are not a record of decision (ROD)-specified goal. Chromium continues to be measured at levels near or slightly above MCLs at the K-31/K-33 area. A slight increase in arsenic concentrations was observed at the K-1064 peninsula that may be related to RA work in the area. At the K-27/K-29 area, TCE continues a gradual decrease in well UNW-038, while cis-1,2-DCE continues a gradual increasing trend in well BRW-058. Samples from springs 10-895 and PC-0, which discharge groundwater into Poplar Creek, had TCE concentrations greater than the 5 µg/L MCL during FY 2017, similar to levels measured in recent years. Low concentrations of metals (less than MCL concentrations) are detected in wells near the K-1007-P1 Holding Pond, and at the K-770 area, alpha and beta activity levels are near or below the MCL screening concentrations. At the K-1085 Drum Burial/Old Firehouse Burn area, TCE, and PCE continue to be present at concentrations greater than the MCL.

Oak Ridge Reservation Annual Site Environmental Report—2017
East Tennessee Technology Park 3-57
Monitoring results at the wells in the K-1407-B and -C ponds area are generally consistent with results
from previous years and show several fold concentration fluctuations in seasonal and longer-term periods. The detection of VOCs at concentrations well above 1,000 µg/L and the steady concentrations over recent years suggest the presence of DNAPL in the vicinity of well UNW-003. The Sitewide ROD will address groundwater contamination present in the area of the former ponds.
Monitoring locations, analytical parameters, and cleanup levels were not specified for groundwater monitoring at the K-1070-C/D Burial Ground (Figure 3.30), although the primary contaminants of concern (COCs) in that area are VOCs. Semiannual samples collected at wells and surface water locations outside the perimeter of the K-1070-C/D Burial Ground are analyzed for VOCs and general water quality parameters. Monitoring at the site is focused on providing data for evaluating changes in contaminant concentrations near the source units or potentially discharging to surface water within the boundaries of the ETTP. Approximately 9,100 gal of mixed volatile organic liquids were disposed of in G-Pit during its period of use between 1977 and 1979. Site characterization data collected at G-Pit in the mid-1990s showed the presence of 1,1,1-TCA (840 mg/L); 1,1-DCA (43 mg/L); toluene (74 mg/L); and TCE (220 mg/L). The 1,1,1-TCA is amenable to biodegradation to 1,1-DCA by microbes in the Dehalobacter genus. Although 1,1-DCA is also amenable to degradation by some species of Dehalobacter, the presence of cis-1,2-DCE and vinyl chloride (VC) tend to inhibit the biodegradation of 1,1-DCA. Cis-1,2-DCE and VC are common biodegradation products of PCE and TCE, which are also present in groundwater at the site along with 1,1-DCE, another biodegradation product of PCE and TCE.
Following remediation of G-Pit in December 1999 through January 2000, monitoring wells UNW-114, TMW-011, and UNW-064 (Figure 3.31) were selected to monitor the VOC plume leaving the K-1070-C/D Burial Ground because they were located in the principal known downgradient groundwater pathway. Results of monitoring at these wells show elevated VOC concentrations. VOC concentrations at these three wells were decreasing prior to the excavation of the G-Pit contents (during FY 2000) and continue to decrease. Although 1,1,1-TCA was formerly present at concentrations far greater than its 200 µg/L MCL, natural biodegradation has reduced 1,1,1-TCA concentrations to less than the drinking water standard. Several direct push monitoring points were installed to the west of UNW-114 during investigations conducted in support of a Sitewide Groundwater RI in 2005. The purpose of these monitoring points was to investigate groundwater contamination in an area along potential geologically controlled seepage pathways that may have connected the G-Pit contaminant source to the former SW-31 spring. DOE continues to monitor two of these points (DPT-K1070-5 and DPT-K1070-6) to measure VOC concentrations and their fluctuations.
Of the three wells monitored at this site, well UNW-114 is closest to the source area and with a well screen interval elevation of 774.95–784.95 ft above mean sea level (aMSL). Monitoring data for well UNW-114 (Figure 3.31) show that concentrations of most VOCs have been variable since 2005, although with the addition of the FY 2017 data, an increase in concentration is noted in VC and 1,1-DCE, along with a slight increase in cis-1,2-DCE and TCE levels. PCE has remained in a gradual decline throughout the sampling period. Concentrations of 1,1-DCA have gradually increased from a minimum of about 140 µg/L in 2007 to a recent concentration of 1,200 µg/L. Since 2010, 1,1,1-TCA has remained at 1 µg/L or below. The September 2017 sample yielded a very low concentration of 0.59 J µg/L. The lingering 1,1-DCA, which exhibits an increasing concentration trend, is inferred evidence of residual contamination migrating from degrading DNAPLs in the source area beneath the former G-Pit disposal site. Recent concentrations of most chlorinated VOCs in well UNW-114 are within factors of about 2 to 5 times their MCLs.
Well UNW-064 (well screen elevation 783.87–788.87 ft aMSL) is located slightly further downgradient from the contaminant source area than UNW-114 and its monitoring data exhibit a slightly different behavior. Similar to the overall trend observed at UNW-114, the majority of VOC concentrations at

Oak Ridge Reservation Annual Site Environmental Report—2017
East Tennessee Technology Park 3-58
UNW-064 (Figure 3.32) decreased from about 2002 through 2005. Concentrations remained relatively
low through the drought years of 2006 into 2008, and increased between 2008 and 2010. Since 2010, VOCs in well UNW-064 have exhibited stable to gradually decreasing concentrations with seasonal fluctuations. At UNW-064, the 1,1-DCA, 1,1-DCE, cis-1,2-DCE, and TCE show rather stable concentration ranges and exhibit seasonal concentration fluctuations with higher concentrations during winter than during summer. This seasonal fluctuation suggests that contaminant mass transport responds to increased groundwater recharge and seepage through the plume. DOE suspects that increased seasonal recharge drives mass transfer in the plume through two combined mechanisms. One mechanism is a rise in groundwater elevation in the source area (residuals from liquid waste beneath G-Pit) which allows groundwater seepage through fractures of higher permeability at a somewhat shallower depth. The second mechanism is simply a higher flow volume through the source area and downgradient fractures caused by the higher head imposed on the whole saturated zone. Cis-1,2-DCE, PCE, and VC have decreased to concentrations less than their respective MCLs in well UNW-064 (Figure 3.32). TCE continues to fluctuate at concentrations approximately 2 to 5 times the MCL and 1,1-DCE concentrations are about 2 to 10 times the MCL.

Oak Ridge Reservation Annual Site Environmental Report—2017
East Tennessee Technology Park 3-59
Figure 3.30. Location map for K-1070-C/D Burial Ground

Oak Ridge Reservation Annual Site Environmental Report—2017
East Tennessee Technology Park 3-60
Figure 3.31. VOC concentrations in well UNW-114, FY 2002–FY 2017
Figure 3.32. VOC concentrations in well UNW-064, FY 2002–FY 2017
1.E-01
1.E+00
1.E+01
1.E+02
1.E+03
1.E+04
1/1/2000 1/1/2002 1/1/2004 1/1/2006 1/1/2008 1/1/2010 1/1/2012 1/1/2014 1/1/2016
Con
cent
ratio
n (µ
g/L)
Date
1,1-DCA 1,1-DCE
cis-1,2-DCE PCE
TCE Vinyl Chloride
1,1,1-TCA
MCLs1,1,1-TCA 200 ug/L1,1-DCA none1,1-DCE 7 ug/Lcis-1,2-DCE 70 ug/LPCE 5 ug/LTCE 5 ug/LVC 2 ug/L
non-filled symbols denote non-detect results
1.E-01
1.E+00
1.E+01
1.E+02
1.E+03
1/1/2002 1/1/2005 1/1/2008 1/1/2011 1/1/2014 1/1/2017
Con
cent
ratio
n (µ
g/L)
Date
1,1-DCA 1,1-DCE cis-1,2-DCE
PCE TCE Vinyl Chloride
MCLs1,1-DCA none1,1-DCE 7 ug/Lcis-1,2-DCE 70 ug/LPCE 5 ug/LTCE 5 ug/LVC 2 ug/L
non-filled symbolds denote non-detect results
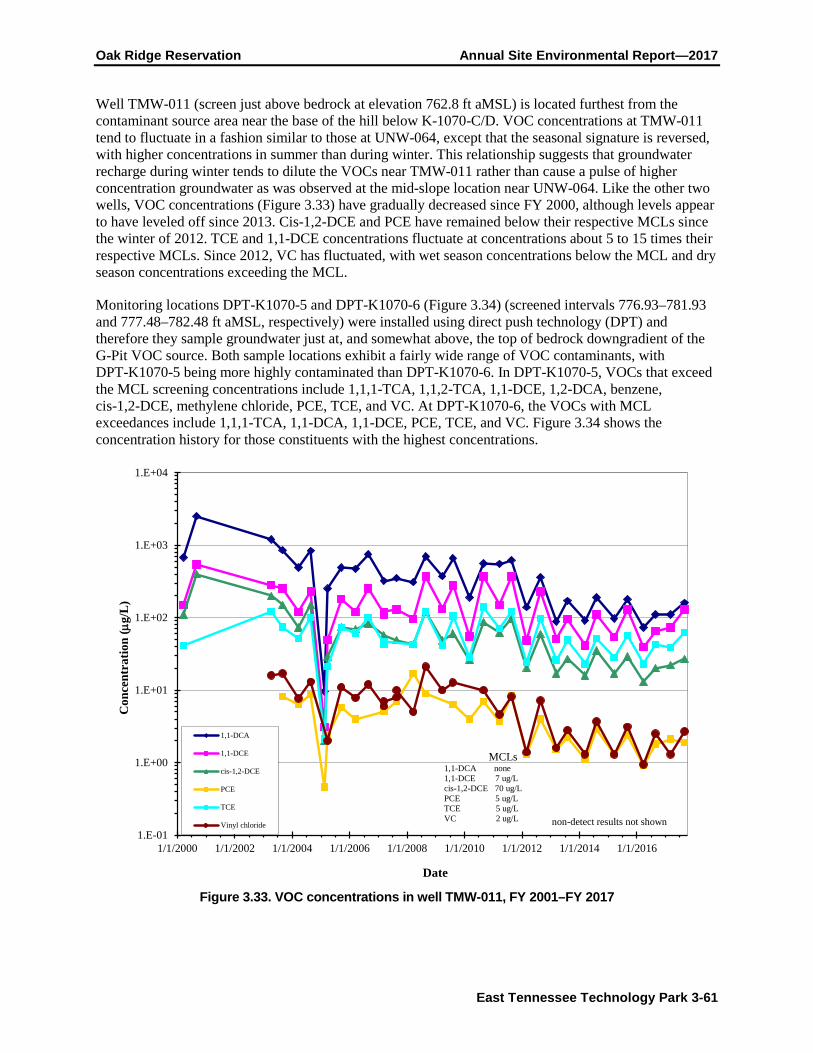
Oak Ridge Reservation Annual Site Environmental Report—2017
East Tennessee Technology Park 3-61
Well TMW-011 (screen just above bedrock at elevation 762.8 ft aMSL) is located furthest from the
contaminant source area near the base of the hill below K-1070-C/D. VOC concentrations at TMW-011 tend to fluctuate in a fashion similar to those at UNW-064, except that the seasonal signature is reversed, with higher concentrations in summer than during winter. This relationship suggests that groundwater recharge during winter tends to dilute the VOCs near TMW-011 rather than cause a pulse of higher concentration groundwater as was observed at the mid-slope location near UNW-064. Like the other two wells, VOC concentrations (Figure 3.33) have gradually decreased since FY 2000, although levels appear to have leveled off since 2013. Cis-1,2-DCE and PCE have remained below their respective MCLs since the winter of 2012. TCE and 1,1-DCE concentrations fluctuate at concentrations about 5 to 15 times their respective MCLs. Since 2012, VC has fluctuated, with wet season concentrations below the MCL and dry season concentrations exceeding the MCL.
Monitoring locations DPT-K1070-5 and DPT-K1070-6 (Figure 3.34) (screened intervals 776.93–781.93 and 777.48–782.48 ft aMSL, respectively) were installed using direct push technology (DPT) and therefore they sample groundwater just at, and somewhat above, the top of bedrock downgradient of the G-Pit VOC source. Both sample locations exhibit a fairly wide range of VOC contaminants, with DPT-K1070-5 being more highly contaminated than DPT-K1070-6. In DPT-K1070-5, VOCs that exceed the MCL screening concentrations include 1,1,1-TCA, 1,1,2-TCA, 1,1-DCE, 1,2-DCA, benzene, cis-1,2-DCE, methylene chloride, PCE, TCE, and VC. At DPT-K1070-6, the VOCs with MCL exceedances include 1,1,1-TCA, 1,1-DCA, 1,1-DCE, PCE, TCE, and VC. Figure 3.34 shows the concentration history for those constituents with the highest concentrations.
Figure 3.33. VOC concentrations in well TMW-011, FY 2001–FY 2017
1.E-01
1.E+00
1.E+01
1.E+02
1.E+03
1.E+04
1/1/2000 1/1/2002 1/1/2004 1/1/2006 1/1/2008 1/1/2010 1/1/2012 1/1/2014 1/1/2016
Con
cent
ratio
n (µ
g/L)
Date
1,1-DCA
1,1-DCE
cis-1,2-DCE
PCE
TCE
Vinyl chloride
MCLs1,1-DCA none1,1-DCE 7 ug/Lcis-1,2-DCE 70 ug/LPCE 5 ug/LTCE 5 ug/LVC 2 ug/L non-detect results not shown

Oak Ridge Reservation Annual Site Environmental Report—2017
East Tennessee Technology Park 3-62
Figure 3.34. Concentrations of selected VOCs in DPT-K1070-5 and DPT-K1070-6
The elevation and VOC concentration relationships among the monitoring wells demonstrate that the G-Pit plume is a heterogeneous flow system and that wells DPT-K1070-5 and DPT-K1070-6 lie in a different flowpath from the area monitored by UNW-064 and UNW-114. Although the screen elevations of the two DPT wells and well UNW-114 are essentially the same, the VOC concentrations in the DPT samples are much higher than those in well UNW-114. Bedrock wells have not been installed in the area to date to evaluate deeper groundwater conditions.
Extensive groundwater monitoring at the ETTP site, using Safe Drinking Water Act (SDWA) MCLs as groundwater screening values, has identified VOCs as the most significant groundwater contaminant on site. The principal chlorinated hydrocarbon chemicals that were used at ETTP were PCE, TCE, and 1,1,1-TCA. During preparation of a Remedial Investigation/Feasibility Study (RI/FS) in 2007 in support of CERCLA decision-making for the ETTP site, the human health risk assessment summarized “priority COCs in groundwater . . . for the industrial worker, which is the most likely of the future scenarios assessed for exposure to groundwater.” The evaluation of priority groundwater COCs identified the major groundwater contaminant source areas and associated plumes as listed in Table 3.19.
Two new groundwater COCs have been identified in recent years as site conditions change through the site closure program: hexavalent chromium in the Mitchell Branch area and 99Tc in the vicinity of the K-25 building east slab. To date, neither of these contaminants has been subjected to the formal risk assessment process, although that will occur during the ETTP Sitewide ROD project, which is currently in the planning phase. Both of these COCs are discussed in this RER. The hexavalent chromium collection and treatment is addressed in Section 3.6.4.1 and 99Tc is discussed in Section 3.6.6.2.
0
2,000
4,000
6,000
8,000
1/1/2004 1/1/2006 1/1/2008 1/1/2010 1/1/2012 1/1/2014 1/1/2016 1/1/2018
Con
cent
ratio
n (u
g/L)
Date
1,1,1-TCA DPT-K1070-5
1,1,1-TCA DPT-K1070-6
TCE DPT-K1070-5
1,1-DCE DPT-K1070-5
MCLs1,1,1-TCA 200 ug/L1,1-DCE 7 ug/LTCE 5 ug/L

Oak Ridge Reservation Annual Site Environmental Report—2017
East Tennessee Technology Park 3-63
Table 3.19. Principal groundwater contaminant source areas and associated
priority groundwater COCs
Source area/plume 1,1-DCE Carbon
tetrachloride PCE TCE Cis-1,2-DCE Manganese VC
K-1070-C/D X X
X X X
K-1035 X
X X X
K-1401 X
X X X
K-1407-B X
X X X X
K-27/K-29
X
K-1200
X
K-1070-A X X
X
Source: Table 7.12 of the Final Sitewide Remedial Investigation and Feasibility Study for East Tennessee Technology Park, Oak Ridge, Tennessee (DOE 2007, DOE/OR/01-2279&D3, Volume 1).
Acronyms COC = contaminant of concern DCE = dichloroethene PCE = perchloroethene TCE = trichloroethen VC = vinyl chloride
Figure 3.35 shows the distribution and generalized concentrations of the sum of the primary chlorinated hydrocarbon chemicals and their transformation products, respectively, at ETTP. Specific compounds included in the summation of chlorinated VOCs include chloroethenes (PCE, TCE, cis-1,2-DCE, trans-1,2-DCE, and VC), chloroethanes (1,1,1-TCA, 1,1,2-TCA, 1,2-DCA, 1,1-DCA, and chloroethane), and chloromethanes (carbon tetrachloride, chloroform, and methylene chloride). Several plume source areas are identified within the regions of the highest VOC concentrations. In these areas, the primary chlorinated hydrocarbons have been present for decades and mature contaminant plumes have evolved. The degree of transformation, or degradation, of the primary chlorinated hydrocarbon compounds is highly variable across the site. In the vicinity of the K-1070-C/D source a high degree of degradation has occurred, although a strong source of contamination still remains in the vicinity of the G-Pit, where approximately 9,000 gal of chlorinated hydrocarbon liquids were disposed of in an unlined pit. Other areas where transformation is significant include the K-1401 Acid Line leak site, and the K-1407-B Pond area. Transformation processes are weak or inconsistent at the K-1004 and K-1200 area, K-1035, K-1413, and K-1070-A Burial Ground, and little transformation of TCE is observed in the K-27/K-29 source and plume area.

Oak Ridge Reservation Annual Site Environmental Report—2017
East Tennessee Technology Park 3-64
Figure 3.35. ETTP exit pathways monitoring locations

Oak Ridge Reservation Annual Site Environmental Report—2017
East Tennessee Technology Park 3-65
Mitchell Branch – The Mitchell Branch groundwater exit pathway is monitored using surface water data from the K-1700 weir on Mitchell Branch and wells BRW-083 and UNW-107.
Wells BRW-083 and UNW-107, located near the mouth of Mitchell Branch, have been monitored since 1994. Table 3.20 shows the history and concentrations of detected VOCs in groundwater. Detection of VOCs in groundwater near the mouth of Mitchell Branch is considered an indication of the migration of the Mitchell Branch VOC plume complex. The intermittent detection of VOCs in this exit pathway is thought to be a reflection of variations in groundwater flowpaths that can fluctuate with seasonal hydraulic head conditions, which are strongly affected by rainfall. During FY 2017, cis-1,2-DCE was detected at 0.61 J µg/L, at well BRW-083 in March. No other chlorinated VOCs were detected in wells BRW-083 or UNW-107.
K-1064 peninsula area – Wells BRW-003 and BRW-017 monitor groundwater at the K-1064 peninsula burn area. Metals and VOCs are monitored at the site. Metals detected in groundwater at the site include antimony, zinc, chromium, and arsenic. Antimony was detected at very low, estimated concentration in both wells. Well BRW-003 had an antimony detection of 0.4 J and 0.3 J µg/L in the March filtered and unfiltered samples, respectively, with non-detect results in September. Well BRW-017 had 0.32 J and 0.24 J µg/L in the unfiltered and filtered March samples, respectively, with non-detect results in September. Chromium was detected in the March unfiltered and filtered BRW-017 samples at 2.0 J and 1.6 J µg/L, respectively. Zinc was detected at 4.4 J µg/L in the unfiltered BRW-017 March sample. Arsenic was detected in both wells with maximum concentrations of 20 µg/L in well BRW-003 in the unfiltered sample in March and 11 µg/L in the unfiltered sample from well BRW-017 in September.
Figure 3.36 shows arsenic concentration histories in samples from wells BRW-003 and BRW-017. Arsenic concentrations in both unfiltered and filtered samples from well BRW-003 have shown long-term decreases during the period between 2004 and 2017. At well BRW-017, a period of arsenic non-detection in unfiltered samples ended in the summer of 2015 and since then the samples have shown arsenic detections with MCL exceedances in March 2016 and September 2017.
Figure 3.37 shows the history of significant VOC detections in groundwater from FY 1994 through FY 2017. In the September sample, 1,1,1-TCA was detected at 0.4 J µg/L in well BRW-003 and was not detected in the March sample. In September, Cis-1,2-DCE was detected in well BRW-003 at 0.96 J µg/L and at BRW-017 at 1.2 and 0.94 J µg/L in March and September, respectively. TCE concentrations have declined in both wells over the monitoring period. TCE was present at concentrations less than the MCL during FY 2017 at both wells. In well BRW-017, TCE was detected at concentrations of 2.3 and 2 µg/L in March and September, respectively. At well BRW-003, TCE was detected at 3.2 µg/L in the September sample and was not detected in the March sample. The recent increase in TCE concentration at BRW-003 and variability of arsenic concentrations in both wells may be related to area RA activities.
K-31/K-33 area – Groundwater is monitored in four wells (BRW-066, BRW-030, UNW-080, and UNW-043) that lie between the K-31/K-33 area and Poplar Creek. VOCs are not COCs in this area; however, leaks of recirculating cooling water (RCW) in the past have left residual subsurface chromium contamination. Chromium concentrations in the unconsolidated zone wells (UNW-043 and UNW-080) have exceeded the 0.1 mg/L MCL screening concentration in the past, while levels have been much lower in the bedrock wells.
Figure 3.38 shows the history of chromium detection in wells BRW-030, UNW-043, and UNW-080. Groundwater at well UNW-043 has exhibited the highest residual chromium concentrations of any in the area. Chromium concentrations in well UNW-043 correlate with the turbidity of samples. The acidification of unfiltered samples that contain suspended solids often causes detection of high metals

Oak Ridge Reservation Annual Site Environmental Report—2017
East Tennessee Technology Park 3-66
content because the addition of acid preservative releases metals that are adsorbed to the solid particles at
the normal groundwater pH.
During FY 2006, an investigation was conducted to determine if groundwater in the vicinity of the K-31/K-33 buildings contained residual hexavalent chromium from RCW leaks. The data indicated the chromium in groundwater near the leak sites was essentially all the less toxic trivalent species. Starting in FY 2008, field-filtered (i.e., dissolved) and unfiltered samples have been collected from the wells sampled in the K-31/K-33 area. Chromium concentrations in the field-filtered samples are consistently much less than the 0.2 mg/L MCL. During FY 2017, the only samples that were equal to or greater than the chromium MCL were the unfiltered samples from UNW-030 in March and September, and the unfiltered sample collected from UNW-043 in March. Chromium was non-detect in all samples from well BRW-066 during FY 2017.
K-27/K-29 area – Several exit pathway wells are monitored in the K-27/K-29 area, as shown on Figure 3.35. Figure 3.39 provides concentrations of detected VOCs in wells both north and south of K-27 and K-29 through FY 2017. The source of VOC contamination in well BRW-058 is not suspected to be from K-27/K-29 area operations, but is more likely associated with groundwater contamination that originates in the K-25 area. At well BRW-058, VC continues to slightly exceed the MCL and showed a slight increase in the September 2017 sample. Cis-1,2-DCE also showed an increase in concentrations during FY 2017 and both measured results exceeded the MCL. The presence of cis-1,2-DCE and VC in well BRW-058 is an indication that some natural attenuation is occurring in the source area. The VOC concentrations in well BRW-016 showed a slight increase in the September 2017 sampling event, but remain well below the MCL concentrations. This increase is thought to be related to demolition of the K-27 building and slab. Increases in groundwater TCE and 99Tc concentrations in the vicinity of the K-27 building have been noted during the D&D period. TCE levels in well UNW-038 exhibit a long-term decreasing trend, with seasonal fluctuations (higher during the wet season and lower during the dry season) between about 10 to 20 times the MCL.

Oak Ridge Reservation Annual Site Environmental Report—2017
East Tennessee Technology Park 3-67
Table 3.20. VOCs detected in groundwater in the Mitchell Branch Exit Pathway
Well Date cis-1,2-DCE (µg/L) PCE (µg/L) TCE (µg/L) VC (µg/L)
BRW-083 8/29/2002 ND 5 28 ND 3/16/2004 0.69 2.2 9.9 ND 8/26/2004 2 4.7 20 ND 3/14/2007 5 9 28 ND 3/20/2008 ND ND ND ND 8/21/2008 ND ND ND ND 3/12/2009 ND ND 1.31 J ND 8/3/2009 ND 2.66 14.2 ND 3/3/2010 ND ND ND ND 8/30/2010 3.6 5.1 18 ND 3/15/2011 2.8 6.7 22 ND 8/10/2011 ND ND ND ND 3/1/2012 ND ND ND ND 8/16/2012 ND ND ND ND 8/6/2013 ND ND ND ND 3/13/2013 ND ND ND ND 3/13/2014 ND ND ND ND 8/7/2014 ND ND ND ND 3/30/2015 ND ND ND ND 8/20/2015 ND ND ND ND 3/8/2016 ND ND ND ND 8/31/2016 ND ND ND ND 3/6/2017 0.61 J ND ND ND 8/23/2017 ND ND ND ND UNW-107 8/3/1998 ND ND 3 ND 8/26/2004 4.7 ND 3.6 ND 8/21/2006 3.4 14 2 1.2 3/13/2007 25 2 J 23 2a 8/21/2007 17 ND 30 0.3 J 3/5/2008 ND ND ND ND 8/18/2008 ND ND ND ND 3/12/2009 ND ND ND ND 7/30/2009 ND ND ND ND 3/4/2010 ND ND ND ND 7/28/2010 ND ND ND ND 3/16/2011 ND ND ND ND 8/11/2011 ND ND ND ND 3/20/2012 ND ND ND ND

Oak Ridge Reservation Annual Site Environmental Report—2017
Table 3.20. VOCs detected in groundwater in the Mitchell Branch Exit Pathway (continued)
East Tennessee Technology Park 3-68
Well Date cis-1,2-DCE (µg/L) PCE (µg/L) TCE (µg/L) VC (µg/L)
9/12/2012 ND ND ND ND 8/8/2013 ND ND ND ND 3/20/2013 ND ND ND ND 3/18/2014 ND ND ND ND 8/20/2014 ND ND ND ND 3/16/2015 ND ND ND ND 8/25/2015 ND ND 0.53 J ND 3/9/2016 ND ND ND ND 8/30/2016 ND ND ND ND 3/9/2017 ND ND ND ND 8/23/2017 ND ND ND ND
aDetection occurred in a field replicate. Constituent not detected in regular sample. Bold table entries exceed SDWA MCL screening values (PCE, TCE = 5 µg/L, cis-1,2-DCE = 70 µg/L, VC = 2 µg/L). All concentrations µg/L.
Acronyms DCE = dichloroethene J = estimated value MCL = maximum contaminant level ND = not detected PCE = tetrachloroethene SDWA = Safe Drinking Water Act TCE = trichloroethene VC = vinyl chloride VOC = volatile organic compound

Oak Ridge Reservation Annual Site Environmental Report—2017
East Tennessee Technology Park 3-69
Figure 3.36. Arsenic concentrations in groundwater in the K-1064 peninsula area
Figure 3.37. VOC concentrations in groundwater in the K-1064 peninsula area
0
0.01
0.02
0.03
0.04
0.05
0.06
0.07
1/1/2004 9/27/2006 6/23/2009 3/19/2012 12/14/2014 9/9/2017
Ars
enic
(mg/
L)
Date
BRW-003 Unfilltered BRW-003 FilteredBRW-017 Unfiltered BRW-017 FilteredArsenic MCL
Open symbols denote non-detect resultFilled symbols denote detected concentrations

Oak Ridge Reservation Annual Site Environmental Report—2017
East Tennessee Technology Park 3-70
Figure 3.38. Chromium concentrations in groundwater in the K-31/K-33 area
K-1007-P1 Holding Pond area – Wells BRW-084 and UNW-108 are exit pathway monitoring locations at the northern edge of the K-1007-P1 Holding Pond (Figure 3.35). These wells were monitored intermittently from 1994 through 1998 and semiannually from FY 2001 through FY 2017. The first detections of VOCs in these wells occurred during FY 2006, with detection of low (approximately 10 µg/L or less) concentrations of TCE and cis-1,2-DCE. The source area for these VOCs is not known. During FY 2017, no VOCs were detected in either well. Metals continue to be detected and are associated with the presence of turbidity in the samples.
At well BRW-084, antimony was detected in both the filtered and unfiltered samples collected in March (0.48 µg/L in unfiltered and 0.33 µg/L in filtered). Antimony was also detected in samples collected at BRW-084 in August (0.2 J µg/L in unfiltered and 0.06 J µg/L in filtered). At well UNW-108, antimony was present at 2.8 J µg/L and 0.13 J µg/L in the unfiltered and filtered samples collected in March, respectively. Antimony was detected in the August sample from UNW-108 at 0.05 J µg/L. Cadmium was detected in the March unfiltered samples from both BRW-084 and UNW-108 (0.1 J µg/L and 0.2 µg/L, respectively). Cadmium was detected in the UNW-108 August unfiltered sample at 0.11 J µg/L.
Chromium was detected in the BRW-084 unfiltered samples collected in March and August (6.1 and 5.6 µg/L, respectively) with no detection in the filtered samples. At well UNW-108, chromium was detected at 4.9 J µg/L in the unfiltered sample collected in March, with no other detections during the year. The only detection of lead from these two wells was from the unfiltered sample collected from UNW-108 in March, which had a concentration of 3.6 µg/L. Selenium was detected in both the filtered and unfiltered samples collected in August from well BRW-084 (0.65 J µg/L and 0.45 J µg/L, respectively). In addition, selenium was detected in both the filtered and unfiltered samples collected in
0.001
0.01
0.1
1
10
100
1/1/2001 1/1/2003 1/1/2005 1/1/2007 1/1/2009 1/1/2011 1/1/2013 1/1/2015 1/1/2017
Tota
l Chr
omiu
m (m
g/L)
__
Date
UNW-043 Unfiltered UNW-043 Filtered
BRW-030 Unfiltered UNW-080 Unfiltered
UNW-080 Filtered
Total chromium MCL = 0.1 mg/L
open symbol denotes non-detect result

Oak Ridge Reservation Annual Site Environmental Report—2017
East Tennessee Technology Park 3-71
March from well BRW-084 (1.2 J µg/L and 1.0 J µg/L, respectively). Thallium was detected in both August and March filtered and unfiltered samples from well UNW-108 (maximum of 0.08 J µg/L and a minimum of 0.02 J µg/L). Uranium concentrations in both wells were quite low with a maximum measured value of 0.64 J µg/L. Potential sources of these metals in this area are unknown and the detected concentrations are far below any criterion level.
Figure 3.39. Detected VOC concentrations in groundwater exit pathway wells near
Buildings K-27 and K-29
K-901-A Holding Pond area – Exit pathway groundwater in the K-901-A Holding Pond area (see earlier Figure 3.35) is monitored by four wells (BRW-035, BRW-068, UNW-066, and UNW-067) and one spring (21-002). Very low concentrations (< 5 µg/L) of VOCs are occasionally detected in wells adjacent to the K-901-A Holding Pond. However, these contaminants are not persistent in groundwater west and south of the pond. No VOCs were detected in the K-901-A Holding Pond exit pathway wells during FY 2017. At well BRW-035, alpha- and beta-activity levels have remained fairly consistent over the past several years, with non-detect concentrations of alpha and beta levels between about 10–15 pCi/L. Similarly, well BRW-068 has experienced fairly stable, low to non-detect concentrations of alpha (none detected in FY 2017) and less than 10 pCi/L of beta activity. Although UNW-066 has experienced alpha and beta MCL exceedances in the past, measured concentrations of these parameters did not exceed MCL screening criteria during FY 2017. In well UNW-067, the alpha- and beta-activity screening levels were not exceeded during FY 2017. Technetium-99 was analyzed in samples from wells UNW-066 and UNW-067 during FY 2017. The only 99Tc detection from these wells during FY 2017 was a result of 12.8 pCi/L in the February sample.
0
1
10
100
1,000
12/31/00 12/31/03 12/31/06 12/31/09 12/31/12 12/31/15
Con
cent
ratio
n (µ
g/L
)
Date
BRW-016 cis-1,2-DCE BRW-016 Vinyl chlorideBRW-058 cis-1,2-DCE BRW-058 Vinyl chlorideUNW-038 TCE
Open symbols denote non-detect results
MCLscis-1,2-DCE 70 ug/LTCE 5 ug/LVC 2 ug/L

Oak Ridge Reservation Annual Site Environmental Report—2017
East Tennessee Technology Park 3-72
TCE is the most significant groundwater contaminant detected in the springs, and the historic TCE concentrations are shown in Figure 3.40. Spring PC-0 was added to the sampling program in 2004. During April through October each year, spring PC-0 is submerged beneath the Watts Bar Lake level. In the late winter of 2012, DOE installed a sampling pump in the spring mouth to allow year-round sampling. The contaminant source for the PC-0 spring is presumed to be disposed waste at the former Construction Spoil Area (K-1070-F) on Duct Island. The TCE concentrations in PC-0 spring have varied between non-detectable levels and 26 µg/L; they have decreased from their highest measured value in 2006 to concentrations that are a small fraction of the drinking water standard. During FY 2017, cis-1,2-DCE was detected at estimated low concentrations <1 µg/L in PC-0 samples collected in June and August.
Although TCE is the principal contaminant detected at spring 21-002, 1,1-DCE, carbon tetrachloride, chloroform, and PCE were present at concentrations less than 5 µg/L. The TCE concentration at spring 21-002 tends to vary between less than 5 and 25 µg/L and this variation appears to be related to variability in rainfall that affects groundwater discharge from the K-1070-A VOC plume. During FY 2017, the TCE detected concentrations ranged from a high of 25 µg/L detected in January to a low of 19 µg/L measured in both December 2016 and August 2017. Alpha activity was detected < 5 pCi/L in December, January, and August samples, and detected beta activities ranged from 4.27 to 20.2 pCi/L. Technetium-99 detections ranged from 12.8 to 22.6 pCi/L, which are much lower than the 900 pCi/L MCL-DC. Uranium-234, 235U, and 238U were detected at less than 1 pCi/L.
The 10-895 spring discharges groundwater from beneath Black Oak Ridge along Poplar Creek near Blair Road (Figure 3.35). Black Oak Ridge is located behind the ETTP site. The source of TCE has not been confirmed. Although the Contractor’s Spoil Area is the closest upgradient waste disposal site, it is possible that contaminants from the more distant K-1070-A site could migrate via karst groundwater flow pathways to the spring, which is suggested based on the presence of carbon tetrachloride along with the other VOCs. TCE concentrations measured in samples from spring 10-895 are shown on Figure 3.40. The highest TCE concentration measured was 8.8 µg/L.
Figure 3.40. TCE concentrations in selected East Tennessee Technology Park area springs
0
5
10
15
20
25
30
35
40
45
1/1/95 12/31/96 1/1/99 12/31/00 1/1/03 12/31/04 1/1/07 12/31/08 1/1/11 12/31/12 1/1/15 12/31/16
Con
cent
ratio
n (µ
g/L)
Date
21-002 TCE
PC - 0 TCE
10-895
TCE MCL
open symbols denote non-detect results
K-1070-A Remediation

Oak Ridge Reservation Annual Site Environmental Report—2017
East Tennessee Technology Park 3-73
K-770 area – Exit pathway groundwater monitoring is also conducted at the K-770 area, where wells UNW-013 and UNW-015 are used to assess radiological groundwater contamination along the Clinch River (Figure 3.35). Measured alpha- and beta-activity levels were below screening levels during FY 2017. Figure 3.41 shows the history of measured alpha and beta activity in this area. Analytical results show that alpha activity was not detected in samples from well UNW-013 during FY 2017, although beta activity was present with a maximum detected value of 37.9 pCi/L. Trace levels of 90Sr (0.371 J pCi/L) and 238Pu (0.178 pCi/L) and 53.7 pCi/L of 99Tc were detected in UNW-013 during FY 2017. Results from well UNW-015 showed alpha activity (maximum of 12.7 pCi/L), beta activity (single detection of 2.8 J pCi/L), trace levels of 90Sr (0.471 J pCi/L), 232Th (0.0684 pCi/L) and 234U, 235U, and 238U (7.74, 0.456, and 5.29 pCi/L, respectively). All of the detected radionuclides occur at concentrations much less than water quality criteria.
Figure 3.41. History of measured alpha and beta activity in the K-770 area
3.6.6.2 Tc-99 in ETTP site groundwater Technetium-99 is a beta particle-emitting radionuclide. There is not a specific drinking water MCL for 99Tc, but its MCL-DC concentration is 900 pCi/L. Technetium-99 has been a known groundwater contaminant at the ETTP site for many years. Past CERCLA investigations have sampled and analyzed for 99Tc in groundwater. In the past, the highest 99Tc activity levels (as high as 6,000+ pCi/L) have been observed beneath the K-1070-A Burial Ground, where concentrations at a couple of wells remain in the 200–500 pCi/L range. The area along Mitchell Branch near the former K-1407 Ponds has residual 99Tc-contaminated groundwater from the operational era of the ponds, and possibly from K-1420, with much lower activity levels (< 100 pCi/L). The K-25 building also contained some areas with elevated levels of 99Tc. These areas were exposed to the environment during the demolition of the building.

Oak Ridge Reservation Annual Site Environmental Report—2017
East Tennessee Technology Park 3-74
Background The environmental fate of some metal contaminants in groundwater is strongly dependent on the pH and oxidation-reduction potential state of the water. A summary review of the environmental behavior of 99Tc in the environment was published by Pacific Northwest National Laboratory (PNNL; PNNL-15372) related to tank wastes at Hanford. Background information from that report is used in preparation of the following interpretation of potential 99Tc mobility in groundwater at the ETTP site.
Under electrochemically oxidizing conditions, technetium forms the negatively charged pertechnetate ion (TcO4¯) with technetium assuming a valence of 7+. The pertechnetate ion is quite mobile in aqueous settings since negatively charged ions do not tend to adsorb to mineral surfaces in soil or rock, which inherently tend to have negatively charged to neutrally charged surfaces. Under electrochemically reducing conditions, the pertechnetate ion is not stable and technetium may assume a 4+ valence. In the 4+ valence state, technetium may form ionic combinations with oxygen and hydroxyl groups, which may be amorphous solids with lower solubilities than the pertechnetate ion. In the 4+ valence, in the absence of complexing ligands, technetium may adsorb to mineral and organic matter surfaces, and may become bound in low solubility technetium oxyhydroxides. In the 4+ valence, technetium may also form soluble complexes with carbonate/bicarbonate ions as well as sulfate. Thermodynamic and directly measured speciation and solubility relationships for technetium carbonate and sulfate complexes have not been established, although these complexes may be important to technetium mobility in reducing electrochemical environments.
In addition to standard physical chemical conditions, microbial processes are important as potential mediators that can lead to reduction of technetium from the highly soluble and mobile 7+ valence in the pertechnetate ion to the 4+ valence in the lower solubility forms. Microbial processes often occur in very localized regions in the subsurface where chemical conditions are favorable. This fact is evident in groundwater at the ETTP site where intrinsic microbial communities are known to slowly degrade chlorinated organic compounds in some areas but not in other areas. Factors that may favor microbial reduction of dissolved compounds include relatively slow groundwater movement, which limits influx of dissolved oxygen via groundwater recharge; presence of organic carbon that can serve as electron donor material; and presence of microbes capable of affecting the required molecular transformations.
FY 2017 distribution of 99Tc in ETTP site groundwater During demolition of the K-25 building east wing in the winter of 2013, fugitive dust suppression misting and rainfall carried 99Tc off the work area. Contaminated runoff apparently percolated through soil and into subsurface utility lines and probably into backfill surrounding the buried utilities. Groundwater sampling for 99Tc was increased in wells in the general vicinity of the east wing and where wells were available along potential groundwater transport pathways.
Investigations conducted to understand the movement of 99Tc away from the K-25 building east wing area documented that contamination entered and traveled through the sanitary sewer and the storm water outfall that discharges to the K-1007-P1 Holding Pond and that the amount of 99Tc transport in backfill outside those pipes was minimal. The investigation also found that 99Tc transport through the abandoned underground electrical ductbank was an important transport pathway along the east side of the K-25 building as far south as ductbank manhole row 21. RAs conducted in Zone 1 included plugging the ductbank manholes with cement grout from row 21 to the south and west to the former steam plant located near the Clinch River in the K-770 Area. To minimize the remaining available transport flow path, 38 additional manholes in Zone 2 were grouted starting with manhole row 22, moving northward all the way through the demolition area and beyond. Since chlorinated VOCs are the most common groundwater contaminant at ETTP, groundwater at all locations was sampled and analyzed for these contaminants. VOCs were found to not be significant contaminants in any of the groundwater.

Oak Ridge Reservation Annual Site Environmental Report—2017
East Tennessee Technology Park 3-75
During FY 2017, groundwater was analyzed for 99Tc in samples from 80 wells and two springs across the ETTP area. The highest concentrations remain centered along the eastern side of the former K-25 building. Concentrations of 99Tc have decreased significantly in the area east of K-25. Monitoring in the vicinity of the K-27 D&D project has shown an increase in 99Tc concentrations in area groundwater, although levels are currently well below the MCL-DC.
3.7 Biological Monitoring The ETTP BMAP consists of two tasks designed to evaluate the effects of ETTP historical legacy operations on the local environment, identify areas where abatement measures would be most effective, and test the efficacy of the measures. The results from this program will support future CERCLA cleanup actions. These tasks are (1) bioaccumulation studies, and (2) instream monitoring of biological communities. Figure 3.42 shows the major water bodies at ETTP and Figure 3.43 shows the BMAP monitoring locations along Mitchell Branch.
3.7.1 Bioaccumulation Studies
The bioaccumulation task includes monitoring of caged Asiatic clams (Corbicula fluminea) (Figure 3.44) placed at selected locations around ETTP, and the collection and analysis of fish from Mitchell Branch and three major ponds on the site. Both clams and fish from uncontaminated offsite locations are also analyzed as points of reference. While historically, the primary COC for the bioaccumulation task at ETTP has been PCBs, in recent years mercury has been added to the list of legacy COCs at selected locations.
In 2017, the clams were deployed for 4 weeks. They were then retrieved and soft tissues were extracted and analyzed for PCBs (as Aroclors; Figure 3.45) and, at all but one of the sites, for total and methylmercury (Figure 3.46). In general, there is significant variability in PCB concentrations in the clams from year to year. In 2017, the highest concentrations of PCBs were found in the clams from Storm Water Outfall 100 (1.99 µg/g and 4.61 µg/g in upper and lower Outfall 100, respectively) and in the K-1007-P1 Holding Pond. These concentrations were significantly higher than in 2016 and in recent years, as concentrations in the clams from these locations had been decreasing since 2009. The concentrations of PCBs in the clams from the Mitchell Branch sites saw a slight increase in the 2016 monitoring, but concentrations seen in 2017 were back to levels comparable to those seen in 2015.
Clams from the Mitchell Branch watershed, the K-901-A and K-1007-P1 ponds, and two oil separators (K-897-J and K-897-K) were analyzed for mercury (both total mercury and methylmercury) in 2017. The highest mean total mercury concentrations were found in the clams from storm water Outfall 180 (0.105 µg/g) which was similar to the results from the 2016 monitoring. Clams from the section of Mitchell Branch between K-1700 and Outfall 190 also had elevated concentrations, ranging from a low of 0.027 µg/g to a high of 0.043 µg/g. At other sites, mercury concentrations in clams were comparable to, or lower than, reference site values (e.g., from 0.013 µg/g to 0.021 µg/g). Clams were also analyzed for methylmercury, which typically makes up a small fraction of the total mercury in clams. Methylmercury concentrations in clams deployed in 2017 ranged from a low of 0.003 µg/g in the clams from K-897-K, to a high of 0.011 µg/g in the clams from MIKs 0.3 and 0.4. In most instances, the methylmercury concentrations were only slightly elevated with respect to concentrations seen in the clams from the reference locations (an average of 0.0045 µg/g).

Oak Ridge Reservation Annual Site Environmental Report—2017
East Tennessee Technology Park 3-76
Figure 3.42. Water bodies at the East Tennessee Technology Park

Oak Ridge Reservation Annual Site Environmental Report—2017
East Tennessee Technology Park 3-77
BMAP = Biological Monitoring and Abatement Program, MIK = Mitchell Branch kilometer, and SD = storm drain/storm water
outfall
Figure 3.43. Major storm water outfalls and biological monitoring locations on Mitchell Branch
Bioaccumulation monitoring in the K-1007-P1 pond, K-901-A pond, K-720 slough, and Mitchell Branch involves sampling fish (Figure 3.47) and analyzing the tissues for PCB concentrations (Figure 3.48). Typically, fillets of game fish are used as a monitoring tool to assess human health risks, while whole-body composites of forage fish are used to assess ecological risks associated with exposure to PCBs. Target species vary from site to site, depending upon the habitat. The target species for bioaccumulation monitoring in 2017 in the K-1007-P1 pond was bluegill sunfish (Lepomis macrochirus) (Figure 3.49). In Mitchell Branch, the target species was the redbreast sunfish (Lepomis auritus). In the K-901-A pond and the K-720 slough, the target species were the gizzard shad (Dorosoma cepedianum) and largemouth bass (Micropterus salmoides). As there were not enough largemouth bass, carp (Cyprinus carpio) were also collected.
Whole body samples (6 composites of 10 bluegill each) and fillets from 20 individual bluegills were analyzed for PCBs to assess the ecological and human health risks associated with PCB contamination in the K-1007-P1 pond. Whole body bluegill composites from the K-1007-P1 pond averaged 2.58 µg/g total PCBs, a slight increase from the 1.91 µg/g seen in 2016. Fillets averaged 0.95 µg/g total PCBs, slightly lower than concentrations seen in 2016 (1.06 µg/g). Average PCB concentrations in sunfish fillets collected in Mitchell Branch were 2.17 µg/g, slightly higher than the levels seen in 2016 (1.95 µg/g). The concentrations observed in fillets of largemouth bass from the K-901-A pond (1.26 µg/g) increased slightly from the concentrations seen in the 2016 monitoring, 0.90 µg/g. Fillets of carp from the K-901-A pond averaged 1.28 µg/g, essentially unchanged from last year. Gizzard shad whole body composite samples from K-901-A pond (3.77 µg/g) decreased slightly from the concentrations seen in the 2016 monitoring (4.52 µg/g). Levels of PCBs in bass, gizzard shad, and carp from the K-720 slough (0.10 µg/g,

Oak Ridge Reservation Annual Site Environmental Report—2017
East Tennessee Technology Park 3-78
0.40 µg/g, and 0.46 µg/g, respectively) were considerably lower than for the same species from the K-901-A pond, and except for a slight increase in the concentrations in carp were little changed from 2016.
Figure 3.44. Asiatic clam (Corbicula fluminea)
N = 2 composites of 10 clams each per year. Shown in yellow are data for clams collected from the reference site, Little Sewee Creek (Sweetwater, Tennessee). Total PCBs defined as the sum of Aroclors 1248, 1254, and 1260.
MIK = Mitchell Branch kilometer
Figure 3.45. Mean total polychlorinated biphenyl (PCB) (µg/g, wet wt; 1993–2017) concentrations in the soft tissues of caged Asiatic clams deployed in Mitchell Branch

Oak Ridge Reservation Annual Site Environmental Report—2017
East Tennessee Technology Park 3-79
N = 2 composites of 10 clams each per year. Shown in yellow are data for clams collected from the reference site,
Little Sewee Creek (Sweetwater, Tennessee). MIK = Mitchell Branch kilometer
Figure 3.46. Mean total mercury (µg/g wet wt; 2009–2017) concentrations in the soft tissues of caged Asiatic clams deployed in Mitchell Branch
Figure 3.47. Fish bioaccumulation sampling at K-1007-P1 pond

Oak Ridge Reservation Annual Site Environmental Report—2017
East Tennessee Technology Park 3-80
1989–2017, N = 6 fish per year. Shown in red is the fish advisory level for PCBs (1 µg/g).
Figure 3.48. Mean (+/- standard error) polychlorinated biphenyl (PCB) concentrations (µg/g, wet wt) in redbreast sunfish fillets in Mitchell Branch (MIK 0.2)
Figure 3.49. Bluegill sunfish (Lepomis macrochirus)
In addition to being analyzed for PCBs, select species collected from several locations were analyzed for total mercury (Figure 3.50). Previous studies have shown that methylmercury accounts for more than 95 percent of the total mercury in fish, so a separate analysis for methylmercury was not conducted. The EPA’s recommended limit for mercury in fish fillets is 0.3 µg/g. The mean mercury concentration in sunfish fillets collected at MIK 0.2 was 0.52 µg/g in 2017, an increase from 0.41µg/g in 2016. Average mercury concentrations in fish in Mitchell Branch in recent years have ranged between 0.3 µg/g and 0.5 µg/g, with about 10–20 percent variability within the annual collection. Fillets of sunfish from the reference site, Hinds Creek, averaged 0.08 µg/g of mercury in 2017, essentially unchanged from 2016.

Oak Ridge Reservation Annual Site Environmental Report—2017
East Tennessee Technology Park 3-81
1989–2017, N = 6 fish per year. Shown in red is the fish advisory level mercury (0.3 µg/g).
Figure 3.50. Mean total mercury (Hg) concentrations (µg/g, wet wt) in redbreast sunfish fillets in Mitchell Branch (MIK 0.2)
3.7.2 Instream Monitoring of Biological Communities
In May 2017, the benthic macroinvertebrate community at four Mitchell Branch locations (MIKs 0.4, 0.7, 0.8, and 1.4) was sampled using standard quantitative techniques (Figure 3.51). MIK 1.4 was the reference location. Results of monitoring in 2017 using the ORNL protocols show that the taxa richness and Ephemeroptera, Plecoptera, and Trichoptera (EPT) taxa richness were more variable than what has typically been seen at the same locations. At all four locations, taxa richness, EPT richness, total density, and taxa-specific densities all decreased to some degree from 2016 to 2017. The reference location, MIK 1.4, had the lowest total richness of the four Mitchell Branch locations, and the EPT richness was considerably lower at MIK 1.4 than at MIK 0.7 and MIK 0.8. This is a change from the previous years of monitoring results, which typically have shown similar values for taxa richness, EPT richness, and EPT density at MIK 1.4, MIK 0.7, and MIK 0.8. In particular, total taxa richness at MIK1.4 has never dropped below values at MIK 0.4 during the period of sampling. Furthermore, values of taxa richness at MIK1.4 in 2017 have not been observed at the site since the mid-1990s. The total density at MIK 1.4 showed a marked decrease from 2016 to 2017. The physical condition of MIK 1.4 (very shallow with low flow, fine sediments, and unstable stream banks) coupled with the drought of 2016 followed by the higher than normal precipitation of early 2017 is thought to be the cause of many of these changes. The number of pollution-intolerant species is highest at MIK 1.4 (Figure 3.52), as has been the case for some time. Pollution-tolerant species make up a higher percentage of the total number of individuals at MIK 0.4, MIK 0.7, and MIK 0.8. However, at MIK 0.7 and MIK 0.8 the percent abundance of pollution-tolerant taxa decreased approximately 50 percent from 2016 to 2017.

Oak Ridge Reservation Annual Site Environmental Report—2017
East Tennessee Technology Park 3-82
Since August 2008, TDEC protocols, which assess both community and habitat characteristics, have also been used at the MIK 0.4, 0.7, and 0.8 monitoring locations. Beginning in August 2009, the use of TDEC protocols was expanded to include MIK 1.4 as well (Figure 3.53). The 2017 biotic index indicated that the communities at MIKs 0.4 and 0.7 were nonimpaired, the community at MIK 0.8 was slightly impaired, and the community at MIK 1.4 was moderately impaired. The habitat assessment (which primarily considers the physical aspects of the stream to determine its suitability to support biological communities) in 2017 indicated habitat impairment at all four Mitchell Branch locations. Overall, results using TDEC’s semiquantitative protocols and ORNL’s quantitative protocols since 2008 have been in general agreement that the macroinvertebrate community at MIK 0.4 scores from slightly to moderately impaired, and the communities at MIKs 0.7 and 0.8 score from slightly impaired to unimpaired.
Figure 3.51. Benthic macroinvertebrate sampling in Mitchell Branch
Fish communities in MIKs 0.4 and 0.7 and at local reference sites were sampled in 2017. In Mitchell Branch, species richness (number of species; Figure 3.54), density (fish/m²; Figure 3.55), and biomass were assessed for comparison with area reference streams. Results for 2017 showed changes within the normal range of variation for species richness. However, most of the species found during the community studies sampling tend to be more tolerant of less than optimal conditions. At the most downstream site (MIK 0.4), species richness decreased by one species from 2016, with a slight decrease in both density and biomass, compared with the results from 2016. Species richness at MIK 0.7 was unchanged from 2016, but density and biomass saw a significant decrease. As was the case with the benthic macroinvertebrate communities, the drought of 2016 followed by the increased precipitation of early 2017 would have stressed the fish communities. Overall, variations in species richness, density, and biomass are typical of streams that have been severely impacted and are still recovering. While the condition of the fish communities over the last several years has been relatively stable, they have yet to reach conditions typical of less impacted streams in the area; and the stream is still dominated by more tolerant fish species.
Similar to stream sampling, the K-1007-P1 pond is sampled annually to assess the diversity and density of resident fish populations. The pond is isolated from Poplar Creek by a weir grate at the outfall, preventing migration of fish into or out of the pond. Remediation efforts in 2007 focused on creating a fish community dominated by short-lived sunfish. Before remediation activities, the fish community contained high densities of predatory fish, as well as grazers, which fed on phytoplankton. In 2017, the fish
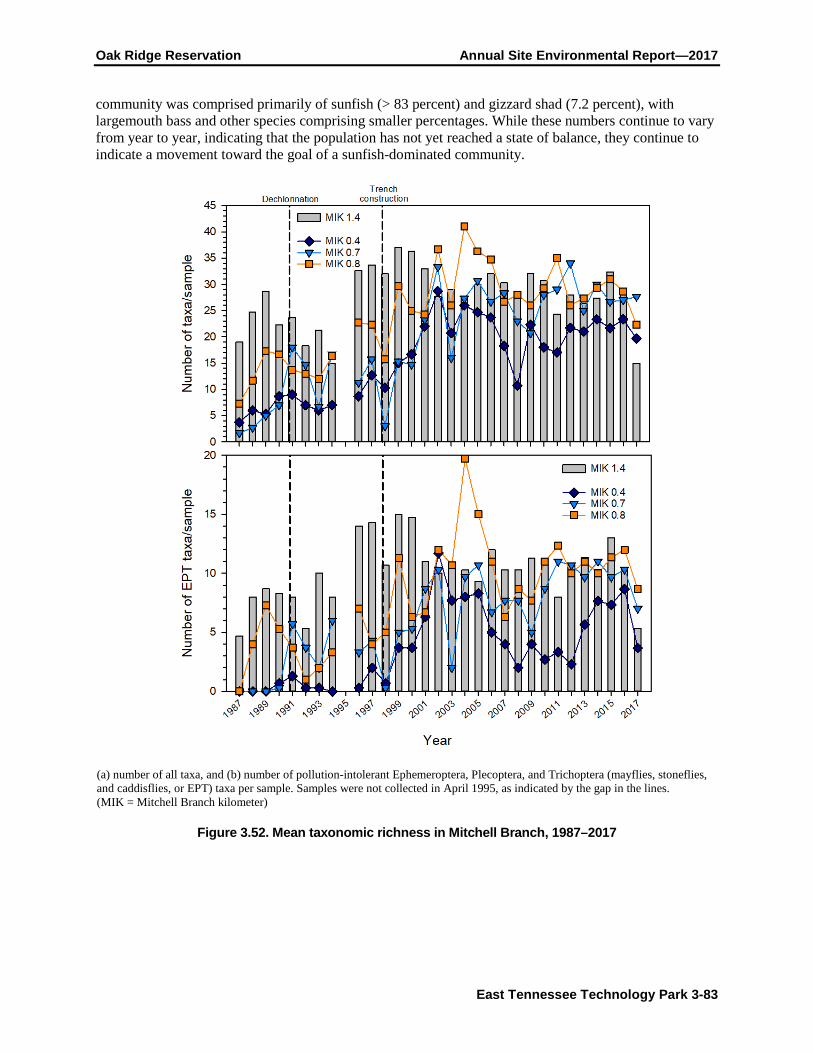
Oak Ridge Reservation Annual Site Environmental Report—2017
East Tennessee Technology Park 3-83
community was comprised primarily of sunfish (> 83 percent) and gizzard shad (7.2 percent), with largemouth bass and other species comprising smaller percentages. While these numbers continue to vary from year to year, indicating that the population has not yet reached a state of balance, they continue to indicate a movement toward the goal of a sunfish-dominated community.
(a) number of all taxa, and (b) number of pollution-intolerant Ephemeroptera, Plecoptera, and Trichoptera (mayflies, stoneflies, and caddisflies, or EPT) taxa per sample. Samples were not collected in April 1995, as indicated by the gap in the lines. (MIK = Mitchell Branch kilometer)
Figure 3.52. Mean taxonomic richness in Mitchell Branch, 1987–2017

Oak Ridge Reservation Annual Site Environmental Report—2017
East Tennessee Technology Park 3-84
Horizontal lines in both graphs show the lower thresholds for narrative index ratings; respective narrative ratings for each threshold are shown on the right side of each graph. MIK = Mitchell Branch kilometer
Figure 3.53. Temporal trends in Tennessee Department of Environment and Conservation (TDEC) Benthic Macroinvertebrate Biotic Index (a) and Stream Habitat Index (b) scores for Mitchell Branch,
August 2008–2017

Oak Ridge Reservation Annual Site Environmental Report—2017
East Tennessee Technology Park 3-85
ISK = Ish Creek kilometer, MBK = Mill Branch kilometer, MIK = Mitchell Branch kilometer, SCK = Scarboro Creek kilometer
Figure 3.54. Species richness for fish communities at sites in Mitchell Branch and in reference streams
ISK = Ish Creek kilometer, MBK = Mill Branch kilometer, MIK = Mitchell Branch kilometer, SCK = Scarboro Creek kilometer
Figure 3.55. Density for fish communities at sites in Mitchell Branch, and in reference streams

Oak Ridge Reservation Annual Site Environmental Report—2017
East Tennessee Technology Park 3-86
3.8 Environmental Management and Waste Management Activities
3.8.1 Waste Management Activities
Restoration of the environment, D&D of facilities, and management of legacy wastes constitute the major operations at ETTP.
CWTS is a small water treatment unit for chromium-contaminated groundwater that sits within the existing CNF footprint. CWTS came online in late 2012, and handles purge water from groundwater monitoring, as well as the chromium collection system water. Effluent from CWTS discharges into the Clinch River through an existing CNF discharge line. Section 3.6.4.1 provides a more detailed discussion of CWTS operations.
3.8.2 Environmental Remediation Activities
The Oak Ridge Office of Environmental Management (OREM) is performing a groundwater treatability study that will help determine the effectiveness of different in situ groundwater treatment technologies that will assist in identifying and selecting ETTP’s final groundwater remedy. Phase 1 of the study, which included the characterization of a groundwater contamination source in the K-1401 area, was completed in FY 2010. The study resumed in FY 2016 and involved characterization to support the design of a pilot scale in situ thermal treatment study in the K-1401 area. In 2017, 18 investigative groundwater boreholes were installed and 14 existing Phase 1 boreholes reconfigured to allow monitoring of discrete levels. Seven pump test/observation wells were also installed in preparation for hydraulic testing. Innovative technologies—including Rotosonic drilling, rock core dye testing, flexible underground liner technology, and real time analysis—were used to determine the extent of contamination and to confirm the presence of DNAPLs in the K-1401 area.
Upcoming work includes the hydraulic testing, data evaluation, and planning for the pilot scale thermal demonstration.
UCOR’s soil remediation efforts at ETTP are helping to prepare the site for future commercial industrial use. The site is divided into two cleanup regions: Zone 1, a 1,400-acre area outside the main plant area, and Zone 2, the 800-acre area that comprises the main plant area. The areas in these zones are divided into exposure units (EUs) that vary in size.
3.8.2.1 Zone 1 The Interim ROD, which documents the cleanup method for Zone 1, requires OREM to remediate soil for the protection of groundwater and a future industrial workforce, and to maintain land use controls. In FY 2017, remediation was completed in EU Z1-50, where the K-1066-K Cylinder Storage Yard is located, opening its 4.8 acres for industrial use. During 2016, OREM prepared the Zone 1 Final Soils Proposed Plan, and EPA and TDEC approved it. In FYs 2017 and 2018, OREM prepared the Final Soil ROD to finalize the remediation of soil for recreational use, industrial use, and ecological protection, and provided it to EPA and TDEC for review and approval.
3.8.2.2 Zone 2 The Zone 2 ROD requires OREM to remediate soil for the protection of an industrial workforce and groundwater and divides the zone into 44 EUs that range in size from 6 to 38 acres. In FY 2017, characterization of EUs Z2-12, -14, and -19 was completed, and remediation of EUs Z2-17, -20, -22, -28, -29, and -41 was completed. Following remediation, these two EUs were recommended for unrestricted industrial use. The Building K-27 slab is in EU Z2-14.

Oak Ridge Reservation Annual Site Environmental Report—2017
East Tennessee Technology Park 3-87
3.8.2.3 Support Facilities Demolition UCOR completed demolition of Buildings K-731, the K-832 complex, K-833, K-1028-81 and K-1028-64 following demolition of Building K-27. These mark the first post-Vision 2016 demolition projects that significantly move OREM closer to its Vision 2020: the goal to complete cleanup of ETTP by the end of CY 2020.
Constructed in 1944, Building K-731 Electrical Switch House provided electrical power to the K-27 process building. The building was extended east in 1949 to provide electricity to the K-29 process building. Building K-731 was a brick and concrete structure with two main floors, three 3rd floor penthouses, and a below-grade basement each measured 31,000 ft2. The building was demolished to grade, the floor removed, and the basement area backfilled. The demolition area was then graded, topsoil added and the grounds reseeded.
Shortly after the demolition of Building K-731, crews mobilized to Building K-1028-64, Portal 9 to demolish this structure. Portal 9 was a permanent guardhouse located southwest of the K-27 Process Building. The guardhouse was built in 1973 and was 160 ft2. Building K-1028-81, Portal 19, and Building K-833, and the Cooling Water Return Pump House also were demolished in 2017, which concluded the removal of ancillary buildings associated with the K-27 process building.
The K-832 RWC complex was built in 1945-1946 to provide recirculating cooling water to the enrichment cascades. The K-832 RCW complex included Building K-832, 11,000 ft2 Recirculating Water Pump House, K-832-B, Sprinkler Valve House, K-832-H, 5,500 ft2 Cooling Tower Superstructure, and K-832-S, Acid Tank. The complex was shut down in 1985 when Building K-25 ceased operations. The K-832 facilities were demolished in 2017.
3.8.2.4 Building K-1037 Deactivation Continues UCOR continued deactivation work in Building K-1037 in FY 2017. Deactivation is the initial step that prepares the facility for eventual demolition. The facility manufactured all of the barrier material used in the gaseous diffusion process since 1947. This material was a key component of the gaseous diffusion process when workers separated the 235U and 238U isotopes.
K-1037 was once a warehouse, which was later converted into a facility that produced the porous barrier material used in the separation process.
Crews completed asbestos-abatement activities identified in the original scope; however, as items such as loose equipment were removed throughout the building, additional asbestos was uncovered, so abatement work and loose equipment removal activities continued into 2018. In addition, a tremendous amount of effort was dedicated to the removal of excess chemicals throughout the facility. Over 1400 chemicals have been collected, sampled, and prepared for disposal. Demolition is scheduled to begin in 2018.
3.8.2.5 Poplar Creek Deactivation Continues At the end of FY 2017, OREM had completed 67 percent of the deactivation and continued characterization for the Poplar Creek facilities of ETTP. Deactivation involves disconnecting utilities to the facilities, removing certain components, and performing other steps necessary to prepare the buildings for demolition. The 52 Poplar Creek facilities supported operations at the site and included storage buildings that housed process equipment, water pump houses, and sandblasting/painting buildings.
Demolition of the tie lines in the Poplar Creek area continued in 2017, with approximately 31,000 linear feet (LF) removed, with the remaining 12,000 ft to be demolished in FY 2018. These tie lines connected

Oak Ridge Reservation Annual Site Environmental Report—2017
East Tennessee Technology Park 3-88
the K-27 and K-31 gaseous diffusion buildings and carried enriched uranium from one building to another as the uranium moved through the enrichment process. Workers have been injecting foam into these lines to stabilize the contaminants so they will meet the criteria necessary for disposal in the onsite EMWMF and installing contamination liners and pads to prevent contamination of surrounding soil during demolition.
3.8.2.6 Central Neutralization Facility Deactivation Continues CNF was a wastewater treatment facility for industrial wastewater generated at ETTP. CNF was constructed in stages from 1945 to 2000. In 2013, CNF was decommissioned and the NPDES-permitted facility water treatment equipment was cleaned of all hazardous waste contamination.
In 2017, characterization of CNF for the disposal of demolition debris was completed and removal of legacy waste, universal waste, and fixed equipment was nearly complete in preparation for the demolition of CNF.
3.8.2.7 Commemoration of the K-25 Site National historic preservation initiatives at ETTP reached a milestone in FY 2017 with completion of design activities. Following classification and non-proliferation reviews, final design documents were released to the Historic Preservation Consulting Parties in January 2017 for review and comment. Issued for Construction design packages for historic preservation facilities and exhibits were finalized in April 2017.
Consulting Parties to K-25 historic preservation activities participated in a meeting on July 27, 2017, to review the current condition of the K-25 building footprint. The highlight of the meeting was an opportunity to tour the building footprint and walk on portions of the original concrete slab. Following the tour, NPS staff facilitated discussions on plans for preservation and public use of the K-25 building footprint.
At the close of the FY, activities were underway to procure the services of construction and exhibit fabrication support subcontractors for the History Center work. Construction of the Equipment Building and Viewing Tower is planned for FY 2018.
Visitors to the K-25 History Center will be invited to explore the rich history of this Manhattan Project site. This facility will feature a theatre experience, period artifacts, equipment replicas, and workers’ oral histories, placing K-25 in its proper historical context in World War II and the Cold War. An in-depth look at gaseous diffusion, the thousands of equipment stages housed in K-25, and the people who sacrificed to make it a reality, will be highlighted. The Equipment Building and Viewing Tower design replicates the exterior appearance of the K-25 building, and will house a representative cross-section of gaseous diffusion technology. An enclosed observation deck will provide a 360-degree view of the site.
3.8.3 Reindustrialization
As cleanup has progressed extensively at ETTP, more large parcels are becoming available for transfer to the private and commercial industrial sectors. In 2017, DOE completed transfer of 185 acres in the former K-33/K-31 Area to CROET. This transfer is the second largest transfer in the history of the program, and the largest at ETTP Heritage Center. Because of the ample utility infrastructure at the K-33/K-31 Area, this area could potentially host a large-scale industrial project, which makes it the most desirable for redevelopment at the site. Additionally, a large area of 170 acres at the southeast corner of ETTP has been approved for transfer to Metropolitan Knoxville Airport Authority for a potential regional airport project. The general aviation airport runway will accommodate small corporate jets, private airplanes, and EMS

Oak Ridge Reservation Annual Site Environmental Report—2017
East Tennessee Technology Park 3-89
aircraft. DOE completed an Environmental Assessment to support the property transfer and potential construction and operation of the airport. In 2017, DOE completed all of the approval requirements for the 200-acre Duct Island, which is now ready for transfer. DOE has also received EPA and TDEC approval for future property transfer of the former Powerhouse Area, which is over 400 acres. The transfer of large parcels, as more of the site cleanup is completed, provides the best opportunities to date for industrial and commercial development of ETTP.
3.9 References
DOE. 1993. Record of Decision for the K-1407-B/C Ponds at the Oak Ridge K-25 Site, Oak Ridge, Tennessee. DOE/OR/02-1125&D3. US Department of Energy, Office of Environmental Management, Oak Ridge, Tennessee.
DOE. 1995. Remedial Action Report for the K-1407-B Holding Pond and the K-1407-C Retention Basin. DOE/OR/01-1371&D1. US Department of Energy, Office of Environmental Management, Oak Ridge, Tennessee.
DOE. 1998. Record of Decision for the K-1070-C/D Operable Unit, East Tennessee Technology Park, Oak Ridge, Tennessee. DOE/OR/02-1486&D4. US Department of Energy, Office of Environmental Management, Oak Ridge, Tennessee.
DOE. 2002. Remedial Action Report for the K-1070-C/D G-Pit and K-1071 Concrete Pad, East Tennessee Technology Park, Oak Ridge, Tennessee. DOE/OR/01-1964&D2. US Department of Energy, Office of Environmental Management, Oak Ridge, Tennessee.
DOE. 2005. Compliance Plan National Emission Standards for Hazardous Air Pollutants for Airborne Radionuclides on the Oak Ridge Reservation, Oak Ridge, Tennessee. DOE/ORO/2196. US Department of Energy, Oak Ridge Office, Oak Ridge, Tennessee.
DOE. 2007. Final Sitewide Remedial Investigation and Feasibility Study for East Tennessee Technology Park, Oak Ridge, Tennessee. DOE/OR/01-2279&D3, Volume 1. US Department of Energy, Office of Environmental Management, Oak Ridge, Tennessee.
DOE. 2008. Removal Action Work Plan for the Removal Action at the Ponds at the East Tennessee Technology Park, Oak Ridge, Tennessee. DOE/OR/01-2359&D2. US Department of Energy, Office of Environmental Management, Oak Ridge, Tennessee.
DOE. 2011a. Departmental Sustainability. DOE O 436.1. Approved 5-2-11. US Department of Energy, Washington, DC.
DOE. 2011b. Derived Concentration Technical Standard. DOE-STD-1196. US Department of Energy, Washington, DC.
DOE. 2012. Oak Ridge Reservation Polychlorinated Biphenyl Federal Facilities Compliance Agreement. ORR-PCB-FFCA. Revision 5, May 23, 2012. US Department of Environmental Protection Agency, US Department of Energy Oak Ridge Field Office, Oak Ridge, Tennessee.
DOE. 2013. Removal Action Report for the Long-Term Reduction of Hexavalent Chromium Releases into Mitchell Branch at the East Tennessee Technology Park, Oak Ridge, Tennessee. DOE/OR/01-2598&D2. US Department of Energy, Office of Environmental Management, Oak Ridge, Tennessee.
DOE. 2014. Remedial Investigation and Feasibility Study for the East Tennessee Technology Park, Oak Ridge, Tennessee. DOE/OR/01-2561&D3. US Department of Energy, Office of Environmental Management, Oak Ridge, Tennessee.

Oak Ridge Reservation Annual Site Environmental Report—2017
East Tennessee Technology Park 3-90
DOE. 2015. Memorandum of Agreement Between the United States Department of the Interior and the United States Department of Energy for the Manhattan Project National Historical Park, November 10, 2015, Washington, DC. URL: https://www.doi.gov/sites/doi.gov/files/uploads/Memorandum%20of%20Agreement%20for%20final%20signature%20November%2010%202015.pdf. Accessed July 16, 2018.
DOE. 2016. Oak Ridge Reservation Annual Site Environmental Report. DOE/ORO-251. US Department of Energy, Oak Ridge Office, Oak Ridge, Tennessee.
DOE. 2017. Federal Facility Agreement for the Oak Ridge Reservation. FFA-PM/17-001, DOE/OR-1014. Latest revision. US Department of Energy, Office of Environmental Management, Oak Ridge, Tennessee. Available online at www.ucor.com/ettp_ffa.html. Accessed July 16, 2018.
DOI. 2015. Manhattan Project National Historical Park, National Park Service. US Department of the Interior. URL: www.nps.gov/mapr/learn/management/index.htm. Accessed July 16, 2018.
EO 13423. Strengthening Federal Environmental, Energy, and Transportation Management, January 24, 2007, Federal Register, Vol. 72(17).
EO 13514. Federal Leadership in Environmental, Energy, and Economic Performance, October 5, 2009, Federal Register, Vol. 74(194).
EO 13693. Planning for Federal Sustainability in the Next Decade, March 25, 2015, Federal Register, Vol 80(57).
EPA 1973. National Emission Standards for Hazardous Air Pollutants. April 6, 1973, 40 CFR Part 61. US Environmental Protection Agency, Washington, DC.
EPA 1978. Terminology and Index, “Categorical exclusion.” November 29, 1978, 40 CFR Part 1508.4. US Environmental Protection Agency, Washington, DC.
EPA 1979. Polychlorinated Biphenyls (PCBS) Manufacturing, Processing, Distribution In Commerce, And Use Prohibitions. May 31, 1979, 40 CFR Part 761. US Environmental Protection Agency, Washington, DC.
EPA. 1984. National Emission Standards for Hazardous Air Pollutants, “National Emission Standard for Asbestos,” April 5, 1984, 40 CFR Part 61, Subpart M. US Environmental Protection Agency, Washington, DC.
EPA. 1989. National Emission Standards for Emissions of Radionuclides Other Than Radon From Department of Energy Facilities. December 15, 1989, 40 CFR Part 61. US Environmental Protection Agency, Washington, DC.
EPA. 1992. NPDES Storm Water Sampling Guidance Document. EPA 833-B-92-001. US Environmental Protection Agency, Washington, DC.
EPA. 1993. Protection of Stratospheric Ozone, “Recycling and Emissions Reduction.” May 14, 1993, 40 CFR Part 82, Subpart F. US Environmental Protection Agency, Washington, DC.
EPA. 1994. Chemical Accident Prevention Provisions. January 31, 1994, 40 CFR Part 68. US Environmental Protection Agency, Washington, DC.
EPA. 2002. Method 1631, Revision E: Mercury in Water by Oxidation, Purge and Trap, and Cold Vapor Atomic Fluorescence Spectrometry. EPA-1631. US Environmental Protection Agency, Washington, DC.
EPA. 2009. Mandatory Greenhouse Gas Reporting. October 30, 2009, 40 CFR Part 98. US Environmental Protection Agency, Washington, DC.

Oak Ridge Reservation Annual Site Environmental Report—2017
East Tennessee Technology Park 3-91
EPA. 2015. Technical Standards And Corrective Action Requirements For Owners and Operators Of Underground Storage Tanks (UST). July 15, 2015, 40 CFR Part 280. US Environmental Protection Agency, Washington, DC.
EPA Form 2E, Application Form 2E—Facilities Which Do Not Discharge Process Wastewater; and EPA Form 2F, Application for Permit to Discharge Storm Water Discharges Associated with Industrial Activity. US Environmental Protection Agency, latest revision, Washington, DC. URL: www.epa.gov/npdes/npdes-application-forms. Accessed July 16, 2018.
ISO. 2015. Environmental management systems—Requirements with guidance for use. ISO 14001:2015. International Organization for Standardization, Geneva, Switzerland. URL: www.iso.org. Accessed July 16, 2018.
K-25 Virtual Museum 2015. K-25 Virtual Museum website. 2015. URS | CH2M Oak Ridge LLC, US Department of Energy, Oak Ridge, Tennessee. URL: k-25virtualmuseum.org/. Accessed July 16, 2018.NRCS. 1986. Urban Hydrology for Small Watersheds, Technical Release-55 (TR-55). Natural Resources Conservation Service, US Department of Agriculture, Washington, DC.
PNNL. 2005. Deutsch W.J., K.M. Krupka, K.J. Cantrell, C.F. Brown, M.J. Lindberg, H.T. Schaef, S.M. Heald, B.W. Arey, and R.K. Kukkadapu. Advances in Geochemical Testing of Key Contaminants in Residual Hanford Tank Waste. November 4, 2005, PNNL-15372. Pacific Northwest National Laboratory, Richland, Washington.
POL-UCOR-007. Environmental Management and Protection. Latest revision. URS | CH2M Oak Ridge LLC, Oak Ridge, Tennessee.
PPD-EH-1400. Integrated Safety Management System Description. Latest revision. URS | CH2M Oak Ridge LLC, Oak Ridge, Tennessee.
PROC-PQ-1401. Independent Assessment. Latest revision. URS | CH2M Oak Ridge LLC, Oak Ridge, Tennessee.
PROC-PQ-1420. Management and Self-Assessment. Latest revision. URS | CH2M Oak Ridge LLC, Oak Ridge, Tennessee.
PROC-TC-0702. Training Program. Latest revision. URS | CH2M Oak Ridge LLC, Oak Ridge, Tennessee.
Souza, Peter A., Glyn D. DuVall, and Melisa J. Hart. 2001. ORR Cultural Resource Management Plan, DOE Oak Ridge Reservation, Anderson and Roane Counties, Tennessee. DOE/ORO/2085. US Department of Energy, Washington, DC.
TDEC Rule 0400-18-01. Underground Storage Tank Program. September 26, 2012. Tennessee Department of Environment & Conservation, Nashville, Tennessee.
TDEC Rule 1200-3-11-08. Emission Standards for Emissions of Radionuclides Other Than Radon From Department of Energy Facilities. 1996. Tennessee Department of Environment & Conservation, Nashville, Tennessee.
UCOR. 2015. Quality Assurance Program Plan for Compliance with Radionuclide National Emission Standards for Hazardous Air Pollutants, East Tennessee Technology Park, Oak Ridge Tennessee. UCOR-4257/R1. URS | CH2M Oak Ridge LLC, Oak Ridge, Tennessee.
UCOR. 2017a. East Tennessee Technology Park Chromium Water Treatment System Sampling and Analysis Plan Oak Ridge, Tennessee. UCOR-4259/R4. URS | CH2M Oak Ridge LLC, Oak Ridge, Tennessee.

Oak Ridge Reservation Annual Site Environmental Report—2017
East Tennessee Technology Park 3-92
UCOR. 2017b. 2017 Cleanup Progress—Annual Report to the Oak Ridge Regional Community. OREM-17-2530. URS | CH2M Oak Ridge LLC, Oak Ridge, Tennessee.
UCOR. 2018. Pollution Prevention and Waste Minimization Program Plan for the East Tennessee Technology Park, Oak Ridge, Tennessee. UCOR-4127/R6. URS | CH2M Oak Ridge LLC, Oak Ridge, Tennessee.