Embed Size (px)
Citation preview
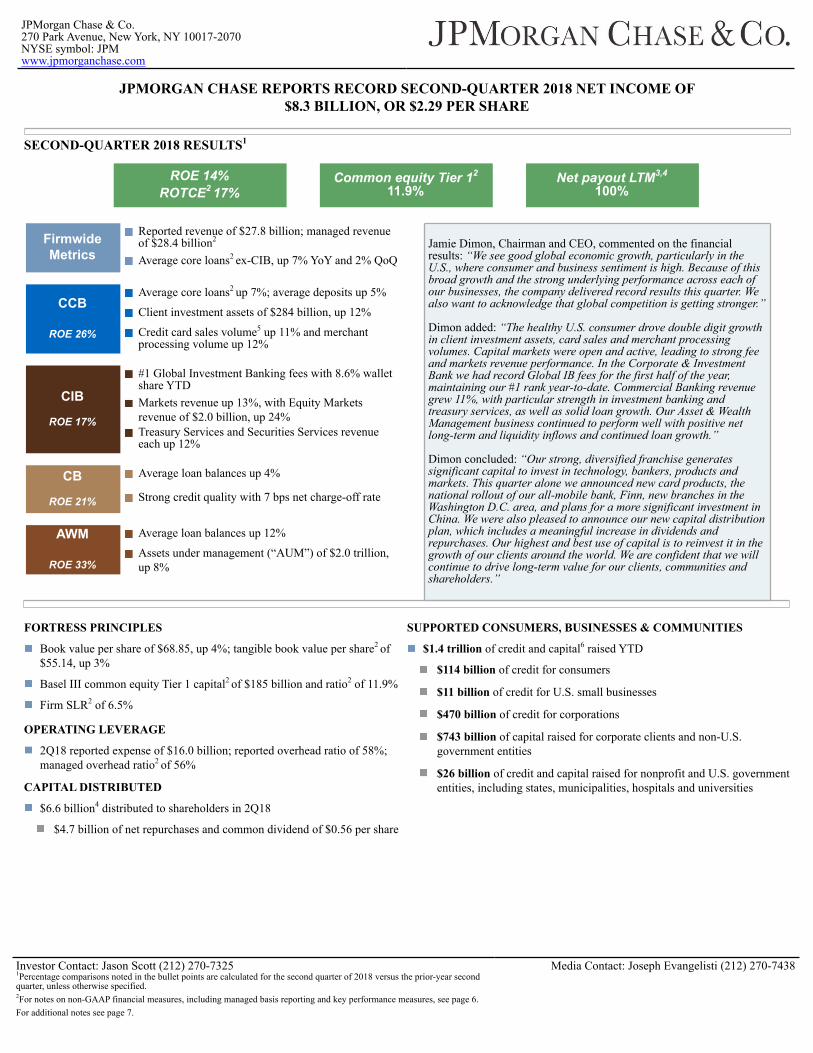
JPMorgan Chase & Co.270 Park Avenue, New York, NY 10017-2070NYSE symbol: JPMwww.jpmorganchase.com
Investor Contact: Jason Scott (212) 270-7325 1Percentage comparisons noted in the bullet points are calculated for the second quarter of 2018 versus the prior-year second quarter, unless otherwise specified. 2For notes on non-GAAP financial measures, including managed basis reporting and key performance measures, see page 6.For additional notes see page 7.
Media Contact: Joseph Evangelisti (212) 270-7438
JPMORGAN CHASE REPORTS RECORD SECOND-QUARTER 2018 NET INCOME OF$8.3 BILLION, OR $2.29 PER SHARE
SECOND-QUARTER 2018 RESULTS1
ROE 14%ROTCE2 17%
Common equity Tier 12
11.9%Net payout LTM3,4
100%
FirmwideMetrics
Reported revenue of $27.8 billion; managed revenue of $28.4 billion2
Average core loans2 ex-CIB, up 7% YoY and 2% QoQ
CCB
ROE 26%
Average core loans2 up 7%; average deposits up 5%
Client investment assets of $284 billion, up 12%
Credit card sales volume5 up 11% and merchant processing volume up 12%
CIB
ROE 17%
#1 Global Investment Banking fees with 8.6% walletshare YTDMarkets revenue up 13%, with Equity Marketsrevenue of $2.0 billion, up 24%Treasury Services and Securities Services revenueeach up 12%
CB
ROE 21%
Average loan balances up 4%
Strong credit quality with 7 bps net charge-off rate
AWM
ROE 33%
Average loan balances up 12%
Assets under management (“AUM”) of $2.0 trillion,up 8%
Jamie Dimon, Chairman and CEO, commented on the financial results: “We see good global economic growth, particularly in the U.S., where consumer and business sentiment is high. Because of this broad growth and the strong underlying performance across each of our businesses, the company delivered record results this quarter. We also want to acknowledge that global competition is getting stronger.”
Dimon added: “The healthy U.S. consumer drove double digit growth in client investment assets, card sales and merchant processing volumes. Capital markets were open and active, leading to strong fee and markets revenue performance. In the Corporate & Investment Bank we had record Global IB fees for the first half of the year, maintaining our #1 rank year-to-date. Commercial Banking revenue grew 11%, with particular strength in investment banking and treasury services, as well as solid loan growth. Our Asset & Wealth Management business continued to perform well with positive net long-term and liquidity inflows and continued loan growth.”
Dimon concluded: “Our strong, diversified franchise generates significant capital to invest in technology, bankers, products and markets. This quarter alone we announced new card products, the national rollout of our all-mobile bank, Finn, new branches in the Washington D.C. area, and plans for a more significant investment in China. We were also pleased to announce our new capital distribution plan, which includes a meaningful increase in dividends and repurchases. Our highest and best use of capital is to reinvest it in the growth of our clients around the world. We are confident that we will continue to drive long-term value for our clients, communities and shareholders.”
FORTRESS PRINCIPLES
Book value per share of $68.85, up 4%; tangible book value per share2 of $55.14, up 3%
Basel III common equity Tier 1 capital2 of $185 billion and ratio2 of 11.9%
Firm SLR2 of 6.5%
OPERATING LEVERAGE
2Q18 reported expense of $16.0 billion; reported overhead ratio of 58%; managed overhead ratio2 of 56%
CAPITAL DISTRIBUTED
$6.6 billion4 distributed to shareholders in 2Q18
$4.7 billion of net repurchases and common dividend of $0.56 per share
SUPPORTED CONSUMERS, BUSINESSES & COMMUNITIES
$1.4 trillion of credit and capital6 raised YTD
$114 billion of credit for consumers
$11 billion of credit for U.S. small businesses
$470 billion of credit for corporations
$743 billion of capital raised for corporate clients and non-U.S. government entities
$26 billion of credit and capital raised for nonprofit and U.S. government entities, including states, municipalities, hospitals and universities
JPMorgan Chase & Co.News Release
2
In the discussion below of Firmwide results of JPMorgan Chase & Co. (“JPMorgan Chase” or the “Firm”), information is presented on a managed basis, which is a non-GAAP financial measure. The discussion below of the Firm’s business segments is also presented on a managed basis. For more information about managed basis, and non-GAAP financial measures and key performance measures used by management to evaluate the performance of each line of business, see page 6.
Comparisons noted in the sections below are calculated for the second quarter of 2018 versus the prior-year second quarter, unless otherwise specified.
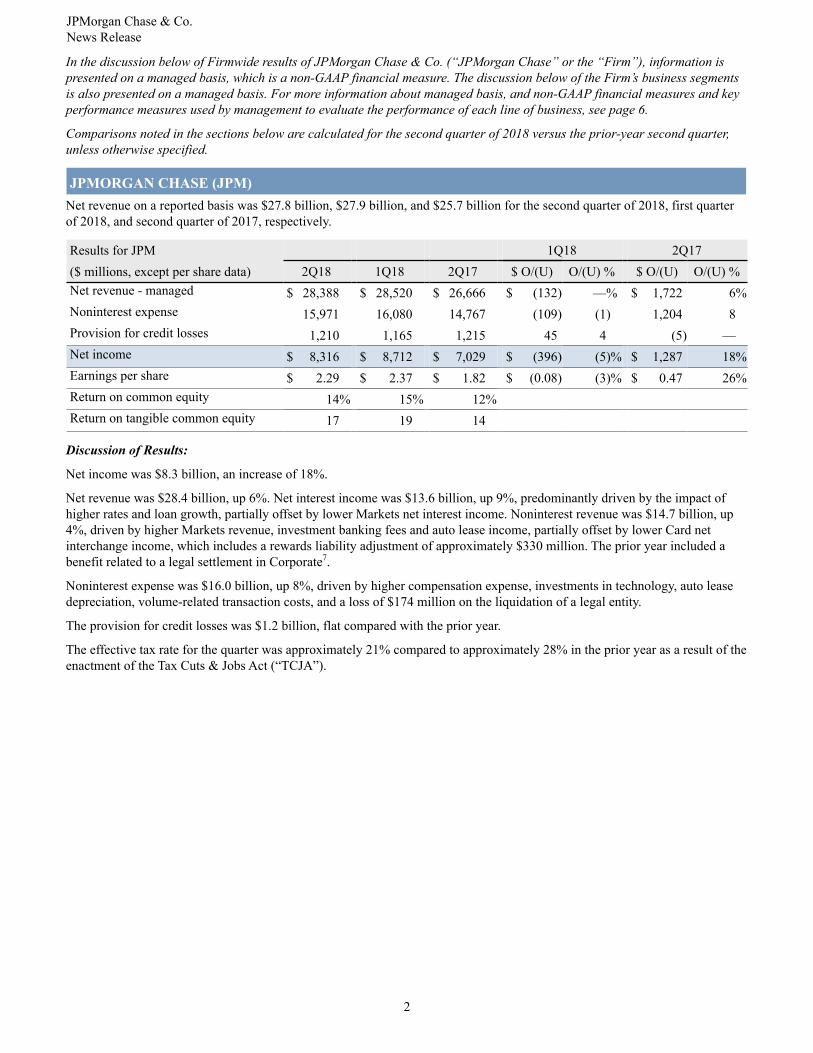
JPMORGAN CHASE (JPM)Net revenue on a reported basis was $27.8 billion, $27.9 billion, and $25.7 billion for the second quarter of 2018, first quarter of 2018, and second quarter of 2017, respectively.
Results for JPM 1Q18 2Q17($ millions, except per share data) 2Q18 1Q18 2Q17 $ O/(U) O/(U) % $ O/(U) O/(U) %Net revenue - managed $ 28,388 $ 28,520 $ 26,666 $ (132) —% $ 1,722 6%Noninterest expense 15,971 16,080 14,767 (109) (1) 1,204 8Provision for credit losses 1,210 1,165 1,215 45 4 (5) —Net income $ 8,316 $ 8,712 $ 7,029 $ (396) (5)% $ 1,287 18%Earnings per share $ 2.29 $ 2.37 $ 1.82 $ (0.08) (3)% $ 0.47 26%Return on common equity 14% 15% 12%Return on tangible common equity 17 19 14
Discussion of Results:
Net income was $8.3 billion, an increase of 18%.
Net revenue was $28.4 billion, up 6%. Net interest income was $13.6 billion, up 9%, predominantly driven by the impact of higher rates and loan growth, partially offset by lower Markets net interest income. Noninterest revenue was $14.7 billion, up 4%, driven by higher Markets revenue, investment banking fees and auto lease income, partially offset by lower Card net interchange income, which includes a rewards liability adjustment of approximately $330 million. The prior year included a benefit related to a legal settlement in Corporate7.
Noninterest expense was $16.0 billion, up 8%, driven by higher compensation expense, investments in technology, auto lease depreciation, volume-related transaction costs, and a loss of $174 million on the liquidation of a legal entity.
The provision for credit losses was $1.2 billion, flat compared with the prior year.
The effective tax rate for the quarter was approximately 21% compared to approximately 28% in the prior year as a result of the enactment of the Tax Cuts & Jobs Act (“TCJA”).
JPMorgan Chase & Co.News Release
3
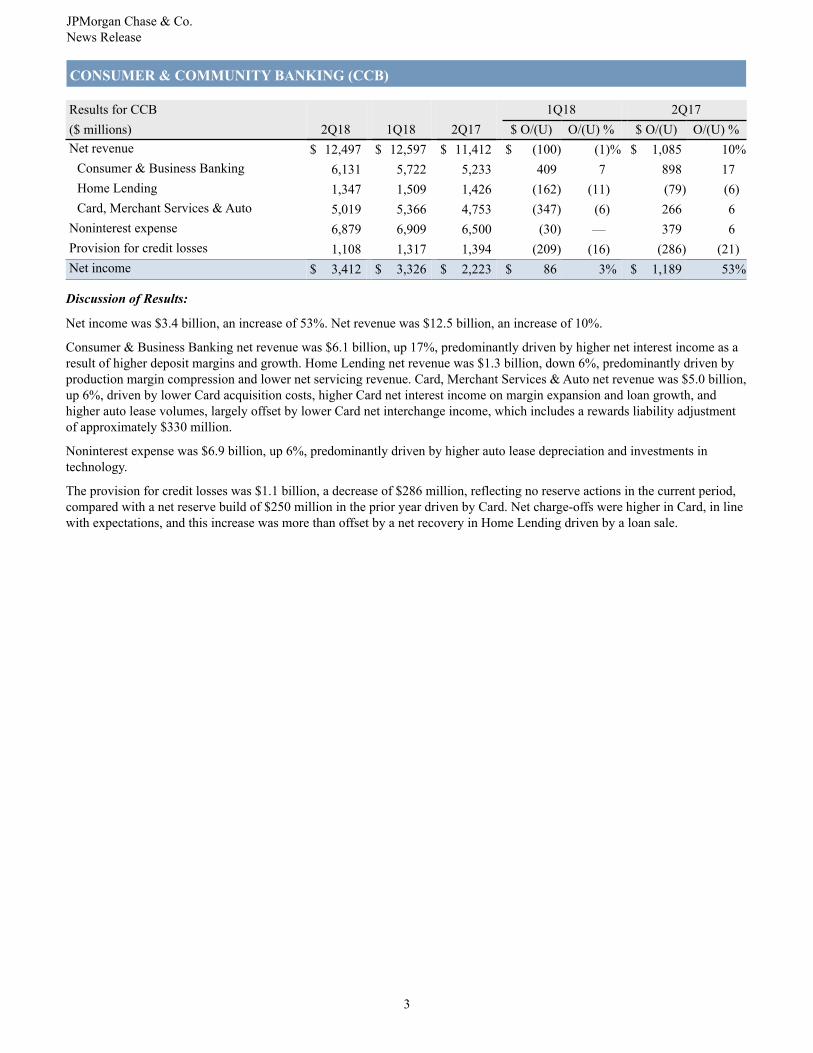
CONSUMER & COMMUNITY BANKING (CCB)
Results for CCB 1Q18 2Q17($ millions) 2Q18 1Q18 2Q17 $ O/(U) O/(U) % $ O/(U) O/(U) %Net revenue $ 12,497 $ 12,597 $ 11,412 $ (100) (1)% $ 1,085 10%
Consumer & Business Banking 6,131 5,722 5,233 409 7 898 17Home Lending 1,347 1,509 1,426 (162) (11) (79) (6)Card, Merchant Services & Auto 5,019 5,366 4,753 (347) (6) 266 6
Noninterest expense 6,879 6,909 6,500 (30) — 379 6Provision for credit losses 1,108 1,317 1,394 (209) (16) (286) (21)Net income $ 3,412 $ 3,326 $ 2,223 $ 86 3% $ 1,189 53%
Discussion of Results:
Net income was $3.4 billion, an increase of 53%. Net revenue was $12.5 billion, an increase of 10%.
Consumer & Business Banking net revenue was $6.1 billion, up 17%, predominantly driven by higher net interest income as a result of higher deposit margins and growth. Home Lending net revenue was $1.3 billion, down 6%, predominantly driven by production margin compression and lower net servicing revenue. Card, Merchant Services & Auto net revenue was $5.0 billion, up 6%, driven by lower Card acquisition costs, higher Card net interest income on margin expansion and loan growth, and higher auto lease volumes, largely offset by lower Card net interchange income, which includes a rewards liability adjustment of approximately $330 million.
Noninterest expense was $6.9 billion, up 6%, predominantly driven by higher auto lease depreciation and investments in technology.
The provision for credit losses was $1.1 billion, a decrease of $286 million, reflecting no reserve actions in the current period, compared with a net reserve build of $250 million in the prior year driven by Card. Net charge-offs were higher in Card, in line with expectations, and this increase was more than offset by a net recovery in Home Lending driven by a loan sale.

4
CORPORATE & INVESTMENT BANK (CIB)
Results for CIB 1Q18 2Q17($ millions) 2Q18 1Q18 2Q17 $ O/(U) O/(U) % $ O/(U) O/(U) %Net revenue $ 9,923 $ 10,483 $ 8,925 $ (560) (5)% $ 998 11%
Banking 3,451 3,005 3,159 446 15 292 9Markets & Investor Services 6,472 7,478 5,766 (1,006) (13) 706 12
Noninterest expense 5,403 5,659 4,877 (256) (5) 526 11Provision for credit losses 58 (158) (53) 216 NM 111 NMNet income $ 3,198 $ 3,974 $ 2,710 $ (776) (20)% $ 488 18%
Discussion of Results:
Net income was $3.2 billion, an increase of 18%. Net revenue was $9.9 billion, up 11%.
Banking revenue was $3.5 billion, up 9%. Investment Banking revenue was $1.9 billion, up 13%, driven by higher equity underwriting and advisory fees. Treasury Services revenue was $1.2 billion, up 12%, driven by higher interest rates and growth in operating deposits. Lending revenue was $321 million, down 14%, predominantly driven by lower net interest income and higher gains in the prior year on securities received from restructurings.
Markets & Investor Services revenue was $6.5 billion, up 12%, predominantly driven by higher Markets revenue of $5.4 billion, up 13%. Excluding the reduction in tax-equivalent adjustments as a result of the enactment of the TCJA, Markets revenue was up 16%, and Fixed Income Markets revenue was up 12%8. Fixed Income Markets revenue of $3.5 billion reflected healthy performance across products with good client flows, and improved Commodities revenue compared to a challenging prior year. Equity Markets revenue was $2.0 billion, up 24%, driven by strength across products, predominantly in derivatives and Prime. Securities Services revenue was $1.1 billion, up 12%, predominantly driven by higher interest rates and deposit growth, as well as higher asset-based fees driven by new client activity and higher market levels.
Noninterest expense was $5.4 billion, up 11%, predominantly driven by higher performance-based compensation, volume-related transaction costs and investments in technology.
The provision for credit losses was an expense of $58 million, compared with a benefit of $53 million in the prior year driven by net reserve releases, including in Energy9.
COMMERCIAL BANKING (CB)
Results for CB 1Q18 2Q17($ millions) 2Q18 1Q18 2Q17 $ O/(U) O/(U) % $ O/(U) O/(U) %Net revenue $ 2,316 $ 2,166 $ 2,088 $ 150 7% $ 228 11%Noninterest expense 844 844 790 — — 54 7Provision for credit losses 43 (5) (130) 48 NM 173 NMNet income $ 1,087 $ 1,025 $ 902 $ 62 6% $ 185 21%
Discussion of Results:
Net income was $1.1 billion, an increase of 21%.
Net revenue was $2.3 billion, up 11%, driven by higher net interest income due to higher deposit margins, and higher investment banking revenue from an increased number of large transactions.
Noninterest expense was $844 million, up 7%, predominantly driven by continued investments in banker coverage and technology.
The provision for credit losses was an expense of $43 million, compared with a benefit in the prior year of $130 million driven by net releases, including in Energy9.
JPMorgan Chase & Co.News Release
JPMorgan Chase & Co.News Release
5
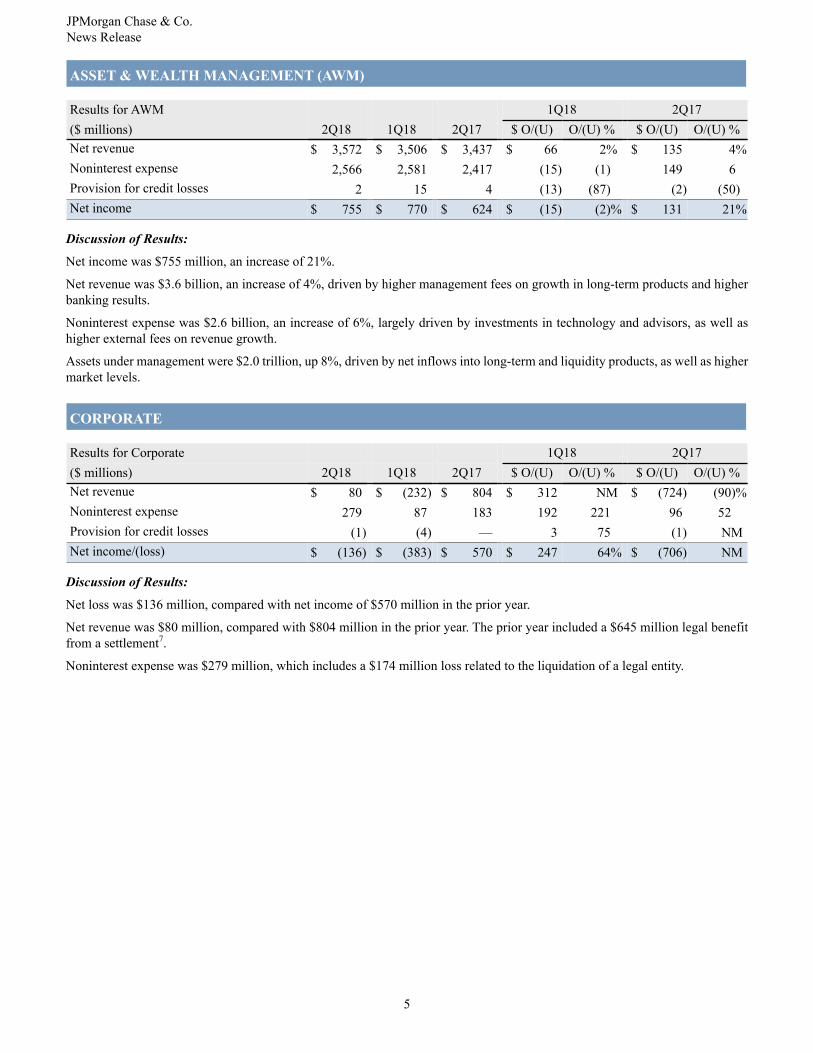
ASSET & WEALTH MANAGEMENT (AWM)
Results for AWM 1Q18 2Q17($ millions) 2Q18 1Q18 2Q17 $ O/(U) O/(U) % $ O/(U) O/(U) %Net revenue $ 3,572 $ 3,506 $ 3,437 $ 66 2% $ 135 4%Noninterest expense 2,566 2,581 2,417 (15) (1) 149 6Provision for credit losses 2 15 4 (13) (87) (2) (50)Net income $ 755 $ 770 $ 624 $ (15) (2)% $ 131 21%
Discussion of Results:
Net income was $755 million, an increase of 21%.
Net revenue was $3.6 billion, an increase of 4%, driven by higher management fees on growth in long-term products and higher banking results.
Noninterest expense was $2.6 billion, an increase of 6%, largely driven by investments in technology and advisors, as well as higher external fees on revenue growth.
Assets under management were $2.0 trillion, up 8%, driven by net inflows into long-term and liquidity products, as well as higher market levels.
CORPORATE
Results for Corporate 1Q18 2Q17($ millions) 2Q18 1Q18 2Q17 $ O/(U) O/(U) % $ O/(U) O/(U) %Net revenue $ 80 $ (232) $ 804 $ 312 NM $ (724) (90)%Noninterest expense 279 87 183 192 221 96 52Provision for credit losses (1) (4) — 3 75 (1) NMNet income/(loss) $ (136) $ (383) $ 570 $ 247 64% $ (706) NM
Discussion of Results:
Net loss was $136 million, compared with net income of $570 million in the prior year.
Net revenue was $80 million, compared with $804 million in the prior year. The prior year included a $645 million legal benefit from a settlement7.
Noninterest expense was $279 million, which includes a $174 million loss related to the liquidation of a legal entity.
JPMorgan Chase & Co.News Release
6
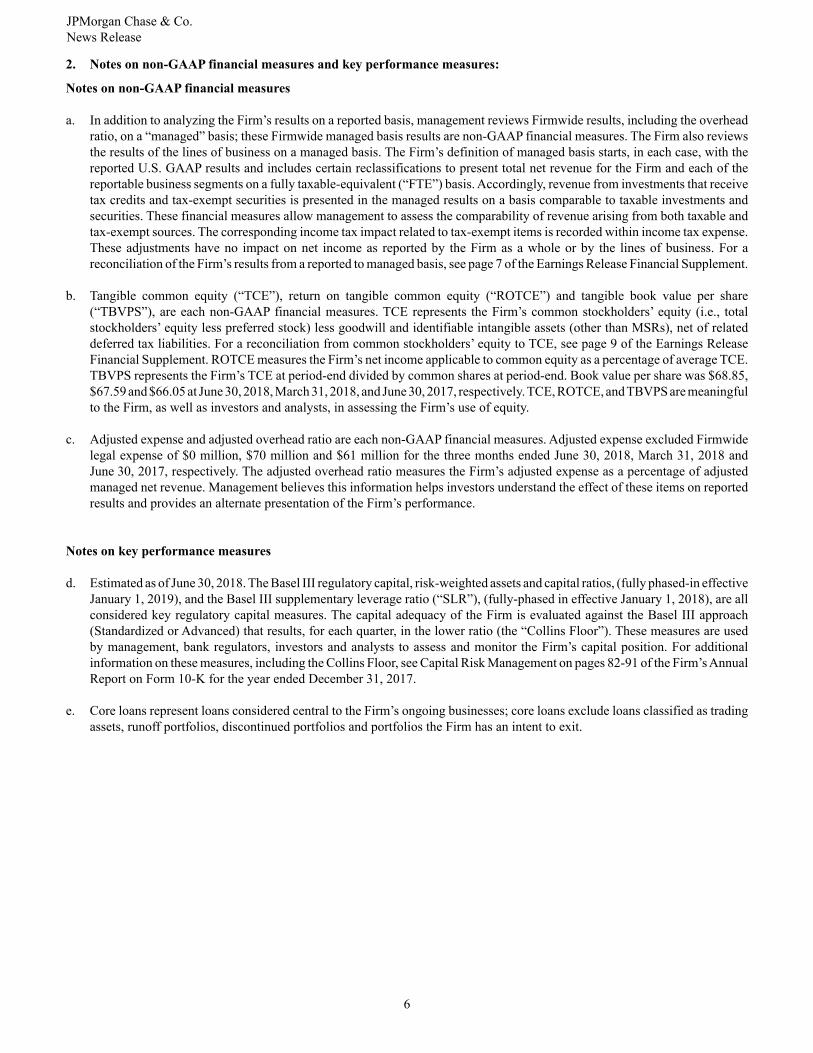
2. Notes on non-GAAP financial measures and key performance measures:
Notes on non-GAAP financial measures
a. In addition to analyzing the Firm’s results on a reported basis, management reviews Firmwide results, including the overhead ratio, on a “managed” basis; these Firmwide managed basis results are non-GAAP financial measures. The Firm also reviews the results of the lines of business on a managed basis. The Firm’s definition of managed basis starts, in each case, with the reported U.S. GAAP results and includes certain reclassifications to present total net revenue for the Firm and each of the reportable business segments on a fully taxable-equivalent (“FTE”) basis. Accordingly, revenue from investments that receive tax credits and tax-exempt securities is presented in the managed results on a basis comparable to taxable investments and securities. These financial measures allow management to assess the comparability of revenue arising from both taxable and tax-exempt sources. The corresponding income tax impact related to tax-exempt items is recorded within income tax expense. These adjustments have no impact on net income as reported by the Firm as a whole or by the lines of business. For a reconciliation of the Firm’s results from a reported to managed basis, see page 7 of the Earnings Release Financial Supplement.
b. Tangible common equity (“TCE”), return on tangible common equity (“ROTCE”) and tangible book value per share (“TBVPS”), are each non-GAAP financial measures. TCE represents the Firm’s common stockholders’ equity (i.e., total stockholders’ equity less preferred stock) less goodwill and identifiable intangible assets (other than MSRs), net of related deferred tax liabilities. For a reconciliation from common stockholders’ equity to TCE, see page 9 of the Earnings Release Financial Supplement. ROTCE measures the Firm’s net income applicable to common equity as a percentage of average TCE. TBVPS represents the Firm’s TCE at period-end divided by common shares at period-end. Book value per share was $68.85, $67.59 and $66.05 at June 30, 2018, March 31, 2018, and June 30, 2017, respectively. TCE, ROTCE, and TBVPS are meaningful to the Firm, as well as investors and analysts, in assessing the Firm’s use of equity.
c. Adjusted expense and adjusted overhead ratio are each non-GAAP financial measures. Adjusted expense excluded Firmwide legal expense of $0 million, $70 million and $61 million for the three months ended June 30, 2018, March 31, 2018 and June 30, 2017, respectively. The adjusted overhead ratio measures the Firm’s adjusted expense as a percentage of adjusted managed net revenue. Management believes this information helps investors understand the effect of these items on reported results and provides an alternate presentation of the Firm’s performance.
Notes on key performance measures
d. Estimated as of June 30, 2018. The Basel III regulatory capital, risk-weighted assets and capital ratios, (fully phased-in effective January 1, 2019), and the Basel III supplementary leverage ratio (“SLR”), (fully-phased in effective January 1, 2018), are all considered key regulatory capital measures. The capital adequacy of the Firm is evaluated against the Basel III approach (Standardized or Advanced) that results, for each quarter, in the lower ratio (the “Collins Floor”). These measures are used by management, bank regulators, investors and analysts to assess and monitor the Firm’s capital position. For additional information on these measures, including the Collins Floor, see Capital Risk Management on pages 82-91 of the Firm’s Annual Report on Form 10-K for the year ended December 31, 2017.
e. Core loans represent loans considered central to the Firm’s ongoing businesses; core loans exclude loans classified as trading assets, runoff portfolios, discontinued portfolios and portfolios the Firm has an intent to exit.
JPMorgan Chase & Co.News Release
7
Additional notes:
3. Last twelve months (“LTM”).
4. Net of stock issued to employees.
5. Excludes Commercial Card.
6. The amount of credit provided to clients represents new and renewed credit, including loans and commitments. The amount of credit provided to small businesses reflects loans and increased lines of credit provided by Consumer & Business Banking; Card, Merchant Services & Auto; and Commercial Banking. The amount of credit provided to nonprofit and U.S. and non-U.S. government entities, including U.S. states, municipalities, hospitals and universities, represents credit provided by the Corporate & Investment Bank and Commercial Banking.
7. The prior-year legal benefit relates to a settlement with the FDIC receivership for Washington Mutual and with Deutsche Bank as trustee to certain Washington Mutual trusts, which was recognized in noninterest revenue in Corporate.
8. Reflects a reduction of approximately $160 million in FTE adjustments compared with the prior year quarter, resulting from the enactment of the TCJA.
9. Energy includes Oil & Gas, Natural Gas Pipelines, and Metals & Mining.
JPMorgan Chase & Co.News Release
8
JPMorgan Chase & Co. (NYSE: JPM) is a leading global financial services firm with assets of $2.6 trillion and operations worldwide. The Firm is a leader in investment banking, financial services for consumers and small businesses, commercial banking, financial transaction processing, and asset management. A component of the Dow Jones Industrial Average, JPMorgan Chase & Co. serves millions of customers in the United States and many of the world’s most prominent corporate, institutional and government clients under its J.P. Morgan and Chase brands. Information about JPMorgan Chase & Co. is available at www.jpmorganchase.com.
JPMorgan Chase & Co. will host a conference call today, July 13, 2018, at 8:30 a.m. (Eastern) to present second-quarter 2018 financial results. The general public can access the call by dialing (866) 541-2724 in the U.S. and Canada, or (706) 634-7246 for international participants. Please dial in 10 minutes prior to the start of the call. The live audio webcast and presentation slides will be available on the Firm’s website, www.jpmorganchase.com, under Investor Relations, Events & Presentations.
A replay of the conference call will be available beginning at approximately 12:30 p.m. on July 13, 2018, through midnight, July 27, 2018, by telephone at (800) 585-8367 (U.S. and Canada) or (404) 537-3406 (international); use Conference ID # 6875466. The replay will also be available via webcast on www.jpmorganchase.com under Investor Relations, Events & Presentations. Additional detailed financial, statistical and business-related information is included in a financial supplement. The earnings release and the financial supplement are available at www.jpmorganchase.com.
This earnings release contains forward-looking statements within the meaning of the Private Securities Litigation Reform Act of 1995. These statements are based on the current beliefs and expectations of JPMorgan Chase & Co.’s management and are subject to significant risks and uncertainties. Actual results may differ from those set forth in the forward-looking statements. Factors that could cause JPMorgan Chase & Co.’s actual results to differ materially from those described in the forward-looking statements can be found in JPMorgan Chase & Co.’s Annual Report on Form 10-K for the year ended December 31, 2017, and Quarterly Report on Form 10-Q for the quarter ended March 31, 2018, which have been filed with the Securities and Exchange Commission and are available on JPMorgan Chase & Co.’s website (http://investor.shareholder.com/jpmorganchase/sec.cfm), and on the Securities and Exchange Commission’s website (www.sec.gov). JPMorgan Chase & Co. does not undertake to update any forward-looking statements.