Embed Size (px)
Citation preview

Financial Results 2Q18
Advanced Info Service Plc.
2 August 2018
Ticker: ADVANC (SET)AVIFY (ADR)
2
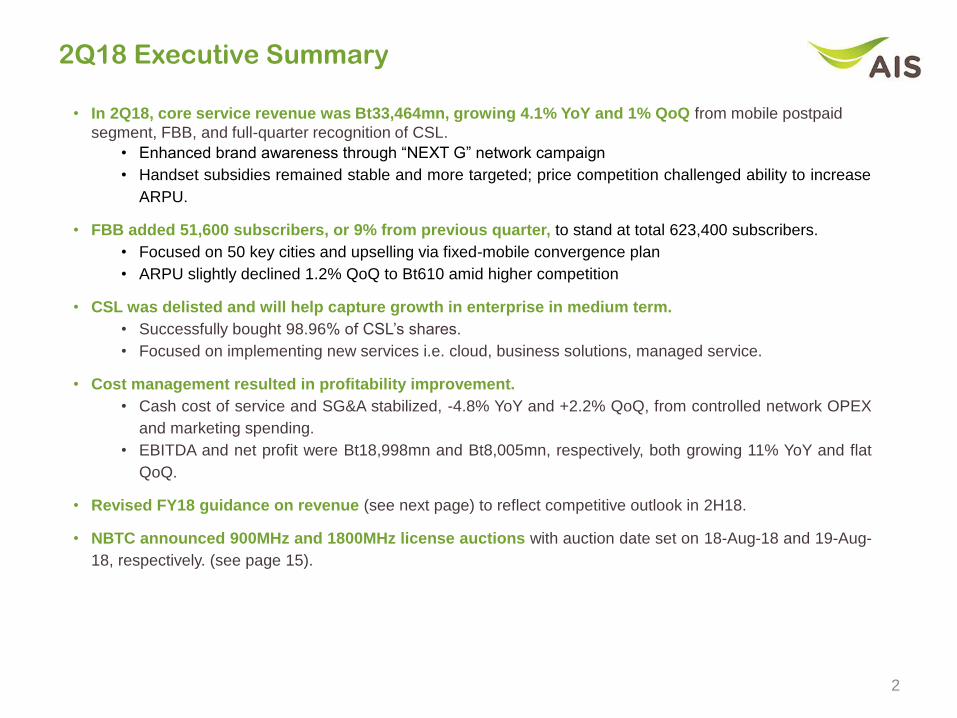
2Q18 Executive Summary
• In 2Q18, core service revenue was Bt33,464mn, growing 4.1% YoY and 1% QoQ from mobile postpaid
segment, FBB, and full-quarter recognition of CSL.
• Enhanced brand awareness through “NEXT G” network campaign
• Handset subsidies remained stable and more targeted; price competition challenged ability to increase
ARPU.
• FBB added 51,600 subscribers, or 9% from previous quarter, to stand at total 623,400 subscribers.
• Focused on 50 key cities and upselling via fixed-mobile convergence plan
• ARPU slightly declined 1.2% QoQ to Bt610 amid higher competition
• CSL was delisted and will help capture growth in enterprise in medium term.
• Successfully bought 98.96% of CSL’s shares.
• Focused on implementing new services i.e. cloud, business solutions, managed service.
• Cost management resulted in profitability improvement.
• Cash cost of service and SG&A stabilized, -4.8% YoY and +2.2% QoQ, from controlled network OPEX
and marketing spending.
• EBITDA and net profit were Bt18,998mn and Bt8,005mn, respectively, both growing 11% YoY and flat
QoQ.
• Revised FY18 guidance on revenue (see next page) to reflect competitive outlook in 2H18.
• NBTC announced 900MHz and 1800MHz license auctions with auction date set on 18-Aug-18 and 19-Aug-
18, respectively. (see page 15).
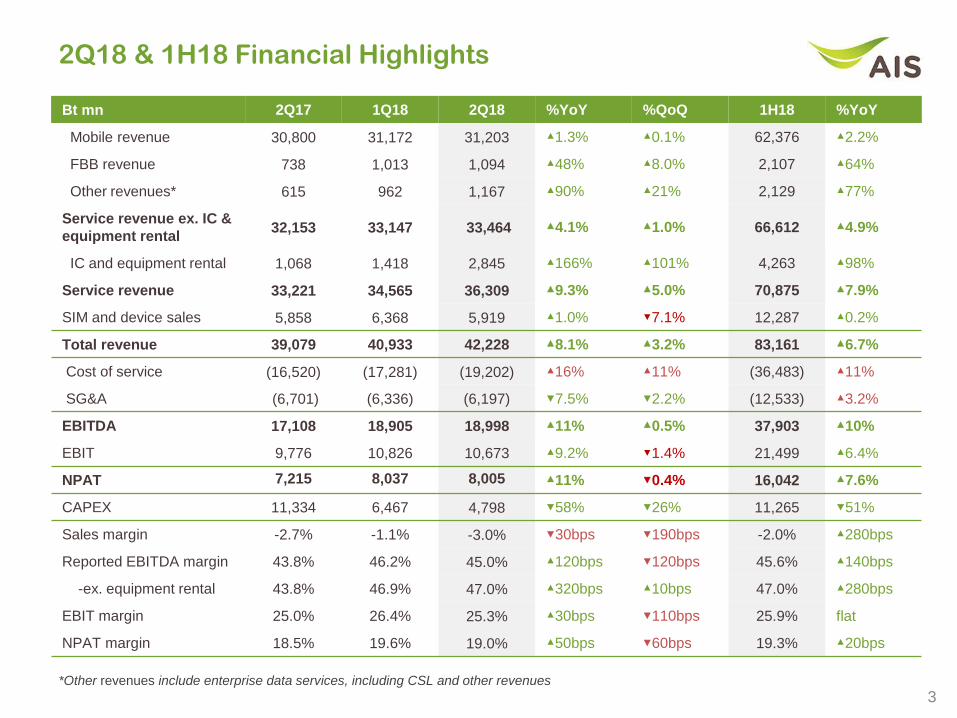
2Q18 & 1H18 Financial Highlights
Bt mn 2Q17 1Q18 2Q18 %YoY %QoQ 1H18 %YoY
Mobile revenue 30,800 31,172 31,203 ▲1.3% ▲0.1% 62,376 ▲2.2%
FBB revenue 738 1,013 1,094 ▲48% ▲8.0% 2,107 ▲64%
Other revenues* 615 962 1,167 ▲90% ▲21% 2,129 ▲77%
Service revenue ex. IC &
equipment rental32,153 33,147 33,464 ▲4.1% ▲1.0% 66,612 ▲4.9%
IC and equipment rental 1,068 1,418 2,845 ▲166% ▲101% 4,263 ▲98%
Service revenue 33,221 34,565 36,309 ▲9.3% ▲5.0% 70,875 ▲7.9%
SIM and device sales 5,858 6,368 5,919 ▲1.0% ▼7.1% 12,287 ▲0.2%
Total revenue 39,079 40,933 42,228 ▲8.1% ▲3.2% 83,161 ▲6.7%
Cost of service (16,520) (17,281) (19,202) ▲16% ▲11% (36,483) ▲11%
SG&A (6,701) (6,336) (6,197) ▼7.5% ▼2.2% (12,533) ▲3.2%
EBITDA 17,108 18,905 18,998 ▲11% ▲0.5% 37,903 ▲10%
EBIT 9,776 10,826 10,673 ▲9.2% ▼1.4% 21,499 ▲6.4%
NPAT 7,215 8,037 8,005 ▲11% ▼0.4% 16,042 ▲7.6%
CAPEX 11,334 6,467 4,798 ▼58% ▼26% 11,265 ▼51%
Sales margin -2.7% -1.1% -3.0% ▼30bps ▼190bps -2.0% ▲280bps
Reported EBITDA margin 43.8% 46.2% 45.0% ▲120bps ▼120bps 45.6% ▲140bps
-ex. equipment rental 43.8% 46.9% 47.0% ▲320bps ▲10bps 47.0% ▲280bps
EBIT margin 25.0% 26.4% 25.3% ▲30bps ▼110bps 25.9% flat
NPAT margin 18.5% 19.6% 19.0% ▲50bps ▼60bps 19.3% ▲20bps
3*Other revenues include enterprise data services, including CSL and other revenues
4
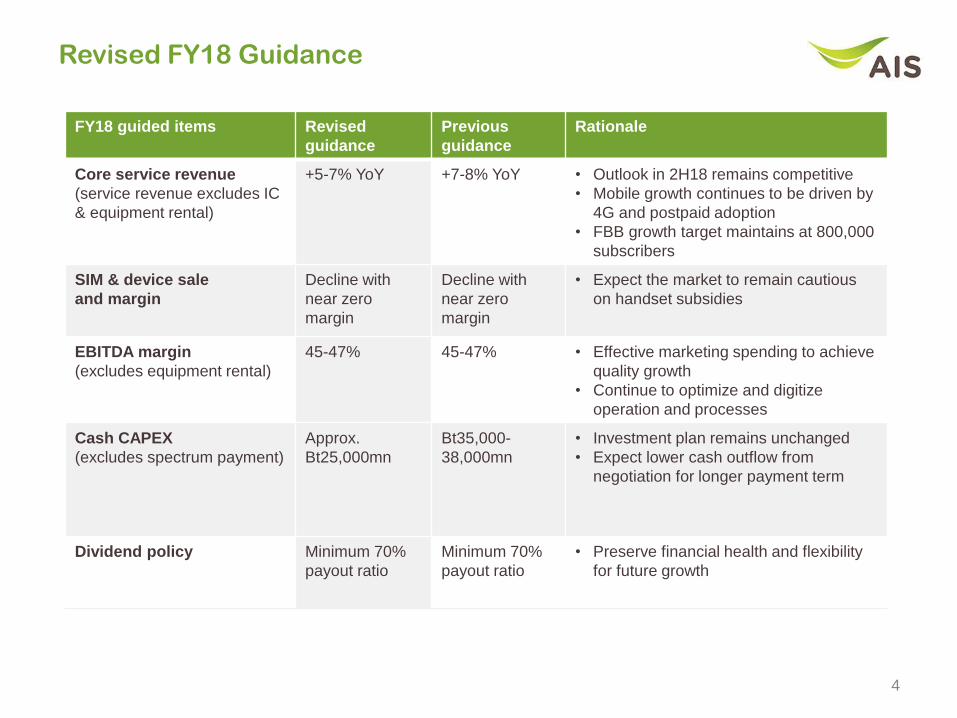
Revised FY18 Guidance
FY18 guided items Revised
guidance
Previous
guidance
Rationale
Core service revenue
(service revenue excludes IC
& equipment rental)
+5-7% YoY +7-8% YoY • Outlook in 2H18 remains competitive
• Mobile growth continues to be driven by
4G and postpaid adoption
• FBB growth target maintains at 800,000
subscribers
SIM & device sale
and margin
Decline with
near zero
margin
Decline with
near zero
margin
• Expect the market to remain cautious
on handset subsidies
EBITDA margin
(excludes equipment rental)
45-47% 45-47% • Effective marketing spending to achieve
quality growth
• Continue to optimize and digitize
operation and processes
Cash CAPEX
(excludes spectrum payment)
Approx.
Bt25,000mn
Bt35,000-
38,000mn
• Investment plan remains unchanged
• Expect lower cash outflow from
negotiation for longer payment term
Dividend policy Minimum 70%
payout ratio
Minimum 70%
payout ratio
• Preserve financial health and flexibility
for future growth
5
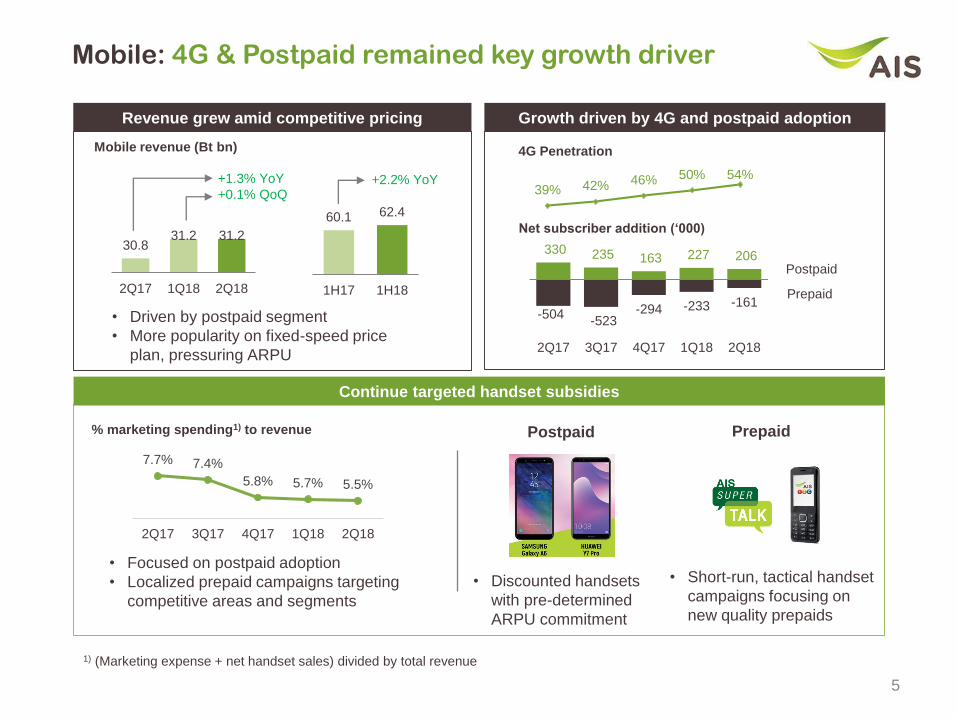
• Focused on postpaid adoption
• Localized prepaid campaigns targeting
competitive areas and segments
30.8 31.2 31.2
2Q17 1Q18 2Q18
7.7% 7.4%
5.8% 5.7% 5.5%
2Q17 3Q17 4Q17 1Q18 2Q18
Mobile: 4G & Postpaid remained key growth driver
% marketing spending1) to revenue
1) (Marketing expense + net handset sales) divided by total revenue
Revenue grew amid competitive pricing
60.1 62.4
1H17 1H18
+1.3% YoY
+0.1% QoQ+2.2% YoY
Mobile revenue (Bt bn)
• Driven by postpaid segment
• More popularity on fixed-speed price
plan, pressuring ARPU
Growth driven by 4G and postpaid adoption
330 235 163 227 206
-504 -523
-294 -233 -161
-1,000
-500
-
500
1,000
2Q17 3Q17 4Q17 1Q18 2Q18
Continue targeted handset subsidies
4G Penetration
39% 42% 46% 50% 54%
Net subscriber addition (‘000)
Postpaid
Prepaid
• Short-run, tactical handset
campaigns focusing on
new quality prepaids
PrepaidPostpaid
• Discounted handsets
with pre-determined
ARPU commitment
6
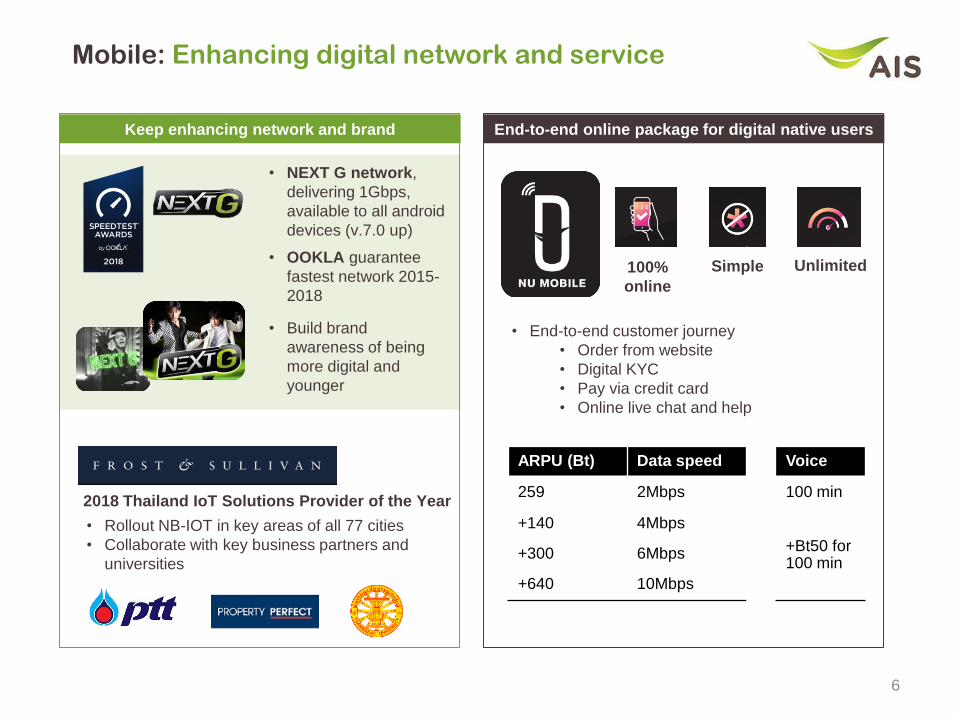
Mobile: Enhancing digital network and service
• End-to-end customer journey
• Order from website
• Digital KYC
• Pay via credit card
• Online live chat and help
ARPU (Bt) Data speed Voice
259 2Mbps 100 min
+140 4Mbps
+Bt50 for 100 min
+300 6Mbps
+640 10Mbps
100%
online
Simple Unlimited
End-to-end online package for digital native usersKeep enhancing network and brand
2018 Thailand IoT Solutions Provider of the Year
• NEXT G network,
delivering 1Gbps,
available to all android
devices (v.7.0 up)
• OOKLA guarantee
fastest network 2015-
2018
• Build brand
awareness of being
more digital and
younger
• Rollout NB-IOT in key areas of all 77 cities
• Collaborate with key business partners and
universities
7
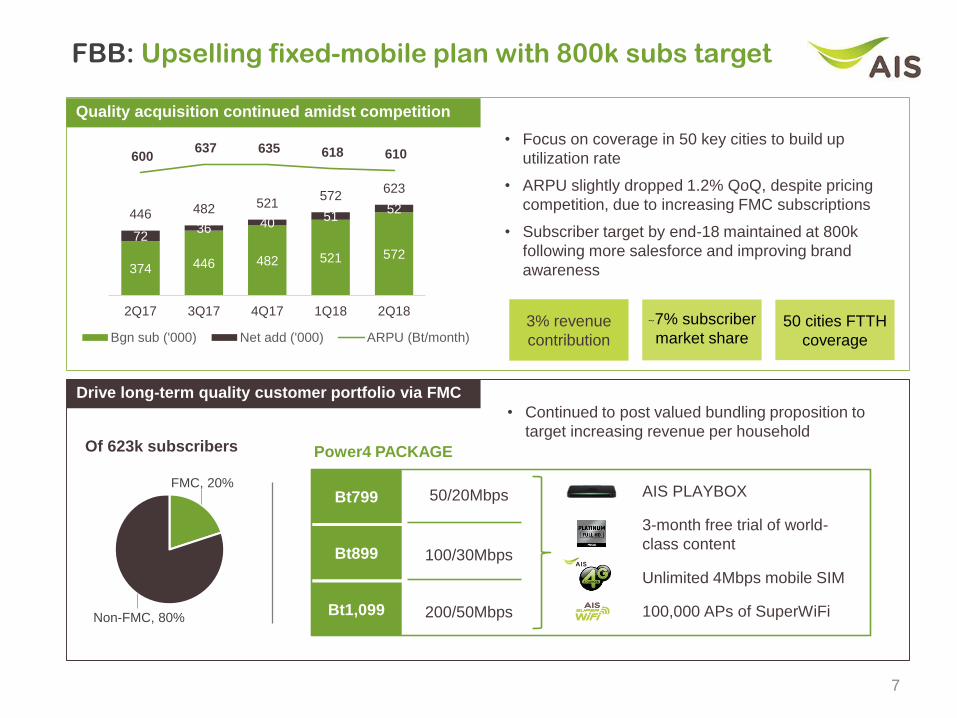
FBB: Upselling fixed-mobile plan with 800k subs target
50 cities FTTH
coverage
3% revenue
contribution
~7% subscriber
market share
374 446 482 521 572
7236 40
5152446 482 521
572623
600 637 635 618 610
-
200
400
600
-100
100
300
500
700
900
2Q17 3Q17 4Q17 1Q18 2Q18
Bgn sub ('000) Net add ('000) ARPU (Bt/month)
Drive long-term quality customer portfolio via FMC
FMC, 20%
Non-FMC, 80%
Of 623k subscribers
• Focus on coverage in 50 key cities to build up
utilization rate
• ARPU slightly dropped 1.2% QoQ, despite pricing
competition, due to increasing FMC subscriptions
• Subscriber target by end-18 maintained at 800k
following more salesforce and improving brand
awareness
Bt799
Bt1,099
Bt899
50/20Mbps
200/50Mbps
100/30Mbps
AIS PLAYBOX
3-month free trial of world-
class content
Unlimited 4Mbps mobile SIM
100,000 APs of SuperWiFi
Quality acquisition continued amidst competition
Power4 PACKAGE
• Continued to post valued bundling proposition to
target increasing revenue per household
8
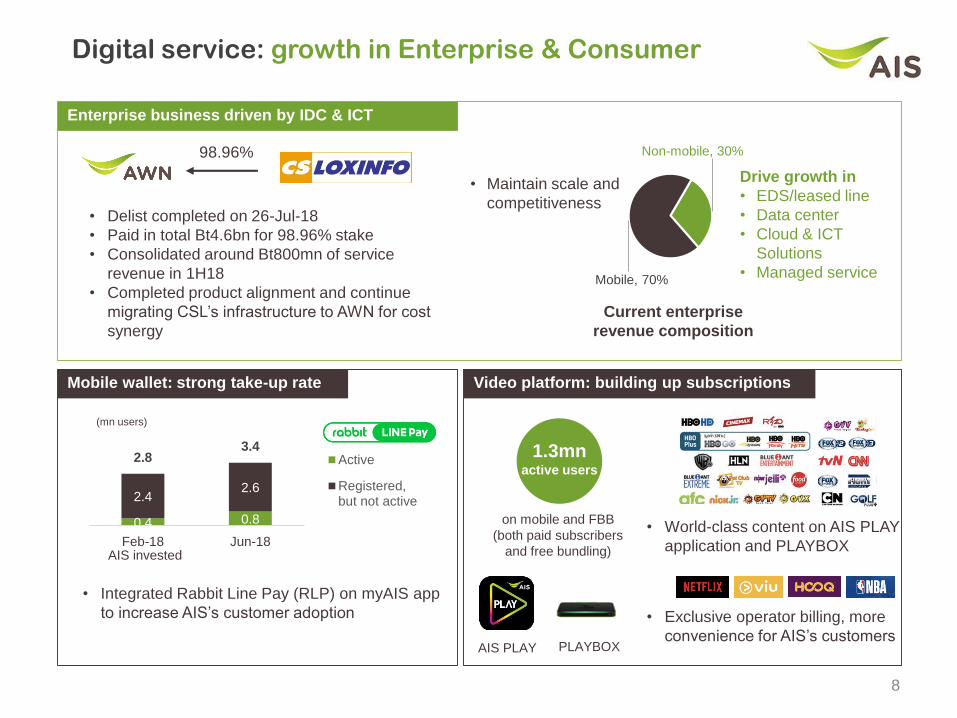
Digital service: growth in Enterprise & Consumer
Enterprise business driven by IDC & ICT
98.96%
• Delist completed on 26-Jul-18
• Paid in total Bt4.6bn for 98.96% stake
• Consolidated around Bt800mn of service
revenue in 1H18
• Completed product alignment and continue
migrating CSL’s infrastructure to AWN for cost
synergy
Current enterprise
revenue composition
Non-mobile, 30%
Mobile, 70%
Drive growth in
• EDS/leased line
• Data center
• Cloud & ICT
Solutions
• Managed service
• Maintain scale and
competitiveness
Mobile wallet: strong take-up rate
0.4 0.8
2.42.6
2.83.4
0
2
4
0
2
4
Feb-18 Jun-18
Active
Registered,but not active
(mn users)
• Integrated Rabbit Line Pay (RLP) on myAIS app
to increase AIS’s customer adoption
Video platform: building up subscriptions
AIS invested
1.3mnactive users
on mobile and FBB
(both paid subscribers
and free bundling)
AIS PLAY PLAYBOX
• Exclusive operator billing, more
convenience for AIS’s customers
• World-class content on AIS PLAY
application and PLAYBOX
9
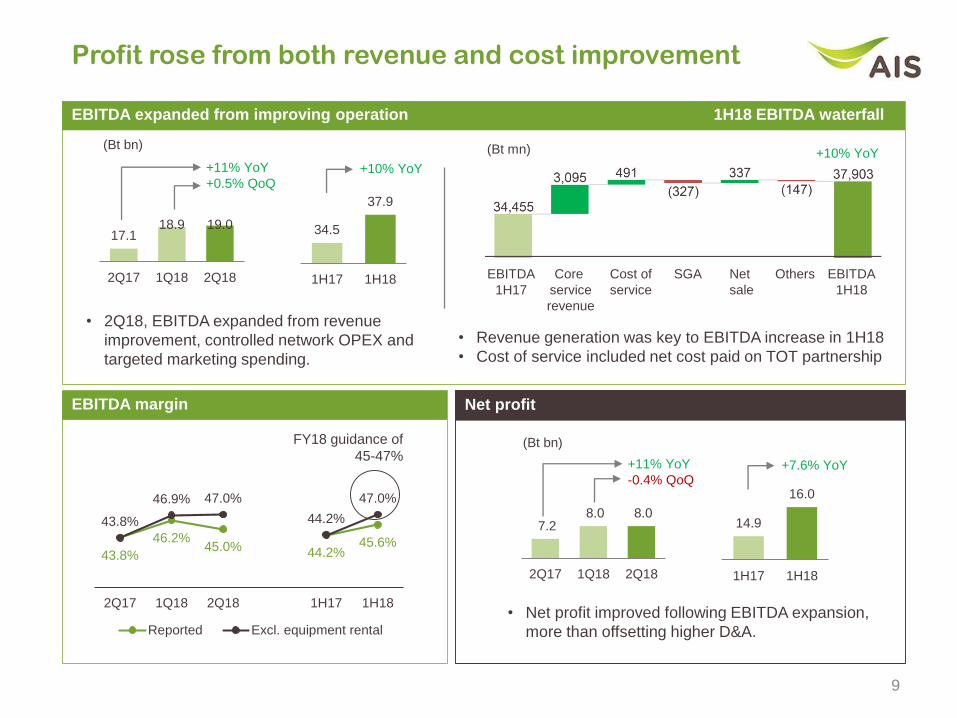
Profit rose from both revenue and cost improvement
EBITDA expanded from improving operation 1H18 EBITDA waterfall
17.1 18.9 19.0
2Q17 1Q18 2Q18
34.5
37.9
1H17 1H18
+11% YoY
+0.5% QoQ+10% YoY
EBITDA
1H17
Cost of
service
SGA Net
sale
Others EBITDA
1H18
Core
service
revenue
Net profit
7.2 8.0 8.0
2Q17 1Q18 2Q18
14.9
16.0
1H17 1H18
+11% YoY
-0.4% QoQ+7.6% YoY
(Bt bn)
(Bt bn)
(Bt mn)
• Net profit improved following EBITDA expansion,
more than offsetting higher D&A.
• 2Q18, EBITDA expanded from revenue
improvement, controlled network OPEX and
targeted marketing spending.
EBITDA margin
43.8%
46.2%45.0% 44.2%
45.6%
43.8%
46.9% 47.0%
44.2%
47.0%
2Q17 1Q18 2Q18 1H17 1H18
Reported Excl. equipment rental
FY18 guidance of
45-47%
• Revenue generation was key to EBITDA increase in 1H18
• Cost of service included net cost paid on TOT partnership
+10% YoY
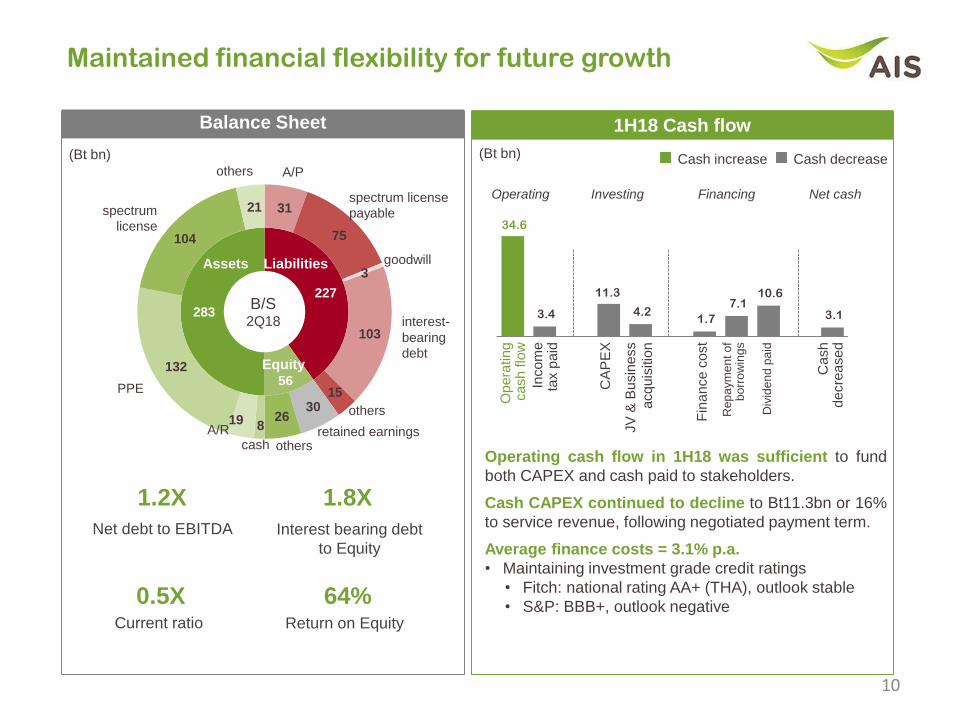
227
56
283
31
75
3
103
15 30
26 8 19
132
104
21
Assets Liabilities
Equity
cash
spectrum
license
others
spectrum license
payable
interest-
bearing
debt
others
retained earningsothers
A/R
PPE
B/S2Q18
1H18 Cash flow Balance Sheet
A/P
Operating cash flow in 1H18 was sufficient to fund
both CAPEX and cash paid to stakeholders.
Cash CAPEX continued to decline to Bt11.3bn or 16%
to service revenue, following negotiated payment term.
Average finance costs = 3.1% p.a.
• Maintaining investment grade credit ratings
• Fitch: national rating AA+ (THA), outlook stable
• S&P: BBB+, outlook negative
Maintained financial flexibility for future growth
(Bt bn) (Bt bn)
34.6
3.4
11.3
4.2 1.7
7.1 10.6
3.1
Operating Investing Financing Net cash
Op
era
tin
gca
sh
flo
w
Inco
me
ta
x p
aid
CA
PE
X
JV
& B
usin
ess
acq
uis
itio
n
Ca
sh
d
ecre
ase
d
Rep
aym
en
t o
f b
orr
ow
ing
s
Fin
an
ce
co
st
Cash increase Cash decrease
1.2X 1.8X
0.5X 64%
Net debt to EBITDA Interest bearing debt
to Equity
Current ratio Return on Equity
Div
ide
nd
pa
id
10
goodwill
11
APPENDIX
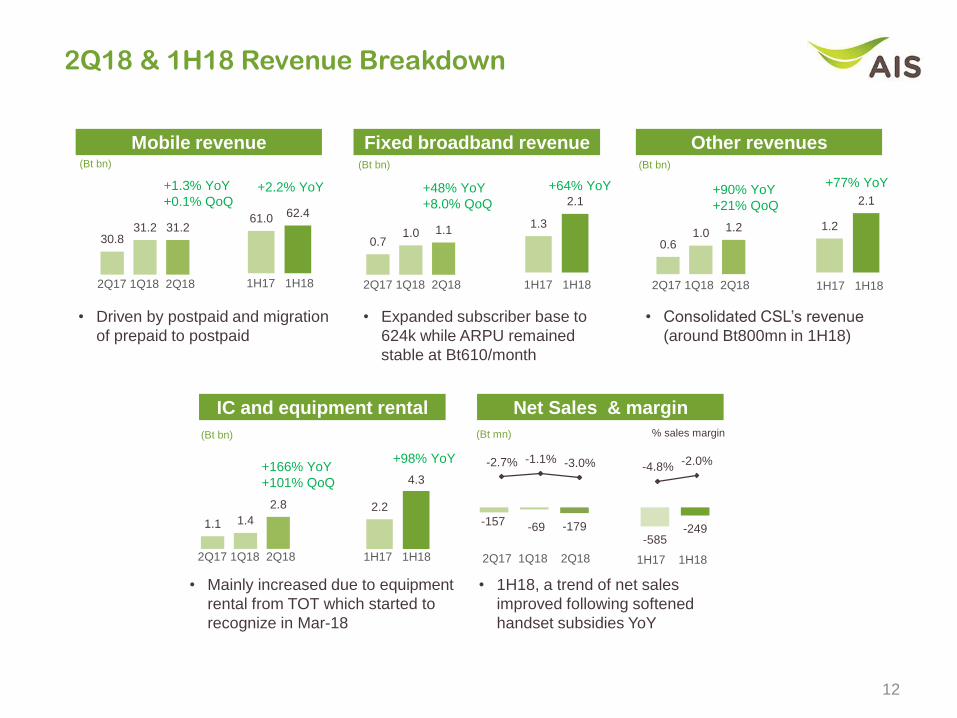
2Q18 & 1H18 Revenue Breakdown
Mobile revenue Fixed broadband revenue Other revenues
IC and equipment rental Net Sales & margin
• Consolidated CSL’s revenue
(around Bt800mn in 1H18)
• Mainly increased due to equipment
rental from TOT which started to
recognize in Mar-18
(Bt bn) (Bt bn) (Bt bn)
• 1H18, a trend of net sales
improved following softened
handset subsidies YoY
(Bt bn) (Bt mn) % sales margin
12
+90% YoY
+21% QoQ
+166% YoY
+101% QoQ
• Expanded subscriber base to
624k while ARPU remained
stable at Bt610/month
+48% YoY
+8.0% QoQ
• Driven by postpaid and migration
of prepaid to postpaid
30.8 31.2 31.2
+1.3% YoY
+0.1% QoQ
2Q17 1Q18 2Q18
61.0 62.4
1H17 1H18
+2.2% YoY
0.7 1.0 1.1
2Q17 1Q18 2Q18
1.3
2.1
1H17 1H18
+64% YoY
0.6 1.0
1.2
2Q17 1Q18 2Q18
1.2
2.1
1H17 1H18
+77% YoY
1.1 1.4
2.8
2Q17 1Q18 2Q18
2.2
4.3
1H17 1H18
-157 -69 -179 -585
-249
-2.7% -1.1% -3.0% -4.8%-2.0%+98% YoY
2Q17 1Q18 2Q18 1H17 1H18
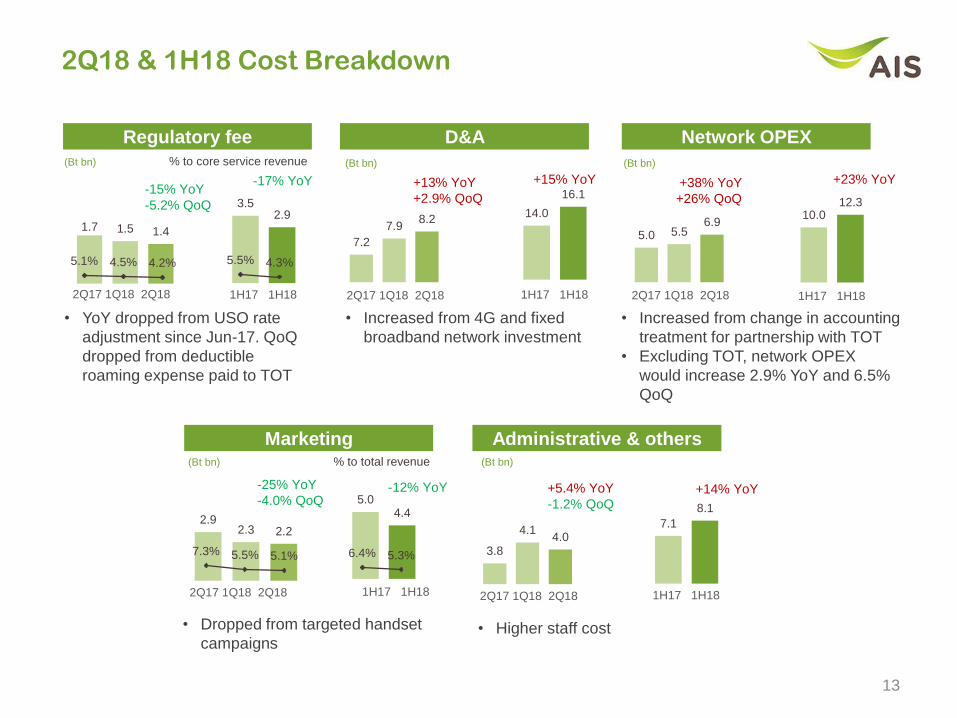
2Q18 & 1H18 Cost Breakdown
Regulatory fee D&A Network OPEX
Marketing Administrative & others
• YoY dropped from USO rate
adjustment since Jun-17. QoQ
dropped from deductible
roaming expense paid to TOT
• Increased from 4G and fixed
broadband network investment
• Increased from change in accounting
treatment for partnership with TOT
• Excluding TOT, network OPEX
would increase 2.9% YoY and 6.5%
QoQ
• Dropped from targeted handset
campaigns
(Bt bn) (Bt bn) (Bt bn)
• Higher staff cost
(Bt bn) (Bt bn)
-15% YoY
-5.2% QoQ
+38% YoY
+26% QoQ
% to core service revenue
% to total revenue
13
+13% YoY
+2.9% QoQ
1.7 1.5 1.4
2Q17 1Q18 2Q18
3.5 2.9
1H17 1H18
-17% YoY
7.2
7.9 8.2
2Q17 1Q18 2Q18
14.0
16.1
1H17 1H18
+15% YoY
5.0 5.5 6.9
2Q17 1Q18 2Q18
10.0 12.3
1H17 1H18
+23% YoY
2.9 2.3 2.2
2Q17 1Q18 2Q18
5.0 4.4
1H17 1H18
-25% YoY
-4.0% QoQ-12% YoY
3.8
4.1 4.0
2Q17 1Q18 2Q18
7.1
8.1
1H17 1H18
+5.4% YoY
-1.2% QoQ+14% YoY
5.1% 4.5% 4.2% 5.5% 4.3%
7.3% 5.5% 5.1% 6.4% 5.3%
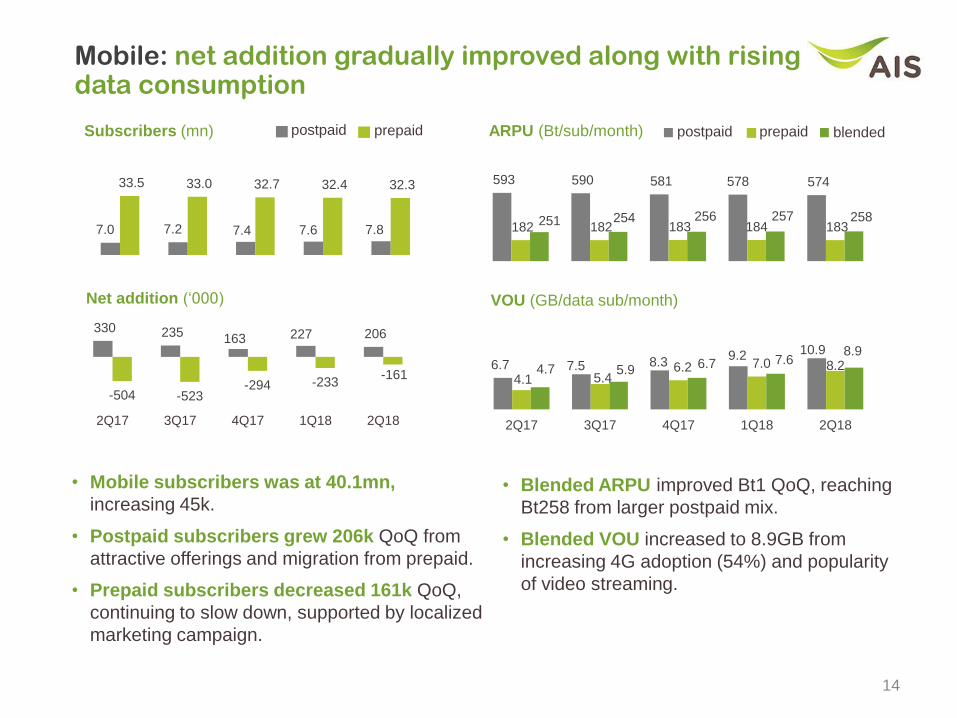
• Mobile subscribers was at 40.1mn,
increasing 45k.
• Postpaid subscribers grew 206k QoQ from
attractive offerings and migration from prepaid.
• Prepaid subscribers decreased 161k QoQ,
continuing to slow down, supported by localized
marketing campaign.
Mobile: net addition gradually improved along with rising data consumption
ARPU (Bt/sub/month)postpaid prepaidSubscribers (mn)
Net addition (‘000)
330 235 163 227 206
-504 -523 -294 -233
-161
2Q17 3Q17 4Q17 1Q18 2Q18
7.0 7.2 7.4 7.6 7.8
33.5 33.0 32.7 32.4 32.3 593 590 581 578 574
182 182 183 184 183 251 254 256 257 258
• Blended ARPU improved Bt1 QoQ, reaching
Bt258 from larger postpaid mix.
• Blended VOU increased to 8.9GB from
increasing 4G adoption (54%) and popularity
of video streaming.
postpaid prepaid blended
6.7 7.5 8.39.2 10.9
4.1 5.46.2 7.0 8.24.7 5.9 6.7 7.6
8.9
2Q17 3Q17 4Q17 1Q18 2Q18
VOU (GB/data sub/month)
14
15
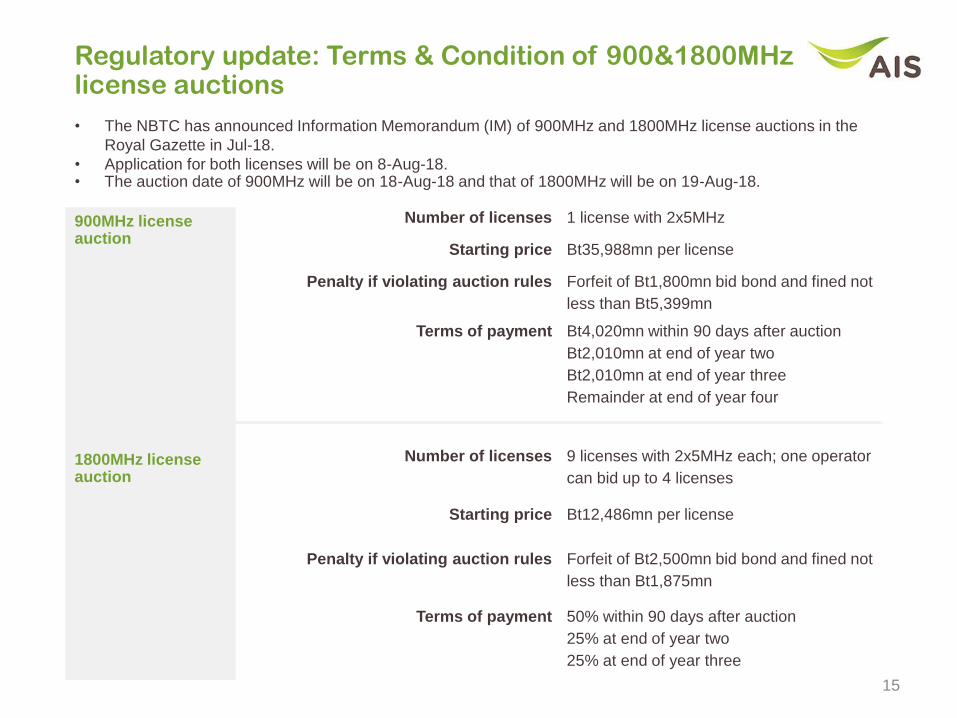
Regulatory update: Terms & Condition of 900&1800MHz license auctions
• The NBTC has announced Information Memorandum (IM) of 900MHz and 1800MHz license auctions in the
Royal Gazette in Jul-18.
• Application for both licenses will be on 8-Aug-18. • The auction date of 900MHz will be on 18-Aug-18 and that of 1800MHz will be on 19-Aug-18.
900MHz license auction
Number of licenses 1 license with 2x5MHz
Starting price Bt35,988mn per license
Penalty if violating auction rules Forfeit of Bt1,800mn bid bond and fined not
less than Bt5,399mn
Terms of payment Bt4,020mn within 90 days after auction
Bt2,010mn at end of year two
Bt2,010mn at end of year three
Remainder at end of year four
1800MHz license auction
Number of licenses 9 licenses with 2x5MHz each; one operator
can bid up to 4 licenses
Starting price Bt12,486mn per license
Penalty if violating auction rules Forfeit of Bt2,500mn bid bond and fined not
less than Bt1,875mn
Terms of payment 50% within 90 days after auction
25% at end of year two
25% at end of year three
Disclaimers
Contact us
IR website: http://investor.ais.co.th
Email: [email protected]
Tel: +662 029 5014
Some statements made in this material are forward-looking statements with the relevant assumptions, which are subject to various risks and uncertainties. These include
statements with respect to our corporate plans, strategies and beliefs and other statements that are not historical facts. These statements can be identified by the use of
forward-looking terminology such as “may”, “will”, “expect”, “anticipate”, “intend”, “estimate”, “continue” “plan” or other similar words.
The statements are based on our management’s assumptions and beliefs in light of the information currently available to us. These assumptions involve risks and
uncertainties which may cause the actual results, performance or achievements to be materially different from any future results, performance or achievements
expressed or implied by such forward-looking statements. Please note that the company and executives/staff do not control and cannot guarantee the relevance,
timeliness, or accuracy of these statements.