Embed Size (px)
Citation preview
2Q'18 Earnings Release
LG Electronics
July 26, 2018
All information regarding management performance and financial results of LG Electronics (the “Company”) during the 2nd quarter of 2018
as contained herein has been prepared on a consolidated basis in accordance with International Financial Reporting Standards (“IFRS”).
The information regarding results of 2nd quarter of 2018 has been prepared in advance, prior to being reviewed by outside auditors,
solely for the convenience of investors of the Company, and is subject to change in the process of final review by external auditors.
The information contained herein includes forward-looking statements in respect to future plans, prospects, and performances of the Company
as well as the Company’s projected sales plan for the 3rd quarter of 2018.
These forward-looking statements also refer to the Company’s performance on consolidated base, as indicated.
The aforementioned forward-looking statements are influenced by changes in the management environment and relative events, and by their nature,
these statements refer to uncertain circumstances. Consequently, due to these uncertainties, the Company’s actual future results may differ
materially from those expressed or implied by such statements.
Please note that as the forward-looking statements contained herein are based on the current market situation and the Company’s management
direction, they are subject to change according to the changes in future market environment and business strategy.
The information contained herein should not be utilized for any legal purposes in regards to investors’ investment results. The Company hereby
expressly disclaims any and all liability for any loss or damage resulting from the investors’ reliance on the information contained herein.
Table of Contents
Consolidated Earnings and OutlookⅠ
Performance and Outlook by DivisionⅡ
Ⅰ Consolidated Earnings and Outlook
1
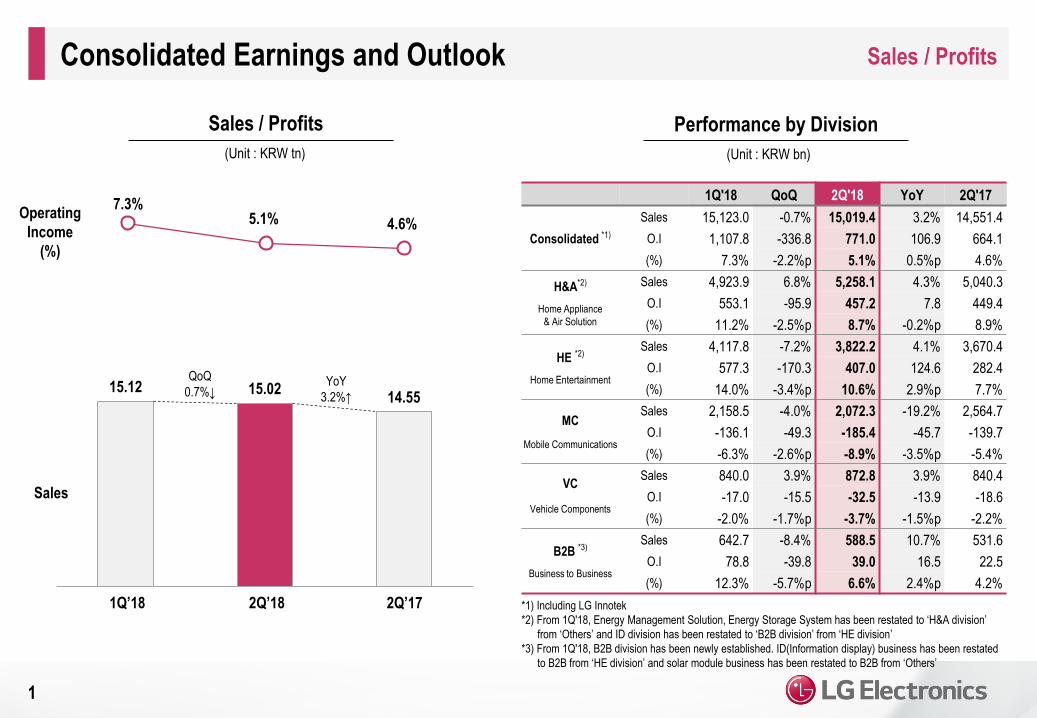
*1) Including LG Innotek
*2) From 1Q'18, Energy Management Solution, Energy Storage System has been restated to ‘H&A division’
from ‘Others’ and ID division has been restated to ‘B2B division’ from ‘HE division’
*3) From 1Q'18, B2B division has been newly established. ID(Information display) business has been restated
to B2B from ‘HE division’ and solar module business has been restated to B2B from ‘Others’
Consolidated Earnings and Outlook Sales / Profits
Sales / Profits
(Unit : KRW tn)
Performance by Division
(Unit : KRW bn)
Operating
Income
(%)
1Q'18 QoQ 2Q'18 YoY 2Q'17
Sales 15,123.0 -0.7% 15,019.4 3.2% 14,551.4
Consolidated *1) O.I 1,107.8 -336.8 771.0 106.9 664.1
(%) 7.3% -2.2%p 5.1% 0.5%p 4.6%
H&A*2)
Home Appliance
& Air Solution
Sales 4,923.9 6.8% 5,258.1 4.3% 5,040.3
O.I 553.1 -95.9 457.2 7.8 449.4
(%) 11.2% -2.5%p 8.7% -0.2%p 8.9%
HE *2)
Home Entertainment
Sales 4,117.8 -7.2% 3,822.2 4.1% 3,670.4
O.I 577.3 -170.3 407.0 124.6 282.4
(%) 14.0% -3.4%p 10.6% 2.9%p 7.7%
MC
Mobile Communications
Sales 2,158.5 -4.0% 2,072.3 -19.2% 2,564.7
O.I -136.1 -49.3 -185.4 -45.7 -139.7
(%) -6.3% -2.6%p -8.9% -3.5%p -5.4%
VC
Vehicle Components
Sales 840.0 3.9% 872.8 3.9% 840.4
O.I -17.0 -15.5 -32.5 -13.9 -18.6
(%) -2.0% -1.7%p -3.7% -1.5%p -2.2%
B2B *3)
Business to Business
Sales 642.7 -8.4% 588.5 10.7% 531.6
O.I 78.8 -39.8 39.0 16.5 22.5
(%) 12.3% -5.7%p 6.6% 2.4%p 4.2%
Sales
7.3%5.1% 4.6%
15.12 15.02 14.55
18.1Q 18.2Q 17.2Q
QoQ
0.7%↓YoY
3.2%↑
1Q’18 2Q’18 2Q’17
2
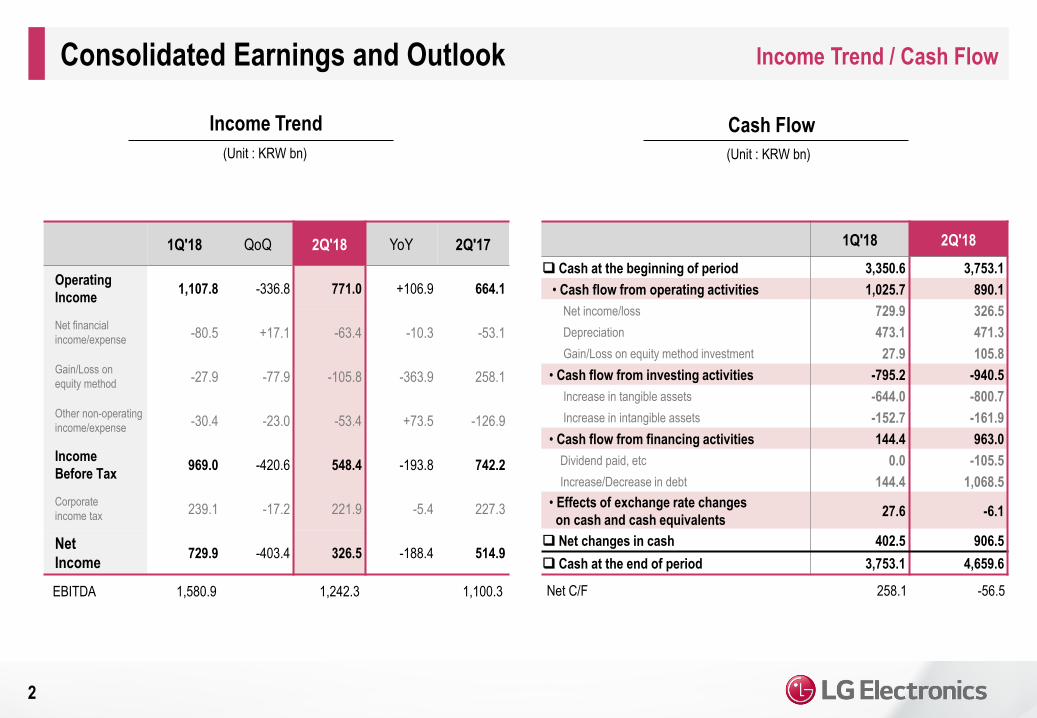
Income Trend / Cash FlowConsolidated Earnings and Outlook
Cash Flow
(Unit : KRW bn)
Income Trend
(Unit : KRW bn)
1Q'18 2Q'18
Cash at the beginning of period 3,350.6 3,753.1
• Cash flow from operating activities 1,025.7 890.1
Net income/loss 729.9 326.5
Depreciation 473.1 471.3
Gain/Loss on equity method investment 27.9 105.8
• Cash flow from investing activities -795.2 -940.5
Increase in tangible assets -644.0 -800.7
Increase in intangible assets -152.7 -161.9
• Cash flow from financing activities 144.4 963.0
Dividend paid, etc 0.0 -105.5
Increase/Decrease in debt 144.4 1,068.5
• Effects of exchange rate changes
on cash and cash equivalents27.6 -6.1
Net changes in cash 402.5 906.5
Cash at the end of period 3,753.1 4,659.6
EBITDA 1,242.3 1,100.31,580.9
1Q'18 QoQ 2Q'18 YoY 2Q'17
Operating
Income1,107.8 -336.8 771.0 +106.9 664.1
Net financial
income/expense-80.5 +17.1 -63.4 -10.3 -53.1
Gain/Loss on
equity method-27.9 -77.9 -105.8 -363.9 258.1
Other non-operating
income/expense-30.4 -23.0 -53.4 +73.5 -126.9
Income
Before Tax969.0 -420.6 548.4 -193.8 742.2
Corporate
income tax239.1 -17.2 221.9 -5.4 227.3
Net
Income729.9 -403.4 326.5 -188.4 514.9
Net C/F 258.1 -56.5
3
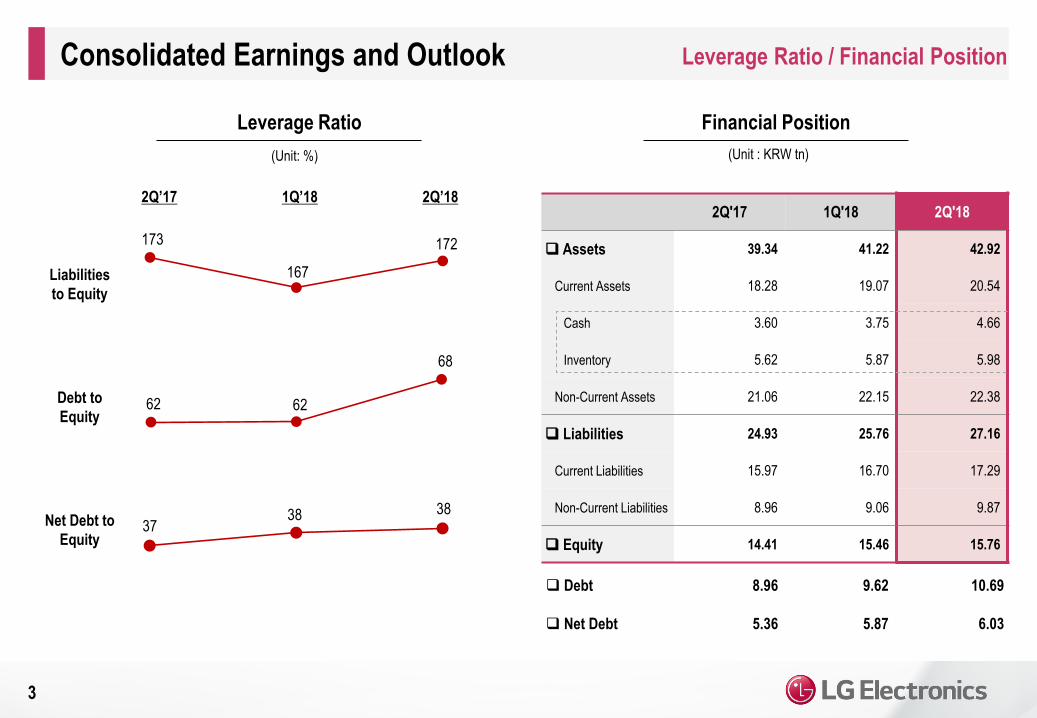
Leverage Ratio / Financial PositionConsolidated Earnings and Outlook
Financial PositionLeverage Ratio
(Unit: %) (Unit : KRW tn)
2Q’182Q’17 1Q’18
Liabilities
to Equity
Debt to
Equity
Net Debt to
Equity
2Q'17 1Q'18 2Q'18
Assets 39.34 41.22 42.92
Current Assets 18.28 19.07 20.54
Cash 3.60 3.75 4.66
Inventory 5.62 5.87 5.98
Non-Current Assets 21.06 22.15 22.38
Liabilities 24.93 25.76 27.16
Current Liabilities 15.97 16.70 17.29
Non-Current Liabilities 8.96 9.06 9.87
Equity 14.41 15.46 15.76
Debt
Net Debt
8.96
5.36
9.62
5.87
10.69
6.03
173
167
172
62 62
68
3738 38
4
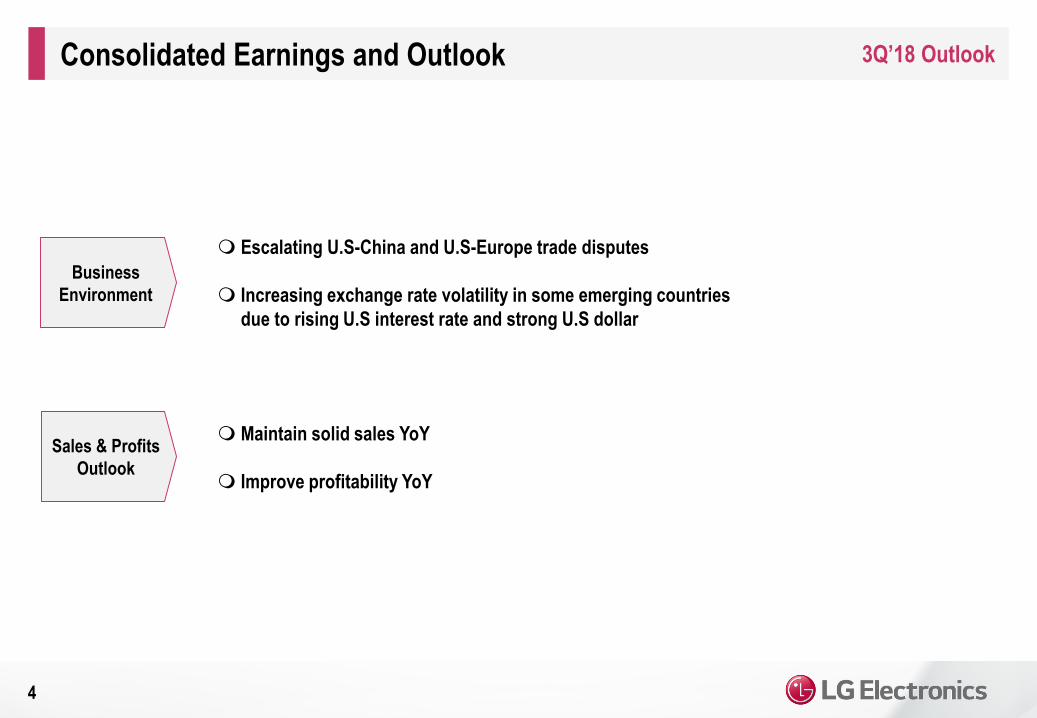
3Q’18 OutlookConsolidated Earnings and Outlook
Business
Environment
Sales & Profits
Outlook
Maintain solid sales YoY
Improve profitability YoY
Escalating U.S-China and U.S-Europe trade disputes
Increasing exchange rate volatility in some emerging countries
due to rising U.S interest rate and strong U.S dollar
Ⅱ Performance and Outlook by Division
5
H&A (Home Appliance and Air Solution)
2Q’18 Performance
3Q’18 Outlook
Sales :
Profitability :
LGE :
Market :
TWINWashInstaView DID WhisenThinQ A/C
*1) From 1Q'18, Energy Management Solution, Energy Storage System has been restated
to ‘H&A division’ from ‘Others’
Performance and Outlook by Division
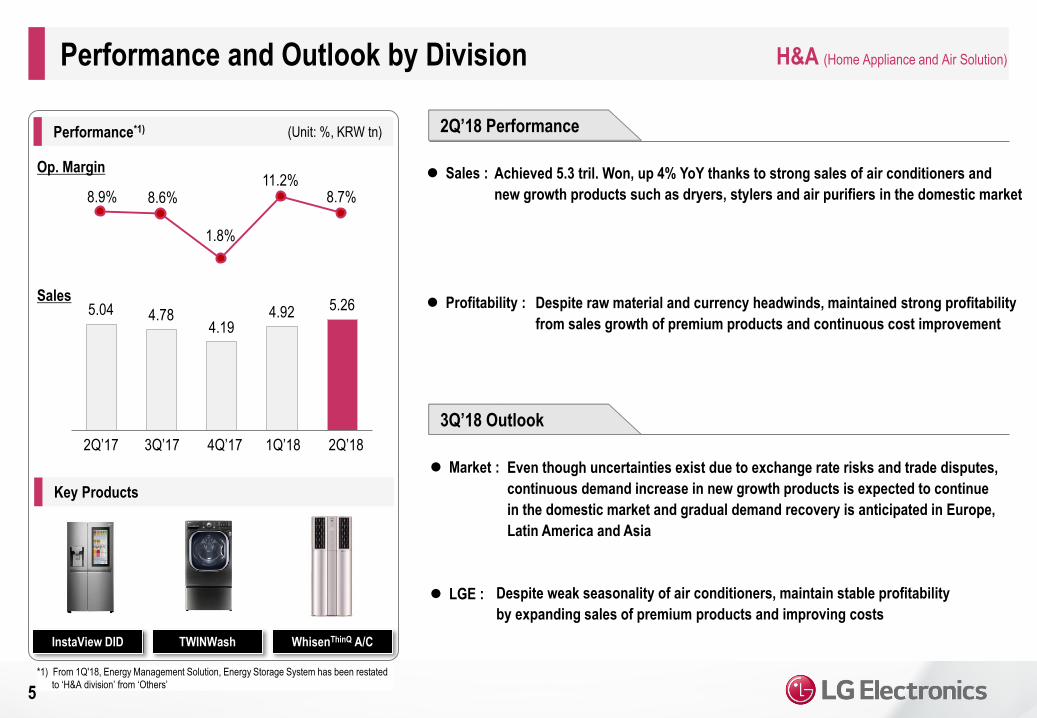
Performance*1) (Unit: %, KRW tn)
Key Products
Op. Margin
Sales
Achieved 5.3 tril. Won, up 4% YoY thanks to strong sales of air conditioners and
new growth products such as dryers, stylers and air purifiers in the domestic market
Despite raw material and currency headwinds, maintained strong profitability
from sales growth of premium products and continuous cost improvement
Even though uncertainties exist due to exchange rate risks and trade disputes,
continuous demand increase in new growth products is expected to continue
in the domestic market and gradual demand recovery is anticipated in Europe,
Latin America and Asia
Despite weak seasonality of air conditioners, maintain stable profitability
by expanding sales of premium products and improving costs
8.9% 8.6%
1.8%
11.2%8.7%
5.04 4.784.19
4.92 5.26
17.2Q 17.3Q 17.4Q 18.1Q 18.2Q2Q’182Q’17 3Q’17 4Q’17 1Q’18

6
HE (Home Entertainment)
LG Super Ultra UHD TV (Nano Cell TV)LG SIGNATURE OLED TV W
Profitability :
LGE :
Market :
Sales :
Performance and Outlook by Division
(Unit: %, KRW tn)
Key Products
Op. Margin
SalesIn spite of marketing expense increase due to global sport event and
new product launches, maintained stable profitability by expanding
sales of premium products and improving cost structure
Sustain solid profit structure by constantly expanding sales of OLED TVs
and UHD TVs and further enhancing cost competitiveness
While global TV market is expected to see weaker demand primarily due to
economic downturn in Latin America, the Middle East and Africa,
premium TV market is expected to maintain growth
Up 4% YoY from strong sales of premium products such as OLED TVs
and newly launched products
*1) From 1Q'18, ID division has been restated to ‘B2B division’ from ‘HE division’
Performance*1) 2Q’18 Performance
3Q’18 Outlook
7.7%9.6%
6.9%
14.0%10.6%
3.674.06
4.874.12 3.82
17.2Q 17.3Q 17.4Q 18.1Q 18.2Q2Q’182Q’17 3Q’17 4Q’17 1Q’18
7
MC (Mobile Communications)
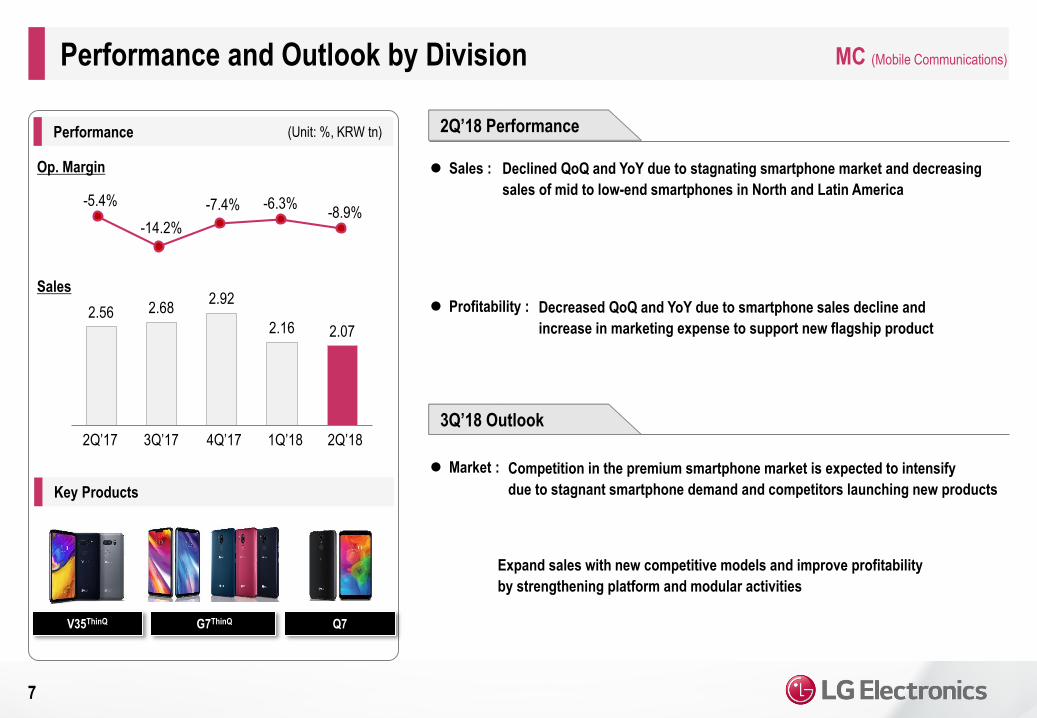
Declined QoQ and YoY due to stagnating smartphone market and decreasing
sales of mid to low-end smartphones in North and Latin America
Market :
Performance and Outlook by Division
Performance (Unit: %, KRW tn)
Key Products
Op. Margin
Sales
Profitability :
Sales :
Decreased QoQ and YoY due to smartphone sales decline and
increase in marketing expense to support new flagship product
Competition in the premium smartphone market is expected to intensify
due to stagnant smartphone demand and competitors launching new products
2Q’18 Performance
3Q’18 Outlook
2.56 2.682.92
2.16 2.07
17.2Q 17.3Q 17.4Q 18.1Q 18.2Q2Q’182Q’17 3Q’17 4Q’17 1Q’18
-5.4%
-14.2%
-7.4% -6.3%-8.9%
G7ThinQV35ThinQ Q7
Expand sales with new competitive models and improve profitability
by strengthening platform and modular activities
8
VC (Vehicle Components)
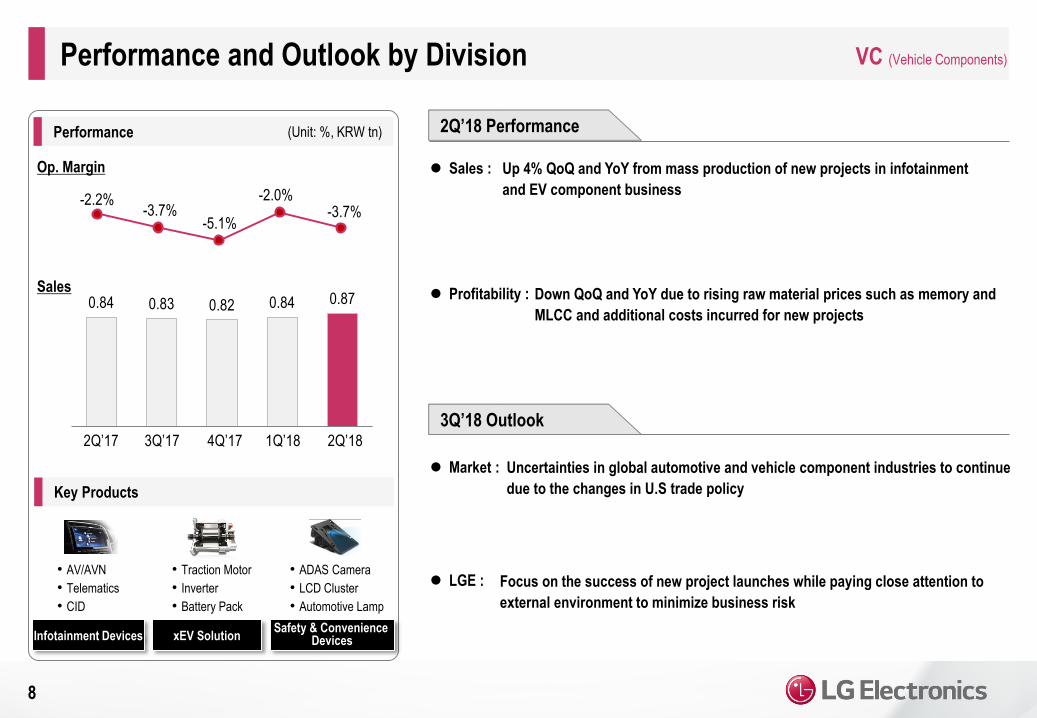
• AV/AVN
• Telematics
• CID
Performance and Outlook by Division
Performance (Unit: %, KRW tn)
Key Products
Op. Margin
Sales
LGE :
Market :
Profitability :
Sales :
Down QoQ and YoY due to rising raw material prices such as memory and
MLCC and additional costs incurred for new projects
• Traction Motor
• Inverter
• Battery Pack
• ADAS Camera
• LCD Cluster
• Automotive Lamp
Focus on the success of new project launches while paying close attention to
external environment to minimize business risk
Uncertainties in global automotive and vehicle component industries to continue
due to the changes in U.S trade policy
Up 4% QoQ and YoY from mass production of new projects in infotainment
and EV component business
2Q’18 Performance
3Q’18 Outlook
Infotainment Devices xEV SolutionSafety & Convenience
Devices
-2.2%-3.7%
-5.1%
-2.0%-3.7%
0.84 0.83 0.82 0.84 0.87
17.2Q 17.3Q 17.4Q 18.1Q 18.2Q2Q’182Q’17 3Q’17 4Q’17 1Q’18
*1) From 1Q'18, B2B division has been newly established. ID(Information display) business
has been restated to B2B from ‘HE division’ and solar module business has been restated
to B2B from ‘Others’ 9
B2B (Business to Business)Performance and Outlook by Division
Performance*1) (Unit: %, KRW tn)
Key Products
Op. Margin
Sales
LGE :
Market :
Profitability :
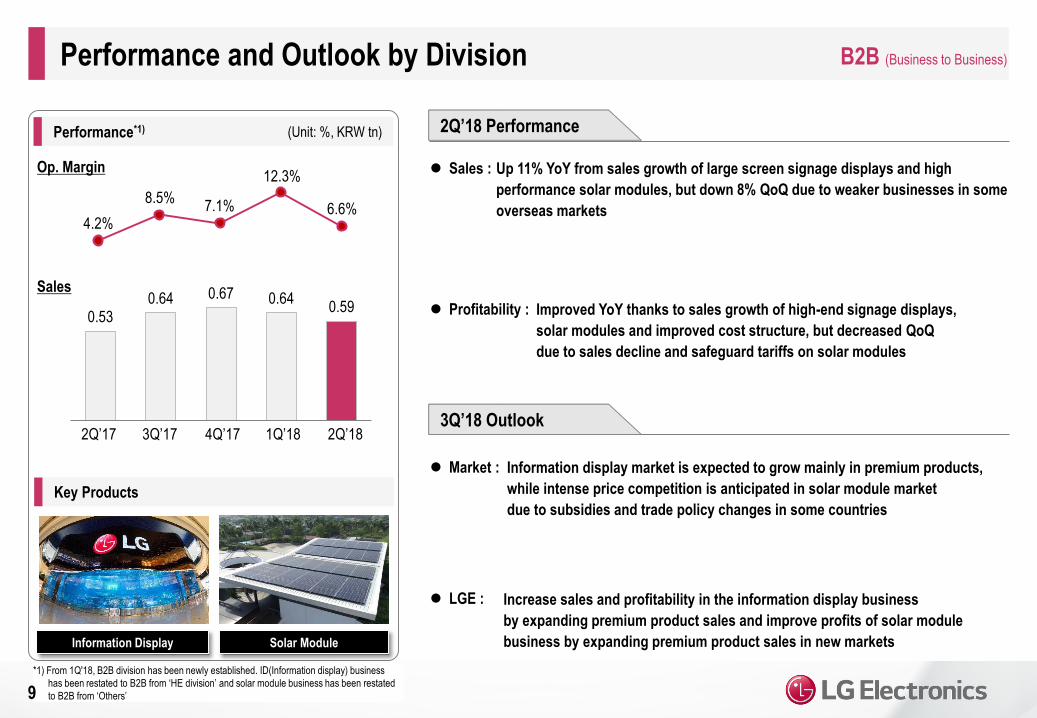
Sales :
Improved YoY thanks to sales growth of high-end signage displays,
solar modules and improved cost structure, but decreased QoQ
due to sales decline and safeguard tariffs on solar modules
Increase sales and profitability in the information display business
by expanding premium product sales and improve profits of solar module
business by expanding premium product sales in new markets
Information display market is expected to grow mainly in premium products,
while intense price competition is anticipated in solar module market
due to subsidies and trade policy changes in some countries
Up 11% YoY from sales growth of large screen signage displays and high
performance solar modules, but down 8% QoQ due to weaker businesses in some
overseas markets
Solar ModuleInformation Display
2Q’18 Performance
3Q’18 Outlook
4.2%
8.5%7.1%
12.3%
6.6%
0.530.64 0.67 0.64
0.59
17.2Q 17.3Q 17.4Q 18.1Q 18.2Q2Q’182Q’17 3Q’17 4Q’17 1Q’18
http://www.lg.com/global
Appendix
*) Since the information regarding results of 2Q'18 has been prepared in advance, it is subject to change in the process of final review by external auditors
Summarized Financial Statements (Consolidated)
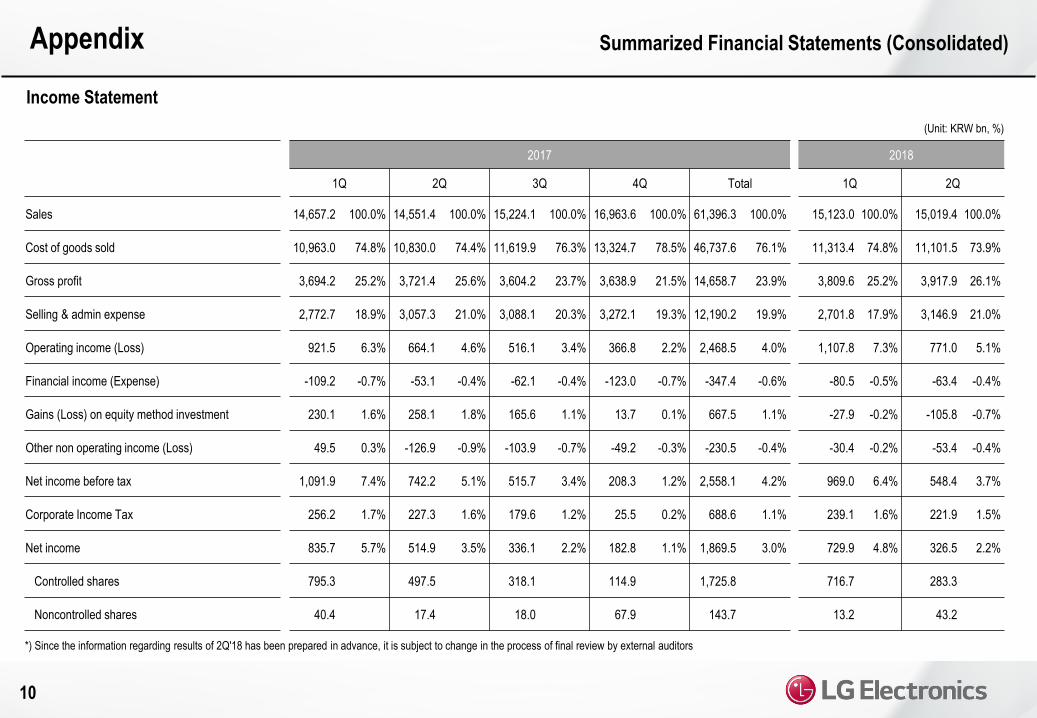
Income Statement
10
(Unit: KRW bn, %)
2017 2018
1Q 2Q 3Q 4Q Total 1Q 2Q
Sales 14,657.2 100.0% 14,551.4 100.0% 15,224.1 100.0% 16,963.6 100.0% 61,396.3 100.0% 15,123.0 100.0% 15,019.4 100.0%
Cost of goods sold 10,963.0 74.8% 10,830.0 74.4% 11,619.9 76.3% 13,324.7 78.5% 46,737.6 76.1% 11,313.4 74.8% 11,101.5 73.9%
Gross profit 3,694.2 25.2% 3,721.4 25.6% 3,604.2 23.7% 3,638.9 21.5% 14,658.7 23.9% 3,809.6 25.2% 3,917.9 26.1%
Selling & admin expense 2,772.7 18.9% 3,057.3 21.0% 3,088.1 20.3% 3,272.1 19.3% 12,190.2 19.9% 2,701.8 17.9% 3,146.9 21.0%
Operating income (Loss) 921.5 6.3% 664.1 4.6% 516.1 3.4% 366.8 2.2% 2,468.5 4.0% 1,107.8 7.3% 771.0 5.1%
Financial income (Expense) -109.2 -0.7% -53.1 -0.4% -62.1 -0.4% -123.0 -0.7% -347.4 -0.6% -80.5 -0.5% -63.4 -0.4%
Gains (Loss) on equity method investment 230.1 1.6% 258.1 1.8% 165.6 1.1% 13.7 0.1% 667.5 1.1% -27.9 -0.2% -105.8 -0.7%
Other non operating income (Loss) 49.5 0.3% -126.9 -0.9% -103.9 -0.7% -49.2 -0.3% -230.5 -0.4% -30.4 -0.2% -53.4 -0.4%
Net income before tax 1,091.9 7.4% 742.2 5.1% 515.7 3.4% 208.3 1.2% 2,558.1 4.2% 969.0 6.4% 548.4 3.7%
Corporate Income Tax 256.2 1.7% 227.3 1.6% 179.6 1.2% 25.5 0.2% 688.6 1.1% 239.1 1.6% 221.9 1.5%
Net income 835.7 5.7% 514.9 3.5% 336.1 2.2% 182.8 1.1% 1,869.5 3.0% 729.9 4.8% 326.5 2.2%
Controlled shares 795.3 497.5 318.1 114.9 1,725.8 716.7 283.3
Noncontrolled shares 40.4 17.4 18.0 67.9 143.7 13.2 43.2
Appendix
*) Since the information regarding results of 2Q'18 has been prepared in advance, it is subject to change in the process of final review by external auditors
Summarized Financial Statements (Consolidated)
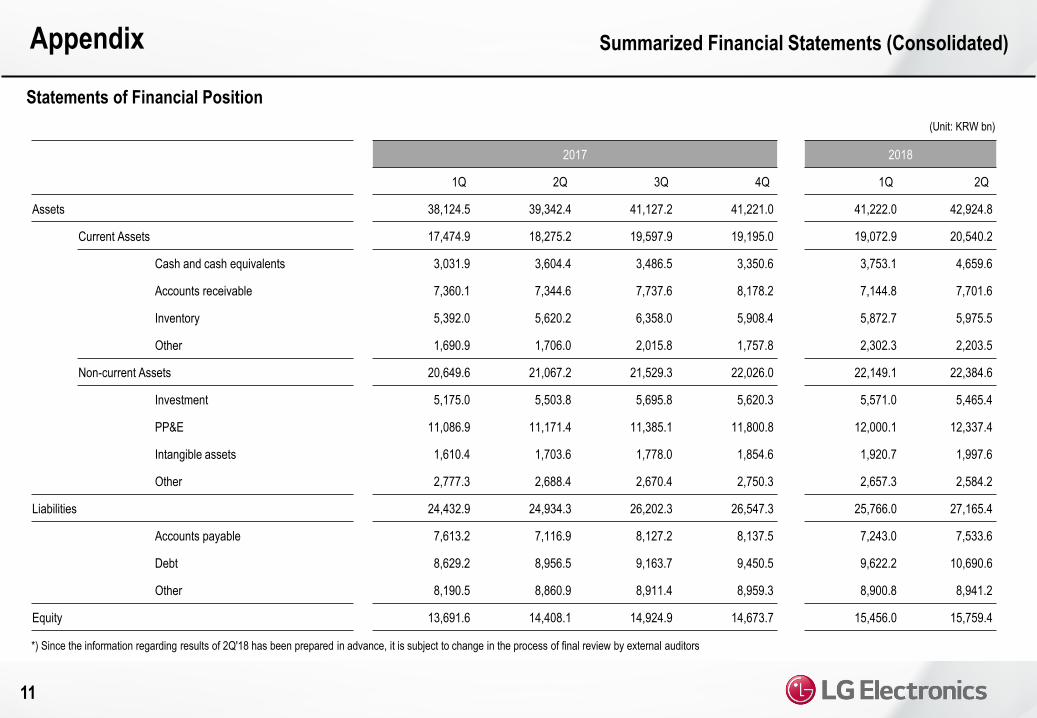
Statements of Financial Position
11
(Unit: KRW bn)
2017 2018
1Q 2Q 3Q 4Q 1Q 2Q
Assets 38,124.5 39,342.4 41,127.2 41,221.0 41,222.0 42,924.8
Current Assets 17,474.9 18,275.2 19,597.9 19,195.0 19,072.9 20,540.2
Cash and cash equivalents 3,031.9 3,604.4 3,486.5 3,350.6 3,753.1 4,659.6
Accounts receivable 7,360.1 7,344.6 7,737.6 8,178.2 7,144.8 7,701.6
Inventory 5,392.0 5,620.2 6,358.0 5,908.4 5,872.7 5,975.5
Other 1,690.9 1,706.0 2,015.8 1,757.8 2,302.3 2,203.5
Non-current Assets 20,649.6 21,067.2 21,529.3 22,026.0 22,149.1 22,384.6
Investment 5,175.0 5,503.8 5,695.8 5,620.3 5,571.0 5,465.4
PP&E 11,086.9 11,171.4 11,385.1 11,800.8 12,000.1 12,337.4
Intangible assets 1,610.4 1,703.6 1,778.0 1,854.6 1,920.7 1,997.6
Other 2,777.3 2,688.4 2,670.4 2,750.3 2,657.3 2,584.2
Liabilities 24,432.9 24,934.3 26,202.3 26,547.3 25,766.0 27,165.4
Accounts payable 7,613.2 7,116.9 8,127.2 8,137.5 7,243.0 7,533.6
Debt 8,629.2 8,956.5 9,163.7 9,450.5 9,622.2 10,690.6
Other 8,190.5 8,860.9 8,911.4 8,959.3 8,900.8 8,941.2
Equity 13,691.6 14,408.1 14,924.9 14,673.7 15,456.0 15,759.4
1Q'17 2Q'17 3Q'17 4Q'17 '17 Total 1Q'18 2Q'18QoQ YoY
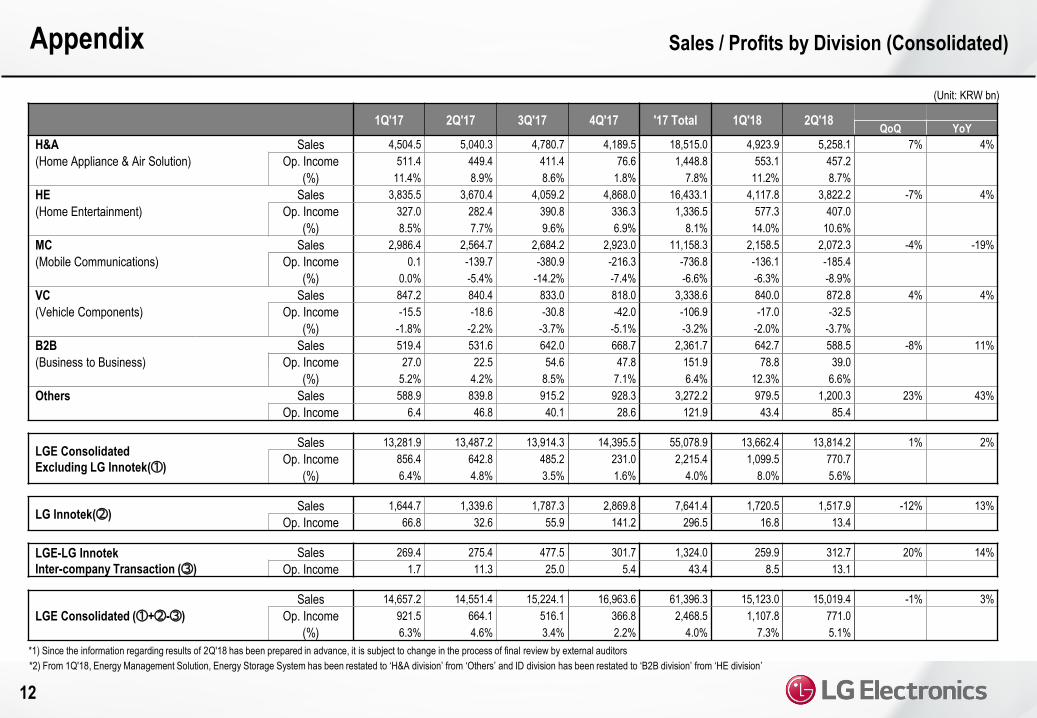
H&A Sales 4,504.5 5,040.3 4,780.7 4,189.5 18,515.0 4,923.9 5,258.1 7% 4%
(Home Appliance & Air Solution) Op. Income 511.4 449.4 411.4 76.6 1,448.8 553.1 457.2
(%) 11.4% 8.9% 8.6% 1.8% 7.8% 11.2% 8.7%
HE Sales 3,835.5 3,670.4 4,059.2 4,868.0 16,433.1 4,117.8 3,822.2 -7% 4%
(Home Entertainment) Op. Income 327.0 282.4 390.8 336.3 1,336.5 577.3 407.0
(%) 8.5% 7.7% 9.6% 6.9% 8.1% 14.0% 10.6%
MC Sales 2,986.4 2,564.7 2,684.2 2,923.0 11,158.3 2,158.5 2,072.3 -4% -19%
(Mobile Communications) Op. Income 0.1 -139.7 -380.9 -216.3 -736.8 -136.1 -185.4
(%) 0.0% -5.4% -14.2% -7.4% -6.6% -6.3% -8.9%
VC Sales 847.2 840.4 833.0 818.0 3,338.6 840.0 872.8 4% 4%
(Vehicle Components) Op. Income -15.5 -18.6 -30.8 -42.0 -106.9 -17.0 -32.5
(%) -1.8% -2.2% -3.7% -5.1% -3.2% -2.0% -3.7%
B2B Sales 519.4 531.6 642.0 668.7 2,361.7 642.7 588.5 -8% 11%
(Business to Business) Op. Income 27.0 22.5 54.6 47.8 151.9 78.8 39.0
(%) 5.2% 4.2% 8.5% 7.1% 6.4% 12.3% 6.6%
Others Sales 588.9 839.8 915.2 928.3 3,272.2 979.5 1,200.3 23% 43%
Op. Income 6.4 46.8 40.1 28.6 121.9 43.4 85.4
LGE Consolidated
Excluding LG Innotek(①)
Sales 13,281.9 13,487.2 13,914.3 14,395.5 55,078.9 13,662.4 13,814.2 1% 2%
Op. Income 856.4 642.8 485.2 231.0 2,215.4 1,099.5 770.7
(%) 6.4% 4.8% 3.5% 1.6% 4.0% 8.0% 5.6%
LG Innotek(②)Sales 1,644.7 1,339.6 1,787.3 2,869.8 7,641.4 1,720.5 1,517.9 -12% 13%
Op. Income 66.8 32.6 55.9 141.2 296.5 16.8 13.4
LGE-LG Innotek
Inter-company Transaction (③)
Sales 269.4 275.4 477.5 301.7 1,324.0 259.9 312.7 20% 14%
Op. Income 1.7 11.3 25.0 5.4 43.4 8.5 13.1
LGE Consolidated (①+②-③)
Sales 14,657.2 14,551.4 15,224.1 16,963.6 61,396.3 15,123.0 15,019.4 -1% 3%
Op. Income 921.5 664.1 516.1 366.8 2,468.5 1,107.8 771.0
(%) 6.3% 4.6% 3.4% 2.2% 4.0% 7.3% 5.1%
Appendix
*2) From 1Q'18, Energy Management Solution, Energy Storage System has been restated to ‘H&A division’ from ‘Others’ and ID division has been restated to ‘B2B division’ from ‘HE division’
*1) Since the information regarding results of 2Q'18 has been prepared in advance, it is subject to change in the process of final review by external auditors
Sales / Profits by Division (Consolidated)
(Unit: KRW bn)
12