Embed Size (px)
Citation preview
1 de 24
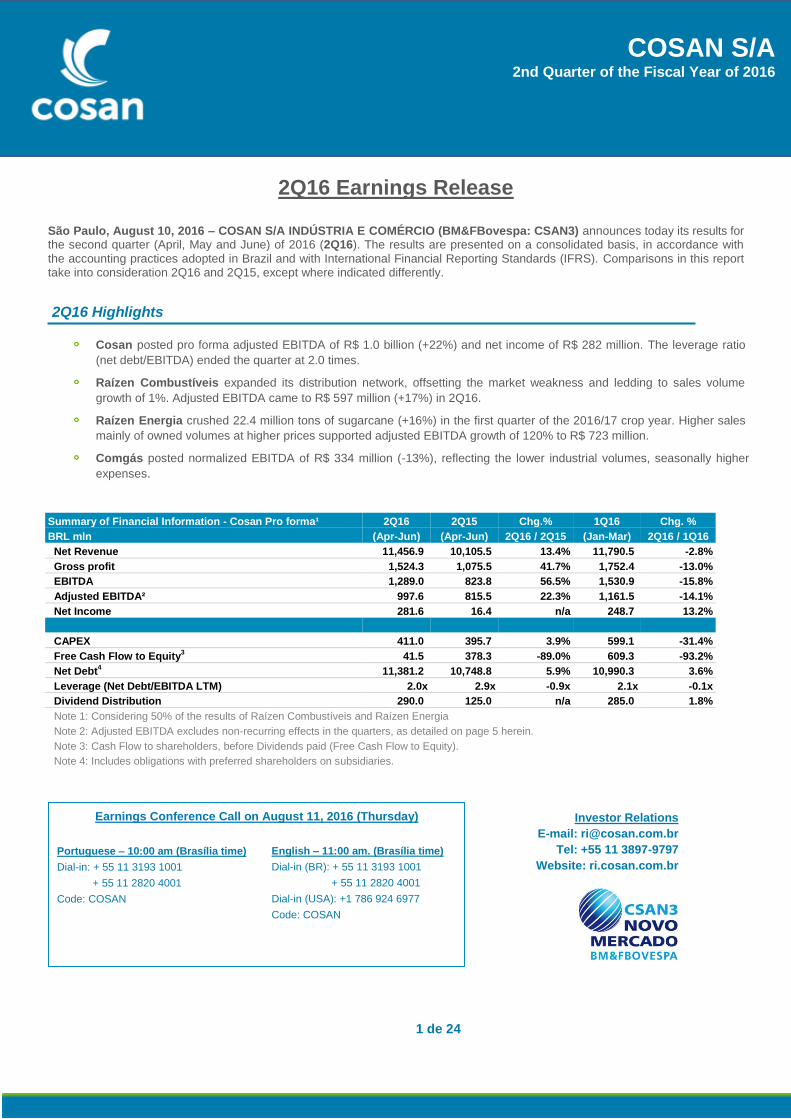
COSAN S/A 2nd Quarter of the Fiscal Year of 2016
2Q16 Earnings Release
São Paulo, August 10, 2016 – COSAN S/A INDÚSTRIA E COMÉRCIO (BM&FBovespa: CSAN3) announces today its results for the second quarter (April, May and June) of 2016 (2Q16). The results are presented on a consolidated basis, in accordance with
the accounting practices adopted in Brazil and with International Financial Reporting Standards (IFRS). Comparisons in this report take into consideration 2Q16 and 2Q15, except where indicated differently.
2Q16 Highlights
Cosan posted pro forma adjusted EBITDA of R$ 1.0 billion (+22%) and net income of R$ 282 million. The leverage ratio
(net debt/EBITDA) ended the quarter at 2.0 times.
Raízen Combustíveis expanded its distribution network, offsetting the market weakness and ledding to sales volume
growth of 1%. Adjusted EBITDA came to R$ 597 million (+17%) in 2Q16.
Raízen Energia crushed 22.4 million tons of sugarcane (+16%) in the first quarter of the 2016/17 crop year. Higher sales
mainly of owned volumes at higher prices supported adjusted EBITDA growth of 120% to R$ 723 million.
Comgás posted normalized EBITDA of R$ 334 million (-13%), reflecting the lower industrial volumes, seasonally higher
expenses.
Summary of Financial Information - Cosan Pro forma¹ 2Q16 2Q15 Chg.% 1Q16 Chg. %
BRL mln (Apr-Jun) (Apr-Jun) 2Q16 / 2Q15 (Jan-Mar) 2Q16 / 1Q16
Net Revenue 11,456.9 10,105.5 13.4% 11,790.5 -2.8%
Gross profit 1,524.3 1,075.5 41.7% 1,752.4 -13.0%
EBITDA 1,289.0 823.8 56.5% 1,530.9 -15.8%
Adjusted EBITDA² 997.6 815.5 22.3% 1,161.5 -14.1%
Net Income 281.6 16.4 n/a 248.7 13.2%
CAPEX 411.0 395.7 3.9% 599.1 -31.4%
Free Cash Flow to Equity3 41.5 378.3 -89.0% 609.3 -93.2%
Net Debt4 11,381.2 10,748.8 5.9% 10,990.3 3.6%
Leverage (Net Debt/EBITDA LTM) 2.0x 2.9x -0.9x 2.1x -0.1x
Dividend Distribution 290.0 125.0 n/a 285.0 1.8%
Note 1: Considering 50% of the results of Raízen Combustíveis and Raízen Energia
Note 2: Adjusted EBITDA excludes non-recurring effects in the quarters, as detailed on page 5 herein.
Note 3: Cash Flow to shareholders, before Dividends paid (Free Cash Flow to Equity).
Note 4: Includes obligations with preferred shareholders on subsidiaries.
Earnings Conference Call on August 11, 2016 (Thursday)
Portuguese – 10:00 am (Brasília time)
Dial-in: + 55 11 3193 1001
+ 55 11 2820 4001
Code: COSAN
English – 11:00 am. (Brasília time)
Dial-in (BR): + 55 11 3193 1001
+ 55 11 2820 4001
Dial-in (USA): +1 786 924 6977
Code: COSAN
Investor Relations
E-mail: [email protected]
Tel: +55 11 3897-9797
Website: ri.cosan.com.br
2 de 24
Cosan S/A – Earnings Release 2nd Quarter of the Fiscal Year of 2016
A.Cosan - Consolidated Results
Business Units
Cosan's business units and interest in each reportable segment are shown below:
Raízen Combustíveis (50%) Fuel Distribution
Raízen Energia (50%) Sugar, Ethanol and Cogeneration
Comgás (61.7%) Natural Gas Distribution
Lubrificantes (100%) Lubricants, Basic Oils and Specialties
Radar (37.7%) Management of Agricultural Properties
Cosan Corporate (100%) Corporate Structure and Other Investments
Comparisons in this report take into consideration 2Q16 and 2Q15, except where indicated differently.
Executive Summary 2Q16
Cosan’s consolidated results in the second quarter of 2016 increased over the same period last year, despite the more
challenging environment in Brazil. The macroeconomic scenario continues to be affected by the political uncertainties, weaker
U.S. dollar and volatility in sugar, ethanol and crude oil prices. Nevertheless, our business continues to grow, supported by the
expansion of our fuel, natural gas and lubricant distribution networks and by higher sales of own sugar and ethanol volumes at
higher prices.
Pro Forma Results Cosan S/A: Adjusted EBITDA amounted to R$ 1.0 billion (+22%) in 2Q16, while reported EBITDA was
R$ 1.3 billion (+56%). Adjusted EBITDA growth was driven primarily by the better results at Raízen Energia, with the earlier start
of crushing activities for the 2016/17 crop year increasing crushing in the quarter and consequently increasing the availability of
own products, which were sold with higher prices. The expansion of Raízen Combustíveis’ distribution network enabled it to
outperform the overall industry in terms of sales volumes, combined with the optimization of the supply and commercialization
strategy. Despite the gas tariff adjustment authorized in May and the better sales performance of the residential and commercial
segments, Comgás normalized EBITDA (adjusted for the current account effect) decreased compared to 2Q15. Net income
amounted to R$ 282 million, posting significant growth compared to 2Q15. Cosan generated FCFE of R$ 42 million, impacted by
the debt restructuring process concluded after the close of the quarter and by the exercise of a put option, as explained in the 1Q16
release. Net debt/EBITDA reduced further to 2.0x on the back of the better operational performance and acceleration of current-
account recovery at Comgás.
Raízen Combustíveis: Adjusted EBITDA reached R$ 597 million (+17%) in 2Q16. Reported EBITDA grew 29%, benefiting from
asset divestments and a tax recovery. Demand for fuels in Brazil, which continued to suffer from the country’s economic slowdown, declined 5% in 2Q16 (ANP data), while Raízen posted sales growth of 0.6%, confirming the consistency of our long-term organic growth strategy. Sales of Otto-cycle fuels (gasoline + ethanol) were flat compared to 2Q15, supported by the accelerated pace of service station conversions and the volume ramp-up of stations converted in recent quarters. Raízen’s diesel sales advanced 2% in the same comparison, driven mainly by new B2B contracts, while the Brazilian market contracted 4% (ANP data). EBITDA growth in the quarter reflects the higher sales volumes with a better product mix, optimization of the supply strategy gains and better management of inventories. Raízen Energia: Adjusted EBITDA, excluding the effects from the variation in the fair value of biological assets, amounted
to R$ 723 million (+120%) in 2Q16 (first quarter of the 2016/17 crop year). With the anticipation of the start of the crushing
season to March at certain mills, crushing operations reached maximum utilization already at the start of the quarter, while crushing
began only in mid-April in the 2Q15. As a result, crushing grew 16% to 22.4 million tons in the quarter, supporting higher production
and sales of own products to capture better prices in the period. Agricultural productivity remained high, while the production mix
remained focused on maximizing sugar production (55% sugar vs. 45% ethanol). Unit cash cost in sugar-equivalent, excluding the
effects from the higher cost of third-party sugarcane (CONSECANA), increased only 1%, reflecting the capture of efficiency gains.
CAPEX amounted to R$ 358 million in the quarter (-6%), since there were lower expenditure related to intercrop maintenance and
the winter planting operations were postponed due to weather conditions.
Comgás: EBITDA normalized by the effect from the regulatory current account amounted to R$ 334 million, 13% lower
versus 2Q15. The residential and commercial segments grew 6% and 3%, respectively, reflecting the connection of new
customers. Sales in the industrial and cogeneration segments continued to suffer from the recession and declined 8% and 10%,
respectively, in the period. Total sales volumes (ex-thermal power) contracted 6% compared to 2Q15. Normalized EBITDA was
negatively affected by: (i) lower sales volumes, (ii) seasonally higher expenses; and (iii) an one-off impact (non-cash) of R$ 60
3 de 24
Cosan S/A – Earnings Release 2nd Quarter of the Fiscal Year of 2016
million reflecting tariffs adjustment, which contracted due to lower cost of gas in May. Note that margins went up in line with inflation
according to concession agreement.
Lubrificantes: EBITDA came to R$ 27 million in 2Q16, 30% lower than in 2Q15, despite the 9% increase in sales volumes. The
higher costs due to the FX rate and the increase in selling expenses explain the drop in EBITDA.
Radar: EBITDA increased 23% to R$ 26 million, reflecting the higher revenues from land leasing (notably for sugarcane planting)
and the positive variation in the market indexes that affect the appraisal of the owned land portfolio (non-cash impact on P&L).
Radar ended 2Q16 with 278,300 hectares of owned and third-party land under management, with a market value of R$ 5.7 billion.
The following tables present the key operating and financial metrics of our businesses. Historical data for the information presented
can be found on our Investor Relations website (ir.cosan.com.br) in the Results Center. We present statements with all financial
and operational data for each segment starting on page 17 of this report.
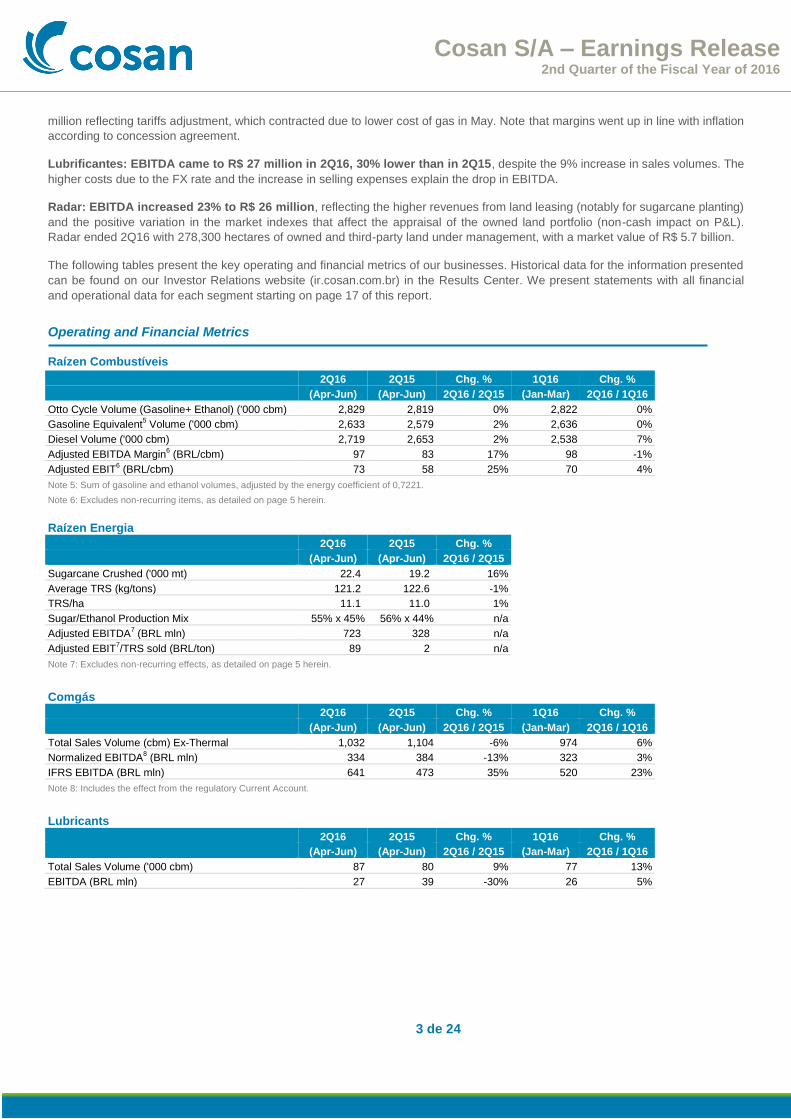
Operating and Financial Metrics Raízen Combustíveis
2Q16 2Q15 Chg. % 1Q16 Chg. %
(Apr-Jun) (Apr-Jun) 2Q16 / 2Q15 (Jan-Mar) 2Q16 / 1Q16
Otto Cycle Volume (Gasoline+ Ethanol) ('000 cbm) 2,829 2,819 0% 2,822 0%
Gasoline Equivalent5 Volume ('000 cbm) 2,633 2,579 2% 2,636 0%
Diesel Volume ('000 cbm) 2,719 2,653 2% 2,538 7%
Adjusted EBITDA Margin6 (BRL/cbm) 97 83 17% 98 -1%
Adjusted EBIT6 (BRL/cbm) 73 58 25% 70 4%
Note 5: Sum of gasoline and ethanol volumes, adjusted by the energy coefficient of 0,7221.
Note 6: Excludes non-recurring items, as detailed on page 5 herein.
Raízen Energia 2Q16 2Q15 Chg. %
(Apr-Jun) (Apr-Jun) 2Q16 / 2Q15
Sugarcane Crushed ('000 mt) 22.4 19.2 16%
Average TRS (kg/tons) 121.2 122.6 -1%
TRS/ha 11.1 11.0 1%
Sugar/Ethanol Production Mix 55% x 45% 56% x 44% n/a
Adjusted EBITDA7 (BRL mln) 723 328 n/a
Adjusted EBIT7/TRS sold (BRL/ton) 89 2 n/a
Note 7: Excludes non-recurring effects, as detailed on page 5 herein.
Comgás
2Q16 2Q15 Chg. % 1Q16 Chg. %
(Apr-Jun) (Apr-Jun) 2Q16 / 2Q15 (Jan-Mar) 2Q16 / 1Q16
Total Sales Volume (cbm) Ex-Thermal 1,032 1,104 -6% 974 6%
Normalized EBITDA8 (BRL mln) 334 384 -13% 323 3%
IFRS EBITDA (BRL mln) 641 473 35% 520 23%
Note 8: Includes the effect from the regulatory Current Account.
Lubricants
2Q16 2Q15 Chg. % 1Q16 Chg. %
(Apr-Jun) (Apr-Jun) 2Q16 / 2Q15 (Jan-Mar) 2Q16 / 1Q16
Total Sales Volume ('000 cbm) 87 80 9% 77 13%
EBITDA (BRL mln) 27 39 -30% 26 5%
4 de 24
Cosan S/A – Earnings Release 2nd Quarter of the Fiscal Year of 2016
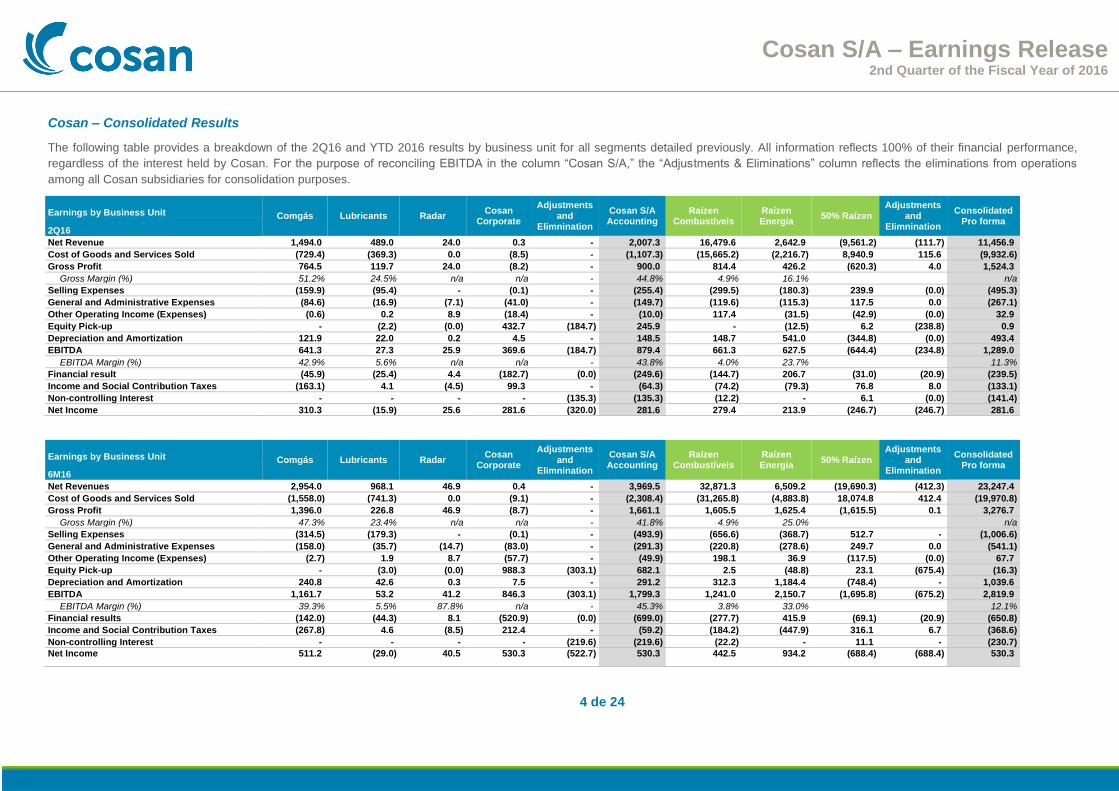
Cosan – Consolidated Results
The following table provides a breakdown of the 2Q16 and YTD 2016 results by business unit for all segments detailed previously. All information reflects 100% of their financial performance,
regardless of the interest held by Cosan. For the purpose of reconciling EBITDA in the column “Cosan S/A,” the “Adjustments & Eliminations” column reflects the eliminations from operations
among all Cosan subsidiaries for consolidation purposes.
Earnings by Business Unit Comgás Lubricants Radar Cosan
Corporate
Adjustments and
Elimnination
Cosan S/A Accounting
Raízen Combustíveis
Raízen Energia
50% Raízen Adjustments
and Elimnination
Consolidated Pro forma
2Q16
Net Revenue 1,494.0 489.0 24.0 0.3 - 2,007.3 16,479.6 2,642.9 (9,561.2) (111.7) 11,456.9
Cost of Goods and Services Sold (729.4) (369.3) 0.0 (8.5) - (1,107.3) (15,665.2) (2,216.7) 8,940.9 115.6 (9,932.6)
Gross Profit 764.5 119.7 24.0 (8.2) - 900.0 814.4 426.2 (620.3) 4.0 1,524.3
Gross Margin (%) 51.2% 24.5% n/a n/a - 44.8% 4.9% 16.1% n/a
Selling Expenses (159.9) (95.4) - (0.1) - (255.4) (299.5) (180.3) 239.9 (0.0) (495.3)
General and Administrative Expenses (84.6) (16.9) (7.1) (41.0) - (149.7) (119.6) (115.3) 117.5 0.0 (267.1)
Other Operating Income (Expenses) (0.6) 0.2 8.9 (18.4) - (10.0) 117.4 (31.5) (42.9) (0.0) 32.9
Equity Pick-up - (2.2) (0.0) 432.7 (184.7) 245.9 - (12.5) 6.2 (238.8) 0.9
Depreciation and Amortization 121.9 22.0 0.2 4.5 - 148.5 148.7 541.0 (344.8) (0.0) 493.4
EBITDA 641.3 27.3 25.9 369.6 (184.7) 879.4 661.3 627.5 (644.4) (234.8) 1,289.0
EBITDA Margin (%) 42.9% 5.6% n/a n/a - 43.8% 4.0% 23.7% 11.3%
Financial result (45.9) (25.4) 4.4 (182.7) (0.0) (249.6) (144.7) 206.7 (31.0) (20.9) (239.5)
Income and Social Contribution Taxes (163.1) 4.1 (4.5) 99.3 - (64.3) (74.2) (79.3) 76.8 8.0 (133.1)
Non-controlling Interest - - - - (135.3) (135.3) (12.2) - 6.1 (0.0) (141.4)
Net Income 310.3 (15.9) 25.6 281.6 (320.0) 281.6 279.4 213.9 (246.7) (246.7) 281.6
Earnings by Business Unit Comgás Lubricants Radar Cosan
Corporate
Adjustments and
Elimnination
Cosan S/A Accounting
Raízen Combustíveis
Raízen Energia
50% Raízen Adjustments
and Elimnination
Consolidated Pro forma
6M16
Net Revenues 2,954.0 968.1 46.9 0.4 - 3,969.5 32,871.3 6,509.2 (19,690.3) (412.3) 23,247.4
Cost of Goods and Services Sold (1,558.0) (741.3) 0.0 (9.1) - (2,308.4) (31,265.8) (4,883.8) 18,074.8 412.4 (19,970.8)
Gross Profit 1,396.0 226.8 46.9 (8.7) - 1,661.1 1,605.5 1,625.4 (1,615.5) 0.1 3,276.7
Gross Margin (%) 47.3% 23.4% n/a n/a - 41.8% 4.9% 25.0% n/a
Selling Expenses (314.5) (179.3) - (0.1) - (493.9) (656.6) (368.7) 512.7 - (1,006.6)
General and Administrative Expenses (158.0) (35.7) (14.7) (83.0) - (291.3) (220.8) (278.6) 249.7 0.0 (541.1)
Other Operating Income (Expenses) (2.7) 1.9 8.7 (57.7) - (49.9) 198.1 36.9 (117.5) (0.0) 67.7
Equity Pick-up - (3.0) (0.0) 988.3 (303.1) 682.1 2.5 (48.8) 23.1 (675.4) (16.3)
Depreciation and Amortization 240.8 42.6 0.3 7.5 - 291.2 312.3 1,184.4 (748.4) - 1,039.6
EBITDA 1,161.7 53.2 41.2 846.3 (303.1) 1,799.3 1,241.0 2,150.7 (1,695.8) (675.2) 2,819.9
EBITDA Margin (%) 39.3% 5.5% 87.8% n/a - 45.3% 3.8% 33.0% 12.1%
Financial results (142.0) (44.3) 8.1 (520.9) (0.0) (699.0) (277.7) 415.9 (69.1) (20.9) (650.8)
Income and Social Contribution Taxes (267.8) 4.6 (8.5) 212.4 - (59.2) (184.2) (447.9) 316.1 6.7 (368.6)
Non-controlling Interest - - - - (219.6) (219.6) (22.2) - 11.1 - (230.7)
Net Income 511.2 (29.0) 40.5 530.3 (522.7) 530.3 442.5 934.2 (688.4) (688.4) 530.3

5 de 24
Cosan S/A – Earnings Release 2nd Quarter of the Fiscal Year of 2016
Adjusted EBITDA and Net Income Below is a description of the adjustments made by business line, based on the following criteria:
Raízen Combustíveis: (i) effects from asset divestments; and (ii) nonrecurring gains/losses, if applicable.
o Nonrecurring effects in the periods:
2Q16: Tax recovery.
1Q16: Internal restructuring expenses.
Raízen Energia: (i) variation in biological assets and (ii) hedge accounting (debt) impacts.
Comgás: (i) effect from the regulatory current account.
Adjusted EBITDA 2Q16 2Q15 Chg.% 1Q16 Chg.%
BRL mln (Apr-Jun) (Apr-Jun) 2Q16 / 2Q15 (Jan-Mar) 2Q16 / 1Q16
Pro forma EBITDA 1,289.0 823.8 56.5% 1,530.9 -15.8%
Raízen Combustíveis (50%) (32.3) (3.3) n/a 5.3 n/a
Asset Divestments (18.3) (3.3) n/a (2.7) n/a
Non-recurring Effects (14.0) - n/a 8.0 n/a
Raízen Energia (50%) 47.9 84.0 41.1% (177.5) n/a
Change in Biological Assets 47.9 32.2 48.9% (177.5) n/a
Hedge Accounting - Debt - 51.9 n/a - n/a
Comgás – Regulatory Current Account (307.0) (89.0) n/a (197.2) 55.6%
Adjusted Pro forma EBITDA 997.6 815.5 30.3% 1,161.5 -14.1%
Adjusted Net Income 2Q16 2Q15 Chg.% 1Q16 Chg.%
BRL mln (Apr-Jun) (Apr-Jun) 2Q16 / 2Q15 (Jan-Mar) 2Q16 / 1Q16
Pro forma Net Income 281.6 16.4 n/a 248.7 13.2%
Raízen Combustíveis (50%) (21.3) (2.2) n/a 3.5 n/a
Asset Divestment (12.1) (2.2) n/a (1.8) n/a
Non-recurring Effects (9.2) - n/a 5.3 n/a
Raízen Energia (50%) 31.6 21.2 n/a (117.2) n/a
Change in Biological Assets 31.6 21.2 n/a (117.2) n/a
Comgás – Regulatory Current Account (125.0) (32.4) n/a (77.5) 61.3%
Adjusted Pro forma Net Income (Loss) 166.9 3.1 n/a 57.5 n/a

6 de 24
Cosan S/A – Earnings Release 2nd Quarter of the Fiscal Year of 2016
B. Results by Business Unit B.1 Raízen Combustíveis Fuel sales in Brazil are still affected by the lower economic activity and rising unemployment. According to the ANP, total
sales volume in the domestic market fell 4.7% from 2Q15, driven by the 3.9% drop in diesel consumption and the 9.7% decline in aviation fuel sales. The sales of Otto-cycle fuels (gasoline + ethanol) decreased 2.6% on the prior-year period. In terms of gasoline equivalent, i.e. adjusting ethanol for its energy efficiency (72.2%), sales volume decreased 1.5%, with a higher share of gasoline in the mix, affected by the slower growth of the vehicle fleet and higher unemployment in urban centers.
Raízen Combustíveis’ strategy of expanding its network of service stations led its sales volume to outperform the industry average. Otto cycle sales were flat compared to 2Q15 (+0.3%). In terms of gasoline-equivalent, sales volume grew 2.1%,
reflecting the recovery in gasoline sales (+8.6%) in relation to ethanol (-18.2%), with prices of the latter remaining above parity in most Brazilian states during the quarter. Diesel sales increased +2.5% in 2Q16, benefiting from higher sales volume to the B2B segment, with the signing of new contracts and higher consumption by agribusiness clients due to the early start of the season. The aviation segment continued to be affected by weaker demand for air travel, with sales volume down 7.9%. Compared to 1Q16, sales volume grew 2.0%, reflecting the increased competitiveness of ethanol and higher diesel consumption due to the start of the crop year.
Sales Volume 2Q16 2Q15 Chg.% 1Q16 Chg.%
000 cbm (Apr-Jun) (Apr-Jun) 2Q16 / 2Q15 (Jan-Mar) 2Q16 / 1Q16
Volume Total9 6,158 6,123 0.6% 6,035 2.0%
Ethanol 707 864 -18.2% 668 5.8%
Gasoline 2,122 1,955 8.6% 2,154 -1.5%
Diesel 2,719 2,653 2.5% 2,538 7.1%
Aviation 526 571 -7.9% 589 -10.7%
Other Products 84 80 5.6% 86 -2.4%
Note 9: Excludes sales to other distributors, in accordance with SINDICOM methodology.
In 2Q16, Raízen Combustíveis posted net revenue of R$ 16.5 billion, up 11.4% from 2Q15 and flat from 1Q16. Revenue
growth was supported by higher sales volume, a better mix and the price increases of: (i) gasoline and diesel announced by Petrobras in September 2015, and (ii) ethanol (base ESALQ) due to the higher gasoline price compared to 2Q15. In the aviation segment, where prices are pegged to international parity and to the U.S. dollar, net revenue decreased between the periods. Note that Raízen’s net revenue was impacted by a R$ 43.0 million rebate in 2Q16 (R$ 34.7 million in 2Q15) related to discounts for fuel purchases.
Cost of goods sold in 2Q16 came to R$ 15.7 billion, up 10.8%, mainly due to higher product costs, as well as to the higher
expenses with logistics, reflecting the Company’s supply strategy.
Selling, general and administrative expenses were R$ 419.1 million, increasing 10.8% on 2Q15, due to the higher logistics
expenses in the quarter and the seasonality of general, administrative and marketing expenses. Other income/expenses amounted to R$ 52.8 million, already adjusted for the asset divestments (R$36.6 million) and non-recurring gain of R$ 28.0 million from a tax recovery credit. Adjusted EBITDA grew 17.5% to R$ 596.7 million in 2Q16, reflecting the expansion network of service stations and the ramp-up of recent conversion of stations, the better sales mix with a higher share of gasoline and the optimization of the supply and inventories’ strategy. Compared to 1Q16, adjusted EBITDA was flat, advancing 1.1%. Adjusted EBIT, which includes
the depreciation and amortization of investments in infrastructure, renovation and expansion of the reselling network, increased 25.5% to R$ 448.0 million.
EBITDA 2Q16 2Q15 Chg.% 1Q16 Chg.%
BRL mln (Apr-Jun) (Apr-Jun) 2Q16 / 2Q15 (Jan-Mar) 2Q16 / 1Q16
EBITDA 661.3 514.5 28.5% 579.7 14.1%
Asset Divestments (36.6) (6.6) n/a (5.4) n/a
Other extraordinary effects (28.0) - n/a 16.0 n/a
Adjusted EBITDA 596.7 507.8 17.5% 590.3 1.1%
EBIT 512.6 363.7 40.9% 413.6 23.9%
Adjusted EBIT11
448.0 357.1 25.5% 424.2 5.6%
Investments amounted to R$ 225.8 million in the period, in line with the annual budget, and targeting the expansion and
renovation of the network of service stations. In the six-month period, investments came to R$ 405.0 million, growing 11.0%
compared to the first half of 2015. The network of Shell service stations ended the quarter with 5,832 stations (5,464 in 2Q15).

7 de 24
Cosan S/A – Earnings Release 2nd Quarter of the Fiscal Year of 2016
B.2 Raízen Energia
Second quarter results, which marks the start of the 2016/17 crop year, benefitted from the acceleration of crushing, which reached 22.4 million tons in the period (+16.3%), mainly due to the anticipation of the crushing season. The
favorable weather, with more regular rainfall over the course of the last crop year, combined with investments in planting and tilling, helped boost the yield, which reached 91.9 tons of cane per hectare (TCH), compared to 89.9 TCH in 2Q15. Average TRS in 2Q16 stood at 121.2 kg/ton, compared to 122.6 kg/ton in the same period last season. Adjusted net revenue amounted to R$ 2.6 billion (+51.0%), reflecting the growth in production and sales volumes in the quarter, combined with the higher sales prices. Note that the early start of the crop year made a positive contribution to the
2Q16 results, while 2Q15 was affected by the late start of crushing operations.
Sugar: Net revenue in 2Q16 amounted to R$ 1.1 billion (+96.1%), compared to the net revenue adjusted by hedge accounting
of debt of R$ 568.7 million reported in 2Q15. The better result reflects the growth in sugar sales volume (especially own sugar and prioritizing exports), which reached 971,000 tons (+78.2%), and the higher average sales prices of R$1,149/ton (+10.1%), following the price increase in Brazilian real practiced by the market.
Ethanol: Net revenue came to R$ 1.3 billion (+34.2%) in 2Q16, reflecting the higher average price and sales volume growth,
namely in the export market. Total sales volume was 766,000 cbm (+22.3%) mostly of own products. The average ethanol price in the quarter was R$ 1,647/m³ (+9.7%), compared to R$ 1,501/m³ in 2Q15, in line with the prices practiced in the market (ESALQ base).
Cogeneration: Net revenue in 2Q16 came to R$ 151.4 million (-12.0%). The acceleration of crushing and higher supply of
biomass supported growth in sales volume, which reached 817,000 MWh (+15.9%). However, the average sales price in the
quarter was R$185/MWh, 24.0% lower than in 2Q15, reflecting the lower spot price.
Sales Breakdown 2Q16 2Q15 Chg.%
BRL mln (Apr-Jun) (Apr-Jun) 2Q16 / 2Q15
Adjusted Net Revenue 2,642.9 1,750.6 51.0%
Sugar Sales 1,115.3 568.7 96.1%
Domestic Market 267.4 169.1 58.1%
Export Market10
847.9 399.6 n/a
Ethanol Sales 1,262.3 940.5 34.2%
Domestic Market 468.8 379.5 23.5%
Export Market 793.5 561.0 41.5%
Energy Cogeneration 151.4 172.1 -12.0%
Other Products and Services 113.8 69.4 64.1%
Hedge Accounting - Debt - (103.7) n/a
Net Revenue 2,642.9 1,646.9 60.5%
‘Note10: Net revenue from sugar exports includes the effect from hedge accounting - debt.
Sales Volume 2Q16 vs. 2Q15
Sugar (‘000 tons) Ethanol (‘000 cbm)
Sugar Inventories Ethanol Inventories
6/30/2016 6/30/2015 Chg.% 3/31/2016 Chg.% 6/30/2016 6/30/2015 Chg.% 3/31/2016 Chg.%
'000 ton 498.0 846.0 -41.1% 51.0 n/a '000 m³ 357.0 458.0 -22.1% 161.0 n/a
BRL mln 449.2 681.1 -34.1% 43.6 n/a BRL mln 479.3 542.2 -11.6% 208.5 n/a
BRL/ton 901.9 805.1 12.0% 854.9 -5.8% BRL/cbm 1,342.6 1,183.9 13.4% 1,295.0 -8.6%
Cost of goods sold in 2Q16 was R$ 2.2 billion (+40.5%), impacted by: (i) higher sales volume due to the early start of the harvest; (ii) 24.4% increase in purchase price (CONSECANA); (iii) 1.2% drop in TRS content; and (iv) interruption of operations due to rain. Unit cash cost of production in sugar-equivalent stood at R$597/ton (+13.4%) in 2Q16. The above impacts
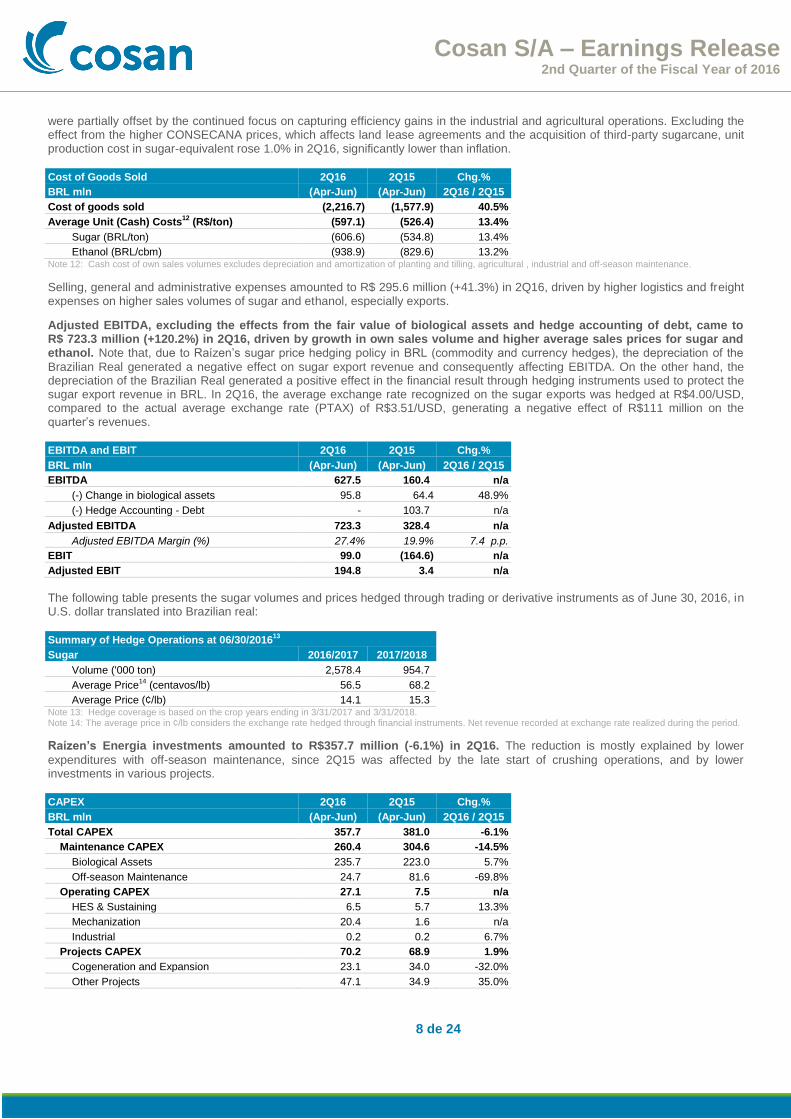
8 de 24
Cosan S/A – Earnings Release 2nd Quarter of the Fiscal Year of 2016
were partially offset by the continued focus on capturing efficiency gains in the industrial and agricultural operations. Excluding the effect from the higher CONSECANA prices, which affects land lease agreements and the acquisition of third-party sugarcane, unit production cost in sugar-equivalent rose 1.0% in 2Q16, significantly lower than inflation.
Cost of Goods Sold 2Q16 2Q15 Chg.%
BRL mln (Apr-Jun) (Apr-Jun) 2Q16 / 2Q15
Cost of goods sold (2,216.7) (1,577.9) 40.5%
Average Unit (Cash) Costs12
(R$/ton) (597.1) (526.4) 13.4%
Sugar (BRL/ton) (606.6) (534.8) 13.4%
Ethanol (BRL/cbm) (938.9) (829.6) 13.2% Note 12: Cash cost of own sales volumes excludes depreciation and amortization of planting and tilling, agricultural , industrial and off-season maintenance.
Selling, general and administrative expenses amounted to R$ 295.6 million (+41.3%) in 2Q16, driven by higher logistics and freight expenses on higher sales volumes of sugar and ethanol, especially exports.
Adjusted EBITDA, excluding the effects from the fair value of biological assets and hedge accounting of debt, came to R$ 723.3 million (+120.2%) in 2Q16, driven by growth in own sales volume and higher average sales prices for sugar and ethanol. Note that, due to Raízen’s sugar price hedging policy in BRL (commodity and currency hedges), the depreciation of the
Brazilian Real generated a negative effect on sugar export revenue and consequently affecting EBITDA. On the other hand, the depreciation of the Brazilian Real generated a positive effect in the financial result through hedging instruments used to protect the sugar export revenue in BRL. In 2Q16, the average exchange rate recognized on the sugar exports was hedged at R$4.00/USD, compared to the actual average exchange rate (PTAX) of R$3.51/USD, generating a negative effect of R$111 million on the quarter’s revenues.
EBITDA and EBIT 2Q16 2Q15 Chg.%
BRL mln (Apr-Jun) (Apr-Jun) 2Q16 / 2Q15
EBITDA 627.5 160.4 n/a
(-) Change in biological assets 95.8 64.4 48.9%
(-) Hedge Accounting - Debt - 103.7 n/a
Adjusted EBITDA 723.3 328.4 n/a
Adjusted EBITDA Margin (%) 27.4% 19.9% 7.4 p.p.
EBIT 99.0 (164.6) n/a
Adjusted EBIT 194.8 3.4 n/a
The following table presents the sugar volumes and prices hedged through trading or derivative instruments as of June 30, 2016, in U.S. dollar translated into Brazilian real:
Summary of Hedge Operations at 06/30/201613
Sugar 2016/2017 2017/2018
Volume ('000 ton) 2,578.4 954.7
Average Price14
(centavos/lb) 56.5 68.2
Average Price (¢/lb) 14.1 15.3 Note 13: Hedge coverage is based on the crop years ending in 3/31/2017 and 3/31/2018. Note 14: The average price in ¢/lb considers the exchange rate hedged through financial instruments. Net revenue recorded at exchange rate realized during the period.
Raízen’s Energia investments amounted to R$357.7 million (-6.1%) in 2Q16. The reduction is mostly explained by lower
expenditures with off-season maintenance, since 2Q15 was affected by the late start of crushing operations, and by lower investments in various projects.
CAPEX 2Q16 2Q15 Chg.%
BRL mln (Apr-Jun) (Apr-Jun) 2Q16 / 2Q15
Total CAPEX 357.7 381.0 -6.1%
Maintenance CAPEX 260.4 304.6 -14.5%
Biological Assets 235.7 223.0 5.7%
Off-season Maintenance 24.7 81.6 -69.8%
Operating CAPEX 27.1 7.5 n/a
HES & Sustaining 6.5 5.7 13.3%
Mechanization 20.4 1.6 n/a
Industrial 0.2 0.2 6.7%
Projects CAPEX 70.2 68.9 1.9%
Cogeneration and Expansion 23.1 34.0 -32.0%
Other Projects 47.1 34.9 35.0%
9 de 24
Cosan S/A – Earnings Release 2nd Quarter of the Fiscal Year of 2016
B.3 Comgás
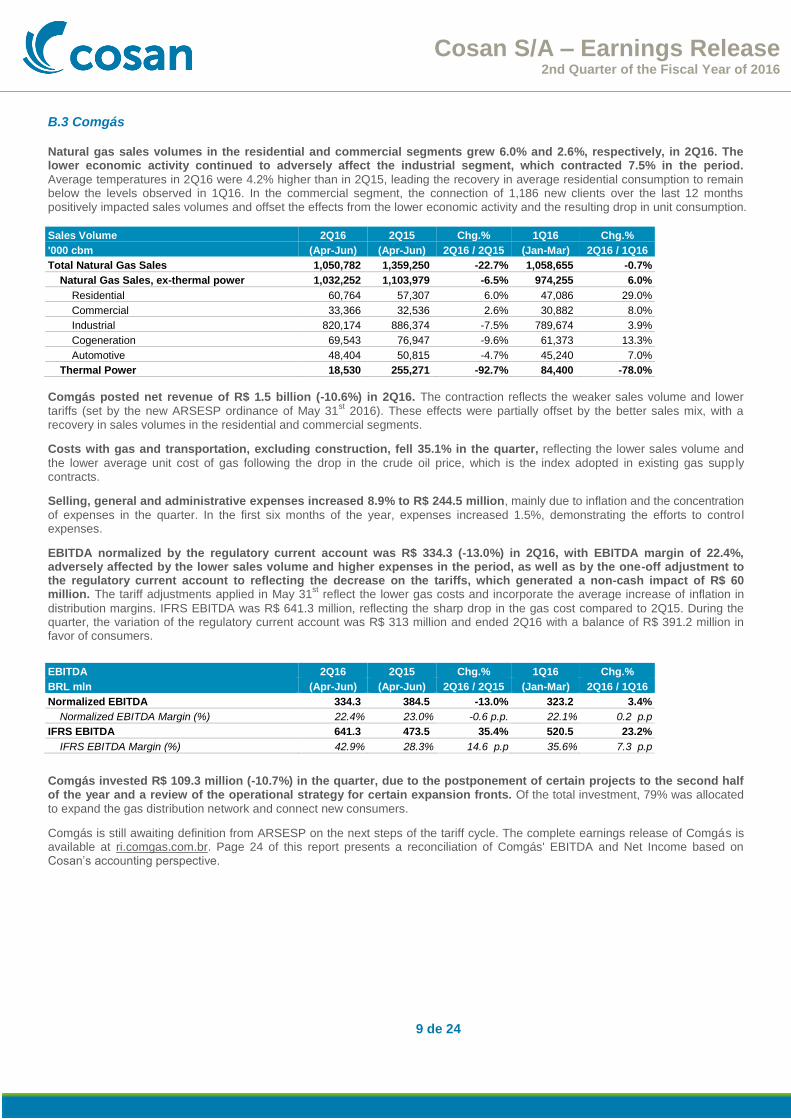
Natural gas sales volumes in the residential and commercial segments grew 6.0% and 2.6%, respectively, in 2Q16. The lower economic activity continued to adversely affect the industrial segment, which contracted 7.5% in the period.
Average temperatures in 2Q16 were 4.2% higher than in 2Q15, leading the recovery in average residential consumption to remain below the levels observed in 1Q16. In the commercial segment, the connection of 1,186 new clients over the last 12 months positively impacted sales volumes and offset the effects from the lower economic activity and the resulting drop in unit consumption.
Sales Volume 2Q16 2Q15 Chg.% 1Q16 Chg.%
'000 cbm (Apr-Jun) (Apr-Jun) 2Q16 / 2Q15 (Jan-Mar) 2Q16 / 1Q16
Total Natural Gas Sales 1,050,782 1,359,250 -22.7% 1,058,655 -0.7%
Natural Gas Sales, ex-thermal power 1,032,252 1,103,979 -6.5% 974,255 6.0%
Residential 60,764 57,307 6.0% 47,086 29.0%
Commercial 33,366 32,536 2.6% 30,882 8.0%
Industrial 820,174 886,374 -7.5% 789,674 3.9%
Cogeneration 69,543 76,947 -9.6% 61,373 13.3%
Automotive 48,404 50,815 -4.7% 45,240 7.0%
Thermal Power 18,530 255,271 -92.7% 84,400 -78.0%
Comgás posted net revenue of R$ 1.5 billion (-10.6%) in 2Q16. The contraction reflects the weaker sales volume and lower
tariffs (set by the new ARSESP ordinance of May 31st 2016). These effects were partially offset by the better sales mix, with a
recovery in sales volumes in the residential and commercial segments. Costs with gas and transportation, excluding construction, fell 35.1% in the quarter, reflecting the lower sales volume and
the lower average unit cost of gas following the drop in the crude oil price, which is the index adopted in existing gas supply contracts.
Selling, general and administrative expenses increased 8.9% to R$ 244.5 million, mainly due to inflation and the concentration
of expenses in the quarter. In the first six months of the year, expenses increased 1.5%, demonstrating the efforts to control expenses.
EBITDA normalized by the regulatory current account was R$ 334.3 (-13.0%) in 2Q16, with EBITDA margin of 22.4%, adversely affected by the lower sales volume and higher expenses in the period, as well as by the one-off adjustment to the regulatory current account to reflecting the decrease on the tariffs, which generated a non-cash impact of R$ 60 million. The tariff adjustments applied in May 31
st reflect the lower gas costs and incorporate the average increase of inflation in
distribution margins. IFRS EBITDA was R$ 641.3 million, reflecting the sharp drop in the gas cost compared to 2Q15. During the quarter, the variation of the regulatory current account was R$ 313 million and ended 2Q16 with a balance of R$ 391.2 million in favor of consumers.
EBITDA 2Q16 2Q15 Chg.% 1Q16 Chg.%
BRL mln (Apr-Jun) (Apr-Jun) 2Q16 / 2Q15 (Jan-Mar) 2Q16 / 1Q16
Normalized EBITDA 334.3 384.5 -13.0% 323.2 3.4%
Normalized EBITDA Margin (%) 22.4% 23.0% -0.6 p.p. 22.1% 0.2 p.p
IFRS EBITDA 641.3 473.5 35.4% 520.5 23.2%
IFRS EBITDA Margin (%) 42.9% 28.3% 14.6 p.p 35.6% 7.3 p.p
Comgás invested R$ 109.3 million (-10.7%) in the quarter, due to the postponement of certain projects to the second half of the year and a review of the operational strategy for certain expansion fronts. Of the total investment, 79% was allocated
to expand the gas distribution network and connect new consumers.
Comgás is still awaiting definition from ARSESP on the next steps of the tariff cycle. The complete earnings release of Comgás is available at ri.comgas.com.br. Page 24 of this report presents a reconciliation of Comgás' EBITDA and Net Income based on Cosan’s accounting perspective.

10 de 24
Cosan S/A – Earnings Release 2nd Quarter of the Fiscal Year of 2016
B.4 Lubricants
Cosan Lubricants posted growth of 8.5% of overall sales compared to 2Q15, despite the challenging scenario for lubricants in
the Brazilian market, which contracted 8% (source SINDICOM).
Net revenue was R$ 489.0 million (+15.3%), supported by new accounts and the better result from the international operations translated into Brazilian real. EBITDA in 2Q16 was R$ 27.3 million, down 30.1% from 2Q15, reflecting the higher
cost of products affected by the exchange rate and higher selling expenses.
EBITDA 2Q16 2Q15 Chg.% 1Q16 Chg.%
BRL mln (Apr-Jun) (Apr-Jun) 2Q16 / 2Q15 (Jan-Mar) 2Q16 / 1Q16
EBITDA 27.3 39.1 -30.1% 25.9 5.5%
EBITDA Margin (%) 5.6% 9.2% -3.6 p.p. 5.4% 0.2 p.p
B.5 Radar
Radar ended 2Q16 with 288,000 hectares of own and third-party land under management, distributed as follows:
Location Crop % Area
(hectares) Area
(acres) Market Value
(BRL mln)
Own Land 100% 104,047 257,103 2,715
São Paulo Sugarcane 64% 66,584 164,530 2,255
Maranhão Grains 17% 18,006 44,493 155
Mato Grosso Grains 12% 12,302 30,399 234
Bahia Grains 7% 7,155 17,681 71
Third-party Land 183,940 454,517 2,947
Total Owned and Third-party Land 287,988 711,620 5,662
EBITDA in 2Q16 was R$ 25.9 million, advancing 22.8% on 2Q15. In 2Q16, net revenue fell 10.8% to R$ 24.0 million, since no
properties were sold in the quarter, which was partially offset by the higher revenue from land leased (+22.1%), mostly from sugarcane cultivation driven by the increase in the CONSECANA index. Radar also registered a higher non-cash gain from the appraisal of its own portfolio compared to the same period last year.
B.6 Cosan Corporate
The Cosan Corporate segment comprises Cosan’s corporate structure, the effects arising from the contingencies of the businesses
contributed to Raízen prior to its incorporation, and other investments.
Total Expenses and EBITDA 2Q16 2Q15 Chg.% 1Q16 Chg.%
BRL mln (Apr-Jun) (Apr-Jun) 2Q16 / 2Q15 (Jan-Mar) 2Q16 / 1Q16
General and Administrative Expenses (41.1) (44.4) -7.4% (42.0) -2.1%
Other Operating Income (Expenses) (18.4) (6.8) n/a (39.3) -53.2%
EBITDA ex- Equity Pick-up (63.2) (50.1) 26.1% (78.8) -19.8%
(+) Equity Pick-up 432.7 221.8 95.1% 555.5 -22.1%
EBITDA 369.6 171.7 n/a 476.7 -22.5%
Cosan’s general and administrative expenses, which comprise miscellaneous consulting services and personnel expenses (payroll, charges and claims), amounted to R$ 41.1 million (-7.4%) in 2Q16, mainly due to lower expenses incurred
with consulting services. Other operating expenses amounted to R$ 18.4 million in 2Q16, due to the concentration of legal expenses in the period.
11 de 24
Cosan S/A – Earnings Release 2nd Quarter of the Fiscal Year of 2016
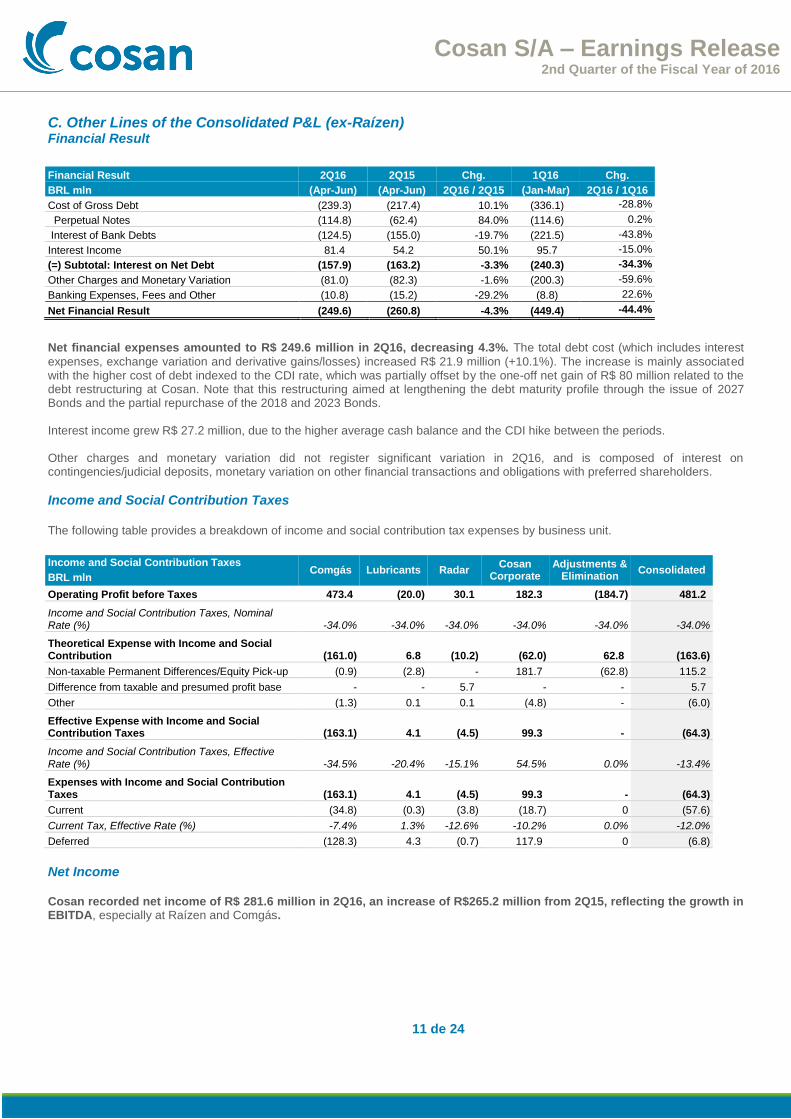
C. Other Lines of the Consolidated P&L (ex-Raízen) Financial Result
Financial Result 2Q16 2Q15 Chg. 1Q16 Chg.
BRL mln (Apr-Jun) (Apr-Jun) 2Q16 / 2Q15 (Jan-Mar) 2Q16 / 1Q16
Cost of Gross Debt (239.3) (217.4) 10.1% (336.1) -28.8%
Perpetual Notes (114.8) (62.4) 84.0% (114.6) 0.2%
Interest of Bank Debts (124.5) (155.0) -19.7% (221.5) -43.8%
Interest Income 81.4 54.2 50.1% 95.7 -15.0%
(=) Subtotal: Interest on Net Debt (157.9) (163.2) -3.3% (240.3) -34.3%
Other Charges and Monetary Variation (81.0) (82.3) -1.6% (200.3) -59.6%
Banking Expenses, Fees and Other (10.8) (15.2) -29.2% (8.8) 22.6%
Net Financial Result (249.6) (260.8) -4.3% (449.4) -44.4%
Net financial expenses amounted to R$ 249.6 million in 2Q16, decreasing 4.3%. The total debt cost (which includes interest
expenses, exchange variation and derivative gains/losses) increased R$ 21.9 million (+10.1%). The increase is mainly associated with the higher cost of debt indexed to the CDI rate, which was partially offset by the one-off net gain of R$ 80 million related to the debt restructuring at Cosan. Note that this restructuring aimed at lengthening the debt maturity profile through the issue of 2027 Bonds and the partial repurchase of the 2018 and 2023 Bonds. Interest income grew R$ 27.2 million, due to the higher average cash balance and the CDI hike between the periods. Other charges and monetary variation did not register significant variation in 2Q16, and is composed of interest on contingencies/judicial deposits, monetary variation on other financial transactions and obligations with preferred shareholders.
Income and Social Contribution Taxes
The following table provides a breakdown of income and social contribution tax expenses by business unit.
Income and Social Contribution Taxes Comgás Lubricants Radar
Cosan Corporate
Adjustments & Elimination
Consolidated BRL mln
Operating Profit before Taxes 473.4 (20.0) 30.1 182.3 (184.7) 481.2
Income and Social Contribution Taxes, Nominal Rate (%) -34.0% -34.0% -34.0% -34.0% -34.0% -34.0%
Theoretical Expense with Income and Social Contribution (161.0) 6.8 (10.2) (62.0) 62.8 (163.6)
Non-taxable Permanent Differences/Equity Pick-up (0.9) (2.8) - 181.7 (62.8) 115.2
Difference from taxable and presumed profit base - - 5.7 - - 5.7
Other (1.3) 0.1 0.1 (4.8) - (6.0)
Effective Expense with Income and Social Contribution Taxes (163.1) 4.1 (4.5) 99.3 - (64.3)
Income and Social Contribution Taxes, Effective Rate (%) -34.5% -20.4% -15.1% 54.5% 0.0% -13.4%
Expenses with Income and Social Contribution Taxes (163.1) 4.1 (4.5) 99.3 - (64.3)
Current (34.8) (0.3) (3.8) (18.7) 0 (57.6)
Current Tax, Effective Rate (%) -7.4% 1.3% -12.6% -10.2% 0.0% -12.0%
Deferred (128.3) 4.3 (0.7) 117.9 0 (6.8)
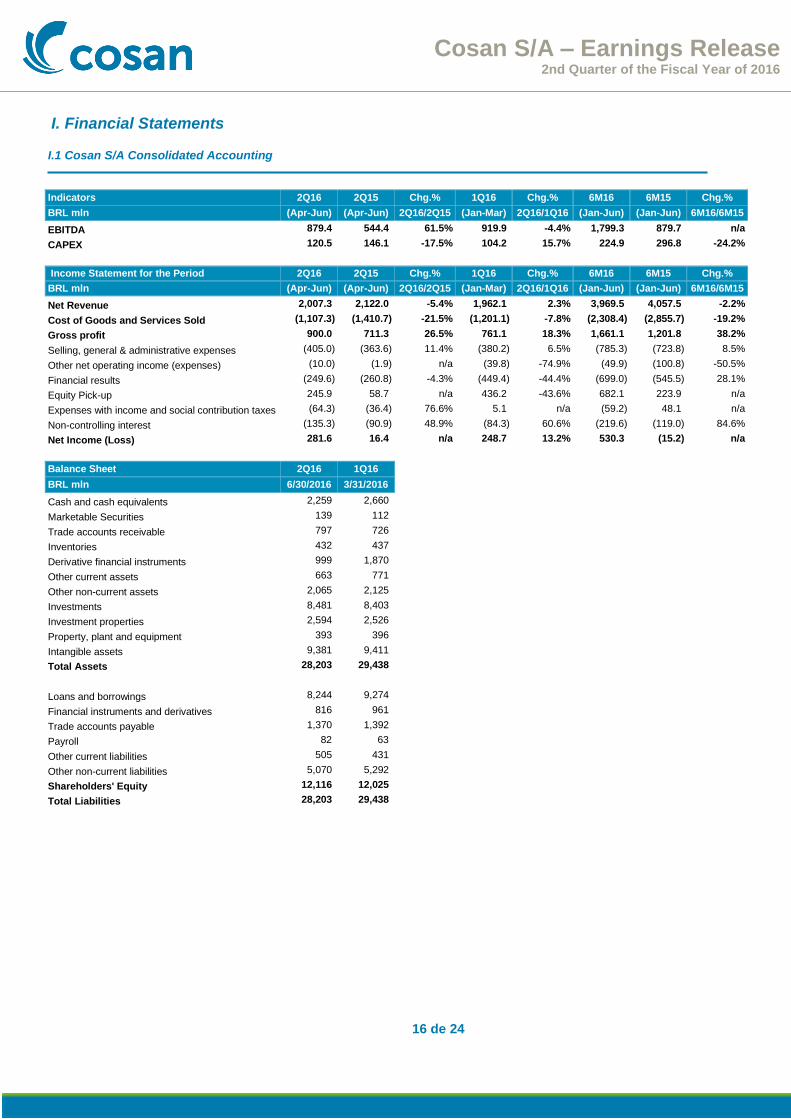
Net Income Cosan recorded net income of R$ 281.6 million in 2Q16, an increase of R$265.2 million from 2Q15, reflecting the growth in EBITDA, especially at Raízen and Comgás.
12 de 24
Cosan S/A – Earnings Release 2nd Quarter of the Fiscal Year of 2016
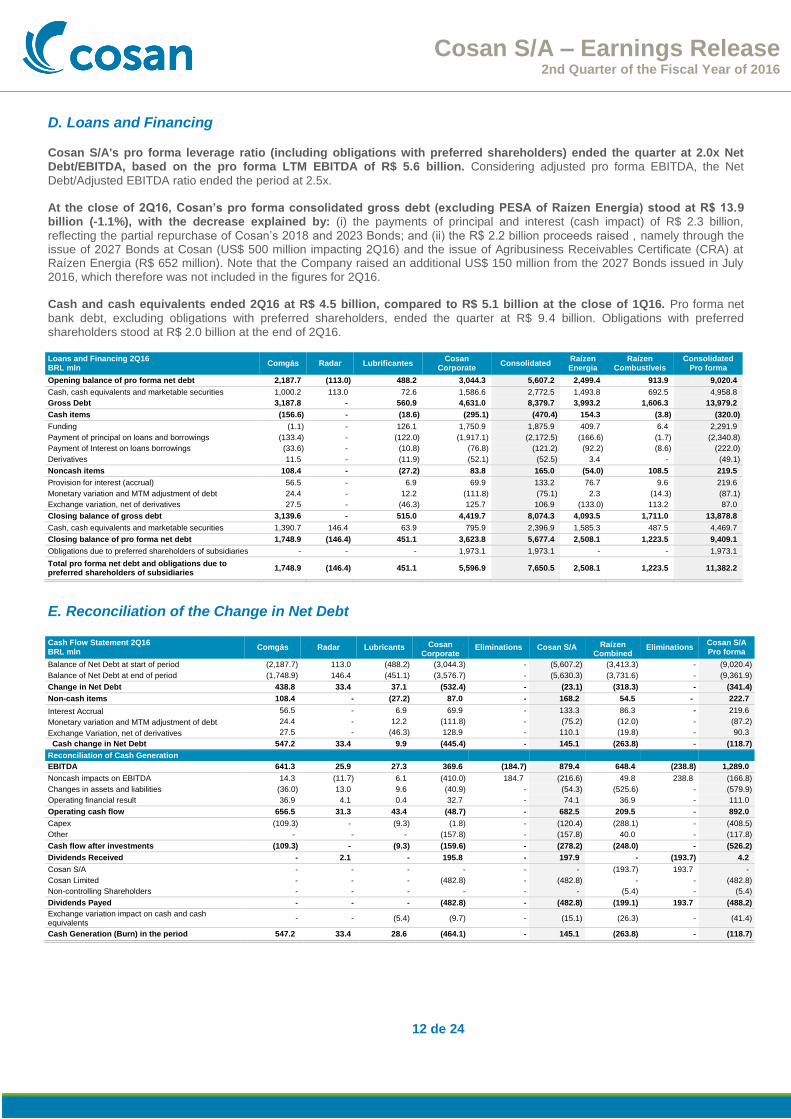
D. Loans and Financing Cosan S/A's pro forma leverage ratio (including obligations with preferred shareholders) ended the quarter at 2.0x Net Debt/EBITDA, based on the pro forma LTM EBITDA of R$ 5.6 billion. Considering adjusted pro forma EBITDA, the Net
Debt/Adjusted EBITDA ratio ended the period at 2.5x. At the close of 2Q16, Cosan’s pro forma consolidated gross debt (excluding PESA of Raízen Energia) stood at R$ 13.9 billion (-1.1%), with the decrease explained by: (i) the payments of principal and interest (cash impact) of R$ 2.3 billion,
reflecting the partial repurchase of Cosan’s 2018 and 2023 Bonds; and (ii) the R$ 2.2 billion proceeds raised , namely through the issue of 2027 Bonds at Cosan (US$ 500 million impacting 2Q16) and the issue of Agribusiness Receivables Certificate (CRA) at Raízen Energia (R$ 652 million). Note that the Company raised an additional US$ 150 million from the 2027 Bonds issued in July 2016, which therefore was not included in the figures for 2Q16. Cash and cash equivalents ended 2Q16 at R$ 4.5 billion, compared to R$ 5.1 billion at the close of 1Q16. Pro forma net
bank debt, excluding obligations with preferred shareholders, ended the quarter at R$ 9.4 billion. Obligations with preferred shareholders stood at R$ 2.0 billion at the end of 2Q16. Loans and Financing 2Q16 BRL mln
Comgás Radar Lubrificantes Cosan
Corporate Consolidated
Raízen Energia
Raízen Combustíveis
Consolidated Pro forma
Opening balance of pro forma net debt 2,187.7 (113.0) 488.2 3,044.3 5,607.2 2,499.4 913.9 9,020.4
Cash, cash equivalents and marketable securities 1,000.2 113.0 72.6 1,586.6 2,772.5 1,493.8 692.5 4,958.8
Gross Debt 3,187.8 - 560.9 4,631.0 8,379.7 3,993.2 1,606.3 13,979.2
Cash items (156.6) - (18.6) (295.1) (470.4) 154.3 (3.8) (320.0)
Funding (1.1) - 126.1 1,750.9 1,875.9 409.7 6.4 2,291.9
Payment of principal on loans and borrowings (133.4) - (122.0) (1,917.1) (2,172.5) (166.6) (1.7) (2,340.8)
Payment of Interest on loans borrowings (33.6) - (10.8) (76.8) (121.2) (92.2) (8.6) (222.0)
Derivatives 11.5 - (11.9) (52.1) (52.5) 3.4 - (49.1)
Noncash items 108.4 - (27.2) 83.8 165.0 (54.0) 108.5 219.5
Provision for interest (accrual) 56.5 - 6.9 69.9 133.2 76.7 9.6 219.6
Monetary variation and MTM adjustment of debt 24.4 - 12.2 (111.8) (75.1) 2.3 (14.3) (87.1)
Exchange variation, net of derivatives 27.5 - (46.3) 125.7 106.9 (133.0) 113.2 87.0
Closing balance of gross debt 3,139.6 - 515.0 4,419.7 8,074.3 4,093.5 1,711.0 13,878.8
Cash, cash equivalents and marketable securities 1,390.7 146.4 63.9 795.9 2,396.9 1,585.3 487.5 4,469.7
Closing balance of pro forma net debt 1,748.9 (146.4) 451.1 3,623.8 5,677.4 2,508.1 1,223.5 9,409.1
Obligations due to preferred shareholders of subsidiaries - - - 1,973.1 1,973.1 - - 1,973.1
Total pro forma net debt and obligations due to preferred shareholders of subsidiaries
1,748.9 (146.4) 451.1 5,596.9 7,650.5 2,508.1 1,223.5 11,382.2
E. Reconciliation of the Change in Net Debt Cash Flow Statement 2Q16 BRL mln
Comgás Radar Lubricants Cosan Corporate
Eliminations Cosan S/A Raízen Combined
Eliminations Cosan S/A Pro forma
Balance of Net Debt at start of period (2,187.7) 113.0 (488.2) (3,044.3) - (5,607.2) (3,413.3) - (9,020.4)
Balance of Net Debt at end of period (1,748.9) 146.4 (451.1) (3,576.7) - (5,630.3) (3,731.6) - (9,361.9)
Change in Net Debt 438.8 33.4 37.1 (532.4) - (23.1) (318.3) - (341.4)
Non-cash items 108.4 - (27.2) 87.0 - 168.2 54.5 - 222.7
Interest Accrual 56.5 - 6.9 69.9 - 133.3 86.3 - 219.6
Monetary variation and MTM adjustment of debt 24.4 - 12.2 (111.8) - (75.2) (12.0) - (87.2)
Exchange Variation, net of derivatives 27.5 - (46.3) 128.9 - 110.1 (19.8) - 90.3
Cash change in Net Debt 547.2 33.4 9.9 (445.4) - 145.1 (263.8) - (118.7)
Reconciliation of Cash Generation
EBITDA 641.3 25.9 27.3 369.6 (184.7) 879.4 648.4 (238.8) 1,289.0
Noncash impacts on EBITDA 14.3 (11.7) 6.1 (410.0) 184.7 (216.6) 49.8 238.8 (166.8)
Changes in assets and liabilities (36.0) 13.0 9.6 (40.9) - (54.3) (525.6) - (579.9)
Operating financial result 36.9 4.1 0.4 32.7 - 74.1 36.9 - 111.0
Operating cash flow 656.5 31.3 43.4 (48.7) - 682.5 209.5 - 892.0
Capex (109.3) - (9.3) (1.8) - (120.4) (288.1) - (408.5)
Other - - - (157.8) - (157.8) 40.0 - (117.8)
Cash flow after investments (109.3) - (9.3) (159.6) - (278.2) (248.0) - (526.2)
Dividends Received - 2.1 - 195.8 - 197.9 - (193.7) 4.2
Cosan S/A - - - - - - (193.7) 193.7 -
Cosan Limited - - - (482.8) - (482.8) - - (482.8)
Non-controlling Shareholders - - - - - - (5.4) - (5.4)
Dividends Payed - - - (482.8) - (482.8) (199.1) 193.7 (488.2)
Exchange variation impact on cash and cash equivalents
- - (5.4) (9.7) - (15.1) (26.3) - (41.4)
Cash Generation (Burn) in the period 547.2 33.4 28.6 (464.1) - 145.1 (263.8) - (118.7)
13 de 24
Cosan S/A – Earnings Release 2nd Quarter of the Fiscal Year of 2016
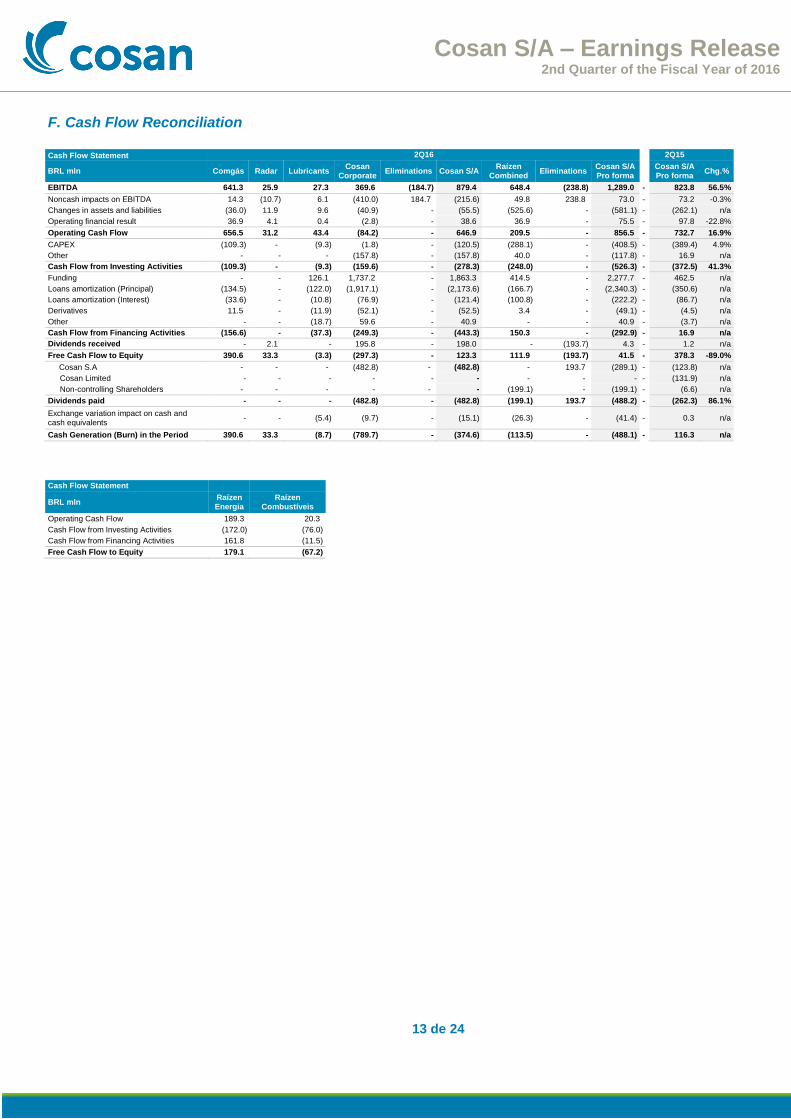
F. Cash Flow Reconciliation
Cash Flow Statement 2Q16 2Q15
BRL mln Comgás Radar Lubricants Cosan
Corporate Eliminations Cosan S/A
Raízen Combined
Eliminations Cosan S/A Pro forma
Cosan S/A Pro forma
Chg.%
EBITDA 641.3 25.9 27.3 369.6 (184.7) 879.4 648.4 (238.8) 1,289.0 - 823.8 56.5%
Noncash impacts on EBITDA 14.3 (10.7) 6.1 (410.0) 184.7 (215.6) 49.8 238.8 73.0 - 73.2 -0.3%
Changes in assets and liabilities (36.0) 11.9 9.6 (40.9) - (55.5) (525.6) - (581.1) - (262.1) n/a
Operating financial result 36.9 4.1 0.4 (2.8) - 38.6 36.9 - 75.5 - 97.8 -22.8%
Operating Cash Flow 656.5 31.2 43.4 (84.2) - 646.9 209.5 - 856.5 - 732.7 16.9%
CAPEX (109.3) - (9.3) (1.8) - (120.5) (288.1) - (408.5) - (389.4) 4.9%
Other - - - (157.8) - (157.8) 40.0 - (117.8) - 16.9 n/a
Cash Flow from Investing Activities (109.3) - (9.3) (159.6) - (278.3) (248.0) - (526.3) - (372.5) 41.3%
Funding - - 126.1 1,737.2 - 1,863.3 414.5 - 2,277.7 - 462.5 n/a
Loans amortization (Principal) (134.5) - (122.0) (1,917.1) - (2,173.6) (166.7) - (2,340.3) - (350.6) n/a
Loans amortization (Interest) (33.6) - (10.8) (76.9) - (121.4) (100.8) - (222.2) - (86.7) n/a
Derivatives 11.5 - (11.9) (52.1) - (52.5) 3.4 - (49.1) - (4.5) n/a
Other - - (18.7) 59.6 - 40.9 - - 40.9 - (3.7) n/a
Cash Flow from Financing Activities (156.6) - (37.3) (249.3) - (443.3) 150.3 - (292.9) - 16.9 n/a
Dividends received - 2.1 - 195.8 - 198.0 - (193.7) 4.3 - 1.2 n/a
Free Cash Flow to Equity 390.6 33.3 (3.3) (297.3) - 123.3 111.9 (193.7) 41.5 - 378.3 -89.0%
Cosan S.A - - - (482.8) - (482.8) - 193.7 (289.1) - (123.8) n/a
Cosan Limited - - - - - - - - - - (131.9) n/a
Non-controlling Shareholders - - - - - - (199.1) - (199.1) - (6.6) n/a
Dividends paid - - - (482.8) - (482.8) (199.1) 193.7 (488.2) - (262.3) 86.1%
Exchange variation impact on cash and cash equivalents
- - (5.4) (9.7) - (15.1) (26.3) - (41.4) - 0.3 n/a
Cash Generation (Burn) in the Period 390.6 33.3 (8.7) (789.7) - (374.6) (113.5) - (488.1) - 116.3 n/a
Cash Flow Statement
BRL mln Raízen Energia
Raízen Combustíveis
Operating Cash Flow 189.3 20.3
Cash Flow from Investing Activities (172.0) (76.0)
Cash Flow from Financing Activities 161.8 (11.5)
Free Cash Flow to Equity 179.1 (67.2)
14 de 24
Cosan S/A – Earnings Release 2nd Quarter of the Fiscal Year of 2016
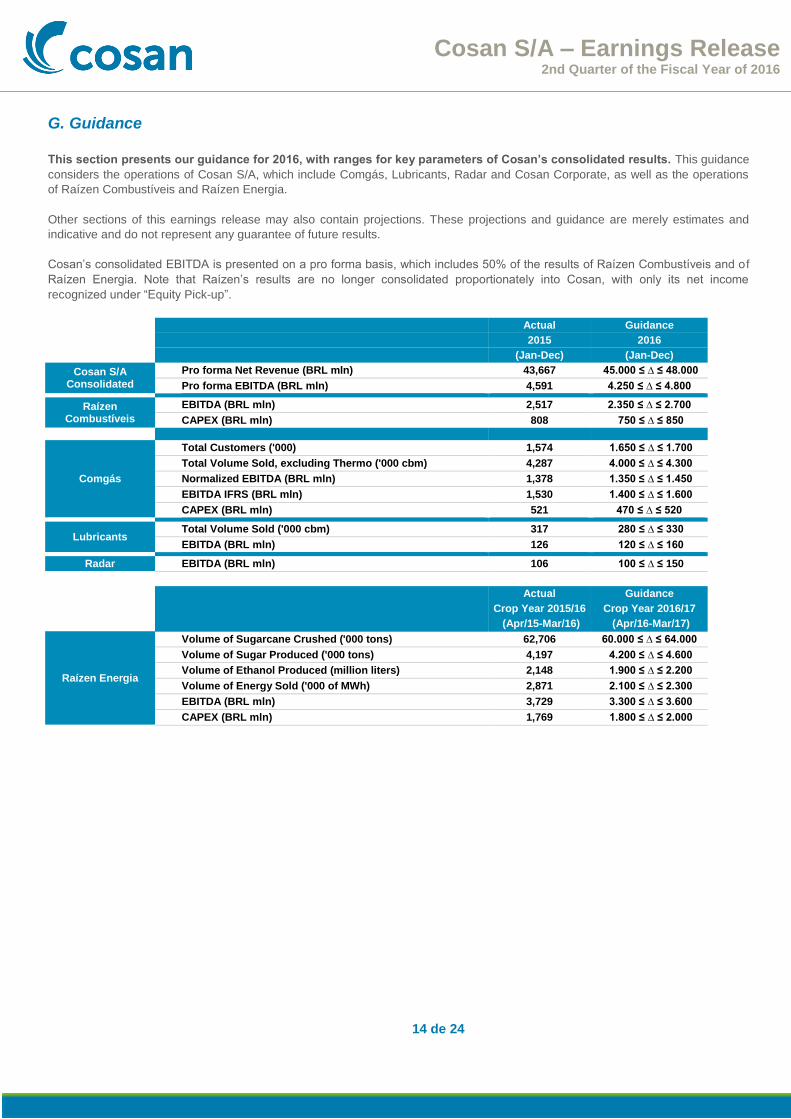
G. Guidance This section presents our guidance for 2016, with ranges for key parameters of Cosan’s consolidated results. This guidance
considers the operations of Cosan S/A, which include Comgás, Lubricants, Radar and Cosan Corporate, as well as the operations
of Raízen Combustíveis and Raízen Energia.
Other sections of this earnings release may also contain projections. These projections and guidance are merely estimates and
indicative and do not represent any guarantee of future results.
Cosan’s consolidated EBITDA is presented on a pro forma basis, which includes 50% of the results of Raízen Combustíveis and o f
Raízen Energia. Note that Raízen’s results are no longer consolidated proportionately into Cosan, with only its net income
recognized under “Equity Pick-up”.
Actual Guidance
2015 2016
(Jan-Dec) (Jan-Dec)
Cosan S/A Consolidated
Pro forma Net Revenue (BRL mln) 43,667 45.000 ≤ ∆ ≤ 48.000
Pro forma EBITDA (BRL mln) 4,591 4.250 ≤ ∆ ≤ 4.800
Raízen
Combustíveis
EBITDA (BRL mln) 2,517 2.350 ≤ ∆ ≤ 2.700
CAPEX (BRL mln) 808 750 ≤ ∆ ≤ 850
Comgás
Total Customers ('000) 1,574 1.650 ≤ ∆ ≤ 1.700
Total Volume Sold, excluding Thermo ('000 cbm) 4,287 4.000 ≤ ∆ ≤ 4.300
Normalized EBITDA (BRL mln) 1,378 1.350 ≤ ∆ ≤ 1.450
EBITDA IFRS (BRL mln) 1,530 1.400 ≤ ∆ ≤ 1.600
CAPEX (BRL mln) 521 470 ≤ ∆ ≤ 520
Lubricants Total Volume Sold ('000 cbm) 317 280 ≤ ∆ ≤ 330
EBITDA (BRL mln) 126 120 ≤ ∆ ≤ 160
Radar EBITDA (BRL mln) 106 100 ≤ ∆ ≤ 150
Actual Guidance
Crop Year 2015/16 Crop Year 2016/17
(Apr/15-Mar/16) (Apr/16-Mar/17)
Raízen Energia
Volume of Sugarcane Crushed ('000 tons) 62,706 60.000 ≤ ∆ ≤ 64.000
Volume of Sugar Produced ('000 tons) 4,197 4.200 ≤ ∆ ≤ 4.600
Volume of Ethanol Produced (million liters) 2,148 1.900 ≤ ∆ ≤ 2.200
Volume of Energy Sold ('000 of MWh) 2,871 2.100 ≤ ∆ ≤ 2.300
EBITDA (BRL mln) 3,729 3.300 ≤ ∆ ≤ 3.600
CAPEX (BRL mln) 1,769 1.800 ≤ ∆ ≤ 2.000
15 de 24
Cosan S/A – Earnings Release 2nd Quarter of the Fiscal Year of 2016
H. Other Information
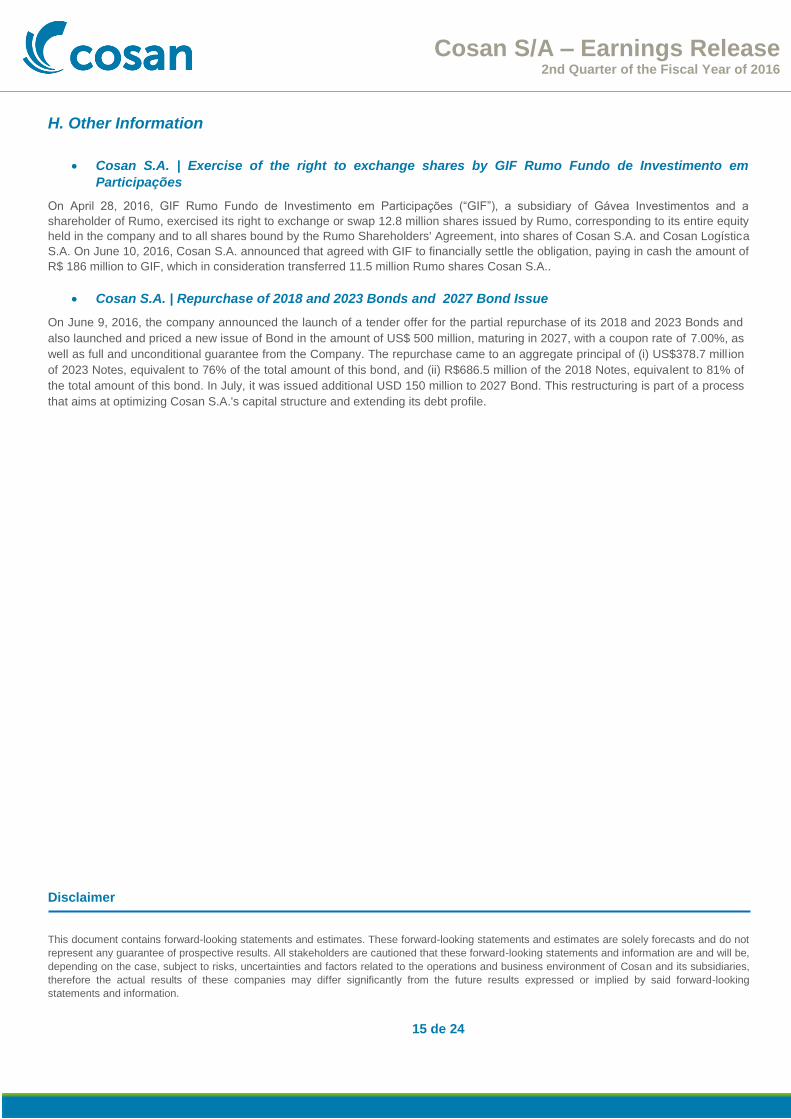
Cosan S.A. | Exercise of the right to exchange shares by GIF Rumo Fundo de Investimento em
Participações
On April 28, 2016, GIF Rumo Fundo de Investimento em Participações (“GIF”), a subsidiary of Gávea Investimentos and a
shareholder of Rumo, exercised its right to exchange or swap 12.8 million shares issued by Rumo, corresponding to its entire equity
held in the company and to all shares bound by the Rumo Shareholders' Agreement, into shares of Cosan S.A. and Cosan Logística
S.A. On June 10, 2016, Cosan S.A. announced that agreed with GIF to financially settle the obligation, paying in cash the amount of
R$ 186 million to GIF, which in consideration transferred 11.5 million Rumo shares Cosan S.A..
Cosan S.A. | Repurchase of 2018 and 2023 Bonds and 2027 Bond Issue
On June 9, 2016, the company announced the launch of a tender offer for the partial repurchase of its 2018 and 2023 Bonds and
also launched and priced a new issue of Bond in the amount of US$ 500 million, maturing in 2027, with a coupon rate of 7.00%, as
well as full and unconditional guarantee from the Company. The repurchase came to an aggregate principal of (i) US$378.7 mill ion
of 2023 Notes, equivalent to 76% of the total amount of this bond, and (ii) R$686.5 million of the 2018 Notes, equivalent to 81% of
the total amount of this bond. In July, it was issued additional USD 150 million to 2027 Bond. This restructuring is part of a process
that aims at optimizing Cosan S.A.'s capital structure and extending its debt profile.
Disclaimer
This document contains forward-looking statements and estimates. These forward-looking statements and estimates are solely forecasts and do not
represent any guarantee of prospective results. All stakeholders are cautioned that these forward-looking statements and information are and will be,
depending on the case, subject to risks, uncertainties and factors related to the operations and business environment of Cosan and its subsidiaries,
therefore the actual results of these companies may differ significantly from the future results expressed or implied by said forward-looking
statements and information.
16 de 24
Cosan S/A – Earnings Release 2nd Quarter of the Fiscal Year of 2016
I. Financial Statements
I.1 Cosan S/A Consolidated Accounting
Indicators 2Q16 2Q15 Chg.% 1Q16 Chg.% 6M16 6M15 Chg.%
BRL mln (Apr-Jun) (Apr-Jun) 2Q16/2Q15 (Jan-Mar) 2Q16/1Q16 (Jan-Jun) (Jan-Jun) 6M16/6M15
EBITDA 879.4 544.4 61.5% 919.9 -4.4% 1,799.3 879.7 n/a
CAPEX 120.5 146.1 -17.5% 104.2 15.7% 224.9 296.8 -24.2%
Income Statement for the Period 2Q16 2Q15 Chg.% 1Q16 Chg.% 6M16 6M15 Chg.%
BRL mln (Apr-Jun) (Apr-Jun) 2Q16/2Q15 (Jan-Mar) 2Q16/1Q16 (Jan-Jun) (Jan-Jun) 6M16/6M15
Net Revenue 2,007.3 2,122.0 -5.4% 1,962.1 2.3% 3,969.5 4,057.5 -2.2%
Cost of Goods and Services Sold (1,107.3) (1,410.7) -21.5% (1,201.1) -7.8% (2,308.4) (2,855.7) -19.2%
Gross profit 900.0 711.3 26.5% 761.1 18.3% 1,661.1 1,201.8 38.2%
Selling, general & administrative expenses (405.0) (363.6) 11.4% (380.2) 6.5% (785.3) (723.8) 8.5%
Other net operating income (expenses) (10.0) (1.9) n/a (39.8) -74.9% (49.9) (100.8) -50.5%
Financial results (249.6) (260.8) -4.3% (449.4) -44.4% (699.0) (545.5) 28.1%
Equity Pick-up 245.9 58.7 n/a 436.2 -43.6% 682.1 223.9 n/a
Expenses with income and social contribution taxes (64.3) (36.4) 76.6% 5.1 n/a (59.2) 48.1 n/a
Non-controlling interest (135.3) (90.9) 48.9% (84.3) 60.6% (219.6) (119.0) 84.6%
Net Income (Loss) 281.6 16.4 n/a 248.7 13.2% 530.3 (15.2) n/a
Balance Sheet 2Q16 1Q16
BRL mln 6/30/2016 3/31/2016
Cash and cash equivalents 2,259 2,660
Marketable Securities 139 112
Trade accounts receivable 797 726
Inventories 432 437
Derivative financial instruments 999 1,870
Other current assets 663 771
Other non-current assets 2,065 2,125
Investments 8,481 8,403
Investment properties 2,594 2,526
Property, plant and equipment 393 396
Intangible assets 9,381 9,411
Total Assets 28,203 29,438
Loans and borrowings 8,244 9,274
Financial instruments and derivatives 816 961
Trade accounts payable 1,370 1,392
Payroll 82 63
Other current liabilities 505 431
Other non-current liabilities 5,070 5,292
Shareholders' Equity 12,116 12,025
Total Liabilities 28,203 29,438
17 de 24
Cosan S/A – Earnings Release 2nd Quarter of the Fiscal Year of 2016
I.2 Raízen Combustiveis
Sales Volumes 2Q16 2Q15 Chg.% 1Q16 Chg.% 6M16 6M15 Chg.%
000 cbm (Apr-Jun) (Apr-Jun) 2Q16/2Q15 (Jan-Mar) 2Q16/1Q16 (Jan-Jun) (Jan-Jun) 6M16/6M15
Total Volume 6,158 6,123 0.6% 6,035 2.0% 12,193 12,068 1.0%
Ethanol 707 864 -18.2% 668 5.8% 1,375 1,639 -16.1%
Gasoline 2,122 1,955 8.6% 2,154 -1.5% 4,276 3,975 7.6%
Diesel 2,719 2,653 2.5% 2,538 7.1% 5,257 5,105 3.0%
Aviation 526 571 -7.9% 589 -10.7% 1,114 1,183 -5.8%
Other 84 80 5.6% 86 -2.4% 171 166 2.9%
Otto cycle 2,829 2,819 0.3% 2,822 0.3% 5,651 5,614 0.7%
Gasoline Equivalent 2,633 2,579 2.1% 2,636 -0.1% 5,269 5,159 2.1%
Indicators 2Q16 2Q15 Chg.% 1Q16 Chg.% 6M16 6M15 Chg.%
BRL mln (Apr-Jun) (Apr-Jun) 2Q16/2Q15 (Jan-Mar) 2Q16/1Q16 (Jan-Jun) (Jan-Jun) 6M16/6M15
EBITDA 661.3 514.5 28.5% 579.7 14.1% 1,241.0 1,104.0 12.4%
Adjusted EBITDA 596.7 507.8 17.5% 590.3 1.1% 1,187.0 1,062.0 11.8%
Adjusted EBITDA Margin (BRL/cbm) 96.9 82.9 16.8% 97.8 -0.9% 97.3 88.0 10.6%
EBIT 512.6 363.7 40.9% 413.6 23.9% 926.2 809.8 14.4%
Adjusted EBIT 448.0 357.1 25.5% 424.2 5.6% 872.2 767.8 13.6%
Rebate 43.0 34.7 23.9% 39.6 8.6% 82.7 75.2 9.9%
CAPEX 225.8 117.8 91.7% 179.2 26.0% 405.0 364.9 11.0%
Income Statement for the Period 2Q16 2Q15 Chg.% 1Q16 Chg.% 6M16 6M15 Chg.%
BRL mln (Apr-Jun) (Apr-Jun) 2Q16/2Q15 (Jan-Mar) 2Q16/1Q16 (Jan-Jun) (Jan-Jun) 6M16/6M15
Net Operating Revenue 16,479.6 14,793.9 11.4% 16,391.8 0.5% 32,871.3 28,855.4 13.9%
Ethanol 1,202.0 1,244.7 -3.4% 1,387.8 -13.4% 2,589.8 2,406.7 7.6%
Gasoline 6,839.3 5,706.0 19.9% 7,141.4 -4.2% 13,980.7 11,412.5 22.5%
Diesel 7,517.6 6,680.3 12.5% 6,832.7 10.0% 14,350.3 12,740.7 12.6%
Aviation 793.8 1,043.9 -24.0% 898.0 -11.6% 1,691.8 2,048.4 -17.4%
Other 126.8 119.0 6.6% 131.9 -3.9% 258.7 247.1 4.7%
Cost of Goods and Services Sold (15,665.2) (14,134.5) 10.8% (15,600.6) 0.4% (31,265.8) (27,394.6) 14.1%
Gross profit 814.4 659.4 23.5% 791.2 2.9% 1,605.5 1,460.8 9.9%
Total Expences (419.1) (378.3) 10.8% (458.3) -8.6% (877.4) (794.5)
Selling expenses (299.5) (281.1) 6.6% (357.1) -16.1% (656.6) (597.0) 10.0%
General and administrative expenses (119.6) (97.2) 23.0% (101.2) 18.2% (220.8) (197.5) 11.8%
Other operating income (expenses) 117.4 82.6 42.0% 80.7 45.4% 198.1 143.6 38.0%
Financial results (146.7) (34.3) n/a (133.0) 10.4% (279.7) (21.3) n/a
Equity Pick-up - 3.1 -100.0% 2.5 -100.0% 2.5 7.1 -64.6%
Expenses with income and social contribution taxes
taxes (74.2) (117.1) -36.6% (110.0) -32.5% (184.2) (262.1) -29.7%
Non-controlling interest (12.2) (7.0) 73.5% (10.1) 21.0% (22.2) (19.0) 16.8%
Net Income 279.4 208.3 34.1% 163.1 71.3% 442.5 514.5 -14.0%
Balance Sheet 2Q16 1Q16
BRL mln 6/30/2016 3/31/2016
Cash and cash equivalents 975 1,385
Trade accounts receivable 1,434 1,301
Inventories 1,490 1,184
Derivative financial instruments 182 86
Other current assets 1,353 1,342
Other non-current assets 1,203 1,148
Property, plant and equipment 2,360 2,411
Intangible assets 4,500 4,411
Total Assets 13,495 13,268
Loans and borrowings 2,648 2,976
Financial instruments and derivatives 918 312
Trade accounts payable 670 774
Payroll 124 112
Other current liabilities 1,321 1,471
Other non-current liabilities 2,770 2,762
Shareholders' Equity 5,045 4,860
Total Liabilities 13,495 13,268

18 de 24
Cosan S/A – Earnings Release 2nd Quarter of the Fiscal Year of 2016
I.3 Raízen Energia
Indicators 2Q16 2Q15 Chg.%
(Apr-Jun) (Apr-Jun) 2Q16/2Q15
Sugarcane Crushed 22,384 19,239 16.3%
Sugarcane Crushed, Own ('000 t) 11,404 10,021 13.8%
Sugarcane Crushed, Suppliers ('000 t) 10,980 9,219 19.1%
Sugarcane TRS (kg/t) 121.2 122.6 -1.2%
TCH (tons of cane per hectare) 91.9 89.9 2.2%
TRS/ha (tons of TRS per hectare) 11.1 11.0 1.1%
Mechanization (%) 99% 97% 1.4 p.p.
Sugar ('000 ton) 1,420 1,241 14.5%
Ethanol ('000 cbm) 738 614 20.2%
Sugar ('000 ton) 971 545 78.2%
Ethanol ('000 cbm) 766 626 22.3%
Energy cogeneration ('000 MWh) 817 705 15.9%
EBITDA 627.5 160.4 n/a
Adjusted EBITDA 723.3 328.4 n/a
Adjusted EBITDA Margin (BRL/cbm) 27.4% 19.9% 7.4 p.p.
EBIT 99.0 (164.6) n/a
Adjusted EBIT 194.8 3.4 n/a
CAPEX 357.7 381.0 -6.1%
Income Statement for the Period 2Q16 2Q15 Chg.%
BRL mln (Apr-Jun) (Apr-Jun) 2Q16/2Q15
Net Operating Revenue 2,642.9 1,646.9 60.5%
Sugar 1,115.3 465.0 n/a
Ethanol 1,262.3 940.5 34.2%
Energy Cogeneration 151.4 172.1 -12.0%
Other Products and Services 113.8 69.4 64.1%
Cost of goods sold (2,216.7) (1,577.9) 40.5%
Sugar (834.8) (360.9) n/a
Ethanol (745.2) (383.1) 94.5%
Resale & Trading (364.3) (639.1) -43.0%
Energy Cogeneration (67.0) (55.0) 21.8%
Other (205.3) (139.8) 46.9%
Gross profit 426.2 69.0 n/a
Total Expences (295.6) (209.3) 41.3%
Selling expenses (180.3) (88.1) n/a
General and administrative expenses (115.3) (121.2) -4.8%
Other operating income (expenses) (31.5) (24.3) 29.5%
Financial results 206.7 11.0 n/a
Equity Pick-up (12.5) (11.4) 9.4%
Expenses with income and social contribution taxes (79.3) 72.8 n/a
Net Income 213.9 (92.3) n/a
Balance Sheet 2Q16 1Q16
BRL mln 6/30/2016 3/31/2016
Cash and cash equivalents 3,171 2,988
Marketable Securities 627 458
Inventories 1,206 512
Derivative financial instruments 1,300 1,241
Biological Assets 405 969
Other current assets 2,859 1,670
Other non-current assets 1,549 3,042
Investments 219 210
Property, plant and equipment 12,267 11,366
Intangible assets 3,246 3,264
Total Assets 26,848 25,719
Loans and borrowings 9,957 9,841
Financial instruments and derivatives 1,237 684
Trade accounts payable 977 892
Payroll 435 382
Other current liabilities 1,041 776
Other non-current liabilities 1,310 1,234
Shareholders' Equity 11,892 11,910
Total Liabilities 26,848 25,719

19 de 24
Cosan S/A – Earnings Release 2nd Quarter of the Fiscal Year of 2016
I.4 Comgás
Sales Volumes 2Q16 2Q15 Chg.% 1Q16 Chg.% 6M16 6M15 Chg.%
000 cbm (Apr-Jun) (Apr-Jun) 2Q16/2Q15 (Jan-Mar) 2Q16/1Q16 (Jan-Jun) (Jan-Jun) 6M16/6M15
Natural Gas Sales 1,050,782 1,359,250 -22.7% 1,058,655 -0.7% 2,173,685 2,722,849 -20.2%
Natural Gas Sales, ex-thermal power 1,032,252 1,103,979 -6.5% 974,255 6.0% 2,070,754 2,242,258 -7.6%
Residential 60,764 57,307 6.0% 47,086 29.0% 107,850 95,615 12.8%
Commercial 33,366 32,536 2.6% 30,882 8.0% 64,248 61,209 5.0%
Industrial 820,174 886,374 -7.5% 789,674 3.9% 1,609,848 1,778,708 -9.5%
Cogeneration 69,543 76,947 -9.6% 61,373 13.3% 130,916 147,538 -11.3%
Automotive 48,404 50,815 -4.7% 45,240 7.0% 93,644 97,979 -4.4%
Thermal Power 18,530 255,271 -92.7% 84,400 -78.0% 102,930 480,591 -78.6%
Indicators 2Q16 2Q15 Chg.% 1Q16 Chg.% 6M16 6M15 Chg.%
BRL mln (Apr-Jun) (Apr-Jun) 2Q16/2Q15 (Jan-Mar) 2Q16/1Q16 (Jan-Jun) (Jan-Jun) 6M16/6M15
IFRS EBITDA 641.3 473.5 35.4% 520.5 23.2% 1,162 729 59.3%
Normalized EBITDA 334.3 384.5 -13.0% 323.2 3.4% 658 684 -3.8%
CAPEX 109.3 122.5 -10.7% 94.1 16.1% 203 246 -17.3%
Income Statement for the Period 2Q16 2Q15 Chg.% 1Q16 Chg.% 6M16 6M15 Chg.%
BRL mln (Apr-Jun) (Apr-Jun) 2Q16/2Q15 (Jan-Mar) 2Q16/1Q16 (Jan-Jun) (Jan-Jun) 6M16/6M15
Net Revenue 1,494.0 1,671.0 -10.6% 1,460.1 2.3% 2,954.0 3,205.1 -7.8%
Natural Gas Sales 1,388.6 1,559.4 -11.0% 1,385.3 0.2% 2,773.9 2,995.9 -7.4%
Residential 197.9 181.3 9.1% 155.4 27.3% 353.3 302.2 16.9%
Commercial 75.9 71.8 5.7% 70.4 7.8% 146.3 133.4 9.7%
Industrial 996.8 1,049.1 -5.0% 1,006.1 -0.9% 2,002.8 2,077.0 -3.6%
Cogeneration 57.4 72.1 -20.4% 54.5 5.2% 111.9 138.1 -19.0%
Automotive 50.8 50.0 1.6% 47.1 7.8% 98.0 95.1 3.1%
Thermal Power 9.9 135.0 -92.7% 51.7 -80.9% 61.6 250.1 -75.4%
Construction - ICPC 01 88.1 103.3 -14.8% 66.2 33.1% 154.3 193.7 -20.4%
Other 17.3 8.2 n/a 11.2 54.7% 25.8 15.5 66.5%
Cost of goods and services sold (729.4) (1,090.9) -33.1% (828.6) -12.0% (1,558.0) (2,245.6) -30.6%
Natural Gas (641.3) (987.6) -35.1% (762.4) -15.9% (1,403.7) (2,051.9) -31.6%
Construction - ICPC 01 (88.1) (103.3) -14.8% (66.2) 33.1% (154.3) (193.7) -20.4%
Gross profit 764.5 580.1 31.8% 631.5 21.1% 1,396.0 959.5 45.5%
Selling, general and administrative expenses (244.5) (224.5) 8.9% (227.9) 7.3% (472.4) (465.6) 1.5%
Other net operating income (expenses) (0.6) (1.8) -64.2% (2.0) -68.3% (2.7) (3.9) -31.3%
Financial results (45.9) (58.3) -21.2% (96.1) -52.2% (142.0) (132.3) 7.4%
Expenses with income and social contribution taxes (163.1) (100.1) 62.9% (104.6) 55.9% (267.8) (132.0) n/a
Net Income (Loss) 310.3 195.4 58.8% 200.9 54.5% 511.2 225.8 n/a
Comgás 2Q16 1Q16 Balance Sheet 6/30/2016 3/31/2016
Cash and cash equivalents 1,391 1,000
Trade accounts receivable 541 462
Inventories 139 133
Derivative financial instruments 411 557
Other current assets 90 92
Other non-current assets 296 297
Intangible assets 8,574 8,593 Total Assets 11,442 11,134
Loans and borrowings 3,551 3,745
Trade accounts payable 1,165 1,144
Payroll 46 35
Other current liabilities 163 138
Other noncurrent liabilities 1,342 1,207
Shareholders' Equity 5,176 4,865 Total Liabilities 11,442 11,134

20 de 24
Cosan S/A – Earnings Release 2nd Quarter of the Fiscal Year of 2016
I.5 Lubricants
Sales Volumes 2Q16 2Q15 Chg.% 1Q16 Chg.% 6M16 6M15 Chg.%
000 cbm (Apr-Jun) (Apr-Jun) 2Q16/2Q15 (Jan-Mar) 2Q16/1Q16 (Jan-Jun) (Jan-Jun) 6M16/6M15
Total Volume 87.0 80.2 8.5% 76.9 13% 163.9 151.4 8.3%
Indicators 2Q16 2Q15 Chg.% 1Q16 Chg.% 6M16 6M15 Chg.%
BRL mln (Apr-Jun) (Apr-Jun) 2Q16/2Q15 (Jan-Mar) 2Q16/1Q16 (Jan-Jun) (Jan-Jun) 6M16/6M15
EBITDA 27.3 39.1 -30.1% 25.9 5.5% 53.2 62.5 -14.9%
Income Statement for the Period 2Q16 2Q15 Chg.% 1Q16 Chg.% 6M16 6M15 Chg.%
BRL mln (Apr-Jun) (Apr-Jun) 2Q16/2Q15 (Jan-Mar) 2Q16/1Q16 (Jan-Jun) (Jan-Jun) 6M16/6M15
Net Revenue 489.0 424.1 15.3% 479.1 2.1% 968.1 803.9 20.4%
Cost of Goods and Services Sold (369.3) (314.3) 17.5% (371.9) -0.7% (741.3) (602.8) 23.0%
Gross profit 119.7 109.8 8.9% 107.2 11.6% 226.8 201.1 12.8%
Selling, general and administrative expenses (112.3) (87.8) 28.0% (102.8) 9.3% (215.1) (168.7) 27.5%
Other net operating income (expenses) 0.2 0.2 -28.3% 1.7 -91.0% 1.9 0.4 n/a
Financial results (25.4) (12.8) 98.6% (18.9) 34.0% (44.3) (9.0) n/a
Equity Pick-up (2.2) (2.1) 1.2% (0.9) n/a (3.0) (7.1) -57.4%
Expenses with income and social contribution taxes 4.1 (3.3) n/a 0.6 n/a 4.6 (9.0) n/a
Net Income (Loss) (15.9) 4.1 n/a (13.1) 21.7% (29.0) 7.6 n/a
Balance Sheet 2Q16 1Q16
BRL mln 6/30/2016 3/31/2016
Cash and cash equivalents 64 73
Trade accounts receivable 242 241
Inventories 289 301
Other current assets 47 63
Other non-current assets 49 29
Investments 6 9
Property, plant and equipment 240 242
Intangible assets 796 808
Total Assets 1,734 1,766
Loans and borrowings 473 542
Financial instruments and derivatives 53 29
Trade accounts payable 198 241
Payroll 18 14
Other current liabilities 133 89
Other non-current liabilities 158 178
Shareholders' Equity 701 673
Total Liabilities 1,734 1,766
21 de 24
Cosan S/A – Earnings Release 2nd Quarter of the Fiscal Year of 2016
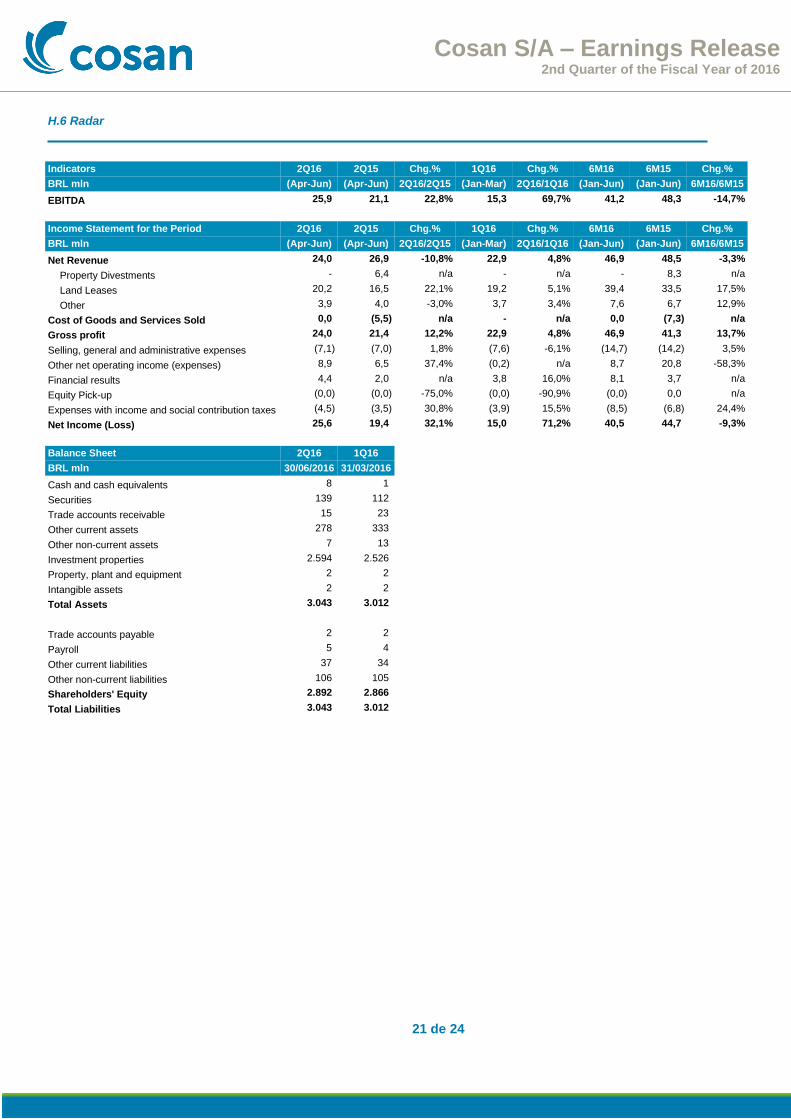
H.6 Radar
Indicators 2Q16 2Q15 Chg.% 1Q16 Chg.% 6M16 6M15 Chg.%
BRL mln (Apr-Jun) (Apr-Jun) 2Q16/2Q15 (Jan-Mar) 2Q16/1Q16 (Jan-Jun) (Jan-Jun) 6M16/6M15
EBITDA 25,9 21,1 22,8% 15,3 69,7% 41,2 48,3 -14,7%
Income Statement for the Period 2Q16 2Q15 Chg.% 1Q16 Chg.% 6M16 6M15 Chg.%
BRL mln (Apr-Jun) (Apr-Jun) 2Q16/2Q15 (Jan-Mar) 2Q16/1Q16 (Jan-Jun) (Jan-Jun) 6M16/6M15
Net Revenue 24,0 26,9 -10,8% 22,9 4,8% 46,9 48,5 -3,3%
Property Divestments - 6,4 n/a - n/a - 8,3 n/a
Land Leases 20,2 16,5 22,1% 19,2 5,1% 39,4 33,5 17,5%
Other 3,9 4,0 -3,0% 3,7 3,4% 7,6 6,7 12,9%
Cost of Goods and Services Sold 0,0 (5,5) n/a - n/a 0,0 (7,3) n/a
Gross profit 24,0 21,4 12,2% 22,9 4,8% 46,9 41,3 13,7%
Selling, general and administrative expenses (7,1) (7,0) 1,8% (7,6) -6,1% (14,7) (14,2) 3,5%
Other net operating income (expenses) 8,9 6,5 37,4% (0,2) n/a 8,7 20,8 -58,3%
Financial results 4,4 2,0 n/a 3,8 16,0% 8,1 3,7 n/a
Equity Pick-up (0,0) (0,0) -75,0% (0,0) -90,9% (0,0) 0,0 n/a
Expenses with income and social contribution taxes (4,5) (3,5) 30,8% (3,9) 15,5% (8,5) (6,8) 24,4%
Net Income (Loss) 25,6 19,4 32,1% 15,0 71,2% 40,5 44,7 -9,3%
Balance Sheet 2Q16 1Q16
BRL mln 30/06/2016 31/03/2016
Cash and cash equivalents 8 1
Securities 139 112
Trade accounts receivable 15 23
Other current assets 278 333
Other non-current assets 7 13
Investment properties 2.594 2.526
Property, plant and equipment 2 2
Intangible assets 2 2
Total Assets 3.043 3.012
Trade accounts payable 2 2
Payroll 5 4
Other current liabilities 37 34
Other non-current liabilities 106 105
Shareholders' Equity 2.892 2.866
Total Liabilities 3.043 3.012

22 de 24
Cosan S/A – Earnings Release 2nd Quarter of the Fiscal Year of 2016
I.7 Cosan Corporate
Indicators 2Q16 2Q15 Chg.% 1Q16 Chg.% 6M16 6M15 Chg.%
BRL mln (Apr-Jun) (Apr-Jun) 2Q16/2Q15 (Jan-Mar) 2Q16/1Q16 (Jan-Jun) (Jan-Jun) 6M16/6M15
EBITDA 369.6 171.7 n/a 476.7 -22.5% 846.3 219.8 n/a
Income Statement for the Period 2Q16 2Q15 Chg.% 1Q16 Chg.% 6M16 6M15 Chg.%
BRL mln (Apr-Jun) (Apr-Jun) 2Q16/2Q15 (Jan-Mar) 2Q16/1Q16 (Jan-Jun) (Jan-Jun) 6M16/6M15
Net Revenue 0.3 0.0 n/a 0.0 n/a 0.4 - n/a
Gross profit (8.2) 0.0 n/a (0.5) n/a (8.7) (0.0) n/a
Selling, general & administrative expenses (41.1) (44.4) -7.4% (42.0) -2.1% (83.1) (75.3) 10.3%
Other net operating income (expenses) (18.4) (6.8) n/a (39.3) -53.2% (57.7) (118.1) -51.1%
Financial results (182.7) (191.7) -4.7% (338.1) -46.0% (520.9) (407.9) 27.7%
Equity Pick-up 432.7 188.7 n/a 555.5 -22.1% 988.3 390.2 n/a
Expenses with income and social contribution taxes 99.3 70.5 40.8% 113.1 -12.2% 212.4 195.9 8.4%
Net Income (Loss) 281.6 16.4 n/a 248.7 13.2% 530.3 (15.2) n/a
Balance Sheet 2Q16 1Q16
BRL mln 6/30/2016 3/31/2016
Cash and cash equivalents 797 1,587
Inventories 3 3
Financial instruments and derivatives 588 1,313
Other current assets 254 295
Other non-current assets 1,722 1,795
Investments 13,775 13,490
Property, plant and equipment 151 152
Intangible assets 8 9
Total Assets 17,298 18,644
Loans and borrowings 4,221 4,987
Financial instruments and derivatives 763 933
Trade accounts payable 5 4
Payroll 13 10
Other current liabilities 186 192
Other non-current liabilities 3,463 3,801
Shareholders' Equity 8,647 8,717
Total Liabilities 17,298 18,644
23 de 24
Cosan S/A – Earnings Release 2nd Quarter of the Fiscal Year of 2016
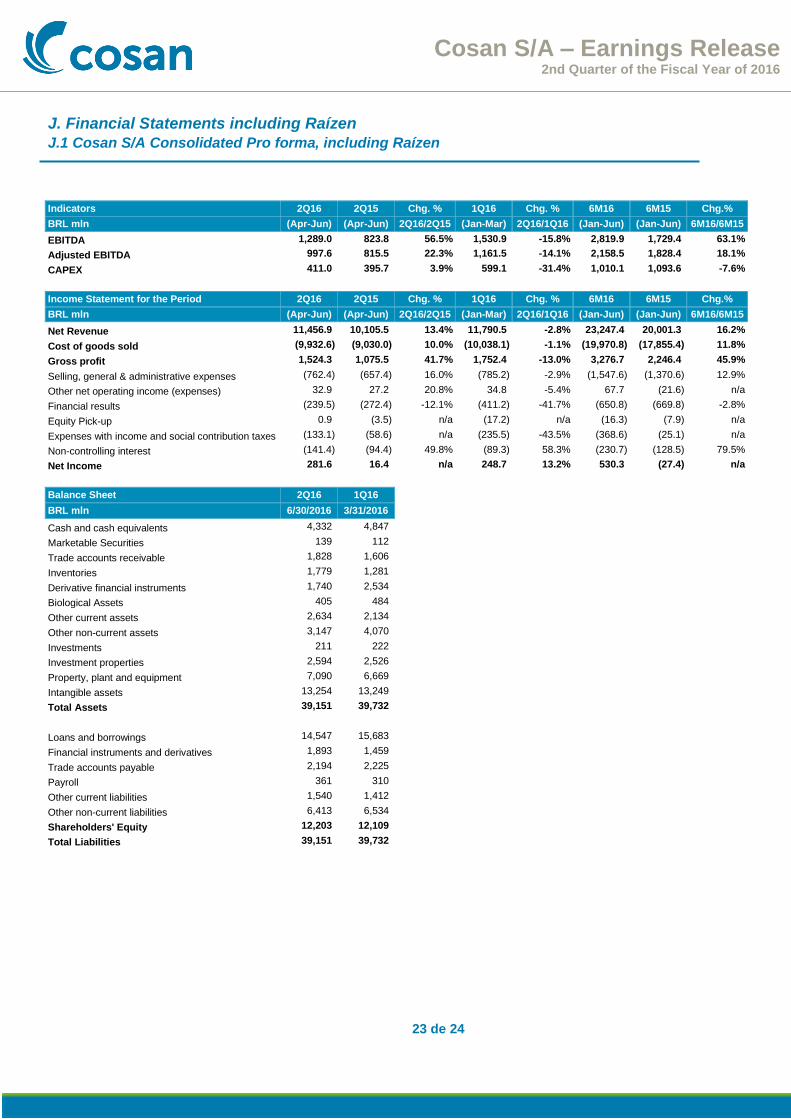
J. Financial Statements including Raízen
J.1 Cosan S/A Consolidated Pro forma, including Raízen
Indicators 2Q16 2Q15 Chg. % 1Q16 Chg. % 6M16 6M15 Chg.%
BRL mln (Apr-Jun) (Apr-Jun) 2Q16/2Q15 (Jan-Mar) 2Q16/1Q16 (Jan-Jun) (Jan-Jun) 6M16/6M15
EBITDA 1,289.0 823.8 56.5% 1,530.9 -15.8% 2,819.9 1,729.4 63.1%
Adjusted EBITDA 997.6 815.5 22.3% 1,161.5 -14.1% 2,158.5 1,828.4 18.1%
CAPEX 411.0 395.7 3.9% 599.1 -31.4% 1,010.1 1,093.6 -7.6%
Income Statement for the Period 2Q16 2Q15 Chg. % 1Q16 Chg. % 6M16 6M15 Chg.%
BRL mln (Apr-Jun) (Apr-Jun) 2Q16/2Q15 (Jan-Mar) 2Q16/1Q16 (Jan-Jun) (Jan-Jun) 6M16/6M15
Net Revenue 11,456.9 10,105.5 13.4% 11,790.5 -2.8% 23,247.4 20,001.3 16.2%
Cost of goods sold (9,932.6) (9,030.0) 10.0% (10,038.1) -1.1% (19,970.8) (17,855.4) 11.8%
Gross profit 1,524.3 1,075.5 41.7% 1,752.4 -13.0% 3,276.7 2,246.4 45.9%
Selling, general & administrative expenses (762.4) (657.4) 16.0% (785.2) -2.9% (1,547.6) (1,370.6) 12.9%
Other net operating income (expenses) 32.9 27.2 20.8% 34.8 -5.4% 67.7 (21.6) n/a
Financial results (239.5) (272.4) -12.1% (411.2) -41.7% (650.8) (669.8) -2.8%
Equity Pick-up 0.9 (3.5) n/a (17.2) n/a (16.3) (7.9) n/a
Expenses with income and social contribution taxes (133.1) (58.6) n/a (235.5) -43.5% (368.6) (25.1) n/a
Non-controlling interest (141.4) (94.4) 49.8% (89.3) 58.3% (230.7) (128.5) 79.5%
Net Income 281.6 16.4 n/a 248.7 13.2% 530.3 (27.4) n/a
Balance Sheet 2Q16 1Q16
BRL mln 6/30/2016 3/31/2016
Cash and cash equivalents 4,332 4,847
Marketable Securities 139 112
Trade accounts receivable 1,828 1,606
Inventories 1,779 1,281
Derivative financial instruments 1,740 2,534
Biological Assets 405 484
Other current assets 2,634 2,134
Other non-current assets 3,147 4,070
Investments 211 222
Investment properties 2,594 2,526
Property, plant and equipment 7,090 6,669
Intangible assets 13,254 13,249
Total Assets 39,151 39,732
Loans and borrowings 14,547 15,683
Financial instruments and derivatives 1,893 1,459
Trade accounts payable 2,194 2,225
Payroll 361 310
Other current liabilities 1,540 1,412
Other non-current liabilities 6,413 6,534
Shareholders' Equity 12,203 12,109
Total Liabilities 39,151 39,732

24 de 24
Cosan S/A – Earnings Release 2nd Quarter of the Fiscal Year of 2016
K. Financial Statements, Cosan perspective
K.1 Earnings from Raízen Combustíveis to Cosan perspective
Earnings Conciliation 2Q16 2Q15
BRL mln (Apr-Jun) (Apr-Jun)
EBITDA - Raízen Combustíveis perspective 675.8 522.9
Fair Value Effects (14.6) (8.4)
EBITDA - Cosan perspective 661.3 514.5
Net Income - Raízen Combustíveis perspective 300.7 225.3
Depreciation & Amortization (17.7) (17.3)
Fair Value Effects (14.6) (8.4)
Income Tax (34%) 11.0 8.7
Net Income - Cosan perspective 279.4 208.3
K.2 Earnings from Raízen Energia to Cosan perspective
Earnings Conciliation 2Q16 2Q15
BRL mln (Apr-Jun) (Apr-Jun)
EBITDA - Raízen Energia perspective 632.7 178.1
Fair Value Effects (5.2) (17.7)
EBITDA - Cosan perspective 627.5 160.4
Net Income - Raízen Energia perspective 251.6 (56.7)
Depreciation & Amortization (49.9) (34.3)
Fair Value Effects (5.2) (17.7)
Financial Expenses (2.0) (2.0)
Income Tax (34%) 19.4 18.4
Net Income - Cosan perspective 213.9 (92.3)
K.3 Earnings from Comgás to Cosan perspective
Earnings Conciliation 2Q16 2Q15
BRL mln (Apr-Jun) (Apr-Jun)
Net Income - Comgás perspective 330.4 215.5
Amortization adjustments (30.5) (30.5)
Income Tax and Social Contribution 10.4 10.4
Net Income - Cosan perspective 310.3 195.4