Embed Size (px)
Citation preview

1 of 21
EARNINGS RELEASE 2016
São Paulo, February 16, 2017 – RUMO S/A (BM&FBovespa: RUMO3) (“Rumo”) and COSAN LOGÍSTICA S.A.
(BM&FBovespa: RLOG3) (“Cosan Logística”) announce today its results for the fourth quarter of 2016 (4Q16) and the
year 2016. The results are consolidated in accordance with the accounting criteria adopted in Brazil and the International
Financial Reporting Standards (IFRS).
Rumo Highlights in 4Q16 and 2016
EBITDA reached R$348 million in 4Q16, down 26% from 4Q15. In 2016, however, EBITDA grew 6% to R$2.0 billion, due to initiatives to mitigate lower transportation volumes.
Total volume transported in 4Q16 reached 7.5 billion RTK, and was impacted by the drop in demand for grain transportation caused by the shortfall in the second corn crop. Total volume transported in the year was 40.3 billion RTK, 10% lower than in 2015.
A total of 2.6 million tons were loaded at Rumo's terminals at the Port of Santos, in 4Q16, 26% lower than in 4Q15, due to the postponement of sugar shipments during the quarter and the strong comparison basis in the previous year due to loading of grains. In 2016, loaded volume reached 13 million tons, up 12% from 2015.
Capex totaled R$480 million in 4Q16 and was focused on capacity expansion initiatives. In 2016, Capex totaled R$1.9 billion, in line with the projections for the year.
4Q16 Pro forma
4Q15 Chg. % Summmary of Financial Information - Rumo Consolidated 2016
Pro forma¹ 2015
Combined² Chg. %
(Amounts in R$ MM)
1,014.6 1,254.3 -19.1% Net Revenue 5,014.6 4,802.5 4.4%
136.0 316.2 -57.0% Gross Profit 1,245.4 1,404.4 -11.3%
13.4% 25.2% -11.8 p.p. Gross Margin (%) 24.8% 29.2% -4.4 p.p.
(85.4) (82.6) 3.5% Selling Expenses, General and Administrative Expenses (344.4) (360.7) -4.5%
2.1 16.6 -87.2% Other Operating Revenues (Expenses) and Equity Pickup 7.5 42.1 -82.2%
52.7 250.2 -78.9% Operational Profit 908.5 1,085.9 -16.3%
295.2 217.7 35.6% Depreciation and Amortization 1,120.0 832.0 34.6%
348.0 467.9 -25.6% EBITDA 2,028.6 1,918.0 5.8%
34.3% 37.3% -3.0 p.p. EBITDA Margin (%) 40.5% 39.9% 0.5 p.p.
(319.0) (162.7) 96.0% Net profit (loss) (733.5) (469.5) 56.2%
-45.0% -13.0% -32.1 p.p. Margin (%) -14.6% -9.8% -4.9 p.p.
480.1 515.3 -6.8% Capex 1,926.0 1,950.7 -1.3% Note 1: The pro forma results refer to the results of Rumo S.A. plus the results of Rumo Logística S.A., the company that resulted from the reverse merger carried out on December 31, 2016. For more details, see page 6 of this report. Note 2: The combined results mentioned in this report refer to the sum of Rumo and ALL consolidated with the appropriate eliminations of transactions with related parties, not necessarily fulfilling all the requirements of OCPC 06 - Presentation of Pro Forma Financial Information.
Investor Relations
E-mail: [email protected]
Phones: +55 41 2141-7459
+55 11 3897-9797
Website: ri.rumolog.com
Portuguese – 2:00 p.m. (Brasília time)
February 17, 2017 (Friday)
Phone: + 55 11 3193 1001
+ 55 11 2820 4001
Code: RUMO
English – 3:00 p.m. (Brasília time)
February 17, 2017 (Friday)
Phone (BR): + 55 11 3193 1001
+ 55 11 2820 4001
Phone (U.S.): +1 786 924 6977
Code: RUMO
Conference Call
2 of 21
Earnings Release 4Q16 and 2016
1. Letter from the CEO
We can say that 2016 will be remembered as a challenging year in many aspects. We went through a moment of political and economic turbulence that brought volatility to the markets. In our business, we faced a significant crop shortfall and, consequently, a sharp decline in exports, resulting in a decrease in volume transported, also impacting other sectors of the economy. We also faced a credit constrain period in the Brazilian market, adding obstacles to the execution of our investment plan. Despite this scenario, we registered important achievements at Rumo in the second year of our turnaround process. We overcome strategic and operational challenges through a railroad culture and greater engagement from our employees. We focused our efforts on variables under our control, providing better quality services, controlling costs and maximizing the use of our assets. We implemented the Zero Accident Program and invested in innovation and technology pursuing higher operating efficiency. We reached new markets and made investments in accordance with our business plan. Initiated a long-term relationship with our clients, establishing greater commitment on both sides. Our shareholders reinforced their confidence in our project through a capitalization of R$2.6 billion, which strengthened our balance sheet and provided greater liquidity to our operations. We also reprofiled R$2.9 billion in debt with our creditors and, in the beginning of 2017 we inaugurated our access to the international debt market through a bond issuance of US$ 750 (seven hundred and fifty) million. We also advanced in the renewing process of Paulista Network concession, which began with the opening of the public hearing by the regulatory agency, which is one of the main stages for the concession agreement extension. This asset is strategic, since this is part of the main soybean and corn export corridor in Brazil. We remain convinced that growth resumption will depend on investments in infrastructure, efficiency and productivity. In this context, we remain committed to the logistics infrastructure development in Brazil. The year 2017 is an opportunity for better results due to market forecast and investments ripeness. All our efforts remain focused on value creation to our shareholders. Thank you very much. Julio Fontana Neto CEO of Rumo

3 of 21
Earnings Release 4Q16 and 2016
2. Executive Summary 4Q16 and 2016
Rumo’s consolidated result in 2016 grew in comparison with 2015, despite the drop in grain export
volume. 4Q16 was particularly affected, with net revenue decreasing by 19%. According to Agroconsult,
consolidated data on the 2015/2016 crop pointed to a decrease of approximately 17% in total corn production.
The effect of this decrease was harder on export volumes, since domestic consumption remained unchanged,
leading to lower demand for railroad transportation in export corridors.
Total volume transported in 2016 reached 40.3 billion RTK, down 10% from 2015. The decline in the quarter
was even higher (-39%) due to low export volumes. The market scenario in the year was quite challenging,
especially in the company’s two main cargo types: soybean and corn. Soybean had an unusual shipment dynamics,
with concentration in 1Q16, occupying all Rumo’s available capacity and with additional transportation demand
that was not served. Corn registered a shortfall of 18% in second-crop production, which, together with the higher
demand in the domestic market, led to a reduction of approximately 60% (Agroconsult) in exports in the second
half of 2016. Even though the volume projected in the business plan for the year was not reached, the adoption of
a new commercial strategy with long-term agreements (three years) with our main grain clients was key to secure
revenue and market share gains even in a scenario of declining truck freight prices, as shown in the charts below.
Source: IMEA, Agência Marítima and Rumo System
In 2016, EBITDA totaled R$2.0 billion (+6%) due to the initiatives to offset lower transport volumes. In the
quarter, EBITDA decreased 26% to R$348.1 million. Efforts to reduce costs (both fixed and variable), increase
operating efficiency, and higher sugar transportation using the idle capacity of our assets were key to partially
compensate the decline in transportation demand caused by crop shortfall. In the year, there was recognition of
R$258.4 million from take-or-pay clauses on commercial contracts.
In 2016, Rumo registered a loss of R$733.5 million and leverage, as measured by broad net debt/EBITDA,
reached 4.4 times. Despite EBITDA growth, the higher financial expenses, as well as higher depreciation and
amortization, led to a loss increase of R$264 million in 2016. Leverage increased due to the decline in EBITDA
over the last 12 months on account of the weaker performance in 4Q16 compared to 4Q15.
The outlook for the 2016/2017 grain crop is quite positive. Updated market estimates point to a total increase
of approximately 12% and 32%, respectively, in Brazil’s soybean and corn crops. Considering only the state of
Mato Grosso, the scenario is more promising, with growth of about 15% and 42% for soybean and corn crops,
respectively.

4 of 21
Earnings Release 4Q16 and 2016
Forecast for soybean production in Brazil Forecast for corn production in Brazil (Million tons) (Million tons)
Source: Agroconsult
All the comments in this report refer to the consolidated results of Rumo. However, the 4Q16 and 2016
financial information related to Cosan Logística is available in the appendixes.
5 of 21
Earnings Release 4Q16 and 2016
3. Consolidated Operating and Financial Indicators
4Q16 Pro forma
4Q15 Chg. % Operational and Financial Figures 2016
Pro forma 2015
Combined Chg. %
(Amounts in R$MM)
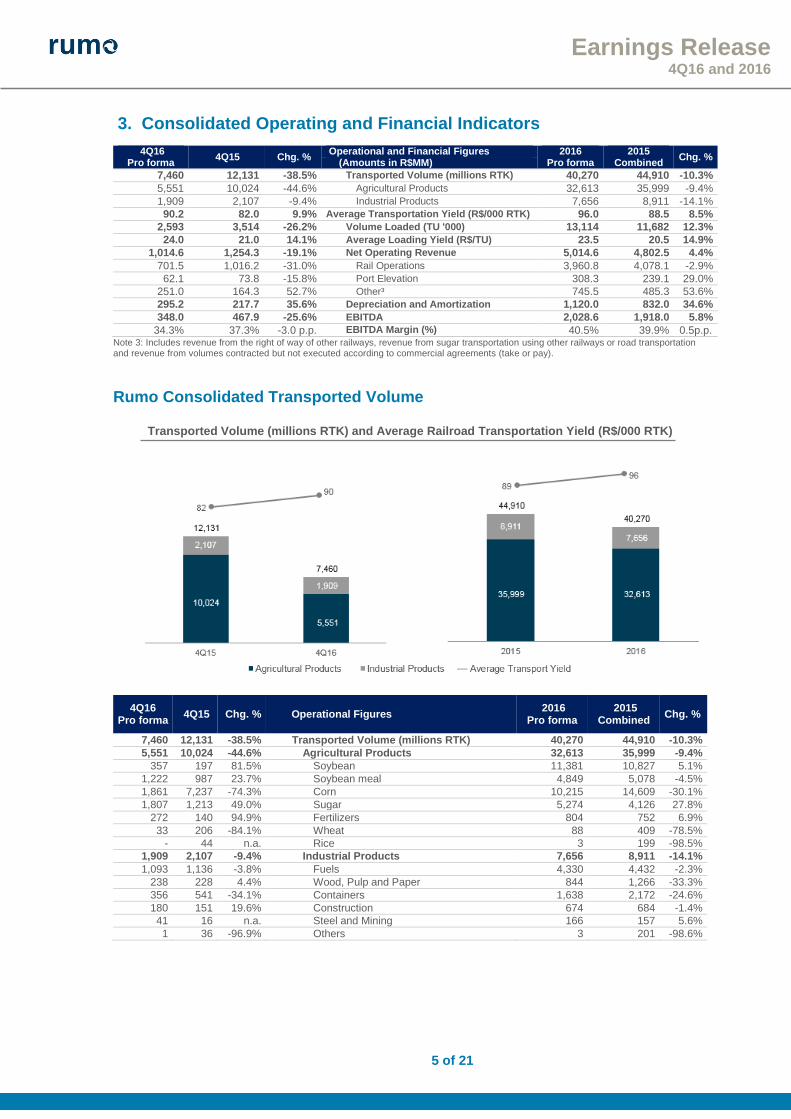
7,460 12,131 -38.5% Transported Volume (millions RTK) 40,270 44,910 -10.3%
5,551 10,024 -44.6% Agricultural Products 32,613 35,999 -9.4%
1,909 2,107 -9.4% Industrial Products 7,656 8,911 -14.1%
90.2 82.0 9.9% Average Transportation Yield (R$/000 RTK) 96.0 88.5 8.5%
2,593 3,514 -26.2% Volume Loaded (TU '000) 13,114 11,682 12.3%
24.0 21.0 14.1% Average Loading Yield (R$/TU) 23.5 20.5 14.9%
1,014.6 1,254.3 -19.1% Net Operating Revenue 5,014.6 4,802.5 4.4%
701.5 1,016.2 -31.0% Rail Operations 3,960.8 4,078.1 -2.9%
62.1 73.8 -15.8% Port Elevation 308.3 239.1 29.0%
251.0 164.3 52.7% Other³ 745.5 485.3 53.6%
295.2 217.7 35.6% Depreciation and Amortization 1,120.0 832.0 34.6%
348.0 467.9 -25.6% EBITDA 2,028.6 1,918.0 5.8%
34.3% 37.3% -3.0 p.p. EBITDA Margin (%) 40.5% 39.9% 0.5p.p. Note 3: Includes revenue from the right of way of other railways, revenue from sugar transportation using other railways or road transportation and revenue from volumes contracted but not executed according to commercial agreements (take or pay).
Rumo Consolidated Transported Volume
Transported Volume (millions RTK) and Average Railroad Transportation Yield (R$/000 RTK)
4Q16 Pro forma
4Q15 Chg. % Operational Figures 2016
Pro forma 2015
Combined Chg. %
7,460 12,131 -38.5% Transported Volume (millions RTK) 40,270 44,910 -10.3%
5,551 10,024 -44.6% Agricultural Products 32,613 35,999 -9.4%
357 197 81.5% Soybean 11,381 10,827 5.1%
1,222 987 23.7% Soybean meal 4,849 5,078 -4.5%
1,861 7,237 -74.3% Corn 10,215 14,609 -30.1%
1,807 1,213 49.0% Sugar 5,274 4,126 27.8%
272 140 94.9% Fertilizers 804 752 6.9%
33 206 -84.1% Wheat 88 409 -78.5%
- 44 n.a. Rice 3 199 -98.5%
1,909 2,107 -9.4% Industrial Products 7,656 8,911 -14.1%
1,093 1,136 -3.8% Fuels 4,330 4,432 -2.3%
238 228 4.4% Wood, Pulp and Paper 844 1,266 -33.3%
356 541 -34.1% Containers 1,638 2,172 -24.6%
180 151 19.6% Construction 674 684 -1.4%
41 16 n.a. Steel and Mining 166 157 5.6%
1 36 -96.9% Others 3 201 -98.6%

6 of 21
Earnings Release 4Q16 and 2016
Results by Business Unit
Business Units The business units (reporting segments) are organized as follows:
North Operation Malha Norte, Malha Paulista and Port Operations in Santos
South Operation Malha Oeste and Malha Sul
Container Operations Container operations including Brado Logística
Results by Business Unit North Operation
South Operation
Containers Operation
Consolidated 4Q16 Pro forma
Net Revenue 706.1 248.0 60.5 1,014.6
Costs of Services (494.9) (303.2) (80.4) (878.5)
Gross Profit (Loss) 211.2 (55.2) (19.9) 136.0
Gross Margin(%) 29.9% -22.3% -32.9% 13.4%
Selling Expenses, General and Administrative Expenses (62.0) (15.2) (8.2) (85.4)
Other Operating Revenues (Expenses) (7.9) 2.7 7.4 2.1
Depreciation and Amortization4 188.1 93.9 13.2 295.2
EBITDA 329.4 26.2 (7.6) 348.0
EBITDA Margin (%) 46.7% 10.6% -12.5% 34.3%
Results by Business Unit North Operation
South Operation
Containers Operation
Consolidated 2016 Pro forma
Net Revenue 3,651.5 1,097.7 265.4 5,014.6
Costs of Services (2,175.1) (1,272.6) (321.4) (3,769.1)
Gross Profit (Loss) 1,476.4 (174.9) (56.0) 1,245.4
Gross Margin(%) 40.4% -15.9% -21.1% 24.8%
Selling Expenses, General and Administrative Expenses (237.8) (63.7) (42.9) (344.4)
Other Operating Revenues (Expenses) (1.2) (7.1) 15.7 7.5
Depreciation and Amortization4 688.6 379.0 52.4 1,120.0
EBITDA 1,926.0 133.4 (30.8) 2,028.6
EBITDA Margin (%) 52.7% 12.1% -11.6% 40.5% Note 4: Depreciation and amortization are allocated as cost of services provided and as general and administrative expenses.
On December 19, 2016, the merger of Rumo Logística with Rumo S.A. (“Merger”) was approved. The corporate reorganization was concluded on December 31, 2016 and resulted in the dissolution of Rumo Logística, with Rumo S.A. succeeding to all its assets, rights and obligations, pursuant to Articles 224 to 227 of Federal Law 6,404/76 (“Brazilian Corporation Law”). As part of the corporate reorganization, Rumo S.A. also allocated the assets and liabilities related to port operations to a new direct subsidiary. Rumo S.A. also allocated assets (rail cars and locomotives) to the direct subsidiary ALL Malha Norte. The accounting effects of the corporate reorganization are explained in Note 3.b to the financial statements and the financial position and consolidated operating results of Rumo S.A. for the current period and fiscal years following the reorganization are not necessarily comparable with the information provided in previous years. Due to this process, the financial information in this Earnings Release is pro forma, eliminating any effects of corporate reorganization. Furthermore, the depreciation and amortization amounts for the initial quarters of 2016 are being restated.
7 of 21
Earnings Release 4Q16 and 2016
North Operation
4Q16 Pro forma
4Q15 Chg. % Operational Figures 2016
Pro forma 2015
Combined Chg. %
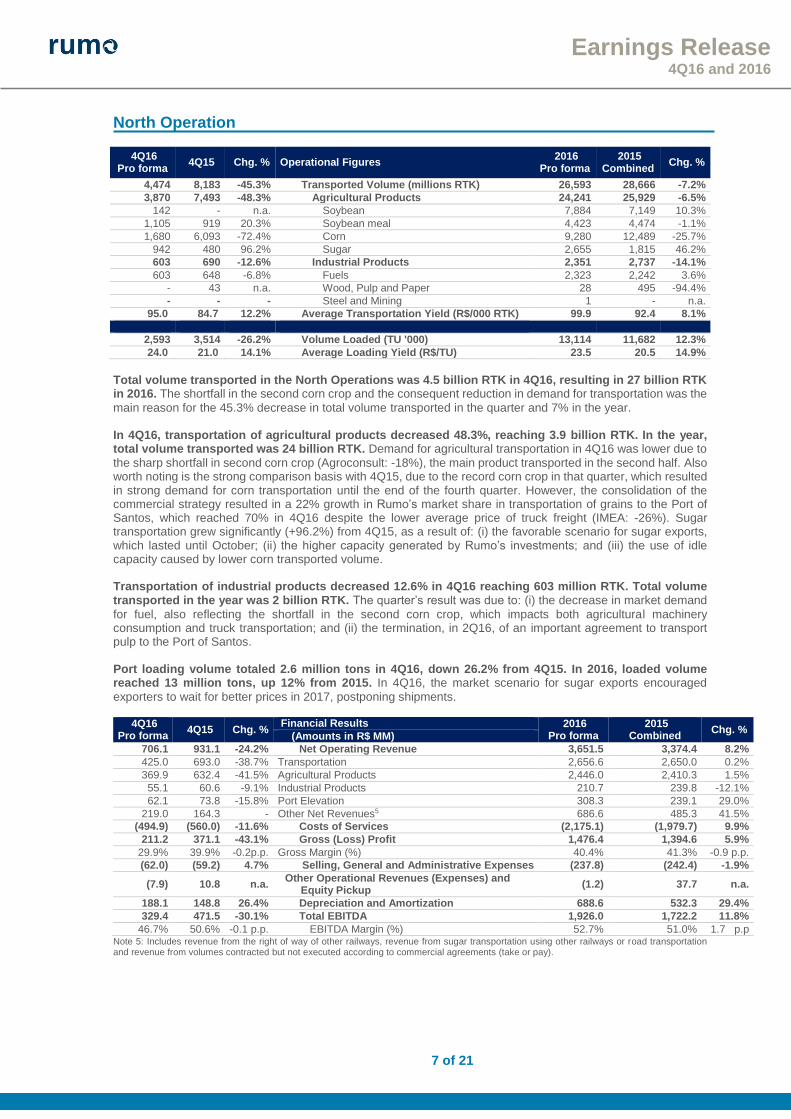
4,474 8,183 -45.3% Transported Volume (millions RTK) 26,593 28,666 -7.2%
3,870 7,493 -48.3% Agricultural Products 24,241 25,929 -6.5%
142 - n.a. Soybean 7,884 7,149 10.3%
1,105 919 20.3% Soybean meal 4,423 4,474 -1.1%
1,680 6,093 -72.4% Corn 9,280 12,489 -25.7%
942 480 96.2% Sugar 2,655 1,815 46.2%
603 690 -12.6% Industrial Products 2,351 2,737 -14.1%
603 648 -6.8% Fuels 2,323 2,242 3.6%
- 43 n.a. Wood, Pulp and Paper 28 495 -94.4%
- - - Steel and Mining 1 - n.a.
95.0 84.7 12.2% Average Transportation Yield (R$/000 RTK) 99.9 92.4 8.1%
2,593 3,514 -26.2% Volume Loaded (TU '000) 13,114 11,682 12.3%
24.0 21.0 14.1% Average Loading Yield (R$/TU) 23.5 20.5 14.9%
Total volume transported in the North Operations was 4.5 billion RTK in 4Q16, resulting in 27 billion RTK in 2016. The shortfall in the second corn crop and the consequent reduction in demand for transportation was the
main reason for the 45.3% decrease in total volume transported in the quarter and 7% in the year. In 4Q16, transportation of agricultural products decreased 48.3%, reaching 3.9 billion RTK. In the year, total volume transported was 24 billion RTK. Demand for agricultural transportation in 4Q16 was lower due to
the sharp shortfall in second corn crop (Agroconsult: -18%), the main product transported in the second half. Also worth noting is the strong comparison basis with 4Q15, due to the record corn crop in that quarter, which resulted in strong demand for corn transportation until the end of the fourth quarter. However, the consolidation of the commercial strategy resulted in a 22% growth in Rumo’s market share in transportation of grains to the Port of Santos, which reached 70% in 4Q16 despite the lower average price of truck freight (IMEA: -26%). Sugar transportation grew significantly (+96.2%) from 4Q15, as a result of: (i) the favorable scenario for sugar exports, which lasted until October; (ii) the higher capacity generated by Rumo’s investments; and (iii) the use of idle capacity caused by lower corn transported volume. Transportation of industrial products decreased 12.6% in 4Q16 reaching 603 million RTK. Total volume transported in the year was 2 billion RTK. The quarter’s result was due to: (i) the decrease in market demand
for fuel, also reflecting the shortfall in the second corn crop, which impacts both agricultural machinery consumption and truck transportation; and (ii) the termination, in 2Q16, of an important agreement to transport pulp to the Port of Santos. Port loading volume totaled 2.6 million tons in 4Q16, down 26.2% from 4Q15. In 2016, loaded volume reached 13 million tons, up 12% from 2015. In 4Q16, the market scenario for sugar exports encouraged
exporters to wait for better prices in 2017, postponing shipments.
4Q16 Pro forma
4Q15 Chg. % Financial Results 2016
Pro forma 2015
Combined Chg. %
(Amounts in R$ MM)
706.1 931.1 -24.2% Net Operating Revenue 3,651.5 3,374.4 8.2%
425.0 693.0 -38.7% Transportation 2,656.6 2,650.0 0.2%
369.9 632.4 -41.5% Agricultural Products 2,446.0 2,410.3 1.5%
55.1 60.6 -9.1% Industrial Products 210.7 239.8 -12.1%
62.1 73.8 -15.8% Port Elevation 308.3 239.1 29.0%
219.0 164.3 - Other Net Revenues5 686.6 485.3 41.5%
(494.9) (560.0) -11.6% Costs of Services (2,175.1) (1,979.7) 9.9%
211.2 371.1 -43.1% Gross (Loss) Profit 1,476.4 1,394.6 5.9%
29.9% 39.9% -0.2p.p. Gross Margin (%) 40.4% 41.3% -0.9 p.p.
(62.0) (59.2) 4.7% Selling, General and Administrative Expenses (237.8) (242.4) -1.9%
(7.9) 10.8 n.a. Other Operational Revenues (Expenses) and
Equity Pickup (1.2) 37.7 n.a.
188.1 148.8 26.4% Depreciation and Amortization 688.6 532.3 29.4%
329.4 471.5 -30.1% Total EBITDA 1,926.0 1,722.2 11.8%
46.7% 50.6% -0.1 p.p. EBITDA Margin (%) 52.7% 51.0% 1.7 p.p Note 5: Includes revenue from the right of way of other railways, revenue from sugar transportation using other railways or road transportation and revenue from volumes contracted but not executed according to commercial agreements (take or pay).

8 of 21
Earnings Release 4Q16 and 2016
Net revenue from North Operation totaled R$706 million in 4Q16, down 24.2% from 4Q15. In the year, net revenue grew 8.2% from 2015 to reach R$3.7 billion. The revenue decrease in 4Q16 resulted mainly from
lower volumes transported and loaded, and was partially offset by the 33.3% growth in other revenue, with the recognition of R$117.9 million from take-or-pay agreements. Average Transportation Yield in 4Q16, excluding the effects of take-or-pay revenue, grew 12.2% to R$95.0/thousand RTK due to contractual adjustments. Average yield from port loading grew 14.1%, due to the renegotiation of sugar agreements in 2Q16 by which logistics costs and port tariffs were passed on to clients. Cost of services provided totaled R$494.9 million in the quarter, down 11.6% from 4Q15. In 2016, cost of services provided was R$2.2 billion, down 9.9% from the previous year. The cost reduction in the quarter
was due to the decrease in variable costs resulting from lower volume transported (-45.3%) and other initiatives to capture operating efficiency. The higher utilization of the Rumo’s own fleet to transport sugar instead of contracting trucks and other railroads contributed to the reduction in logistics costs. Fixed costs increased, though below initial projections. Additionally, depreciation and amortization increased in 4Q16 due to higher investments over the last two years, replacing less efficient assets, in accordance with the Business Plan. EBITDA reached R$329.4 million in 4Q16, down 30.1% from 4Q15. In the year, EBITDA totaled R$1.9 billion.
The 4Q16 results were impacted by the sharp decline in agricultural volume for export and were partially offset by cost cutting efforts and the recognition of revenue from take-or-pay agreements, established in commercial agreements.
South Operation
The South Operation transported a total volume of 2.6 billion RTK in 4Q16, down 22.8% from 4Q15. Total volume transported in the year was 12.0 billion RTK, down 14.5% from 2015. The 4Q16 results were
impacted by lower agricultural volumes, reflecting the lower demand for transportation of corn for exports, which worsened at the end of 2016. The volume of agricultural products fell 33.6% to 1.7 billion RTK in 4Q16. Total volume transported in the year was 8.4 billion RTK, down 16,9% compared to 2015. The reduction in corn volume in the quarter continued
to reflect the scenario of weak demand for exports in Paraná. Rumo sought alternatives to mitigate the decrease in agricultural volume, such as additional volumes of soybean meal and fertilizers in the period. In addition, the consolidation of our long-term relationship with sugar clients, led to higher volumes in 4Q16, partially offsetting the decrease in grain volume. Transportation of industrial products in 4Q16 was 949 million RTK, up 8.3%, mainly due to the investments made. Total volume transported in the year was 3.7 billion RTK. Pulp volume grew 28.3% in 4Q16, due to
the supply made to Klabin’s new plant in Ortigueira, Paraná. Fuel volume remained stable when compared to 4Q15, while the decrease in 2016 was 8.4%, mainly due to operating issues in the beginning of the year.
4Q16 Pro forma
4Q15 Chg. % Operational Figures 2016
Pro forma 2015
Combined Chg. %
2,630 3,408 -22.8% Transported Volume (millions RTK) 12,038 14,072 -14.5%
1,681 2,531 -33.6% Agricultural Products 8,372 10,069 -16.9%
214 197 9.1% Soybean 3,497 3,678 -4.9%
116 68 70.6% Soybean meal 426 604 -29.5%
181 1,144 -84.2% Corn 936 2,120 -55.9%
865 733 18.0% Sugar 2,619 2,310 13.4%
272 140 94.9% Fertilizers 804 750 7.1%
33 206 -84.1% Wheat 88 409 -78.5%
- 44 n.a. Rice 3 199 -98.5%
949 876 8.3% Industrial Products 3,666 4,002 -8.4%
489 489 0.1% Fuels 2,007 2,190 -8.4%
238 185 28.3% Wood, Pulp and Paper 816 770 6.0%
180 151 19.6% Construction 674 684 -1.4%
41 16 n.a. Steel and Mining 165 157 5.1%
1 36 -96.9% Others 3 201 -98.6%
82.1 73.5 11.7% Average Transportation Yield (R$/000 RTK) 86.3 79.4 8.7%
9 of 21
Earnings Release 4Q16 and 2016
4Q16 Pro forma
4Q15 Chg. % % Financial Results 2016
Pro forma 2015
Combined Chg. %
(Amounts in R$ MM)
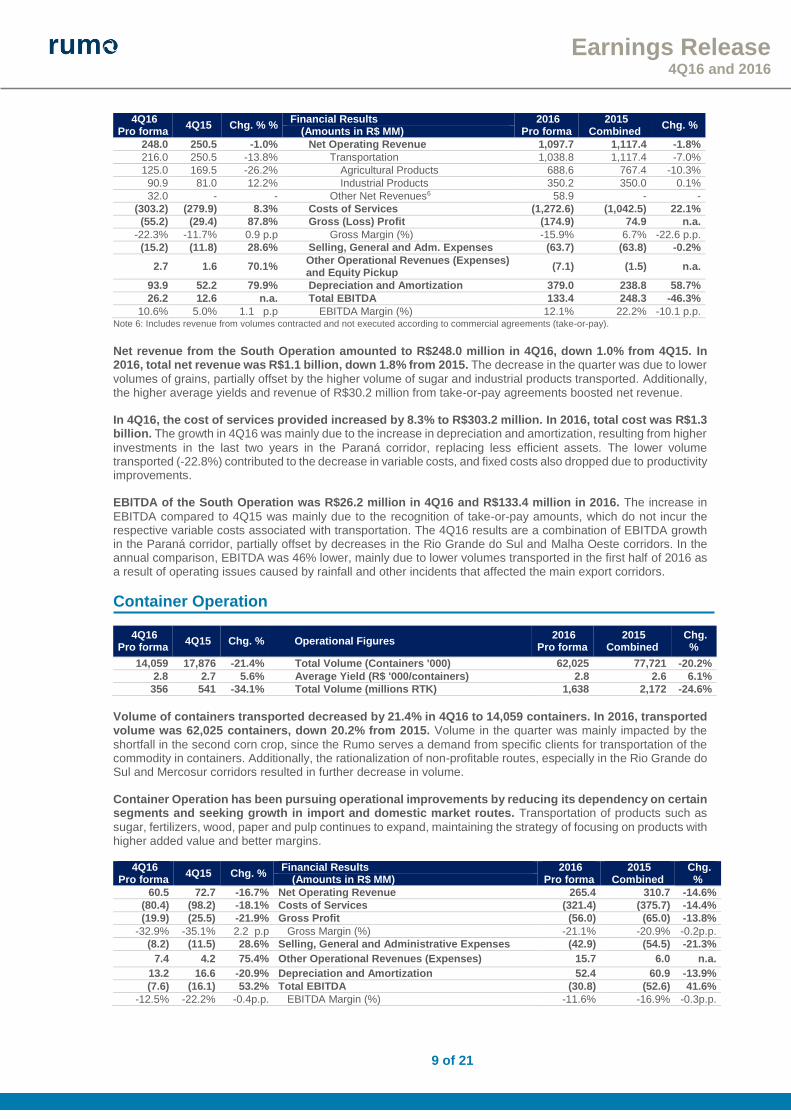
248.0 250.5 -1.0% Net Operating Revenue 1,097.7 1,117.4 -1.8%
216.0 250.5 -13.8% Transportation 1,038.8 1,117.4 -7.0%
125.0 169.5 -26.2% Agricultural Products 688.6 767.4 -10.3%
90.9 81.0 12.2% Industrial Products 350.2 350.0 0.1%
32.0 - - Other Net Revenues6 58.9 - -
(303.2) (279.9) 8.3% Costs of Services (1,272.6) (1,042.5) 22.1%
(55.2) (29.4) 87.8% Gross (Loss) Profit (174.9) 74.9 n.a.
-22.3% -11.7% 0.9 p.p Gross Margin (%) -15.9% 6.7% -22.6 p.p.
(15.2) (11.8) 28.6% Selling, General and Adm. Expenses (63.7) (63.8) -0.2%
2.7 1.6 70.1% Other Operational Revenues (Expenses) and Equity Pickup
(7.1) (1.5) n.a.
93.9 52.2 79.9% Depreciation and Amortization 379.0 238.8 58.7%
26.2 12.6 n.a. Total EBITDA 133.4 248.3 -46.3%
10.6% 5.0% 1.1 p.p EBITDA Margin (%) 12.1% 22.2% -10.1 p.p. Note 6: Includes revenue from volumes contracted and not executed according to commercial agreements (take-or-pay).
Net revenue from the South Operation amounted to R$248.0 million in 4Q16, down 1.0% from 4Q15. In 2016, total net revenue was R$1.1 billion, down 1.8% from 2015. The decrease in the quarter was due to lower
volumes of grains, partially offset by the higher volume of sugar and industrial products transported. Additionally, the higher average yields and revenue of R$30.2 million from take-or-pay agreements boosted net revenue. In 4Q16, the cost of services provided increased by 8.3% to R$303.2 million. In 2016, total cost was R$1.3 billion. The growth in 4Q16 was mainly due to the increase in depreciation and amortization, resulting from higher
investments in the last two years in the Paraná corridor, replacing less efficient assets. The lower volume transported (-22.8%) contributed to the decrease in variable costs, and fixed costs also dropped due to productivity improvements. EBITDA of the South Operation was R$26.2 million in 4Q16 and R$133.4 million in 2016. The increase in
EBITDA compared to 4Q15 was mainly due to the recognition of take-or-pay amounts, which do not incur the respective variable costs associated with transportation. The 4Q16 results are a combination of EBITDA growth in the Paraná corridor, partially offset by decreases in the Rio Grande do Sul and Malha Oeste corridors. In the annual comparison, EBITDA was 46% lower, mainly due to lower volumes transported in the first half of 2016 as a result of operating issues caused by rainfall and other incidents that affected the main export corridors.
Container Operation
4Q16 Pro forma
4Q15 Chg. % Operational Figures 2016
Pro forma 2015
Combined Chg.
%
14,059 17,876 -21.4% Total Volume (Containers '000) 62,025 77,721 -20.2%
2.8 2.7 5.6% Average Yield (R$ '000/containers) 2.8 2.6 6.1%
356 541 -34.1% Total Volume (millions RTK) 1,638 2,172 -24.6%
Volume of containers transported decreased by 21.4% in 4Q16 to 14,059 containers. In 2016, transported volume was 62,025 containers, down 20.2% from 2015. Volume in the quarter was mainly impacted by the
shortfall in the second corn crop, since the Rumo serves a demand from specific clients for transportation of the commodity in containers. Additionally, the rationalization of non-profitable routes, especially in the Rio Grande do Sul and Mercosur corridors resulted in further decrease in volume. Container Operation has been pursuing operational improvements by reducing its dependency on certain segments and seeking growth in import and domestic market routes. Transportation of products such as
sugar, fertilizers, wood, paper and pulp continues to expand, maintaining the strategy of focusing on products with higher added value and better margins.
4Q16 Pro forma
4Q15 Chg. % Financial Results 2016
Pro forma 2015
Combined Chg.
% (Amounts in R$ MM)
60.5 72.7 -16.7% Net Operating Revenue 265.4 310.7 -14.6%
(80.4) (98.2) -18.1% Costs of Services (321.4) (375.7) -14.4%
(19.9) (25.5) -21.9% Gross Profit (56.0) (65.0) -13.8%
-32.9% -35.1% 2.2 p.p Gross Margin (%) -21.1% -20.9% -0.2p.p.
(8.2) (11.5) 28.6% Selling, General and Administrative Expenses (42.9) (54.5) -21.3%
7.4 4.2 75.4% Other Operational Revenues (Expenses) 15.7 6.0 n.a.
13.2 16.6 -20.9% Depreciation and Amortization 52.4 60.9 -13.9%
(7.6) (16.1) 53.2% Total EBITDA (30.8) (52.6) 41.6%
-12.5% -22.2% -0.4p.p. EBITDA Margin (%) -11.6% -16.9% -0.3p.p.

10 of 21
Earnings Release 4Q16 and 2016
Note 7: Includes revenue from service units and revenue from volumes contracted and not executed according to commercial agreements (take-or-pay).
In the quarter, net revenue fell by 16.7% to R$60.5 million. In the year, total net revenue was R$265.4 million, down 15% from 2015. The lower volume of containers handled (-21.4%) in the quarter was partially
offset by the increase in average yield (+5.6%) in the period, reflecting the strategy of prioritizing more profitable routes. The cost of services provided totaled R$80.4 million in 4Q16, down 18.1% in the period. In 2016, cost amounted to R$321.4 million. The cost decrease in 4Q16 reflects the 21.4% decrease in containers handled. EBITDA from the Container Operation was a loss of R$7.6 million in 4Q16 and a loss of R$30.8 million in the year. Despite the negative result, the 53% increase in EBITDA from 4Q15 was mainly due to the rationalization
of non-profitable routes and to cost reduction.
4. Other Result Items
Breakdown of Costs of Services Provided
4Q16 Pro forma
4Q15 Chg. % Consolidated Costs 2016
Pro forma 2015
Combined Chg. %
(Amounts in R$MM) (878.5) (938.1) -6.3% Consolidated Costs (3,769.1) (3,398.0) 10.9%
(226.3) (400.1) -43.4% Variable costs (1,207.4) (1,330.7) -9.3%
(134.8) (211.9) -36.4% Fuel (686.0) (751.7) -8.7%
(32.4) (69.3) -53.3% Own Logistic costs8 (156.1) (221.6) -29.6%
(59.1) (118.8) -50.2% Third Paties freight costs9 (365.3) (357.4) 2.2%
(652.2) (538.0) 21.2% Fixed Costs (2,561.7) (2,067.3) 23.9%
(298.0) (213.3) 39.7% Depreciation and Amortization (1,113.5) (821.2) 35.6%
(60.2) (67.3) -10.6% Maintenence (224.1) (181.2) 23.7%
(118.7) (114.7) 3.5% Payroll Expenses (493.3) (473.5) 4.2%
(49.6) (52.1) -4.8% Leasings and Concessions (201.6) (193.1) 4.4%
(12.7) (13.6) -7.1% Operational Leasings (63.8) (53.9) 18.4%
(51.0) (29.0) 75.6% Third Paties Services (217.0) (94.1) n.a.
(62.1) (48.0) 29.5% Other Operational Costs (248.6) (250.3) -0.7% Note 8: Own logistics costs include sand, trackage, terminals and other variable costs Note 9: Third-party freight costs include contracts for road and rail freight with other operators
Variable costs totaled R$226.3 million, down 41.6% from 4Q15. In the year, variable costs reached R$1.2 billion. Fuel expenses fell 36.4% in the quarter, due to the 38.5% decrease in transported volume and the
efficiency of the new locomotives acquired. These effects were partially offset by the higher share of sugar volumes in the North Operation, which incurs in higher unitary diesel consumption. During the quarter, own logistics costs, which represent transshipment costs in terminals and other activities, also decreased. Moreover, since Rumo transported a higher volume of sugar using its own fleet, expenses with transportation through other railroads or road freight were reduced. Fixed costs totaled R$652.2 million in 4Q16, up 21.2% from 4Q15, mainly due to higher depreciation and amortization. In the year, fixed costs totaled R$2.6 billion. In the quarter, depreciation and amortization
increased 39.7% due to higher investments in the last two years, replacing less efficient assets, in accordance with the Business Plan. In addition, there was an increase in expenses with outsourced and consulting services, due to a few projects to improve operating efficiency. Furthermore, personnel costs increased due to the collective bargaining agreement (8.0% on average) and were partially offset by the process of optimizing structures. Excluding depreciation and amortization, fixed costs increased 5.1%.
Financial Result
4Q16 Pro forma
4Q15 Chg. % Financial Result 2016
Pro forma 2015
Combined Chg. %
(Amounts in R$MM) (257.0) (241.2) 6.5% Cost of Gross Bank Debt (1,026.7) (934.7) 9.8%
44.3 25.5 73.3% Financial Invest Income 198.5 137.7 44.1%
(212.7) (215.7) -1.4% (=) Sub-total: Cost of Net Bank Debt (828.2) (797.0) 3.9%
(74.4) (64.1) 16.1% Monetary variation on Liabilities of Concessions (296.1) (230.3) 28.6%
(49.6) (51.8) -4.2% Charges on Leasings (207.7) (183.1) 13.4%
(8.4) (28.4) -70.6% Charges on Certificates of Real Estate Receivables (39.7) (52.5) -24.5%
(70.7) (68.2) 3.6% Other Variations (301.8) (238.0) 26.8%
(415.8) (428.2) -2.9% (=) Net Financial (1,673.5) (1,501.0) 11.5%
11 of 21
Earnings Release 4Q16 and 2016
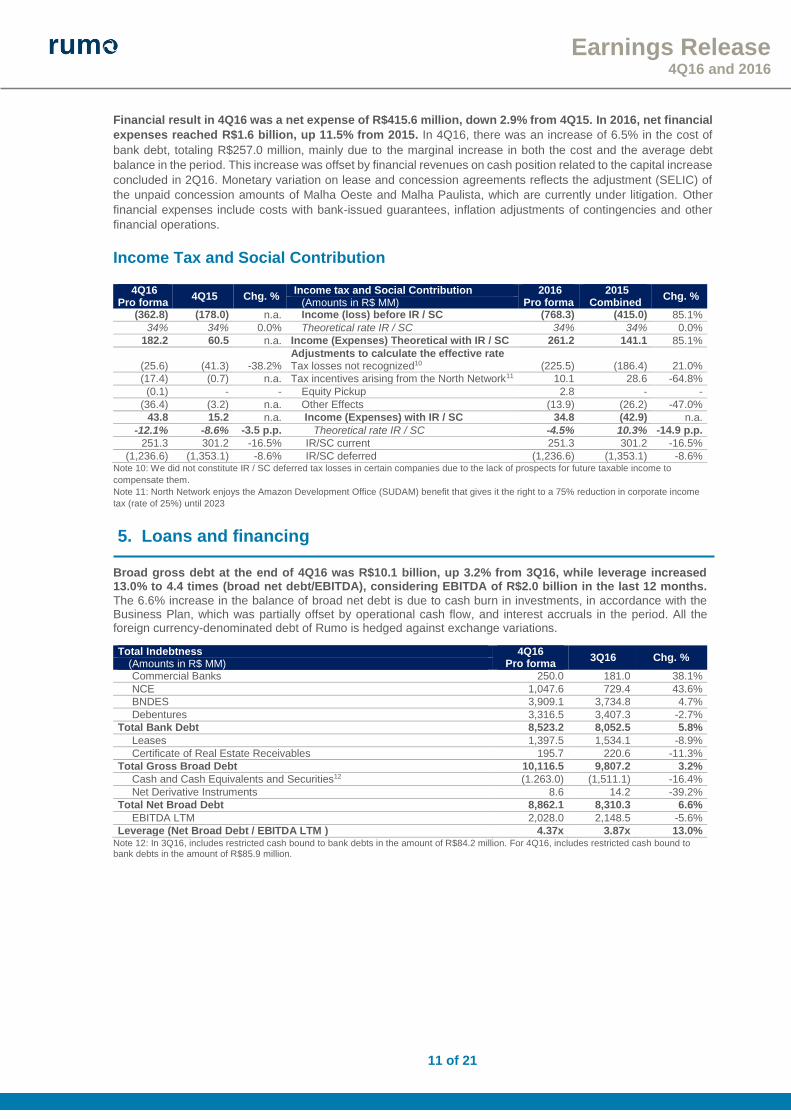
Financial result in 4Q16 was a net expense of R$415.6 million, down 2.9% from 4Q15. In 2016, net financial
expenses reached R$1.6 billion, up 11.5% from 2015. In 4Q16, there was an increase of 6.5% in the cost of
bank debt, totaling R$257.0 million, mainly due to the marginal increase in both the cost and the average debt
balance in the period. This increase was offset by financial revenues on cash position related to the capital increase
concluded in 2Q16. Monetary variation on lease and concession agreements reflects the adjustment (SELIC) of
the unpaid concession amounts of Malha Oeste and Malha Paulista, which are currently under litigation. Other
financial expenses include costs with bank-issued guarantees, inflation adjustments of contingencies and other
financial operations.
Income Tax and Social Contribution
4Q16 Pro forma
4Q15 Chg. % Income tax and Social Contribution 2016
Pro forma 2015
Combined Chg. %
(Amounts in R$ MM) (362.8) (178.0) n.a. Income (loss) before IR / SC (768.3) (415.0) 85.1%
34% 34% 0.0% Theoretical rate IR / SC 34% 34% 0.0%
182.2 60.5 n.a. Income (Expenses) Theoretical with IR / SC 261.2 141.1 85.1% Adjustments to calculate the effective rate
(25.6) (41.3) -38.2% Tax losses not recognized10 (225.5) (186.4) 21.0%
(17.4) (0.7) n.a. Tax incentives arising from the North Network11 10.1 28.6 -64.8%
(0.1) - - Equity Pickup 2.8 - -
(36.4) (3.2) n.a. Other Effects (13.9) (26.2) -47.0%
43.8 15.2 n.a. Income (Expenses) with IR / SC 34.8 (42.9) n.a.
-12.1% -8.6% -3.5 p.p. Theoretical rate IR / SC -4.5% 10.3% -14.9 p.p.
251.3 301.2 -16.5% IR/SC current 251.3 301.2 -16.5%
(1,236.6) (1,353.1) -8.6% IR/SC deferred (1,236.6) (1,353.1) -8.6% Note 10: We did not constitute IR / SC deferred tax losses in certain companies due to the lack of prospects for future taxable income to
compensate them.
Note 11: North Network enjoys the Amazon Development Office (SUDAM) benefit that gives it the right to a 75% reduction in corporate income
tax (rate of 25%) until 2023
5. Loans and financing
Broad gross debt at the end of 4Q16 was R$10.1 billion, up 3.2% from 3Q16, while leverage increased 13.0% to 4.4 times (broad net debt/EBITDA), considering EBITDA of R$2.0 billion in the last 12 months.
The 6.6% increase in the balance of broad net debt is due to cash burn in investments, in accordance with the Business Plan, which was partially offset by operational cash flow, and interest accruals in the period. All the foreign currency-denominated debt of Rumo is hedged against exchange variations.
Total Indebtness 4Q16 Pro forma
3Q16 Chg. % (Amounts in R$ MM) Commercial Banks 250.0 181.0 38.1%
NCE 1,047.6 729.4 43.6%
BNDES 3,909.1 3,734.8 4.7%
Debentures 3,316.5 3,407.3 -2.7%
Total Bank Debt 8,523.2 8,052.5 5.8%
Leases 1,397.5 1,534.1 -8.9%
Certificate of Real Estate Receivables 195.7 220.6 -11.3%
Total Gross Broad Debt 10,116.5 9,807.2 3.2%
Cash and Cash Equivalents and Securities12 (1.263.0) (1,511.1) -16.4%
Net Derivative Instruments 8.6 14.2 -39.2%
Total Net Broad Debt 8,862.1 8,310.3 6.6%
EBITDA LTM 2,028.0 2,148.5 -5.6%
Leverage (Net Broad Debt / EBITDA LTM ) 4.37x 3.87x 13.0% Note 12: In 3Q16, includes restricted cash bound to bank debts in the amount of R$84.2 million. For 4Q16, includes restricted cash bound to bank debts in the amount of R$85.9 million.
12 of 21
Earnings Release 4Q16 and 2016
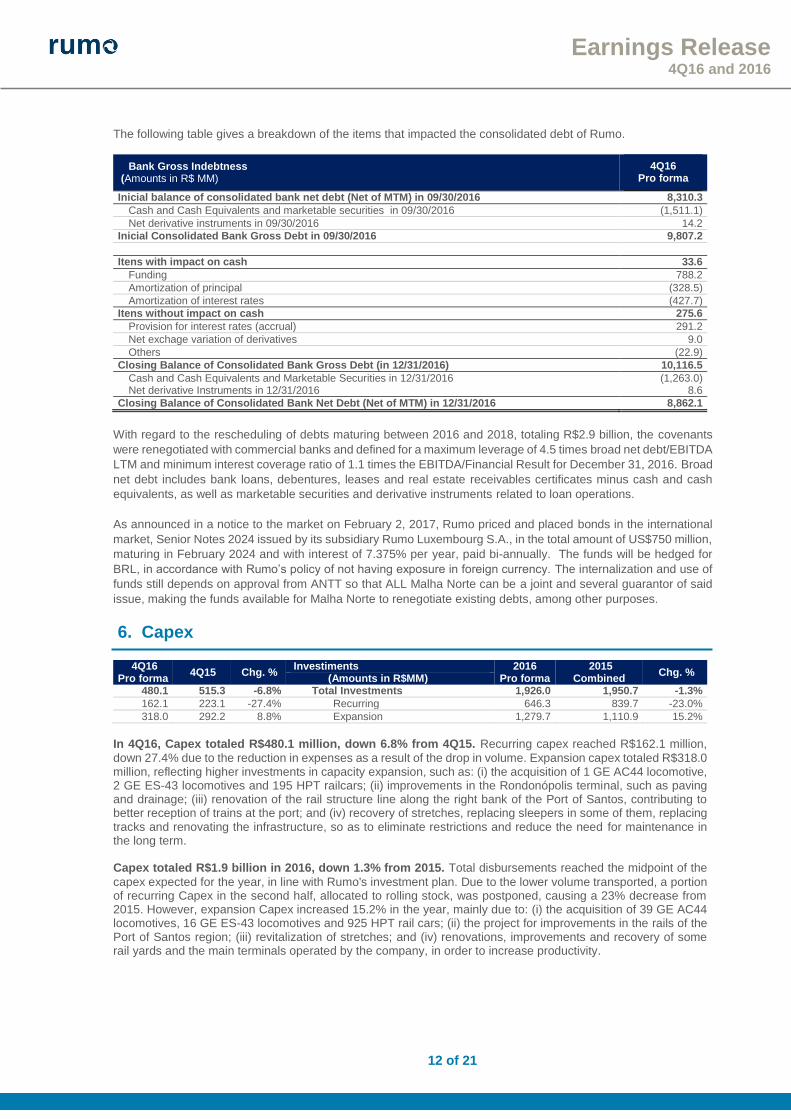
The following table gives a breakdown of the items that impacted the consolidated debt of Rumo.
Bank Gross Indebtness (Amounts in R$ MM)
4Q16 Pro forma
Inicial balance of consolidated bank net debt (Net of MTM) in 09/30/2016 8,310.3
Cash and Cash Equivalents and marketable securities in 09/30/2016 (1,511.1)
Net derivative instruments in 09/30/2016 14.2
Inicial Consolidated Bank Gross Debt in 09/30/2016 9,807.2
Itens with impact on cash 33.6
Funding 788.2
Amortization of principal (328.5)
Amortization of interest rates (427.7)
Itens without impact on cash 275.6
Provision for interest rates (accrual) 291.2
Net exchage variation of derivatives 9.0
Others (22.9)
Closing Balance of Consolidated Bank Gross Debt (in 12/31/2016) 10,116.5
Cash and Cash Equivalents and Marketable Securities in 12/31/2016 (1,263.0) Net derivative Instruments in 12/31/2016 8.6
Closing Balance of Consolidated Bank Net Debt (Net of MTM) in 12/31/2016 8,862.1
With regard to the rescheduling of debts maturing between 2016 and 2018, totaling R$2.9 billion, the covenants
were renegotiated with commercial banks and defined for a maximum leverage of 4.5 times broad net debt/EBITDA
LTM and minimum interest coverage ratio of 1.1 times the EBITDA/Financial Result for December 31, 2016. Broad
net debt includes bank loans, debentures, leases and real estate receivables certificates minus cash and cash
equivalents, as well as marketable securities and derivative instruments related to loan operations.
As announced in a notice to the market on February 2, 2017, Rumo priced and placed bonds in the international
market, Senior Notes 2024 issued by its subsidiary Rumo Luxembourg S.A., in the total amount of US$750 million,
maturing in February 2024 and with interest of 7.375% per year, paid bi-annually. The funds will be hedged for
BRL, in accordance with Rumo’s policy of not having exposure in foreign currency. The internalization and use of
funds still depends on approval from ANTT so that ALL Malha Norte can be a joint and several guarantor of said
issue, making the funds available for Malha Norte to renegotiate existing debts, among other purposes.
6. Capex
4Q16 Pro forma
4Q15 Chg. % Investiments 2016
Pro forma 2015
Combined Chg. %
(Amounts in R$MM) 480.1 515.3 -6.8% Total Investments 1,926.0 1,950.7 -1.3%
162.1 223.1 -27.4% Recurring 646.3 839.7 -23.0%
318.0 292.2 8.8% Expansion 1,279.7 1,110.9 15.2%
In 4Q16, Capex totaled R$480.1 million, down 6.8% from 4Q15. Recurring capex reached R$162.1 million,
down 27.4% due to the reduction in expenses as a result of the drop in volume. Expansion capex totaled R$318.0 million, reflecting higher investments in capacity expansion, such as: (i) the acquisition of 1 GE AC44 locomotive, 2 GE ES-43 locomotives and 195 HPT railcars; (ii) improvements in the Rondonópolis terminal, such as paving and drainage; (iii) renovation of the rail structure line along the right bank of the Port of Santos, contributing to better reception of trains at the port; and (iv) recovery of stretches, replacing sleepers in some of them, replacing tracks and renovating the infrastructure, so as to eliminate restrictions and reduce the need for maintenance in the long term. Capex totaled R$1.9 billion in 2016, down 1.3% from 2015. Total disbursements reached the midpoint of the
capex expected for the year, in line with Rumo's investment plan. Due to the lower volume transported, a portion of recurring Capex in the second half, allocated to rolling stock, was postponed, causing a 23% decrease from 2015. However, expansion Capex increased 15.2% in the year, mainly due to: (i) the acquisition of 39 GE AC44 locomotives, 16 GE ES-43 locomotives and 925 HPT rail cars; (ii) the project for improvements in the rails of the Port of Santos region; (iii) revitalization of stretches; and (iv) renovations, improvements and recovery of some rail yards and the main terminals operated by the company, in order to increase productivity.
13 of 21
Earnings Release 4Q16 and 2016
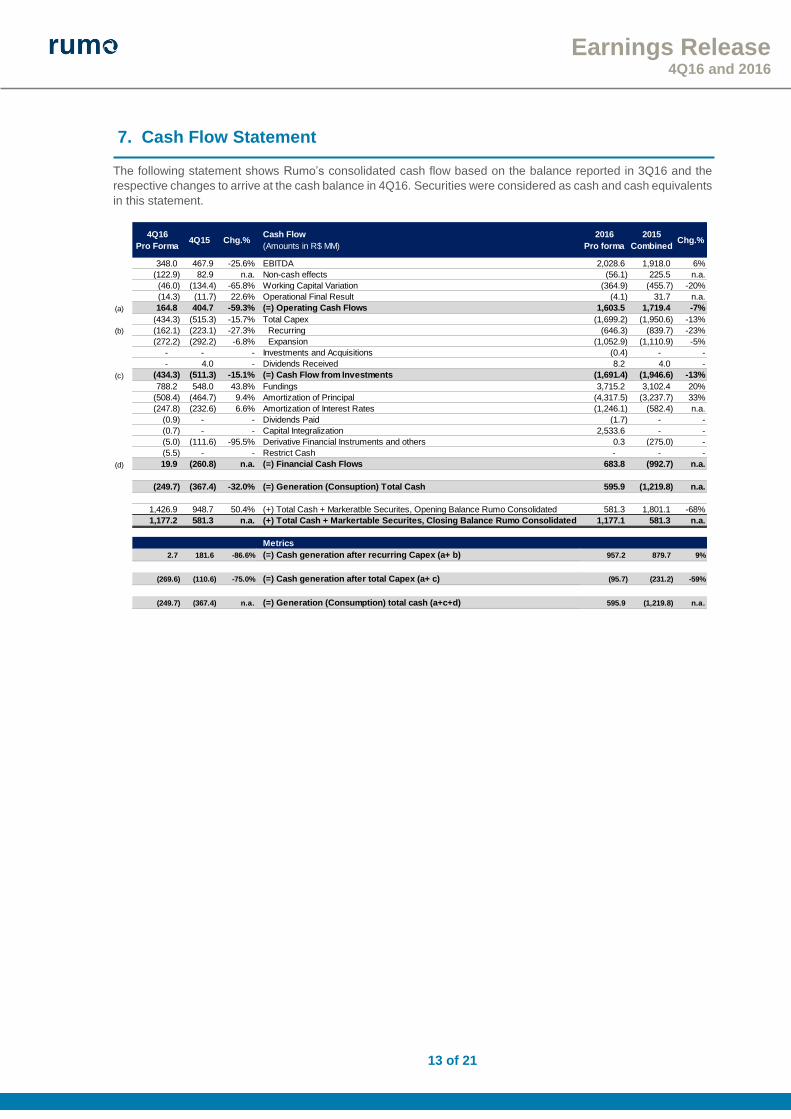
7. Cash Flow Statement The following statement shows Rumo’s consolidated cash flow based on the balance reported in 3Q16 and the
respective changes to arrive at the cash balance in 4Q16. Securities were considered as cash and cash equivalents
in this statement.
4Q16
Pro Forma4Q15 Chg.%
Cash Flow
(Amounts in R$ MM)
2016
Pro forma
2015
CombinedChg.%
348.0 467.9 -25.6% EBITDA 2,028.6 1,918.0 6%
(122.9) 82.9 n.a. Non-cash effects (56.1) 225.5 n.a.
(46.0) (134.4) -65.8% Working Capital Variation (364.9) (455.7) -20%
(14.3) (11.7) 22.6% Operational Final Result (4.1) 31.7 n.a.
(a) 164.8 404.7 -59.3% (=) Operating Cash Flows 1,603.5 1,719.4 -7%
(434.3) (515.3) -15.7% Total Capex (1,699.2) (1,950.6) -13%
(b) (162.1) (223.1) -27.3% Recurring (646.3) (839.7) -23%
(272.2) (292.2) -6.8% Expansion (1,052.9) (1,110.9) -5%
- - - Investments and Acquisitions (0.4) - -
- 4.0 - Dividends Received 8.2 4.0 -
(c) (434.3) (511.3) -15.1% (=) Cash Flow from Investments (1,691.4) (1,946.6) -13%
788.2 548.0 43.8% Fundings 3,715.2 3,102.4 20%
(508.4) (464.7) 9.4% Amortization of Principal (4,317.5) (3,237.7) 33%
(247.8) (232.6) 6.6% Amortization of Interest Rates (1,246.1) (582.4) n.a.
(0.9) - - Dividends Paid (1.7) - -
(0.7) - - Capital Integralization 2,533.6 - -
(5.0) (111.6) -95.5% Derivative Financial Instruments and others 0.3 (275.0) -
(5.5) - - Restrict Cash - - -
(d) 19.9 (260.8) n.a. (=) Financial Cash Flows 683.8 (992.7) n.a.
(249.7) (367.4) -32.0% (=) Generation (Consuption) Total Cash 595.9 (1,219.8) n.a.
1,426.9 948.7 50.4% (+) Total Cash + Markeratble Securites, Opening Balance Rumo Consolidated 581.3 1,801.1 -68%
1,177.2 581.3 n.a. (+) Total Cash + Markertable Securites, Closing Balance Rumo Consolidated 1,177.1 581.3 n.a.
Metrics
2.7 181.6 -86.6% (=) Cash generation after recurring Capex (a+ b) 957.2 879.7 9%
(269.6) (110.6) -75.0% (=) Cash generation after total Capex (a+ c) (95.7) (231.2) -59%
(249.7) (367.4) n.a. (=) Generation (Consumption) total cash (a+c+d) 595.9 (1,219.8) n.a.
14 of 21
Earnings Release 4Q16 and 2016
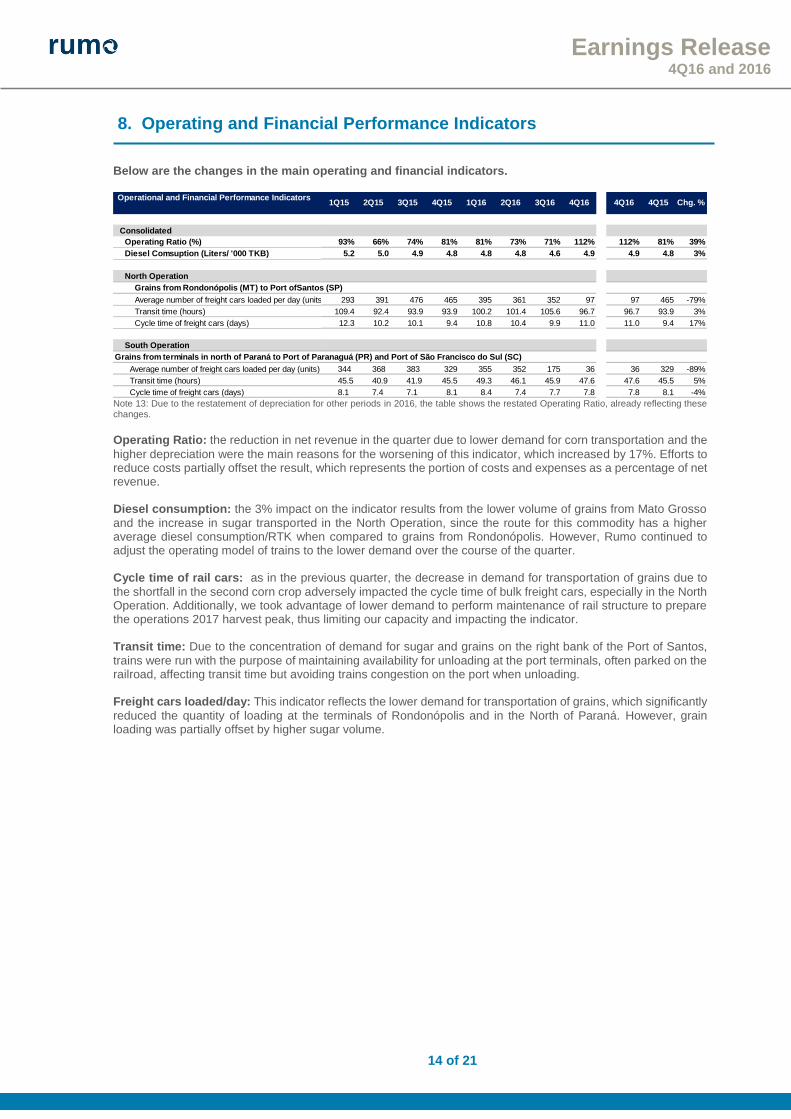
8. Operating and Financial Performance Indicators
Below are the changes in the main operating and financial indicators.
Note 13: Due to the restatement of depreciation for other periods in 2016, the table shows the restated Operating Ratio, already reflecting these changes.
Operating Ratio: the reduction in net revenue in the quarter due to lower demand for corn transportation and the
higher depreciation were the main reasons for the worsening of this indicator, which increased by 17%. Efforts to reduce costs partially offset the result, which represents the portion of costs and expenses as a percentage of net revenue. Diesel consumption: the 3% impact on the indicator results from the lower volume of grains from Mato Grosso
and the increase in sugar transported in the North Operation, since the route for this commodity has a higher average diesel consumption/RTK when compared to grains from Rondonópolis. However, Rumo continued to adjust the operating model of trains to the lower demand over the course of the quarter. Cycle time of rail cars: as in the previous quarter, the decrease in demand for transportation of grains due to
the shortfall in the second corn crop adversely impacted the cycle time of bulk freight cars, especially in the North Operation. Additionally, we took advantage of lower demand to perform maintenance of rail structure to prepare the operations 2017 harvest peak, thus limiting our capacity and impacting the indicator. Transit time: Due to the concentration of demand for sugar and grains on the right bank of the Port of Santos,
trains were run with the purpose of maintaining availability for unloading at the port terminals, often parked on the railroad, affecting transit time but avoiding trains congestion on the port when unloading. Freight cars loaded/day: This indicator reflects the lower demand for transportation of grains, which significantly
reduced the quantity of loading at the terminals of Rondonópolis and in the North of Paraná. However, grain loading was partially offset by higher sugar volume.
Operational and Financial Performance Indicators
Consolidated
Operating Ratio (%) 93% 66% 74% 81% 81% 73% 71% 112% 112% 81% 39%
Diesel Comsuption (Liters/ '000 TKB) 5.2 5.0 4.9 4.8 4.8 4.8 4.6 4.9 4.9 4.8 3%
North Operation
Grains from Rondonópolis (MT) to Port ofSantos (SP)
Average number of freight cars loaded per day (units) 293 391 476 465 395 361 352 97 97 465 -79%
Transit time (hours) 109.4 92.4 93.9 93.9 100.2 101.4 105.6 96.7 96.7 93.9 3%
Cycle time of freight cars (days) 12.3 10.2 10.1 9.4 10.8 10.4 9.9 11.0 11.0 9.4 17%
South Operation
Grains from terminals in north of Paraná to Port of Paranaguá (PR) and Port of São Francisco do Sul (SC)
Average number of freight cars loaded per day (units) 344 368 383 329 355 352 175 36 36 329 -89%
Transit time (hours) 45.5 40.9 41.9 45.5 49.3 46.1 45.9 47.6 47.6 45.5 5%
Cycle time of freight cars (days) 8.1 7.4 7.1 8.1 8.4 7.4 7.7 7.8 7.8 8.1 -4%
1Q16 2Q161Q15 2Q15 3Q15 4Q15 3Q16 4Q16 4Q16 4Q15 Chg. %

15 of 21
Earnings Release 4Q16 and 2016
9. Guidance
This section contains the guidance ranges of some of the key parameters that influence the consolidated results
of Rumo in 2017, as well as a comparison with the 2016 guidance. Note that other sections of this Earnings Release
also may contain projections. Such projections and guidance are mere estimates and indications, and should not
be taken as a guarantee of future results.
Short Term
2016 Achieved
2016 Updated Guidance
2017 Guidance
Rumo
EBITDA (R$ MM) 2,028 2,000 ≤ ∆ ≤ 2,200 2,600 ≤ ∆ ≤ 2,800
Total Capex (R$ MM) 1,926 1,800 ≤ ∆ ≤ 2,000 2,000 ≤ ∆ ≤ 2,200
Recurring Capex (R$ MM) 646 650 ≤ ∆ ≤ 750 700 ≤ ∆ ≤ 800
Expansion Capex (R$ MM) 1,280 1,150 ≤ ∆ ≤ 1,250 1,300 ≤ ∆ ≤ 1,400
Long Term14
Note 14: EBITDA and CAPEX curves above mentioned are expressed in nominal terms and have as a reference the IGP-M index with the following figures: 2017 – 5.6% p.y., 2018 – 5.1% p.y., 2019 – 4.4% p.y. and 2020 – 4.2% p.y.. Any deviations from these figures do not represent major impact in the company’s result.
Disclaimer
This document contains forward-looking statements and information. These forward-looking statements and information are
solely forecasts and are not guarantees of future performance. All stakeholders are advised that these forward-looking statements
and information are and will be, as applicable, subject to risks, uncertainties and factors related to the operations and business
environment of Cosan and its subsidiaries, and hence actual results of these companies could differ significantly from the future
results expressed or implied by said forward-looking statements and information.

16 of 21
Earnings Release 4Q16 and 2016
10. Attachments 10.1 Financial Instruments - Rumo 10.1.1 Balance Sheet Balance Sheet Rumo
(Amounts in R$ MM) 12.31.2016 Pro forma
12.31.2015 Combined
Current 2,300.8 1,308.3
Cash and Cash Equivalents 260.5 73.0
Securities 916.6 508.3
Trade Receivables 417.2 144.5
Derivative Financial Instruments 2.9 -
Inventories 284.6 225.8
Peer Company Receivables 28.8 33.6
Income Tax and Social Contribution 166.0 32.7
Other Taxes Recoverable 84.0 175.5
Other Assets 140.2 115.0
Non-Current 20,730.6 20,254.3
Trade Receivable 14.3 21.1
Restrict Cash 201.0 200.9
Deferred Income Tax and Social Contribution 1,161.0 1,361.2
Income Tax and Social Contribution 121.4 274.6
Other taxes recoverable 660.8 591.0
Judicial Deposits 299.9 267.0
Derivative and Financial Instruments 0.8 99.9
Other Assets 106.2 127.9
Investments in Associates 46.8 44.2
Property and Equipment 10,337.1 9,404.1
Intangible 7,781.3 7,862.4
Total Assets 23,031.3 21,562.7
Current
3,393.3 3,480.8
Loans, Financing and Debentures 1,467.7 1,444.1
Leases 472.6 539.6
Certified Real Estate Receivables - CRI 105.4 88.1
Derivative Financial Instruments 4.5 0.5
Trade Accounts Payable 564.9 419.1
Labor and Social Security Obligations 117.1 149.9
Income Tax and Social Contribution Taxes 36.0 6.1
Other Payable Taxes 32.8 33.0
Dividends Payables 6.7 8.3
Leases and Concessions 27.7 20.2
Payable to Related Patties 106.7 103.8
Deferred Revenue 14.2 107.3
Other Financial Liabilities 177.6 236.7
Other Payables 259.4 324.1
Non - Current 13,962.7 14,237.7
Loans, Financing and Debentures 7,055.5 7,141.1
Leases 924.9 1,202.1
Certified Real Estate Receivables - CRI 90.3 196.9
Derivative Financial Instruments 7.8 1.3
Other Payables 17.1 26.1
Provision for lawsuits 507.0 490.6
Leases and Concessions 2,580.1 2,204.0
Deferred Income Tax and Social Contribution 2,397.5 2,714.4
Deferred Revenues 62.2 95.7
Other Payables 320.3 165.5
Equity 5,675.3 3,844.2
Total Liabilities 23,031.3 21,562.7

17 of 21
Earnings Release 4Q16 and 2016
10.1.2 Income Statement
4Q16 Pro forma
4Q15 Chg. % Consolidated 2016
Pro forma 2015
Combined Chg. %
(Amounts in R$ MM) 1,014.6 1,254.3 -19.1% Net Operating Revenue 5,014.6 4,802.5 4.4%
(878.5) (938.1) -6.4% Cost of Services (3,769.1) (3,398.0) 10.9%
136.1 316.2 -57.0% Gross Profit 1,245.4 1,404.5 -11.3%
(85.4) (82.6) 3.5% Sales, General and Administrative Expenses (344.4) (360.7) -4.5%
2.5 9.7 -74.4% Other Net Operating Income (Expenses) (0.9) 31.1 n.a.
(415.6) (428.2) -2.9% Net Financial Result (1,676.8) (1,501.0) 11.7%
(0.4) 6.9 n.a. Equity Pickup 8.4 11.1 -24.5%
43.8 15.2 n.a. Income Tax and Social Contribution 34.8 (42.9) n.a.
(319.0) (162.7) 96.1% Net Profit (Loss) (733.5) (457.9) 60.2%
10.1.3 Cash Flow
Combined Cash Flow Rumo
(Amounts in R$ MM) 4Q16
Pro forma 4Q15
2016 Pro forma
2015 Combined
Cash Flow from Operating Activities Profit Before Income Tax and Social Contribution (362.8) (184.2) (768.3) (133.5) Adjustments: Depreciation and Amortization 295.2 217.7 1,120.0 616.5 Amortization of Concessions - - - - Equity 0.4 (6.9) (8.4) (11.2)
Provision for profit sharing and bonuses 7.8 - 39.0 Result on disposals of fixed assets and intangible assets 2.7 0.1 9.2 3.5
Provision for lawsuits 1.3 56.5 19.5 16.4 Provision (reversal) for losses on doubtful accounts 0.9 (4.1) 1.4 (3.7) Stock Option 0.6 - 2.5 Leases and Concessions 45.2 - 193.6 Differed Revenues (2.6) - (16.2) Interests, Monetary and Exchange Variation, Net 401.3 422.8 1,672.7 1,190.7 Others (179.2) 37.3 (296.8) 179.3
294.9 539.2 2,052.4 1,858.0
Variation in: Accounts Receivable: 26.7 28.3 15.5 (11.4) Advances from Customers 109.1 84.0 49.1 70.3 Judicial deposits (15.9) (11.2) (28.8) (13.9) Related Patties, Net (11.8) 2.3 3.0 153.2 Variation in: 49.2 (28.9) 124.4 (28.2) Accounts Receivable: (22.0) (6.6) (97.0) (49.9) Advances from Customers 18.1 (44.5) (49.2) (125.6)
Labor and Social Security Obligations (29.6) (25.6) (70.2) (17.8)
Trade Accounts Payable (115.4) (74.3) (22.4) (219.7)
Advances to suppliers 7.3 13.3 4.6 (20.8)
Leases and Concessions Payable (27.0) - (107.7) -
Lawsuits 3.3 57.6 (54.1) 43.7 Other financial liabilities (9.1) - (50.7) 63.2 Other Liabilities, Net (29.0) (128.8) (81.8) (197.7)
(46.0) (134.4) (365.4) (354.6)
Cash generated by (used in) operations 248.9 404.8 1,687.0 1,503.4
Cash Flow from investing activities Net cash acquired on business acquisition (0.2) - (0.2) 169.7 Capital Increase in Subsidiary - - (0.2) - Marketable Securities 468.5 370.2 (407.7) 208.8 Restrict Cash (5.5) (107.7) (0.1) 22.8 Dividends received from subsidiaries and associates - 4 8.2 4.0
Additions to property, plant and equipment, software and other intangibles (434.3) (515.3) (1,699.2) (1,405.5)
Cash generated by (used in) investing activities 28.6 (248.8) (2,099.2) (1,000.2)
Cash flow from financing activities
Borrowings 788.2 548.1 3,715.2 3,086.0
Payment of borrowings (492.0) (365.3) (4,301.0) (2,418.9)
Payment of interest on Borrowings (231.0) (232.6) (1,133.6) (786.1)
Capital Internalization (0.7) - 2,533.6 -
Mortgages anticipation (33.2) (99.4) (128.9) (99.4)
Derivative Financial Instruments (5.0) (3.5) 0.3 4.3
Related Parties - Mutual - - - -
Dividends Payable (0.9) - (1.7) (301.5)
Cash generated by (used in) financing activities 25.4 (152.7) 683.9 (515.6)
Net increase (decrease) in cash and cash equivalents 302.9 3.3 271.7 (12.5)
Beginning balance of cash and cash equivalents 41.8 69.7 73.0 85.5
Final balance of cash and cash equivalents 260.5 73.0 260.5 73.0

18 of 21
Earnings Release 4Q16 and 2016
10.1.4 Cash Flow – Net Debt Reconciliation
4Q16
Pro forma Cash Flow (Amounts in R$ MM)
2016 Pro forma
8,310.3 Opening Balance of Broad Net Debt 9,855.3
8,862.1 Closing Balance of Broad Net Debt 8,862.1
(551.8) (=) Variation in net debt 993.2
277.2 Items without impact on cash 1,451.0
291.2 Provision for interest rates (accrual) 1,161.2
1.6 Funding of financial leasing 186.2
9.0 Monetary variation and MTM adjustment of debt 61.8
(24.6) Exchange variation, net of derivatives 41.8
(274.6) (=) Variation in cash net debt 2,444.2 Reconciliation generation /(consumption) of net cash debt
348.0 EBITDA 2,028.6
(122.9) Non-cash effects in EBITDA (56.1)
(46.0) Working capital variation (364.9)
(14.3) Operational Financial Result (4.1)
164.8 (=) Operational cash flow 1,603.4
(434.2) Total Capex (1,699.2)
(0.2) Others 7.8
(434.4) (=) Investiments cash flow (1,691.4)
(0.9) Dividends payed (1.7)
(0.7) Capital internalization 2,533.6
(3.3) Derivative instruments and others 0.3
(274.6) (=) Generation (Consumption) total of cash 2,444.2
19 of 21
Earnings Release 4Q16 and 2016
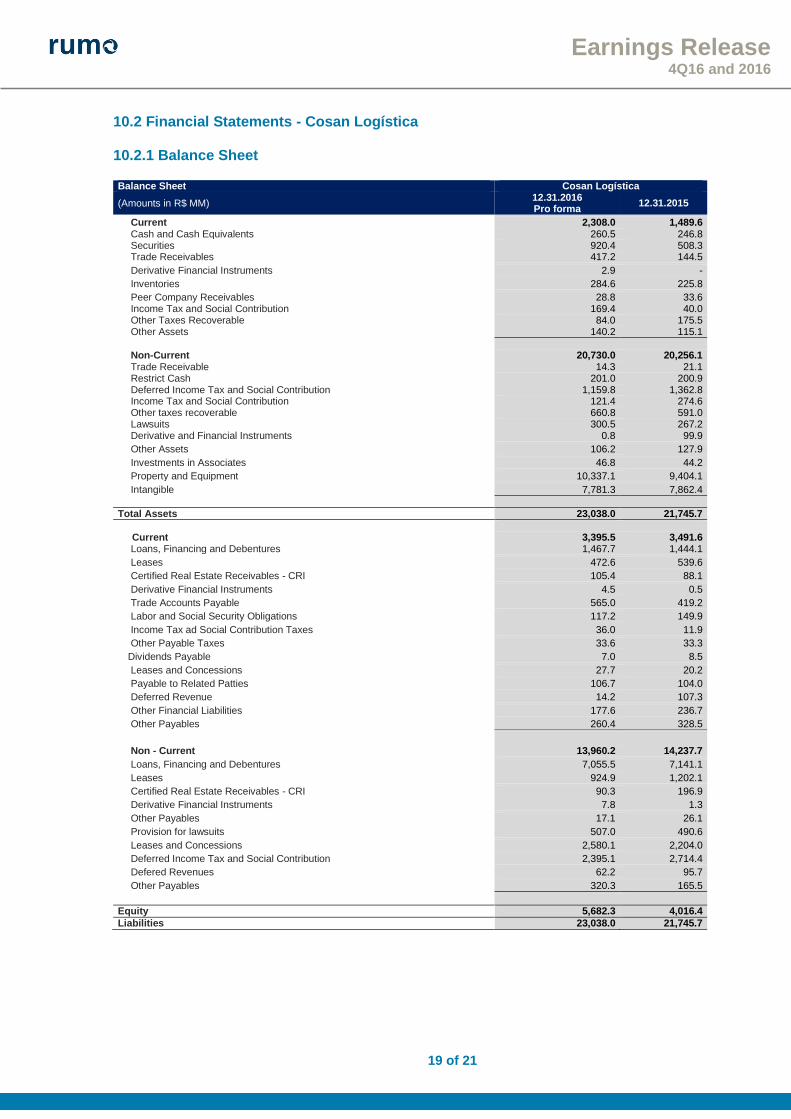
10.2 Financial Statements - Cosan Logística 10.2.1 Balance Sheet Balance Sheet Cosan Logística
(Amounts in R$ MM) 12.31.2016 Pro forma
12.31.2015
Current 2,308.0 1,489.6 Cash and Cash Equivalents 260.5 246.8 Securities 920.4 508.3 Trade Receivables 417.2 144.5
Derivative Financial Instruments 2.9 -
Inventories 284.6 225.8
Peer Company Receivables 28.8 33.6 Income Tax and Social Contribution 169.4 40.0 Other Taxes Recoverable 84.0 175.5 Other Assets 140.2 115.1
Non-Current 20,730.0 20,256.1 Trade Receivable 14.3 21.1 Restrict Cash 201.0 200.9 Deferred Income Tax and Social Contribution 1,159.8 1,362.8 Income Tax and Social Contribution 121.4 274.6 Other taxes recoverable 660.8 591.0 Lawsuits 300.5 267.2 Derivative and Financial Instruments 0.8 99.9
Other Assets 106.2 127.9
Investments in Associates 46.8 44.2
Property and Equipment 10,337.1 9,404.1
Intangible 7,781.3 7,862.4
Total Assets 23,038.0 21,745.7
Current 3,395.5 3,491.6 Loans, Financing and Debentures 1,467.7 1,444.1
Leases 472.6 539.6
Certified Real Estate Receivables - CRI 105.4 88.1
Derivative Financial Instruments 4.5 0.5
Trade Accounts Payable 565.0 419.2
Labor and Social Security Obligations 117.2 149.9
Income Tax ad Social Contribution Taxes 36.0 11.9
Other Payable Taxes 33.6 33.3
Dividends Payable 7.0 8.5
Leases and Concessions 27.7 20.2
Payable to Related Patties 106.7 104.0
Deferred Revenue 14.2 107.3
Other Financial Liabilities 177.6 236.7
Other Payables 260.4 328.5
Non - Current 13,960.2 14,237.7
Loans, Financing and Debentures 7,055.5 7,141.1
Leases 924.9 1,202.1
Certified Real Estate Receivables - CRI 90.3 196.9
Derivative Financial Instruments 7.8 1.3
Other Payables 17.1 26.1
Provision for lawsuits 507.0 490.6
Leases and Concessions 2,580.1 2,204.0
Deferred Income Tax and Social Contribution 2,395.1 2,714.4
Defered Revenues 62.2 95.7
Other Payables 320.3 165.5
Equity 5,682.3 4,016.4
Liabilities 23,038.0 21,745.7
20 of 21
Earnings Release 4Q16 and 2016
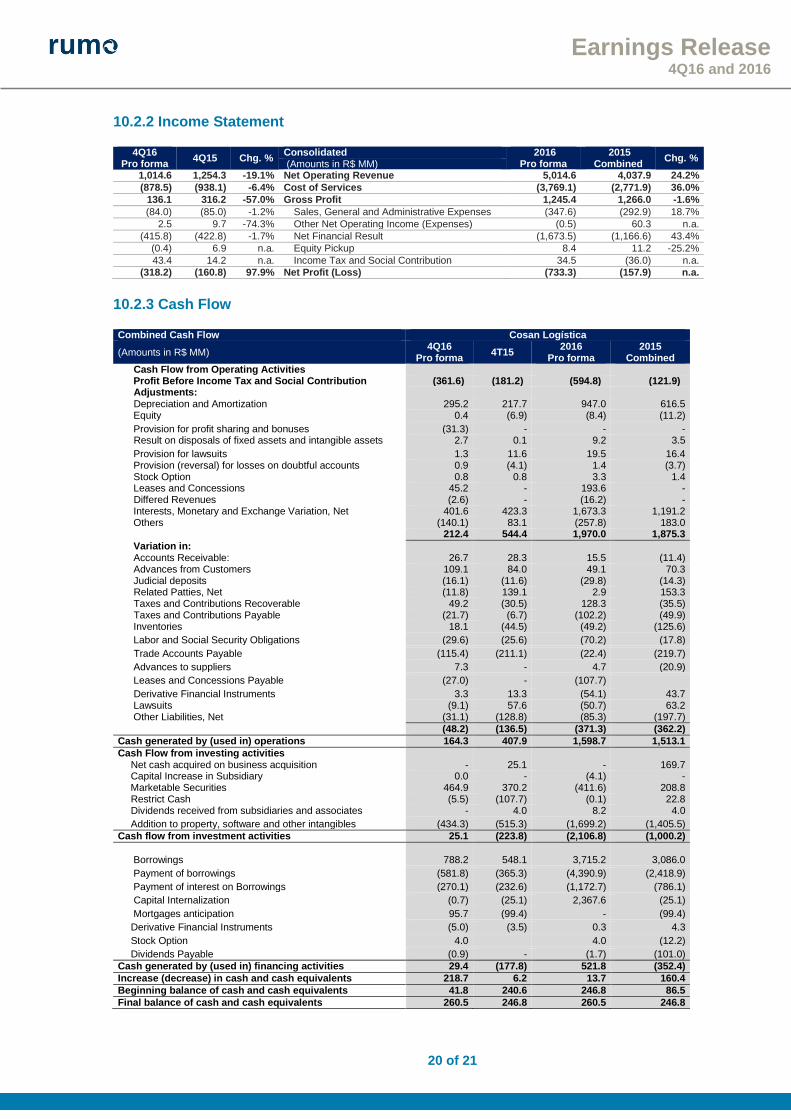
10.2.2 Income Statement
4Q16 Pro forma
4Q15 Chg. % Consolidated 2016
Pro forma 2015
Combined Chg. %
(Amounts in R$ MM) 1,014.6 1,254.3 -19.1% Net Operating Revenue 5,014.6 4,037.9 24.2%
(878.5) (938.1) -6.4% Cost of Services (3,769.1) (2,771.9) 36.0%
136.1 316.2 -57.0% Gross Profit 1,245.4 1,266.0 -1.6%
(84.0) (85.0) -1.2% Sales, General and Administrative Expenses (347.6) (292.9) 18.7%
2.5 9.7 -74.3% Other Net Operating Income (Expenses) (0.5) 60.3 n.a.
(415.8) (422.8) -1.7% Net Financial Result (1,673.5) (1,166.6) 43.4%
(0.4) 6.9 n.a. Equity Pickup 8.4 11.2 -25.2%
43.4 14.2 n.a. Income Tax and Social Contribution 34.5 (36.0) n.a.
(318.2) (160.8) 97.9% Net Profit (Loss) (733.3) (157.9) n.a.
10.2.3 Cash Flow Combined Cash Flow Cosan Logística
(Amounts in R$ MM) 4Q16
Pro forma 4T15
2016 Pro forma
2015 Combined
Cash Flow from Operating Activities Profit Before Income Tax and Social Contribution (361.6) (181.2) (594.8) (121.9) Adjustments: Depreciation and Amortization 295.2 217.7 947.0 616.5 Equity 0.4 (6.9) (8.4) (11.2)
Provision for profit sharing and bonuses (31.3) - - - Result on disposals of fixed assets and intangible assets 2.7 0.1 9.2 3.5
Provision for lawsuits 1.3 11.6 19.5 16.4 Provision (reversal) for losses on doubtful accounts 0.9 (4.1) 1.4 (3.7) Stock Option 0.8 0.8 3.3 1.4 Leases and Concessions 45.2 - 193.6 - Differed Revenues (2.6) - (16.2) - Interests, Monetary and Exchange Variation, Net 401.6 423.3 1,673.3 1,191.2 Others (140.1) 83.1 (257.8) 183.0
212.4 544.4 1,970.0 1,875.3
Variation in: Accounts Receivable: 26.7 28.3 15.5 (11.4) Advances from Customers 109.1 84.0 49.1 70.3 Judicial deposits (16.1) (11.6) (29.8) (14.3) Related Patties, Net (11.8) 139.1 2.9 153.3 Taxes and Contributions Recoverable 49.2 (30.5) 128.3 (35.5) Taxes and Contributions Payable (21.7) (6.7) (102.2) (49.9) Inventories 18.1 (44.5) (49.2) (125.6)
Labor and Social Security Obligations (29.6) (25.6) (70.2) (17.8)
Trade Accounts Payable (115.4) (211.1) (22.4) (219.7)
Advances to suppliers 7.3 - 4.7 (20.9)
Leases and Concessions Payable (27.0) - (107.7)
Derivative Financial Instruments 3.3 13.3 (54.1) 43.7 Lawsuits (9.1) 57.6 (50.7) 63.2 Other Liabilities, Net (31.1) (128.8) (85.3) (197.7)
(48.2) (136.5) (371.3) (362.2)
Cash generated by (used in) operations 164.3 407.9 1,598.7 1,513.1
Cash Flow from investing activities Net cash acquired on business acquisition - 25.1 - 169.7 Capital Increase in Subsidiary 0.0 - (4.1) - Marketable Securities 464.9 370.2 (411.6) 208.8 Restrict Cash (5.5) (107.7) (0.1) 22.8 Dividends received from subsidiaries and associates - 4.0 8.2 4.0
Addition to property, software and other intangibles (434.3) (515.3) (1,699.2) (1,405.5)
Cash flow from investment activities 25.1 (223.8) (2,106.8) (1,000.2)
Borrowings 788.2 548.1 3,715.2 3,086.0
Payment of borrowings (581.8) (365.3) (4,390.9) (2,418.9)
Payment of interest on Borrowings (270.1) (232.6) (1,172.7) (786.1)
Capital Internalization (0.7) (25.1) 2,367.6 (25.1)
Mortgages anticipation 95.7 (99.4) - (99.4)
Derivative Financial Instruments (5.0) (3.5) 0.3 4.3
Stock Option 4.0 4.0 (12.2)
Dividends Payable (0.9) - (1.7) (101.0)
Cash generated by (used in) financing activities 29.4 (177.8) 521.8 (352.4)
Increase (decrease) in cash and cash equivalents 218.7 6.2 13.7 160.4
Beginning balance of cash and cash equivalents 41.8 240.6 246.8 86.5
Final balance of cash and cash equivalents 260.5 246.8 260.5 246.8
21 of 21
Earnings Release 4Q16 and 2016