Embed Size (px)
DESCRIPTION
RENTON TUKWILA LEASE RATES (NNN) OPERATING EXPENSES* (PSF) Market Area Shell Office NNN Free Rent LEGEND Market Area 2004 2005 2006 2007 2008 2009 2Q’10 3Q’10 4Q’10 1Q’11 2Q’11 Pierce County Industrial Overview Gross Asking Lease Rates by Class NORTHEND TACOMA PORT OF TACOMA/ FIFE Historical Total Vacancy 2005 2007 2009 20112006 2008 2010 Market Area 2009 2010 2011-YTD SEATTLE | BELLEVUE | TACOMA | PORTLAND HISTORICAL VACANCY RATES & RENTAL RATES (425) 974-4000 www.pacific-re.com
Citation preview
(425) 974-4000 www.pacif ic-re.com SEATTLE | BELLEVUE | TACOMA | PORTLAND
Pierce County Industrial Market
HISTORICAL VACANCY RATES & RENTAL RATES
2005 2007 2009 20112006 2008 2010
10.0% $0.33
8.0%
$0.30
4.0%
6.0%
2.0%
$0.32
$0.31
0.0% $0.26
$0.27
$0.29
$0.28
Rental Rates Vacancy RatesPierce County Industrial Overview
INVENTORY ABSORPTION UNDER CONSTRUCTIONMarket Area Buildings SF Direct Vacancy Sublet Vacancy Total Vacancy 2Q Absorption YTD Projects SF
Port of Tacoma/Fife 284 18,705,677 7.2% 0.0% 7.2% 103,740 (14,102) - -
Lakewood 108 4,770,761 7.3% 0.1% 7.4% 20,960 (118,345) - -
North End Tacoma 67 2,112,040 5.5% 0.0% 5.5% 2,242 (13,358) - -
Spanaway 56 3,432,830 6.1% 0.0% 6.1% 2,280 (7,021) - -
Puyallup/Sumner 268 20,907,468 13.2% 0.1% 13.3% 37,403 27,101 - -
Tacoma CBD 49 1,435,574 9.5% 0.7% 10.2% 12,882 50,512 - -
Other Pierce County Markets* 318 10,688,751 4.3% 0.3% 4.6% 48,180 82,742 - -
PIERCE COUNTY INDUSTRIAL 1,150 62,053,101 8.7% 0.1% 8.8% 227,687 7,529 - -
Market Area 2Q’10 3Q’10 4Q’10 2010 1Q’11 2Q’11
Port of Tacoma/Fife (29,872) 290,444 430,998 725,230 (117,842) 103,740
Lakewood 20,343 6,598 (23,588) (11,147) (139,305) 20,960
North End Tacoma 4,800 600 (1,050) 3,210 (15,600) 2,242
Spanaway 5,616 (20,051) 1,752 (10,375) (9,301) 2,280
Puyallup/Sumner 244,057 (227,487) 74,350 (42,663) (10,302) 37,403
Tacoma CBD (23,070) (10,468) 1,932 (34,966) 37,630 12,882
Other Pierce County Markets* 88,890 146,945 (29,623) 28,270 34,562 48,180
PIERCE COUNTY INDUSTRIAL 310,764 186,581 454,771 657,559 (220,158) 227,687
Historical Total TEUs Historical Total Absorption
Market Area 2009 2010 2011-YTD
Port of Seattle 1,584,596 2,139,577 656,045
Port of Tacoma 1,545,855 1,455,467 465,100
Puget Sound Ports Total 3,130,451 3,595,044 1,121,145
Gross Asking Lease Rates by ClassLEASE RATES (NNN) OPERATING EXPENSES* (PSF)
Market Area Shell Office NNN Free Rent
Port of Tacoma/Fife $0.32-$0.38 $0.75 $0.09-$0.14 3-6 monthsLakewood $0.28-$0.36 $0.75 $0.09-$0.14 3-6 monthsNorth End Tacoma $0.32-$0.38 $0.75 $0.09-$0.14 3-6 monthsSpanaway $0.28-$0.36 $0.75 $0.09-$0.14 3-6 monthsPuyallup/Sumner $0.32-$0.38 $0.75 $0.09-$0.14 3-6 monthsTacoma CBD $0.28-$0.36 $0.75 $0.09-$0.14 3-6 monthsOther Pierce County Markets* $0.26-$0.32 $0.75 $0.09-$0.14 3-6 monthsPIERCE COUNTY INDUSTRIAL $0.28-$0.36 $0.75 $0.09-$0.14 3-6 months Ra
tes/
exp
ense
s ar
e ap
pro
xim
ate
Historical Total Vacancy
Market Area 2004 2005 2006 2007 2008 2009 2Q’10 3Q’10 4Q’10 1Q’11 2Q’11
Port of Tacoma/Fife 5.6% 3.2% 3.3% 4.8% 8.5% 9.0% 9.4% 9.6% 7.3% 7.9% 7.2%
Lakewood 6.3% 5.2% 13.9% 7.8% 4.0% 4.5% 4.4% 4.3% 4.8% 7.6% 7.4%
North End Tacoma 1.2% 2.6% 1.9% 2.6% 2.1% 4.1% 3.9% 3.9% 4.0% 4.7% 5.5%
Spanaway 11.3% 2.1% 0.8% 10.8% 11.9% 5.6% 5.4% 6.0% 5.9% 6.2% 6.1%
Puyallup/Sumner 4.0% 8.3% 6.2% 11.3% 14.5% 12.4% 12.2% 13.3% 13.0% 13.6% 13.3%
Tacoma CBD 5.0% 4.3% 6.8% 7.0% 5.5% 11.4% 13.3% 14.0% 13.8% 11.2% 10.2%
Other Pierce County Markets* 3.9% 4.2% 5.2% 2.3% 4.9% 4.7% 5.6% 4.2% 4.4% 4.1% 4.6%
PIERCE COUNTY INDUSTRIAL 5.0% 4.8% 5.4% 6.9% 9.4% 8.8% 9.0% 9.2% 9.1% 9.1% 8.8%
Prio
r ye
ars
as o
f 4Q
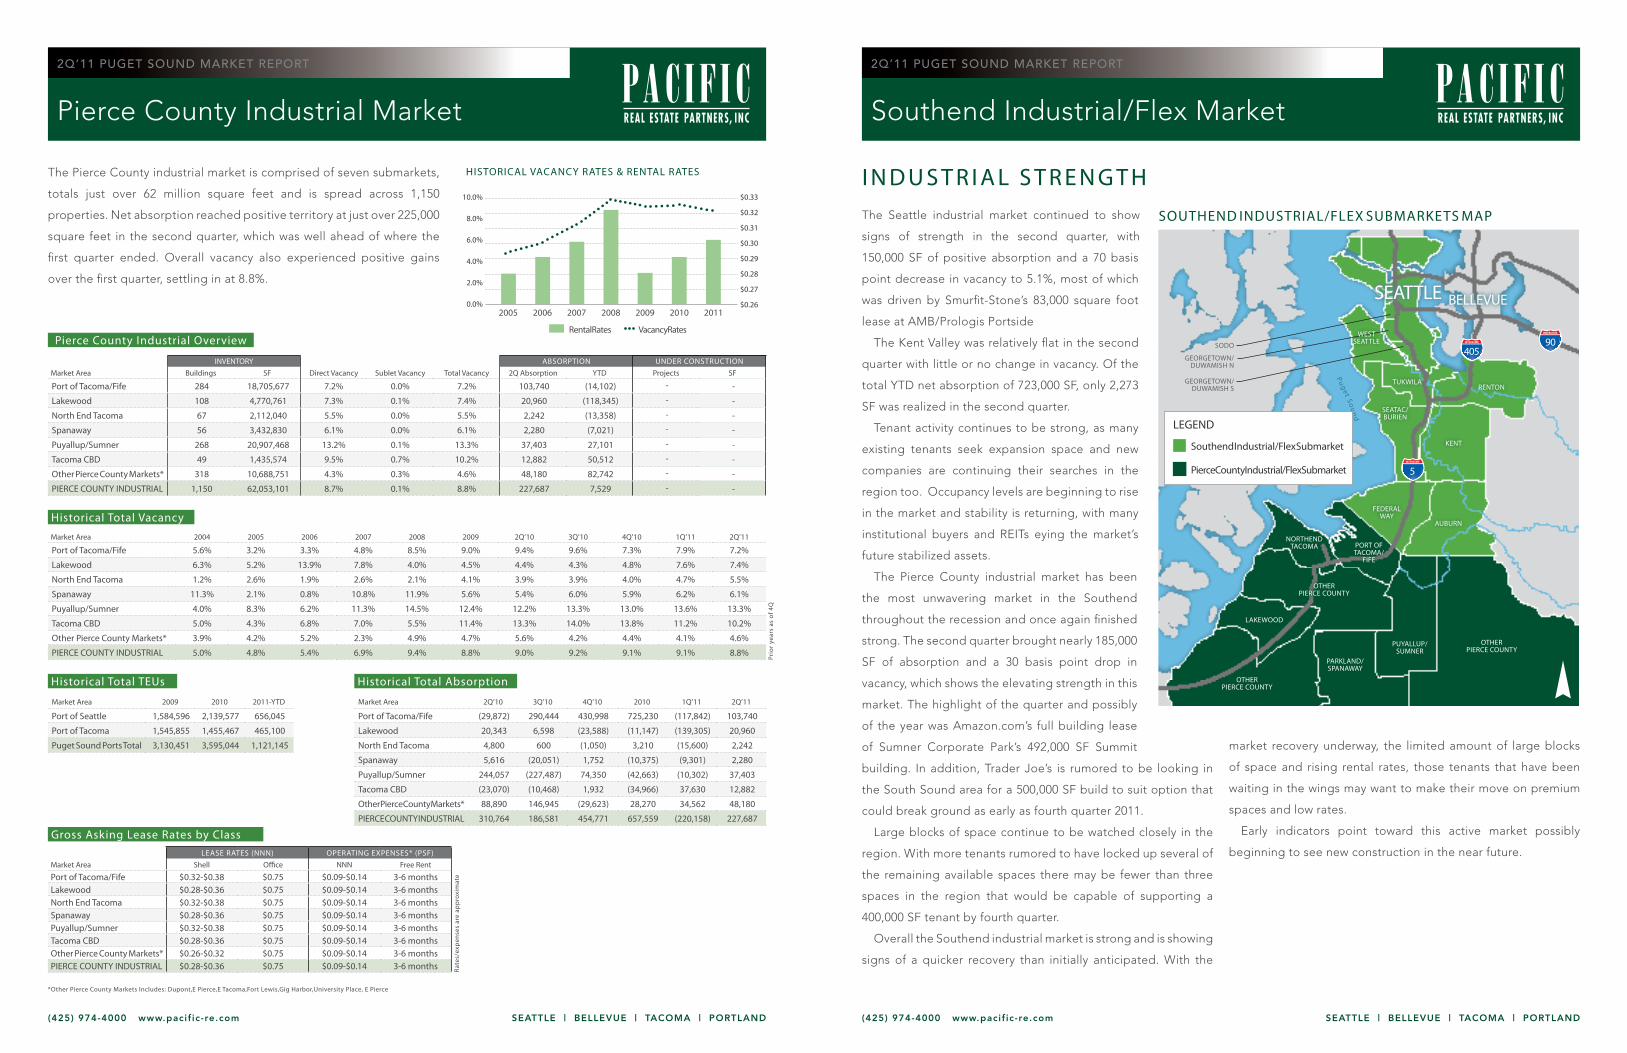
The Pierce County industrial market is comprised of seven submarkets,
totals just over 62 million square feet and is spread across 1,150
properties. Net absorption reached positive territory at just over 225,000
square feet in the second quarter, which was well ahead of where the
first quarter ended. Overall vacancy also experienced positive gains
over the first quarter, settling in at 8.8%.
*Other Pierce County Markets Includes: Dupont,E Pierce,E Tacoma,Fort Lewis,Gig Harbor,University Place, E Pierce
(425) 974-4000 www.pacif ic-re.com SEATTLE | BELLEVUE | TACOMA | PORTLAND
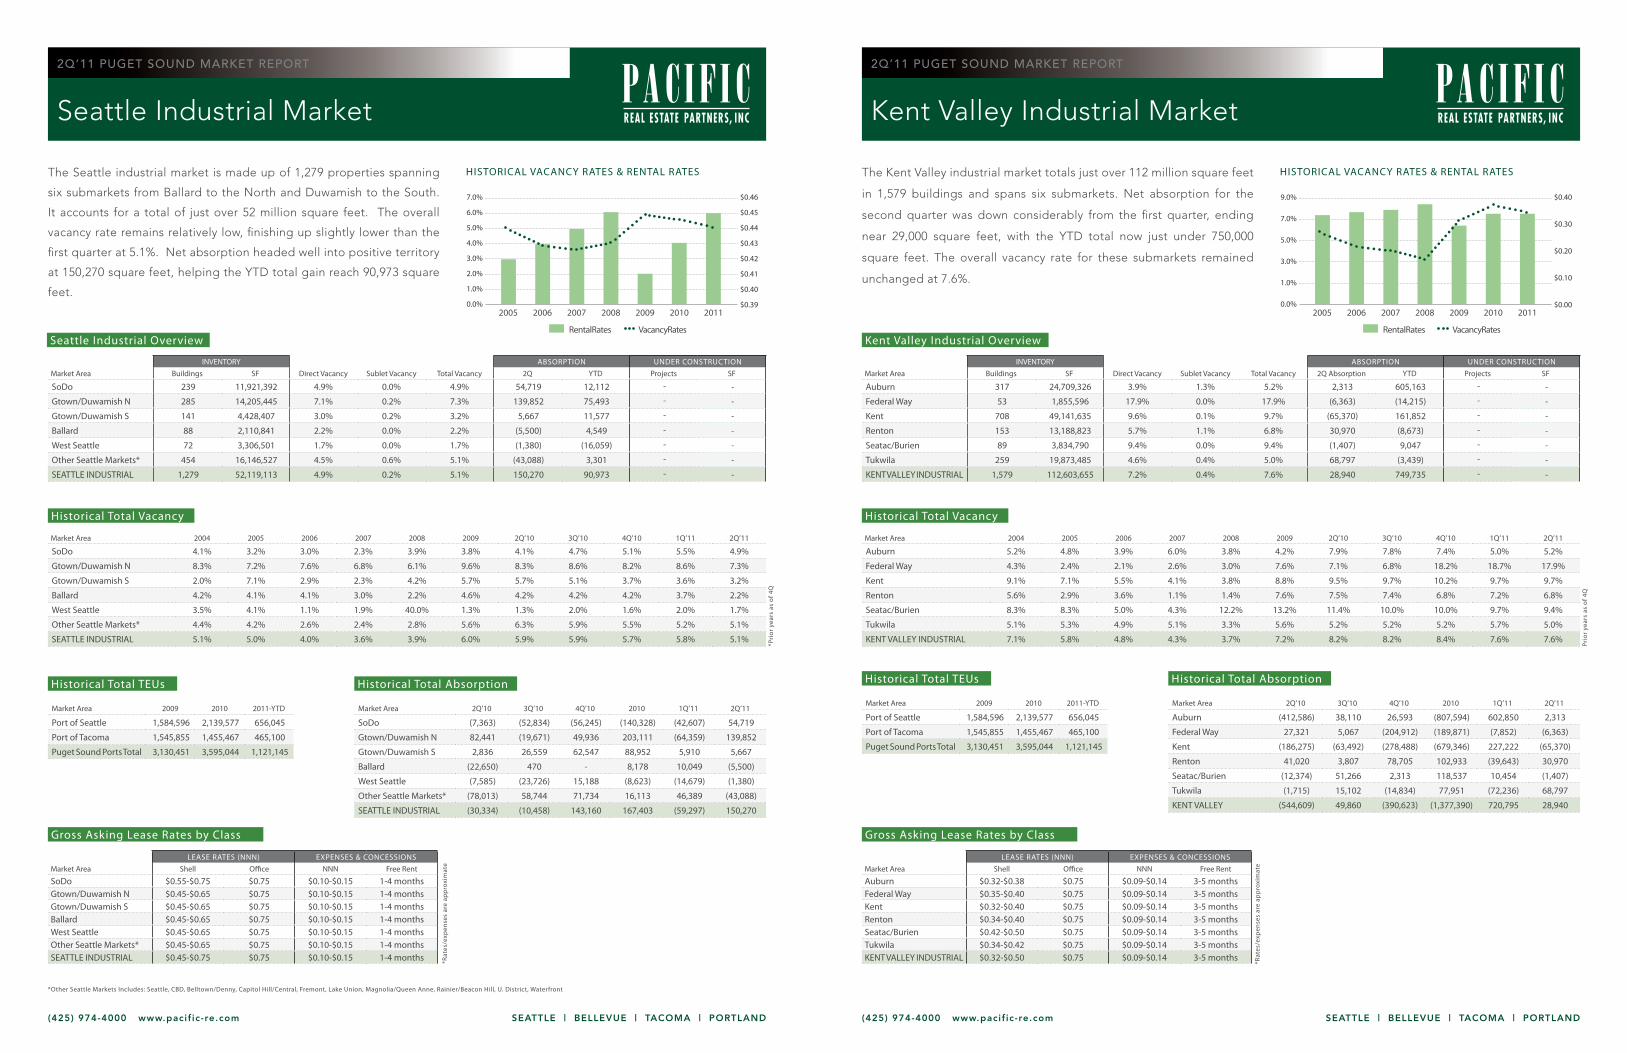
Southend Industrial/Flex Market
SOUTHEND INDUSTRIAL/FLEX SUBMARKETS MAP
SEATTLE BELLEVUE
The Seattle industrial market continued to show
signs of strength in the second quarter, with
150,000 SF of positive absorption and a 70 basis
point decrease in vacancy to 5.1%, most of which
was driven by Smurfit-Stone’s 83,000 square foot
lease at AMB/Prologis Portside
The Kent Valley was relatively flat in the second
quarter with little or no change in vacancy. Of the
total YTD net absorption of 723,000 SF, only 2,273
SF was realized in the second quarter.
Tenant activity continues to be strong, as many
existing tenants seek expansion space and new
companies are continuing their searches in the
region too. Occupancy levels are beginning to rise
in the market and stability is returning, with many
institutional buyers and REITs eying the market’s
future stabilized assets.
The Pierce County industrial market has been
the most unwavering market in the Southend
throughout the recession and once again finished
strong. The second quarter brought nearly 185,000
SF of absorption and a 30 basis point drop in
vacancy, which shows the elevating strength in this
market. The highlight of the quarter and possibly
of the year was Amazon.com’s full building lease
of Sumner Corporate Park’s 492,000 SF Summit
building. In addition, Trader Joe’s is rumored to be looking in
the South Sound area for a 500,000 SF build to suit option that
could break ground as early as fourth quarter 2011.
Large blocks of space continue to be watched closely in the
region. With more tenants rumored to have locked up several of
the remaining available spaces there may be fewer than three
spaces in the region that would be capable of supporting a
400,000 SF tenant by fourth quarter.
Overall the Southend industrial market is strong and is showing
signs of a quicker recovery than initially anticipated. With the
market recovery underway, the limited amount of large blocks
of space and rising rental rates, those tenants that have been
waiting in the wings may want to make their move on premium
spaces and low rates.
Early indicators point toward this active market possibly
beginning to see new construction in the near future.
I N D U S T R I A L S T R E N G T H
90405
5
Puget Sou
nd
OTHER PIERCE COUNTY
LAKEWOOD
PUYALLUP/SUMNER
OTHER PIERCE COUNTY
OTHER PIERCE COUNTY
PARKLAND/SPANAWAY
FEDERAL WAY
AUBURN
NORTHENDTACOMA PORT OF
TACOMA/FIFE
KENTVashonIsland
RENTONTUKWILA
SEATAC/BURIEN
WEST SEATTLESODO
GEORGETOWN/ DUWAMISH N
GEORGETOWN/ DUWAMISH S
LEGEND
Pierce County Industrial/ Flex Submarket
Southend Industrial/Flex Submarket
2Q’11 PUGET SOUND MARKET REPORT2Q’11 PUGET SOUND MARKET REPORT
(425) 974-4000 www.pacif ic-re.com SEATTLE | BELLEVUE | TACOMA | PORTLAND
Seattle Industrial Market
(425) 974-4000 www.pacif ic-re.com SEATTLE | BELLEVUE | TACOMA | PORTLAND
Kent Valley Industrial Market
*Other Seattle Markets Includes: Seattle, CBD, Belltown/Denny, Capitol Hill/Central, Fremont, Lake Union, Magnolia/Queen Anne, Rainier/Beacon Hill, U. District, Waterfront
HISTORICAL VACANCY RATES & RENTAL RATES
2005 2007 2009 20112006 2008 2010
7.0% $0.46
5.0%
$0.43
3.0%
2.0%
1.0%
6.0% $0.45
$0.44
0.0% $0.39
$0.40
4.0%
$0.42
$0.41
Rental Rates Vacancy Rates Seattle Industrial Overview
INVENTORY ABSORPTION UNDER CONSTRUCTIONMarket Area Buildings SF Direct Vacancy Sublet Vacancy Total Vacancy 2Q YTD Projects SF
SoDo 239 11,921,392 4.9% 0.0% 4.9% 54,719 12,112 - -
Gtown/Duwamish N 285 14,205,445 7.1% 0.2% 7.3% 139,852 75,493 - -
Gtown/Duwamish S 141 4,428,407 3.0% 0.2% 3.2% 5,667 11,577 - -
Ballard 88 2,110,841 2.2% 0.0% 2.2% (5,500) 4,549 - -
West Seattle 72 3,306,501 1.7% 0.0% 1.7% (1,380) (16,059) - -
Other Seattle Markets* 454 16,146,527 4.5% 0.6% 5.1% (43,088) 3,301 - -
SEATTLE INDUSTRIAL 1,279 52,119,113 4.9% 0.2% 5.1% 150,270 90,973 - -
Market Area 2Q’10 3Q’10 4Q’10 2010 1Q’11 2Q’11
SoDo (7,363) (52,834) (56,245) (140,328) (42,607) 54,719
Gtown/Duwamish N 82,441 (19,671) 49,936 203,111 (64,359) 139,852
Gtown/Duwamish S 2,836 26,559 62,547 88,952 5,910 5,667
Ballard (22,650) 470 - 8,178 10,049 (5,500)
West Seattle (7,585) (23,726) 15,188 (8,623) (14,679) (1,380)
Other Seattle Markets* (78,013) 58,744 71,734 16,113 46,389 (43,088)
SEATTLE INDUSTRIAL (30,334) (10,458) 143,160 167,403 (59,297) 150,270
Historical Total TEUs Historical Total Absorption
Market Area 2009 2010 2011-YTD
Port of Seattle 1,584,596 2,139,577 656,045
Port of Tacoma 1,545,855 1,455,467 465,100
Puget Sound Ports Total 3,130,451 3,595,044 1,121,145
Gross Asking Lease Rates by Class
LEASE RATES (NNN) EXPENSES & CONCESSIONSMarket Area Shell Office NNN Free Rent
SoDo $0.55-$0.75 $0.75 $0.10-$0.15 1-4 monthsGtown/Duwamish N $0.45-$0.65 $0.75 $0.10-$0.15 1-4 monthsGtown/Duwamish S $0.45-$0.65 $0.75 $0.10-$0.15 1-4 monthsBallard $0.45-$0.65 $0.75 $0.10-$0.15 1-4 monthsWest Seattle $0.45-$0.65 $0.75 $0.10-$0.15 1-4 monthsOther Seattle Markets* $0.45-$0.65 $0.75 $0.10-$0.15 1-4 monthsSEATTLE INDUSTRIAL $0.45-$0.75 $0.75 $0.10-$0.15 1-4 months *R
ates
/exp
ense
s ar
e ap
pro
xim
ate
Historical Total Vacancy
Market Area 2004 2005 2006 2007 2008 2009 2Q’10 3Q’10 4Q’10 1Q’11 2Q’11
SoDo 4.1% 3.2% 3.0% 2.3% 3.9% 3.8% 4.1% 4.7% 5.1% 5.5% 4.9%
Gtown/Duwamish N 8.3% 7.2% 7.6% 6.8% 6.1% 9.6% 8.3% 8.6% 8.2% 8.6% 7.3%
Gtown/Duwamish S 2.0% 7.1% 2.9% 2.3% 4.2% 5.7% 5.7% 5.1% 3.7% 3.6% 3.2%
Ballard 4.2% 4.1% 4.1% 3.0% 2.2% 4.6% 4.2% 4.2% 4.2% 3.7% 2.2%
West Seattle 3.5% 4.1% 1.1% 1.9% 40.0% 1.3% 1.3% 2.0% 1.6% 2.0% 1.7%
Other Seattle Markets* 4.4% 4.2% 2.6% 2.4% 2.8% 5.6% 6.3% 5.9% 5.5% 5.2% 5.1%
SEATTLE INDUSTRIAL 5.1% 5.0% 4.0% 3.6% 3.9% 6.0% 5.9% 5.9% 5.7% 5.8% 5.1%
*Pri
or y
ears
as
of 4
Q
The Seattle industrial market is made up of 1,279 properties spanning
six submarkets from Ballard to the North and Duwamish to the South.
It accounts for a total of just over 52 million square feet. The overall
vacancy rate remains relatively low, finishing up slightly lower than the
first quarter at 5.1%. Net absorption headed well into positive territory
at 150,270 square feet, helping the YTD total gain reach 90,973 square
feet.
The Kent Valley industrial market totals just over 112 million square feet
in 1,579 buildings and spans six submarkets. Net absorption for the
second quarter was down considerably from the first quarter, ending
near 29,000 square feet, with the YTD total now just under 750,000
square feet. The overall vacancy rate for these submarkets remained
unchanged at 7.6%.
HISTORICAL VACANCY RATES & RENTAL RATES
2005 2007 2009 20112006 2008 2010
9.0% $0.40
7.0%
3.0%
5.0%
1.0%
$0.30
0.0% $0.00
$0.10
$0.20
Rental Rates Vacancy Rates Kent Valley Industrial Overview
INVENTORY ABSORPTION UNDER CONSTRUCTIONMarket Area Buildings SF Direct Vacancy Sublet Vacancy Total Vacancy 2Q Absorption YTD Projects SF
Auburn 317 24,709,326 3.9% 1.3% 5.2% 2,313 605,163 - -
Federal Way 53 1,855,596 17.9% 0.0% 17.9% (6,363) (14,215) - -
Kent 708 49,141,635 9.6% 0.1% 9.7% (65,370) 161,852 - -
Renton 153 13,188,823 5.7% 1.1% 6.8% 30,970 (8,673) - -
Seatac/Burien 89 3,834,790 9.4% 0.0% 9.4% (1,407) 9,047 - -
Tukwila 259 19,873,485 4.6% 0.4% 5.0% 68,797 (3,439) - -
KENT VALLEY INDUSTRIAL 1,579 112,603,655 7.2% 0.4% 7.6% 28,940 749,735 - -
Market Area 2Q’10 3Q’10 4Q’10 2010 1Q’11 2Q’11
Auburn (412,586) 38,110 26,593 (807,594) 602,850 2,313
Federal Way 27,321 5,067 (204,912) (189,871) (7,852) (6,363)
Kent (186,275) (63,492) (278,488) (679,346) 227,222 (65,370)
Renton 41,020 3,807 78,705 102,933 (39,643) 30,970
Seatac/Burien (12,374) 51,266 2,313 118,537 10,454 (1,407)
Tukwila (1,715) 15,102 (14,834) 77,951 (72,236) 68,797
KENT VALLEY (544,609) 49,860 (390,623) (1,377,390) 720,795 28,940
Historical Total TEUs Historical Total Absorption
Market Area 2009 2010 2011-YTD
Port of Seattle 1,584,596 2,139,577 656,045
Port of Tacoma 1,545,855 1,455,467 465,100
Puget Sound Ports Total 3,130,451 3,595,044 1,121,145
Gross Asking Lease Rates by Class
LEASE RATES (NNN) EXPENSES & CONCESSIONSMarket Area Shell Office NNN Free Rent
Auburn $0.32-$0.38 $0.75 $0.09-$0.14 3-5 monthsFederal Way $0.35-$0.40 $0.75 $0.09-$0.14 3-5 monthsKent $0.32-$0.40 $0.75 $0.09-$0.14 3-5 monthsRenton $0.34-$0.40 $0.75 $0.09-$0.14 3-5 monthsSeatac/Burien $0.42-$0.50 $0.75 $0.09-$0.14 3-5 monthsTukwila $0.34-$0.42 $0.75 $0.09-$0.14 3-5 monthsKENT VALLEY INDUSTRIAL $0.32-$0.50 $0.75 $0.09-$0.14 3-5 months *R
ates
/exp
ense
s ar
e ap
pro
xim
ate
Historical Total Vacancy
Market Area 2004 2005 2006 2007 2008 2009 2Q’10 3Q’10 4Q’10 1Q’11 2Q’11
Auburn 5.2% 4.8% 3.9% 6.0% 3.8% 4.2% 7.9% 7.8% 7.4% 5.0% 5.2%
Federal Way 4.3% 2.4% 2.1% 2.6% 3.0% 7.6% 7.1% 6.8% 18.2% 18.7% 17.9%
Kent 9.1% 7.1% 5.5% 4.1% 3.8% 8.8% 9.5% 9.7% 10.2% 9.7% 9.7%
Renton 5.6% 2.9% 3.6% 1.1% 1.4% 7.6% 7.5% 7.4% 6.8% 7.2% 6.8%
Seatac/Burien 8.3% 8.3% 5.0% 4.3% 12.2% 13.2% 11.4% 10.0% 10.0% 9.7% 9.4%
Tukwila 5.1% 5.3% 4.9% 5.1% 3.3% 5.6% 5.2% 5.2% 5.2% 5.7% 5.0%
KENT VALLEY INDUSTRIAL 7.1% 5.8% 4.8% 4.3% 3.7% 7.2% 8.2% 8.2% 8.4% 7.6% 7.6%
Prio
r ye
ars
as o
f 4Q
2Q’11 PUGET SOUND MARKET REPORT2Q’11 PUGET SOUND MARKET REPORT


