Embed Size (px)
DESCRIPTION
(425) 974-4000 www.pacific-re.com Sound Puget KIRKLAND REDMOND MUKILTEO 405 Northend Industrial Submarket Eastside Industrial Submarket 90 520 LYNNWOOD MONROE 5 5 WOODINVILLE ISSAQUAH BELLEVUE BOTHELL EVERETT West Seattle
Citation preview
(425) 974-4000 www.pacif ic-re.com SEATTLE | BELLEVUE | TACOMA | PORTLAND
Eastside & Northend Industrial/Flex Market
2Q’11 PUGET SOUND MARKET REPORT
The Eastside and Northend industrial markets continue to show
signs of slow stabilization.
Although Eastside vacancy rates improved slightly over first
quarter they continue to remain stubbornly high compared to
last year.
The Northend market is following a similar path, with only
slight improvements over one year ago.
The moderate increase in Northend activity can be attributed
primarily to renewed Boeing production. The Eastside market
sector will begin to realize larger gains when there is significant
improvement in the residential, commercial and building trade
industries; however, technology and small manufacturing
companies are showing signs of strength.
The flex markets are still weak, with both the Eastside and
Northend markets experiencing only a slight improvement over
the last quarter. Absorption has been moving into positive
territory, which is a welcomed trend in this sluggish market
sector.
Looking forward to the third and fourth quarters of 2011, the
Northend market should see increased tenant activity. On the
shoulders of last quarter’s tanker contract awarded to Boeing
the aerospace giant has also announced a ramp up in airplane
manufacturing across the board. The surge in production will
have a positive impact on those companies that are located
nearby and provide support services to this manufacturing
powerhouse.
In late June the Port of Everett celebrated its 1,000th barge
carrying aerospace parts for the 747, 767 and 777 models, a sign
that Boeing is on a steady course to raise its plane output.
As tenant demand increases and space options decrease, the
Northend should see a rise in rents and decline in concessions
to balance the supply to demand ratio.
Similarly, the Eastside is poised for improving tenant activity
as the economy continues to gain momentum. Several large
tenants, including Saltworks, are expanding operations in the
Woodinville market, which will help contribute to positive
growth in that submarket.
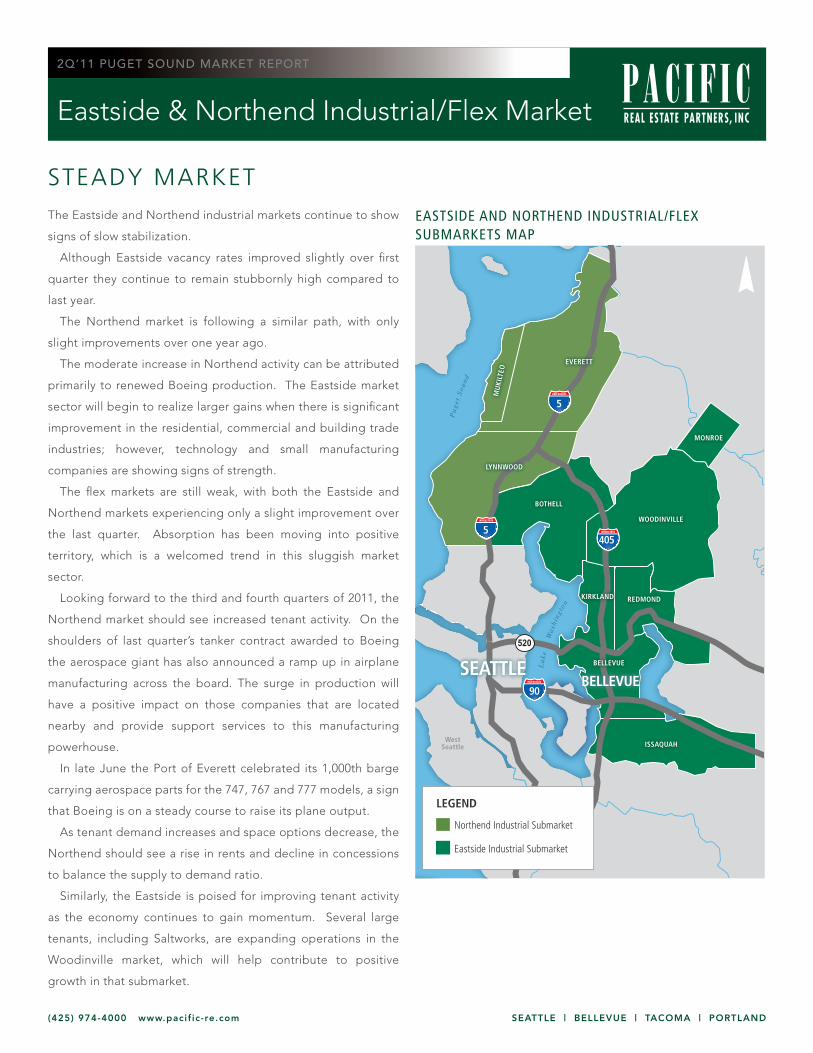
EASTSIDE AND NORTHEND INDUSTRIAL/FLEX SUBMARKETS MAP
STEADY MARKET
5
5
405
SEATTLEBELLEVUE
90
520
WestSeattle
EVERETT
MONROE
LYNNWOOD
BOTHELL
WOODINVILLE
ISSAQUAH
BELLEVUE
KIRKLAND REDMOND
MU
KILT
EO
Lake
Was
hing
ton
Pug
et S
ound
LEGEND
Eastside Industrial Submarket
Northend Industrial Submarket

(425) 974-4000 www.pacif ic-re.com SEATTLE | BELLEVUE | TACOMA | PORTLAND
Eastside and Northend Industrial Market
2Q’11 PUGET SOUND MARKET REPORT
Market Area 2Q’10 3Q’10 4Q’10 2010 1Q’11 2Q’11
Bothell - (17,096) (2,998) (20,094) (10,000) 7,000
Woodinville 48,213 (60,658) 33,796 21,351 27,517 2,492
Kirkland 1,019 48,200 (3,878) 45,341 (5,480) 13,556
Monroe 15,646 26,925 2,318 44,889 (4,917) 2,200
Redmond (41,961) (34,139) 4,878 (71,222) 1,148 1,342
Bellevue 52,599 (17,922) (43,489) (8,812) (98,691) 60,696
Issaquah (2,540) - 2,190 (350) (2,757) 4,588
EASTSIDE INDUSTRIAL 72,976 (54,690) (7,183) 11,103 (93,180) 91,874
Everett 111,190 54,107 110,737 276,034 (15,353) 52,709
Mukilteo (26,092) (124,594) 8,333 (142,353) 30,651 (641)
Lynnwood 10,202 (4,977) 15,165 20,390 (14,442) (4,933)
NORTHEND INDUSTRIAL 95,300 (75,464) 134,235 154,071 856 47,135
Historical Leasing Activity Historical Total AbsorptionMarket Area 2010-Leases 2010-SF YTD 2011-Leases YTD 2011-SF
Bothell 2 24,311 2 9,000
Woodinville 46 313,272 24 176,007
Kirkland 18 98,863 3 15,385
Monroe 13 94,970 4 23,615
Redmond 20 115,136 11 201,172
Bellevue 29 221,443 11 81,918
Issaquah 5 18,220 2 6,140
EASTSIDE INDUSTRIAL 133 886,215 57 513,237
Everett 39 643,109 10 113,221
Mukilteo 9 31,970 3 23,137
Lynnwood 14 60,244 3 12,932
NORTHEND INDUSTRIAL 62 735,323 16 149,290
Historical Total VacancyMarket Area 2004 2005 2006 2007 2008 2009 2Q’10 3Q’10 4Q’10 1Q’11 2Q’11
Bothell 18.8% 18.1% 13.6% 2.8% 0.3% 2.2% 2.1% 2.1% 0.0% 0.8% 0.2%
Woodinville 14.1% 11.9% 8.1% 4.9% 4.6% 10.9% 10.2% 11.3% 10.7% 10.2% 9.9%
Kirkland 32.0% 12.7% 3.1% 10.8% 3.7% 14.4% 13.7% 10.7% 10.9% 11.3% 10.4%
Monroe 3.6% 3.6% 8.1% 10.4% 8.9% 24.2% 24.8% 23.1% 23.0% 23.3% 22.5%
Redmond 10.2% 9.5% 5.0% 3.9% 4.3% 8.9% 9.0% 9.9% 9.7% 9.7% 9.6%
Bellevue 6.5% 4.1% 22.2% 12.2% 5.2% 5.4% 2.0% 2.7% 4.2% 7.5% 5.5%
Issaquah 42.2% 32.5% 22.5% 10.1% 6.4% 6.9% 7.0% 7.0% 6.7% 7.0% 6.4%
EASTSIDE INDUSTRIAL 13.9% 10.4% 10.3% 7.4% 4.7% 10.2% 9.4% 9.8% 9.8% 10.5% 9.4%
Everett 18.0% 15.9% 18.7% 9.2% 11.2% 15.7% 14.9% 14.2% 12.8% 13.0% 11.7%
Mukilteo 17.2% 16.0% 13.9% 10.8% 9.4% 11.6% 14.6% 20.2% 19.8% 18.4% 18.4%
Lynnwood 6.7% 12.0% 7.0% 7.0% 4.8% 7.5% 6.9% 7.1% 6.3% 7.1% 7.4%
NORTHEND INDUSTRIAL 16.0% 15.3% 15.8% 9.1% 9.9% 13.7% 13.6% 14.2% 13.1% 13.1% 12.3% Prio
r ye
ars
as o
f 4
Q*
5 y
ear
dea
l
The Eastside industrial market is comprised of seven submarkets, 447
properties and totals just over 17 million square feet. The Northend
industrial market has a total of 295 properties spanning three submarkets
and totals just over 12 million square feet. Both markets outpaced the
first quarter, moving well into positive net absorption territory. Overall
vacancy rates trended in the same direction, with the Eastside finishing
at 9.4% and the Northend finishing just above 12%.
Eastside and Northend Industrial OverviewINVENTORY ABSORPTION AVERAGE RENT & EXPENSES CONCESSIONS
Market Area Buildings SF Direct Vacancy Sublet Vacancy Total Vacancy 2Q Absorption YTD Shell Office Free Rent
Bothell 32 1,210,694 0.2% 0.0% 0.2% 7,000 (3,000) $0.50-$0.60 $1.00-$1.20 4-6 months
Woodinville 136 5,385,289 9.9% 0.0% 9.9% 2,492 30,009 $0.45-$0.60 $0.95-$1.20 4-6 months
Kirkland 43 1,576,880 9.1% 1.3% 10.4% 13,556 8,076 $0.45-$0.60 $0.95-$1.25 4-5 months
Monroe 48 1,591,296 20.2% 2.3% 22.5% 2,200 (2,717) $0.40-$0.55 $0.95-$1.15 4-7 months
Redmond 105 3,856,247 9.1% 0.5% 9.6% 1,342 2,490 $0.50-$0.60 $1.00-$1.25 3-6 months
Bellevue 68 2,883,008 5.5% 0.0% 5.5% 60,696 (37,995) $0.50-$0.65 $1.10-$1.25 3-5 months
Issaquah 15 731,980 6.4% 0.0% 6.4% 4,588 1,831 $0.50-$0.65 $1.10-$1.25 3-6 months
EASTSIDE INDUSTRIAL 447 17,235,394 9.0% 0.4% 9.4% 91,874 (1,306) $0.45-$0.65 $0.95-$1.25 3-7 months
Everett 176 8,234,876 11.4% 0.3% 11.7% 52,709 37,356 $0.45-$0.60 $1.10-$1.25 3-6 months
Mukilteo 59 2,208,128 18.4% 0.0% 18.4% (641) 30,010 $0.50-$0.65 $1.10-$1.25 3-6 months
Lynnwood 60 1,686,432 6.6% 0.8% 7.4% (4,933) (19,375) $0.50-$0.65 $1.10-$1.25 3-6 months
NORTHEND INDUSTRIAL 295 12,129,436 12.0% 0.3% 12.3% 47,135 47,991 $0.45-$0.65 $1.10-$1.25 3-6 months
HISTORICAL VACANCY RATES
2005 2007 2009 20112006 2008 2010
18.0%
NORTHEND
EASTSIDE
14.0%
0.0%
8.0%
6.0%
4.0%
2.0%
16.0%
10.0%
12.0%


