Embed Size (px)
Citation preview
31 July 2015
2Q 2015 Results Lakshmi N. Mittal, Chairman and Chief Executive Officer
Aditya Mittal, Chief Financial Officer
Disclaimer
Forward-Looking Statements
This document may contain forward-looking information and statements about ArcelorMittal and its
subsidiaries. These statements include financial projections and estimates and their underlying
assumptions, statements regarding plans, objectives and expectations with respect to future operations,
products and services, and statements regarding future performance. Forward-looking statements may be
identified by the words “believe,” “expect,” “anticipate,” “target” or similar expressions. Although
ArcelorMittal’s management believes that the expectations reflected in such forward-looking statements
are reasonable, investors and holders of ArcelorMittal’s securities are cautioned that forward-looking
information and statements are subject to numerous risks and uncertainties, many of which are difficult to
predict and generally beyond the control of ArcelorMittal, that could cause actual results and
developments to differ materially and adversely from those expressed in, or implied or projected by, the
forward-looking information and statements. These risks and uncertainties include those discussed or
identified in the filings with the Luxembourg Stock Market Authority for the Financial Markets (Commission
de Surveillance du Secteur Financier) and the United States Securities and Exchange Commission (the
“SEC”) made or to be made by ArcelorMittal, including ArcelorMittal’s Annual Report on Form 20-F for the
year ended December 31, 2014 filed with the SEC. ArcelorMittal undertakes no obligation to publicly
update its forward-looking statements, whether as a result of new information, future events, or otherwise.
1

Agenda
• Results overview and market outlook
• Results analysis
• Outlook and guidance
2

0.680.880.850.85
2Q’15 1Q’15 2013 2014 2012
1.0
2011
1.4
2010
1.8
2009
1.9
2008
2.5
2007
3.1
3
Health & Safety Lost time injury frequency (LTIF) rate*
Mining & steel, employees and contractors
* LTIF = Lost time injury frequency defined as Lost Time Injuries per 1.000.000 worked hours; based on own personnel and contractors
Safety focus
Our goal is to be the safest Metals & Mining company
Health and safety performance
• Safety: LTIF rate of 0.68x in 2Q’15 vs 0.88x in
1Q’15 and 0.87x in 2Q’14
• The Company’s effort to improve the Group’s
Health and Safety record will continue
• The Company is focused on further reducing the
rate of severe injuries and fatality prevention
4
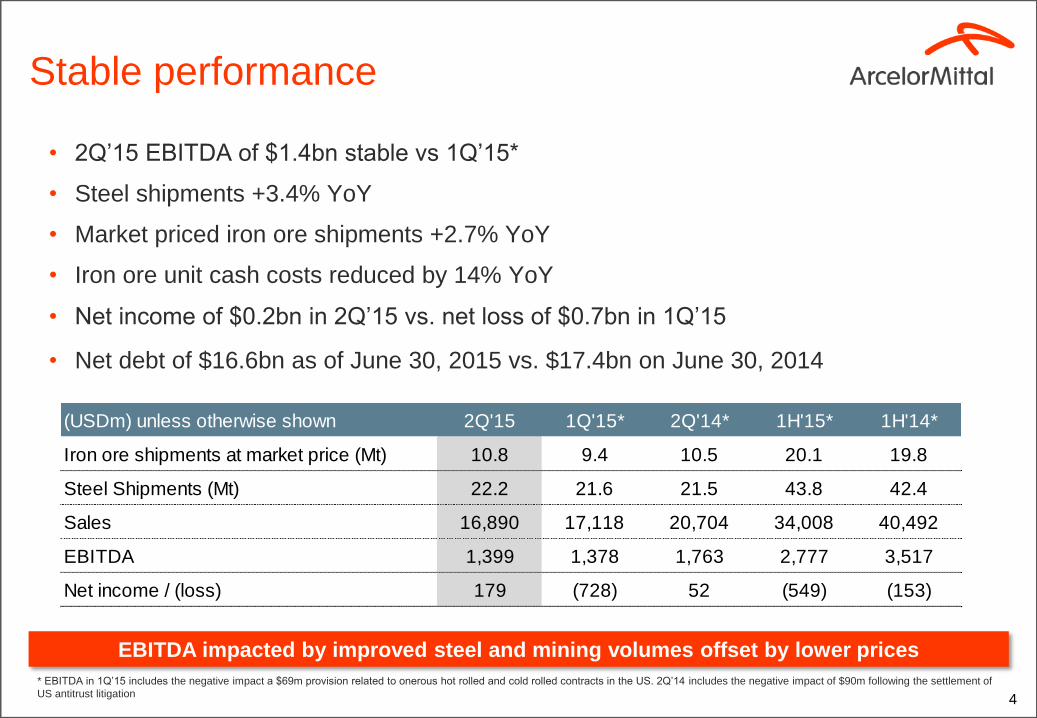
• 2Q’15 EBITDA of $1.4bn stable vs 1Q’15*
• Steel shipments +3.4% YoY
• Market priced iron ore shipments +2.7% YoY
• Iron ore unit cash costs reduced by 14% YoY
• Net income of $0.2bn in 2Q’15 vs. net loss of $0.7bn in 1Q’15
• Net debt of $16.6bn as of June 30, 2015 vs. $17.4bn on June 30, 2014
EBITDA impacted by improved steel and mining volumes offset by lower prices
* EBITDA in 1Q’15 includes the negative impact a $69m provision related to onerous hot rolled and cold rolled contracts in the US. 2Q’14 includes the negative impact of $90m following the settlement of
US antitrust litigation
Stable performance
(USDm) unless otherwise shown 2Q'15 1Q'15* 2Q'14* 1H'15* 1H'14*
Iron ore shipments at market price (Mt) 10.8 9.4 10.5 20.1 19.8
Steel Shipments (Mt) 22.2 21.6 21.5 43.8 42.4
Sales 16,890 17,118 20,704 34,008 40,492
EBITDA 1,399 1,378 1,763 2,777 3,517
Net income / (loss) 179 (728) 52 (549) (153)
5
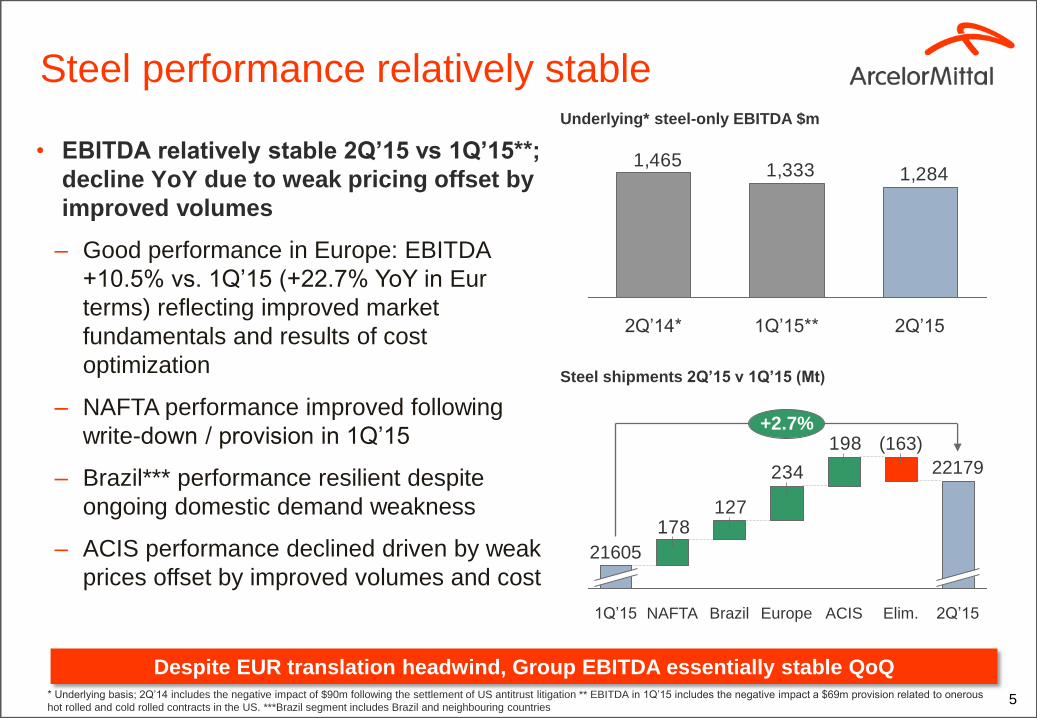
Steel performance relatively stable Underlying* steel-only EBITDA $m
1,2841,3331,465
2Q’15 1Q’15** 2Q’14*
* Underlying basis; 2Q’14 includes the negative impact of $90m following the settlement of US antitrust litigation ** EBITDA in 1Q’15 includes the negative impact a $69m provision related to onerous
hot rolled and cold rolled contracts in the US. ***Brazil segment includes Brazil and neighbouring countries
• EBITDA relatively stable 2Q’15 vs 1Q’15**;
decline YoY due to weak pricing offset by
improved volumes
‒ Good performance in Europe: EBITDA
+10.5% vs. 1Q’15 (+22.7% YoY in Eur
terms) reflecting improved market
fundamentals and results of cost
optimization
‒ NAFTA performance improved following
write-down / provision in 1Q’15
‒ Brazil*** performance resilient despite
ongoing domestic demand weakness
‒ ACIS performance declined driven by weak
prices offset by improved volumes and cost
Despite EUR translation headwind, Group EBITDA essentially stable QoQ
127
198
234
178
2Q’15
+2.7%
22179
Elim.
(163)
ACIS Europe Brazil NAFTA 1Q’15
21605
Steel shipments 2Q’15 v 1Q’15 (Mt)
6
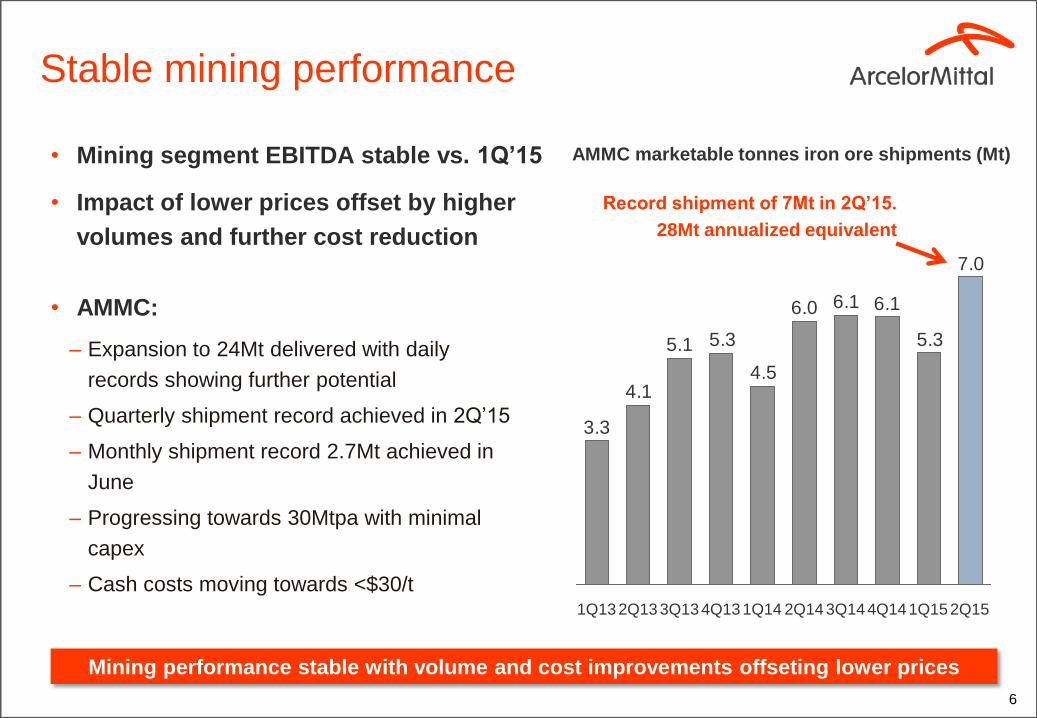
Stable mining performance
• Mining segment EBITDA stable vs. 1Q’15
• Impact of lower prices offset by higher
volumes and further cost reduction
Mining performance stable with volume and cost improvements offseting lower prices
7.0
5.3
6.16.16.0
4.5
5.35.1
4.1
3.3
1Q13 2Q13 3Q13 2Q14 1Q14 4Q13 3Q14 4Q14 1Q15 2Q15
• AMMC:
‒ Expansion to 24Mt delivered with daily
records showing further potential
‒ Quarterly shipment record achieved in 2Q’15
‒ Monthly shipment record 2.7Mt achieved in
June
‒ Progressing towards 30Mtpa with minimal
capex
‒ Cash costs moving towards <$30/t
AMMC marketable tonnes iron ore shipments (Mt)
Record shipment of 7Mt in 2Q’15.
28Mt annualized equivalent
7
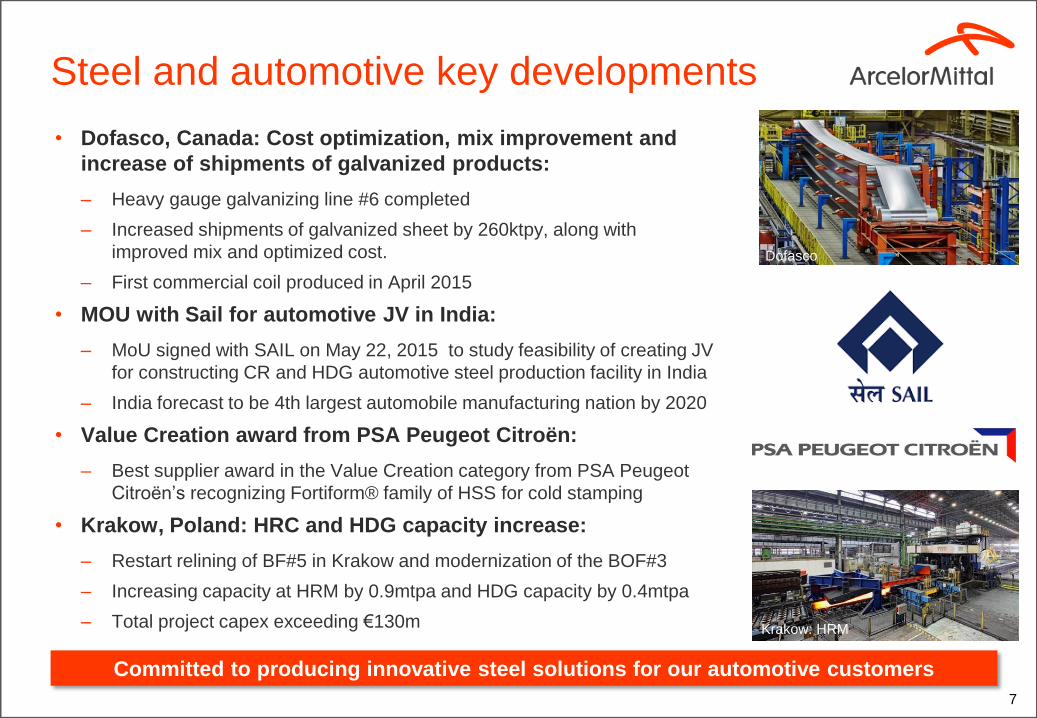
• Dofasco, Canada: Cost optimization, mix improvement and
increase of shipments of galvanized products:
– Heavy gauge galvanizing line #6 completed
– Increased shipments of galvanized sheet by 260ktpy, along with
improved mix and optimized cost.
– First commercial coil produced in April 2015
• MOU with Sail for automotive JV in India:
– MoU signed with SAIL on May 22, 2015 to study feasibility of creating JV
for constructing CR and HDG automotive steel production facility in India
– India forecast to be 4th largest automobile manufacturing nation by 2020
• Value Creation award from PSA Peugeot Citroën:
– Best supplier award in the Value Creation category from PSA Peugeot
Citroën’s recognizing Fortiform® family of HSS for cold stamping
• Krakow, Poland: HRC and HDG capacity increase:
– Restart relining of BF#5 in Krakow and modernization of the BOF#3
– Increasing capacity at HRM by 0.9mtpa and HDG capacity by 0.4mtpa
– Total project capex exceeding €130m
Committed to producing innovative steel solutions for our automotive customers
Steel and automotive key developments
Krakow: HRM
Dofasco
8
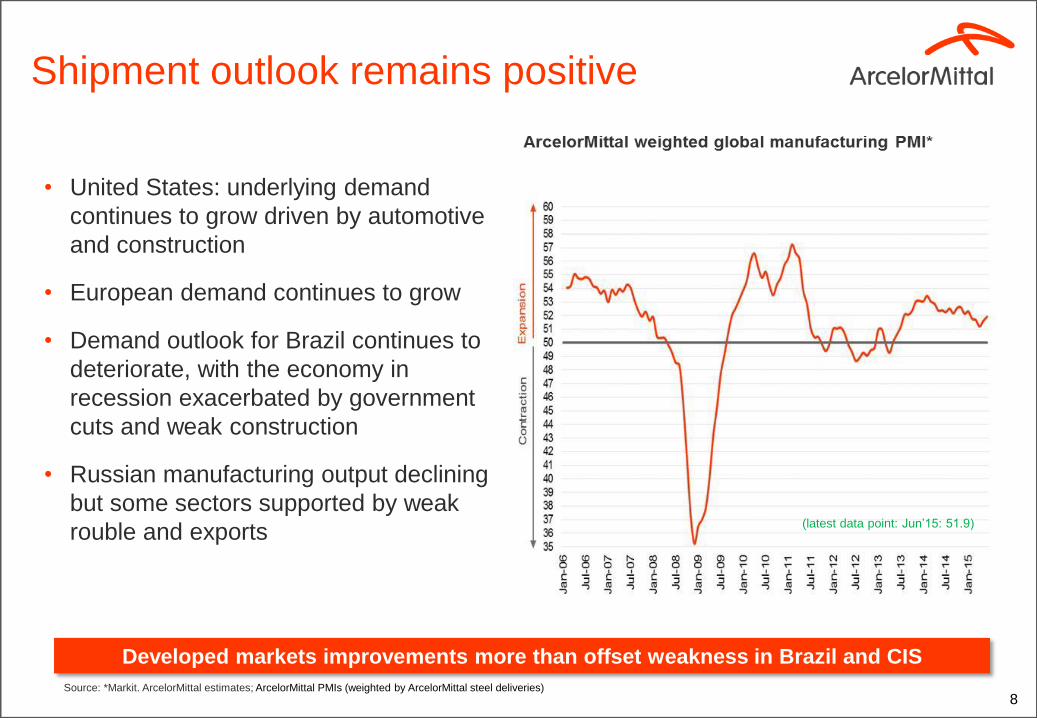
• United States: underlying demand
continues to grow driven by automotive
and construction
• European demand continues to grow
• Demand outlook for Brazil continues to
deteriorate, with the economy in
recession exacerbated by government
cuts and weak construction
• Russian manufacturing output declining
but some sectors supported by weak
rouble and exports
Shipment outlook remains positive
Source: *Markit. ArcelorMittal estimates; ArcelorMittal PMIs (weighted by ArcelorMittal steel deliveries)
Developed markets improvements more than offset weakness in Brazil and CIS
(latest data point: Jun’15: 51.9)

9
Global apparent steel consumption (ASC) 2015 v 2014*
* ArcelorMittal estimates
Brazil -11% to -13%
China -1% to 0%
EU28 +1.5% to +2.5%
US -3% to -4%
Global +0%
CIS -8% to -10%
2015 outlook
ArcelorMittal steel shipments (Mt)
+3.2%
1H’15
43.8
1H’14
42.4
+3-5%
FY’14 FY’15F
85.1
2015 global ASC forecast stable; but geographical product mix supports shipment growth
US ASC: 2H’15 v 1H’15 +2% to +3%
Financial results
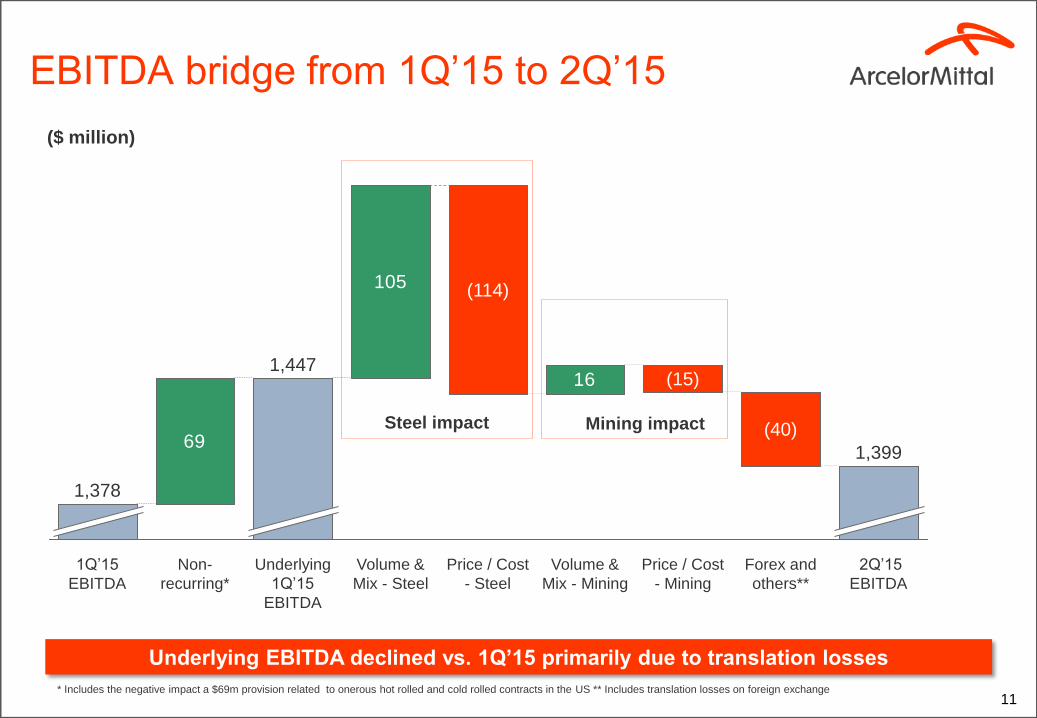
11 * Includes the negative impact a $69m provision related to onerous hot rolled and cold rolled contracts in the US ** Includes translation losses on foreign exchange
EBITDA bridge from 1Q’15 to 2Q’15
($ million)
16
105
69
Forex and
others**
(40)
Price / Cost
- Mining
(15)
Volume &
Mix - Mining
Price / Cost
- Steel
(114)
Volume &
Mix - Steel
Underlying
1Q’15
EBITDA
1,447
Non-
recurring*
1,399
2Q’15
EBITDA
1Q’15
EBITDA
1,378
Underlying EBITDA declined vs. 1Q’15 primarily due to translation losses
Mining impact Steel impact
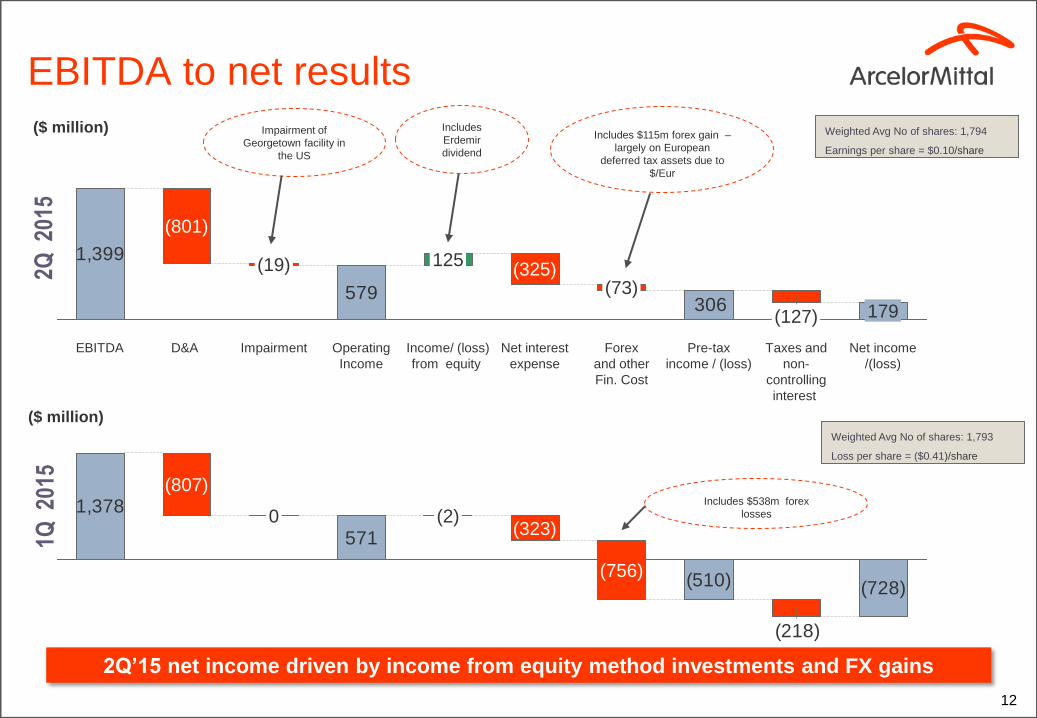
12
EBITDA to net results
2Q’15 net income driven by income from equity method investments and FX gains
Impairment of
Georgetown facility in
the US
306579
1,399
Net income
/(loss)
179
Taxes and
non-
controlling
interest
(127)
Pre-tax
income / (loss)
Forex
and other
Fin. Cost
(73)
Net interest
expense
(325)
Income/ (loss)
from equity
125
Operating
Income
Impairment
(19)
D&A
(801)
EBITDA
2Q 2
015
Weighted Avg No of shares: 1,794
Earnings per share = $0.10/share
($ million) Includes $115m forex gain –
largely on European
deferred tax assets due to
$/Eur
1,378
(510) (728)
(218)
571
(756)
(323) (2) 0
(807)
1Q 2
015
Weighted Avg No of shares: 1,793
Loss per share = ($0.41)/share
($ million)
Includes $538m forex
losses
Includes
Erdemir
dividend
13
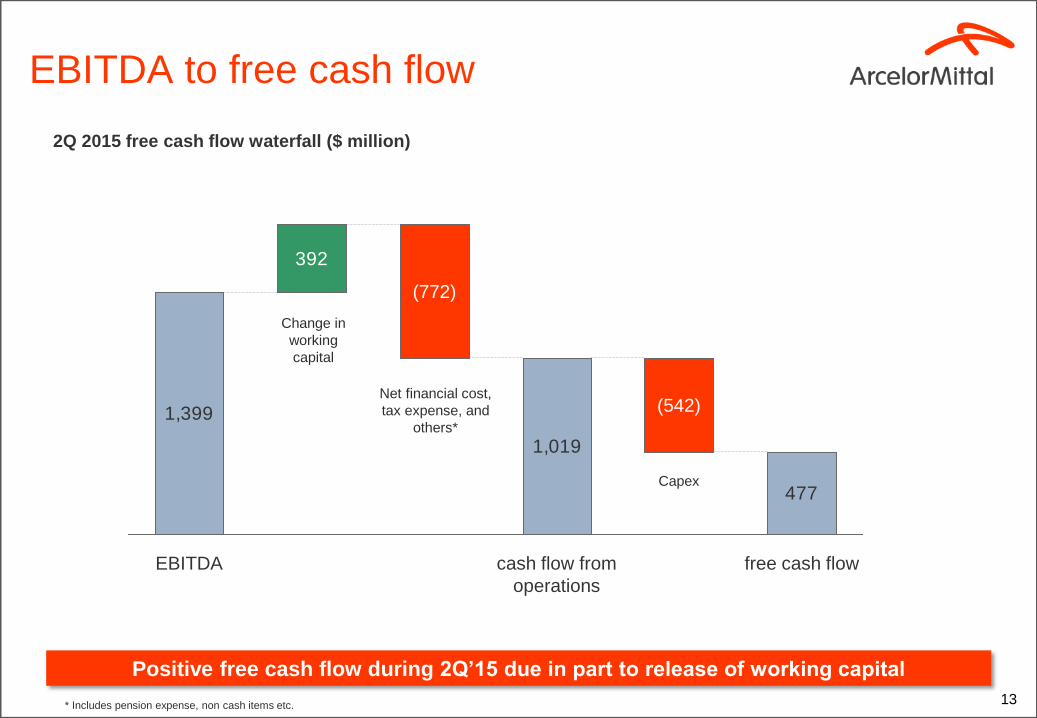
EBITDA to free cash flow
2Q 2015 free cash flow waterfall ($ million)
1,399
1,019
477
392
(542)
free cash flow cash flow from
operations
(772)
EBITDA
Change in
working
capital
Net financial cost,
tax expense, and
others*
Capex
* Includes pension expense, non cash items etc.
Positive free cash flow during 2Q’15 due in part to release of working capital
14
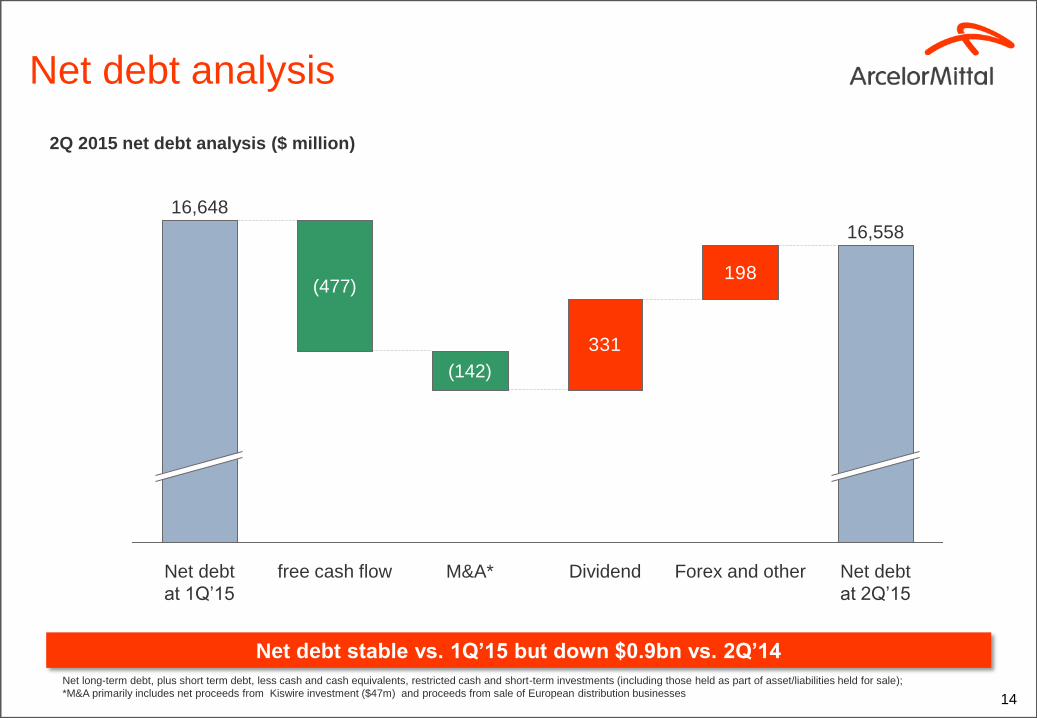
Net debt analysis
2Q 2015 net debt analysis ($ million)
198
331
Forex and other Dividend M&A*
(142)
Net debt
at 2Q’15
16,558
free cash flow
(477)
Net debt
at 1Q’15
16,648
Net long-term debt, plus short term debt, less cash and cash equivalents, restricted cash and short-term investments (including those held as part of asset/liabilities held for sale);
*M&A primarily includes net proceeds from Kiswire investment ($47m) and proceeds from sale of European distribution businesses
Net debt stable vs. 1Q’15 but down $0.9bn vs. 2Q’14
15
Outlook and guidance
• The Company continues to expect:
– 2015 EBITDA within the range of $6.0 - $7.0 billion;
– 2015 capital expenditures of approximately $3.0 billion; and
– 2015 net interest expense of approximately $1.4 billion
• Importantly, the Company continues to expect positive free cash flow in 2015 and
to achieve progress towards the medium term net debt target of $15 billion.
Guidance unchanged
Appendix
Selective steel projects: Europe: ArcelorMittal Krakow Poland
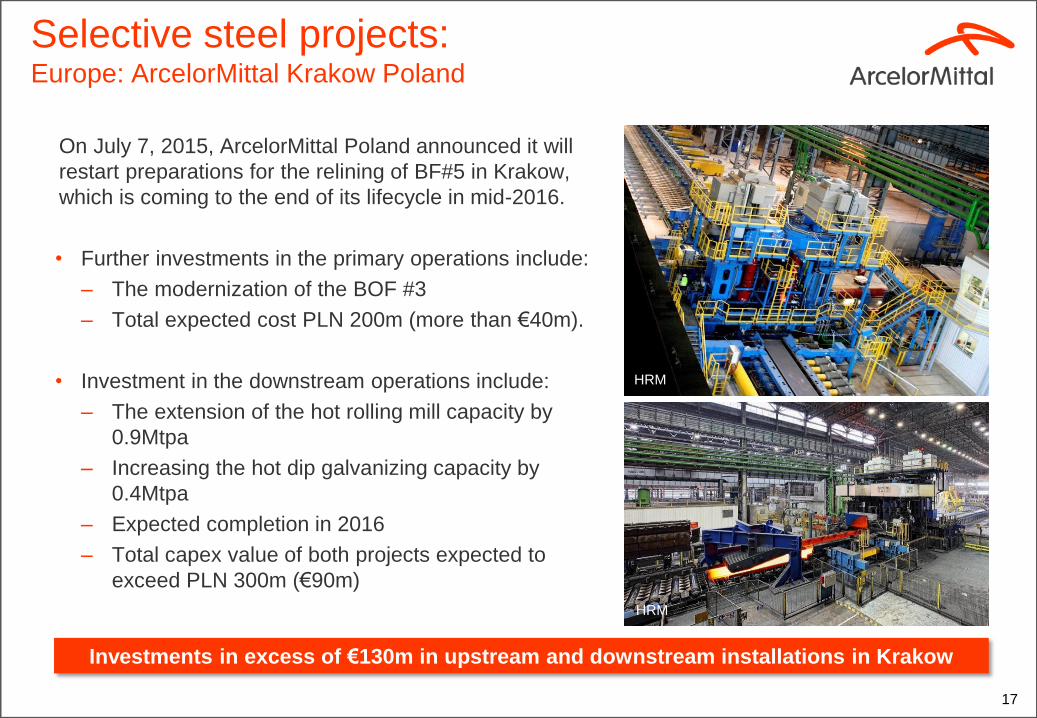
On July 7, 2015, ArcelorMittal Poland announced it will
restart preparations for the relining of BF#5 in Krakow,
which is coming to the end of its lifecycle in mid-2016.
• Further investments in the primary operations include:
– The modernization of the BOF #3
– Total expected cost PLN 200m (more than €40m).
• Investment in the downstream operations include:
– The extension of the hot rolling mill capacity by
0.9Mtpa
– Increasing the hot dip galvanizing capacity by
0.4Mtpa
– Expected completion in 2016
– Total capex value of both projects expected to
exceed PLN 300m (€90m)
17 17
Investments in excess of €130m in upstream and downstream installations in Krakow
HRM Krakow
HRM
HRM
Selective steel projects: Dofasco (NAFTA)
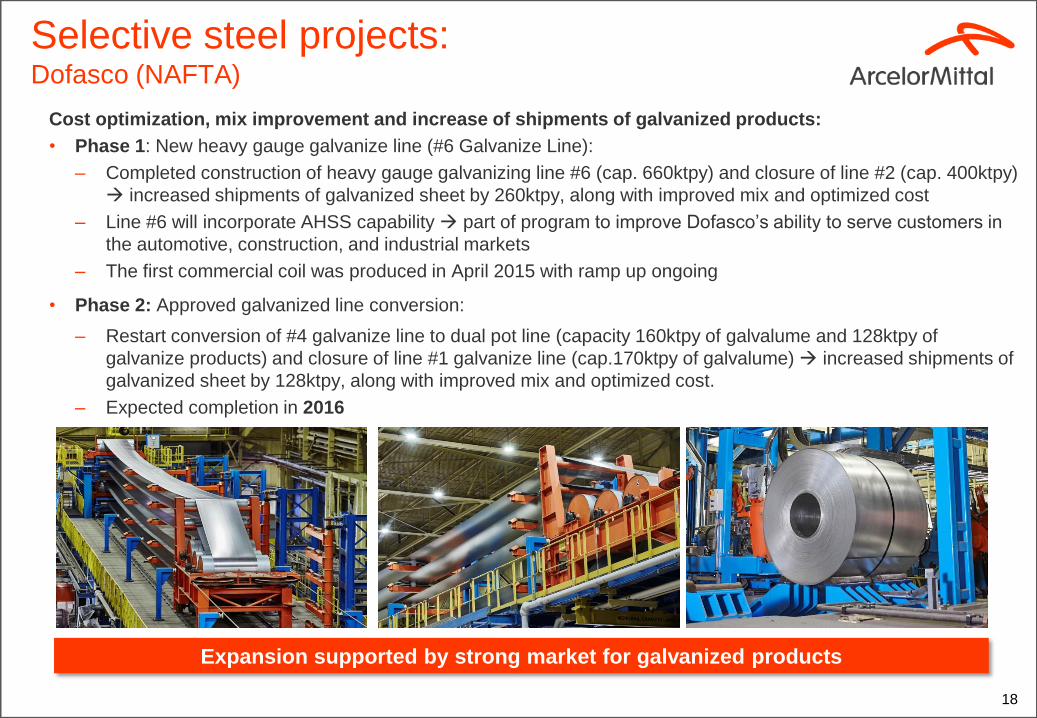
Cost optimization, mix improvement and increase of shipments of galvanized products:
• Phase 1: New heavy gauge galvanize line (#6 Galvanize Line):
– Completed construction of heavy gauge galvanizing line #6 (cap. 660ktpy) and closure of line #2 (cap. 400ktpy)
increased shipments of galvanized sheet by 260ktpy, along with improved mix and optimized cost
– Line #6 will incorporate AHSS capability part of program to improve Dofasco’s ability to serve customers in
the automotive, construction, and industrial markets
– The first commercial coil was produced in April 2015 with ramp up ongoing
• Phase 2: Approved galvanized line conversion:
– Restart conversion of #4 galvanize line to dual pot line (capacity 160ktpy of galvalume and 128ktpy of
galvanize products) and closure of line #1 galvanize line (cap.170ktpy of galvalume) increased shipments of
galvanized sheet by 128ktpy, along with improved mix and optimized cost.
– Expected completion in 2016
18
Expansion supported by strong market for galvanized products
Temper mill
18
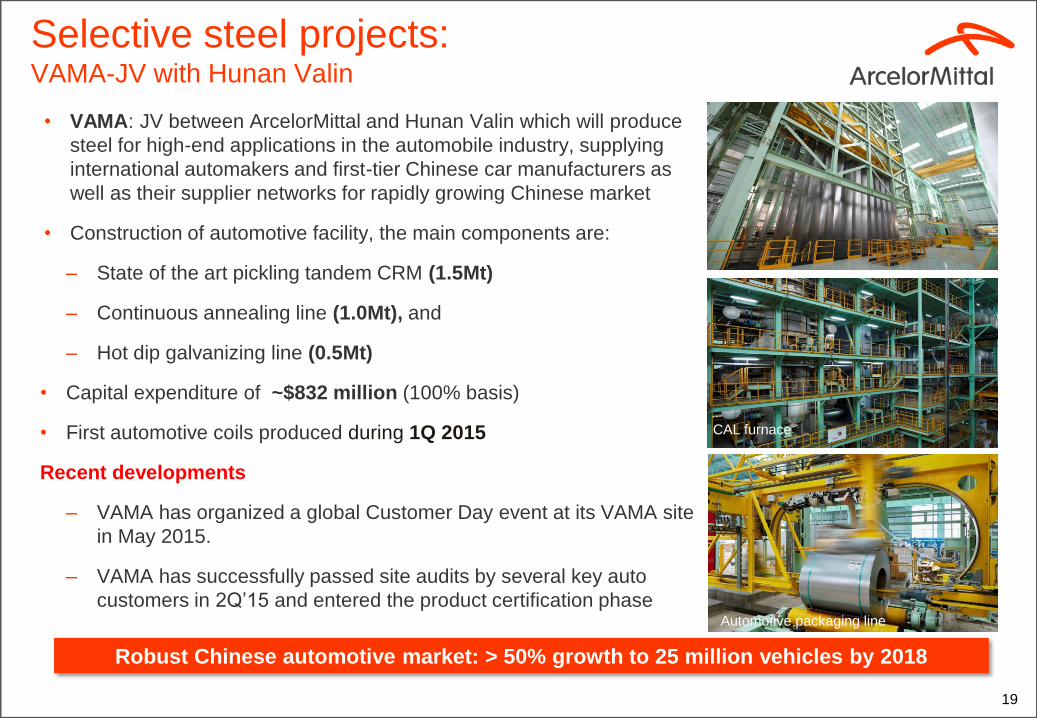
Selective steel projects: VAMA-JV with Hunan Valin
• VAMA: JV between ArcelorMittal and Hunan Valin which will produce
steel for high-end applications in the automobile industry, supplying
international automakers and first-tier Chinese car manufacturers as
well as their supplier networks for rapidly growing Chinese market
• Construction of automotive facility, the main components are:
– State of the art pickling tandem CRM (1.5Mt)
– Continuous annealing line (1.0Mt), and
– Hot dip galvanizing line (0.5Mt)
• Capital expenditure of ~$832 million (100% basis)
• First automotive coils produced during 1Q 2015
Recent developments
– VAMA has organized a global Customer Day event at its VAMA site
in May 2015.
– VAMA has successfully passed site audits by several key auto
customers in 2Q’15 and entered the product certification phase
19 19
Robust Chinese automotive market: > 50% growth to 25 million vehicles by 2018
CAL furnace
Automotive packaging line
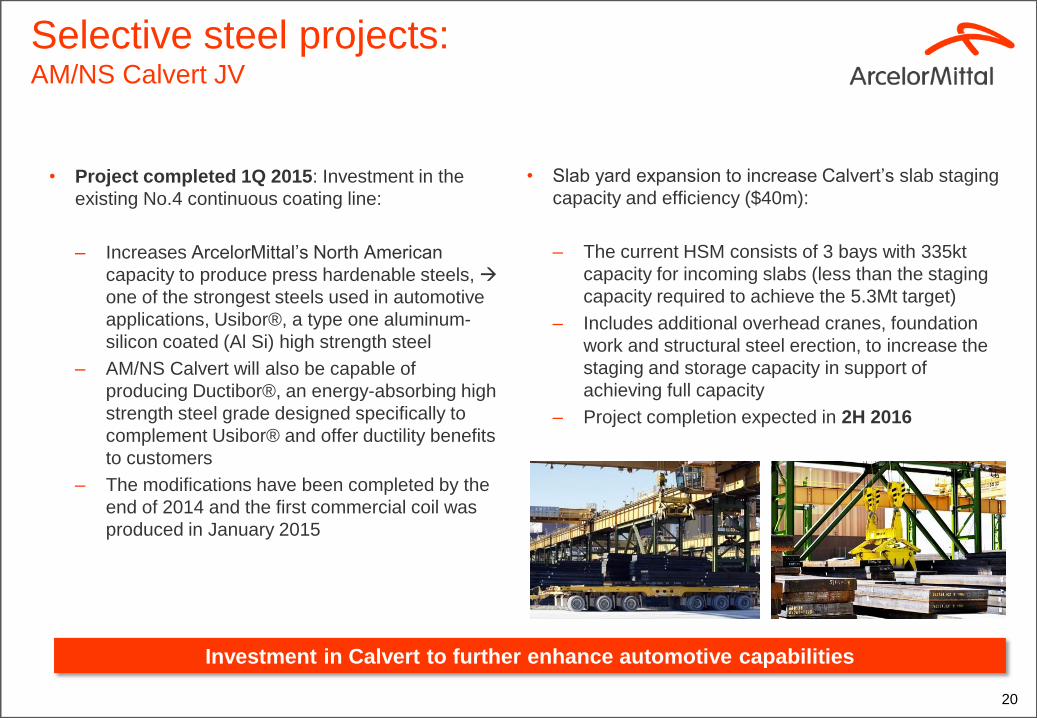
• Slab yard expansion to increase Calvert’s slab staging
capacity and efficiency ($40m):
– The current HSM consists of 3 bays with 335kt
capacity for incoming slabs (less than the staging
capacity required to achieve the 5.3Mt target)
– Includes additional overhead cranes, foundation
work and structural steel erection, to increase the
staging and storage capacity in support of
achieving full capacity
– Project completion expected in 2H 2016
• Project completed 1Q 2015: Investment in the
existing No.4 continuous coating line:
– Increases ArcelorMittal’s North American
capacity to produce press hardenable steels,
one of the strongest steels used in automotive
applications, Usibor®, a type one aluminum-
silicon coated (Al Si) high strength steel
– AM/NS Calvert will also be capable of
producing Ductibor®, an energy-absorbing high
strength steel grade designed specifically to
complement Usibor® and offer ductility benefits
to customers
– The modifications have been completed by the
end of 2014 and the first commercial coil was
produced in January 2015
20 20
Investment in Calvert to further enhance automotive capabilities
Selective steel projects: AM/NS Calvert JV
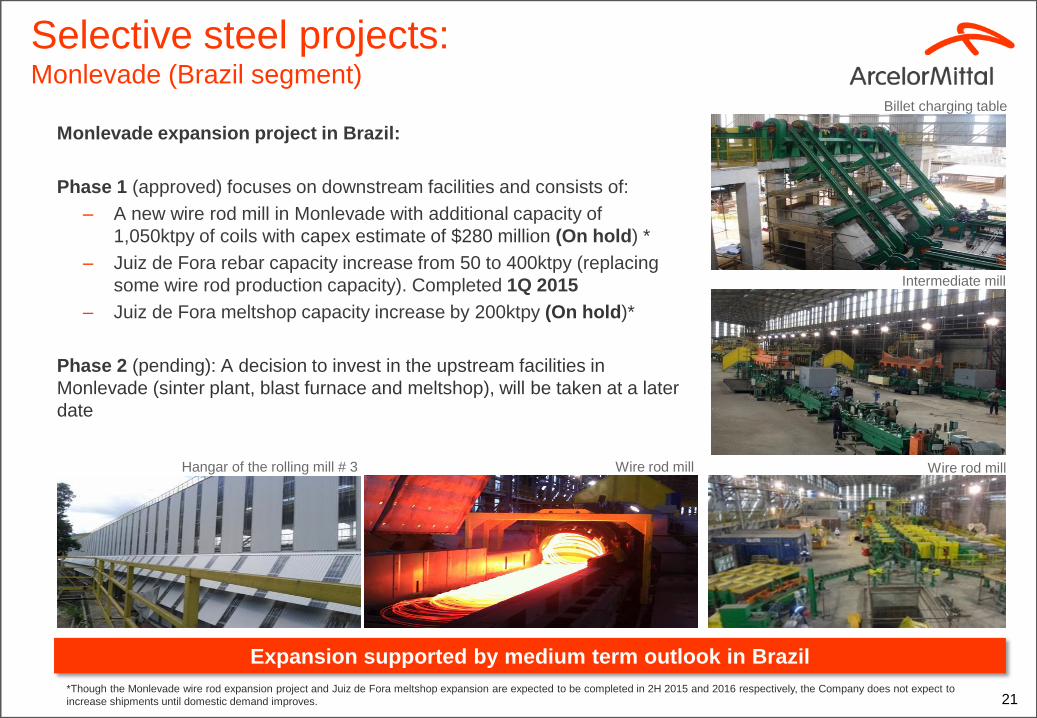
Monlevade expansion project in Brazil:
Phase 1 (approved) focuses on downstream facilities and consists of:
– A new wire rod mill in Monlevade with additional capacity of
1,050ktpy of coils with capex estimate of $280 million (On hold) *
– Juiz de Fora rebar capacity increase from 50 to 400ktpy (replacing
some wire rod production capacity). Completed 1Q 2015
– Juiz de Fora meltshop capacity increase by 200ktpy (On hold)*
Phase 2 (pending): A decision to invest in the upstream facilities in
Monlevade (sinter plant, blast furnace and meltshop), will be taken at a later
date
21
Selective steel projects: Monlevade (Brazil segment)
Expansion supported by medium term outlook in Brazil
Hangar of the rolling mill # 3
Intermediate mill
Wire rod mill
Billet charging table
Wire rod mill
*Though the Monlevade wire rod expansion project and Juiz de Fora meltshop expansion are expected to be completed in 2H 2015 and 2016 respectively, the Company does not expect to
increase shipments until domestic demand improves.

New rolling mill at Acindar (Argentina):
• New rolling mill (Huatian) in Santa Fe province to increase rebar
capacity by 0.4mt/year for civil construction market:
– New rolling mill will also enable Acindar to optimize production at
its special bar quality (SBQ) rolling mill in Villa Constitución,
which in future will only manufacture products for the automotive
and mining industries
• Estimated capital expenditure of ~$100m
• Estimated completion in 2016
22 22
Selective steel projects: Acindar (Brazil segment)
Expansion supported by construction market in Argentina
Plant overview
Plant overview
Reheating Furnace Cooling Bed New Building
23
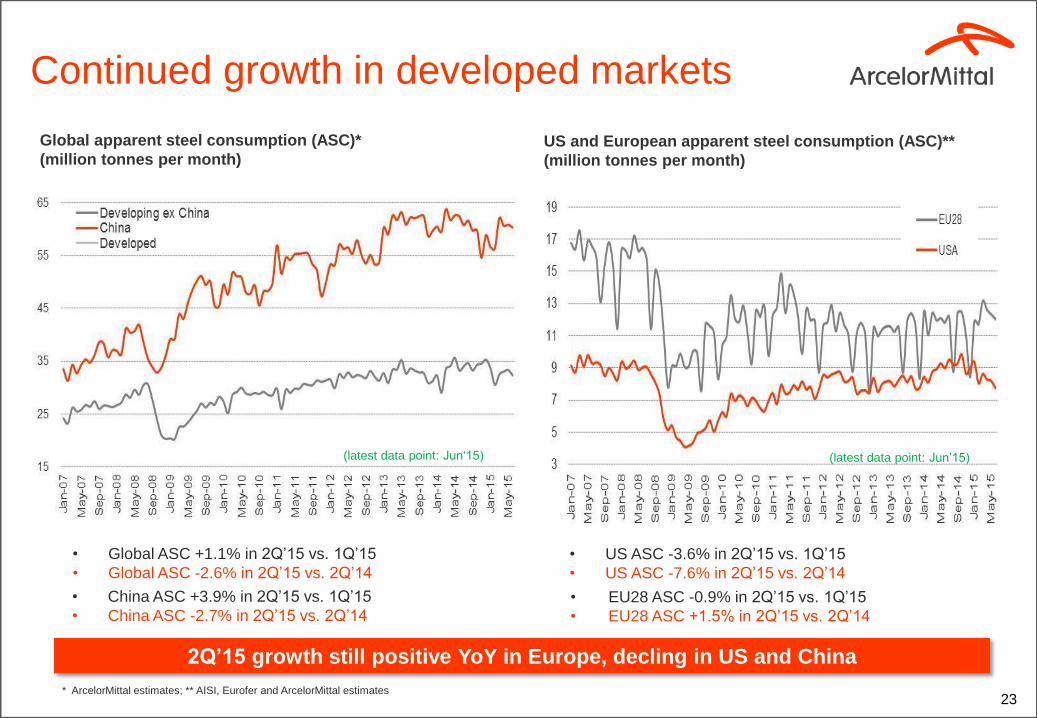
Continued growth in developed markets
Global apparent steel consumption (ASC)*
(million tonnes per month) US and European apparent steel consumption (ASC)**
(million tonnes per month)
* ArcelorMittal estimates; ** AISI, Eurofer and ArcelorMittal estimates
• China ASC +3.9% in 2Q’15 vs. 1Q’15
• China ASC -2.7% in 2Q’15 vs. 2Q’14 • EU28 ASC -0.9% in 2Q’15 vs. 1Q’15
• EU28 ASC +1.5% in 2Q’15 vs. 2Q’14
• Global ASC +1.1% in 2Q’15 vs. 1Q’15
• Global ASC -2.6% in 2Q’15 vs. 2Q’14
• US ASC -3.6% in 2Q’15 vs. 1Q’15
• US ASC -7.6% in 2Q’15 vs. 2Q’14
2Q’15 growth still positive YoY in Europe, decling in US and China
(latest data point: Jun’15) (latest data point: Jun‘15)
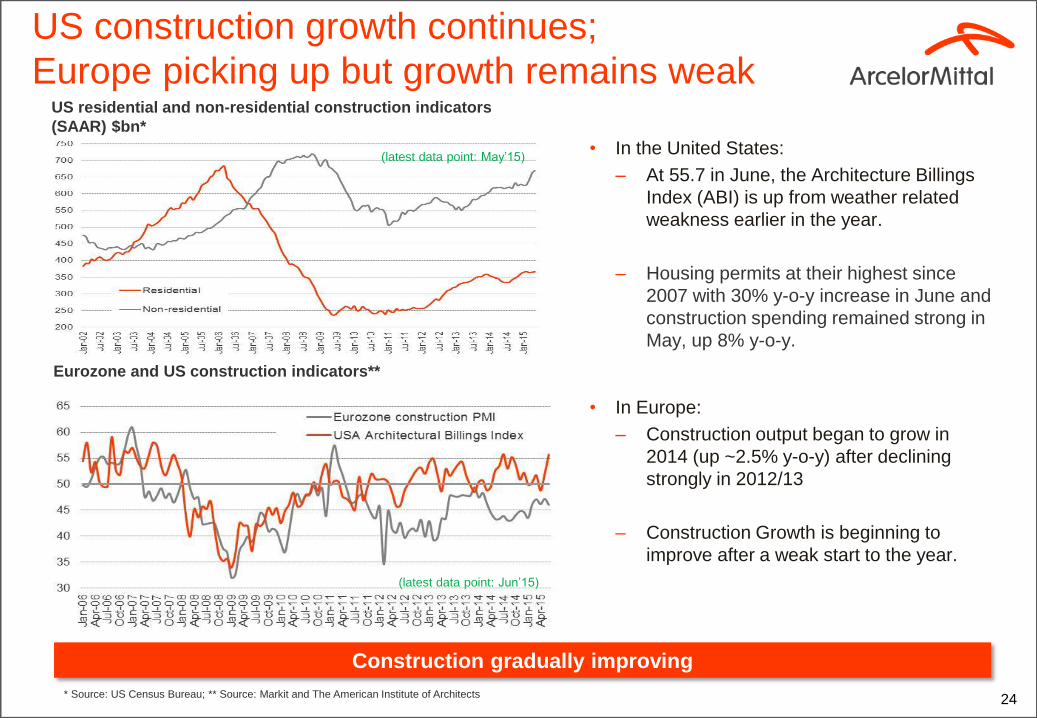
US construction growth continues;
Europe picking up but growth remains weak
• In the United States:
– At 55.7 in June, the Architecture Billings
Index (ABI) is up from weather related
weakness earlier in the year.
– Housing permits at their highest since
2007 with 30% y-o-y increase in June and
construction spending remained strong in
May, up 8% y-o-y.
• In Europe:
– Construction output began to grow in
2014 (up ~2.5% y-o-y) after declining
strongly in 2012/13
– Construction Growth is beginning to
improve after a weak start to the year.
US residential and non-residential construction indicators
(SAAR) $bn*
24 * Source: US Census Bureau; ** Source: Markit and The American Institute of Architects
Eurozone and US construction indicators**
(latest data point: Jun’15)
Construction gradually improving
(latest data point: May’15)
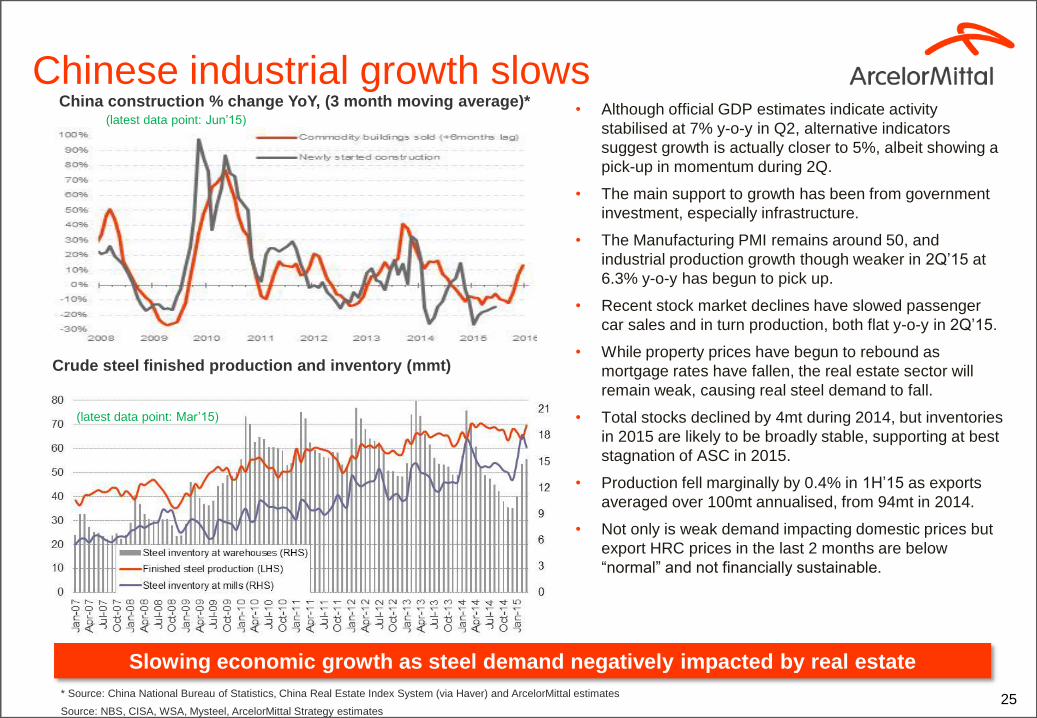
Chinese industrial growth slows • Although official GDP estimates indicate activity
stabilised at 7% y-o-y in Q2, alternative indicators
suggest growth is actually closer to 5%, albeit showing a
pick-up in momentum during 2Q.
• The main support to growth has been from government
investment, especially infrastructure.
• The Manufacturing PMI remains around 50, and
industrial production growth though weaker in 2Q’15 at
6.3% y-o-y has begun to pick up.
• Recent stock market declines have slowed passenger
car sales and in turn production, both flat y-o-y in 2Q’15.
• While property prices have begun to rebound as
mortgage rates have fallen, the real estate sector will
remain weak, causing real steel demand to fall.
• Total stocks declined by 4mt during 2014, but inventories
in 2015 are likely to be broadly stable, supporting at best
stagnation of ASC in 2015.
• Production fell marginally by 0.4% in 1H’15 as exports
averaged over 100mt annualised, from 94mt in 2014.
• Not only is weak demand impacting domestic prices but
export HRC prices in the last 2 months are below
“normal” and not financially sustainable.
25
Crude steel finished production and inventory (mmt)
* Source: China National Bureau of Statistics, China Real Estate Index System (via Haver) and ArcelorMittal estimates
Source: NBS, CISA, WSA, Mysteel, ArcelorMittal Strategy estimates
China construction % change YoY, (3 month moving average)*
Slowing economic growth as steel demand negatively impacted by real estate
(latest data point: Feb/Mar’15)
(latest data point: Jun’15)
(latest data point: Mar’15)
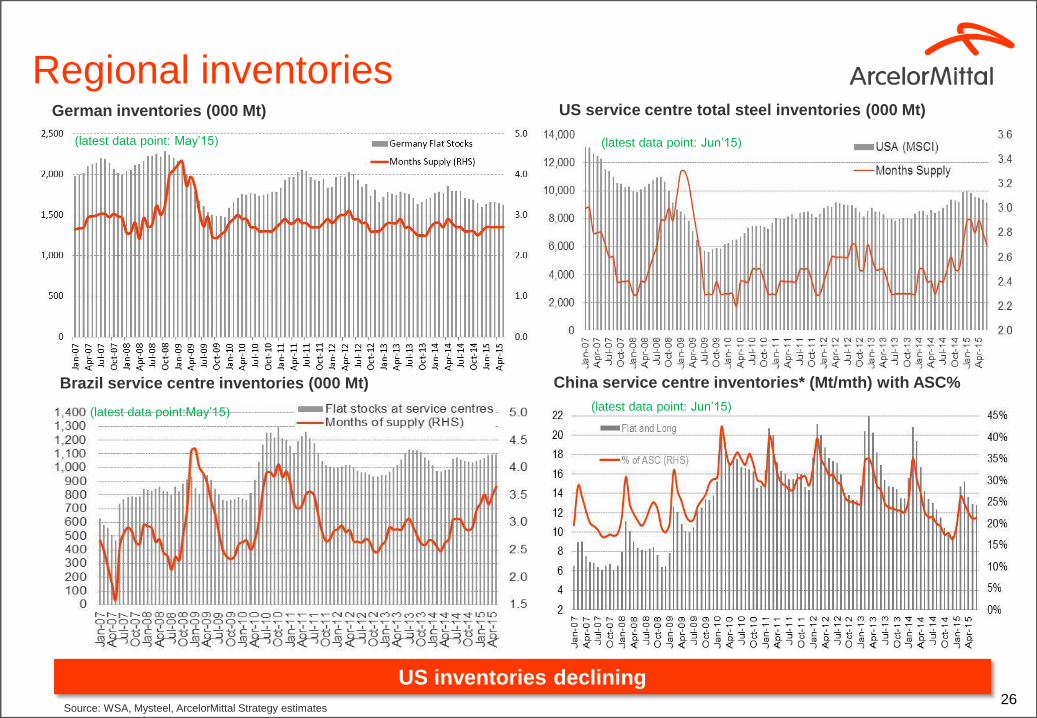
Regional inventories German inventories (000 Mt)
26
China service centre inventories* (Mt/mth) with ASC% Brazil service centre inventories (000 Mt)
US service centre total steel inventories (000 Mt)
Source: WSA, Mysteel, ArcelorMittal Strategy estimates
US inventories declining
(latest data point:May’15)
(latest data point: Jun’15) (latest data point: May’15)
(latest data point: Jun’15)
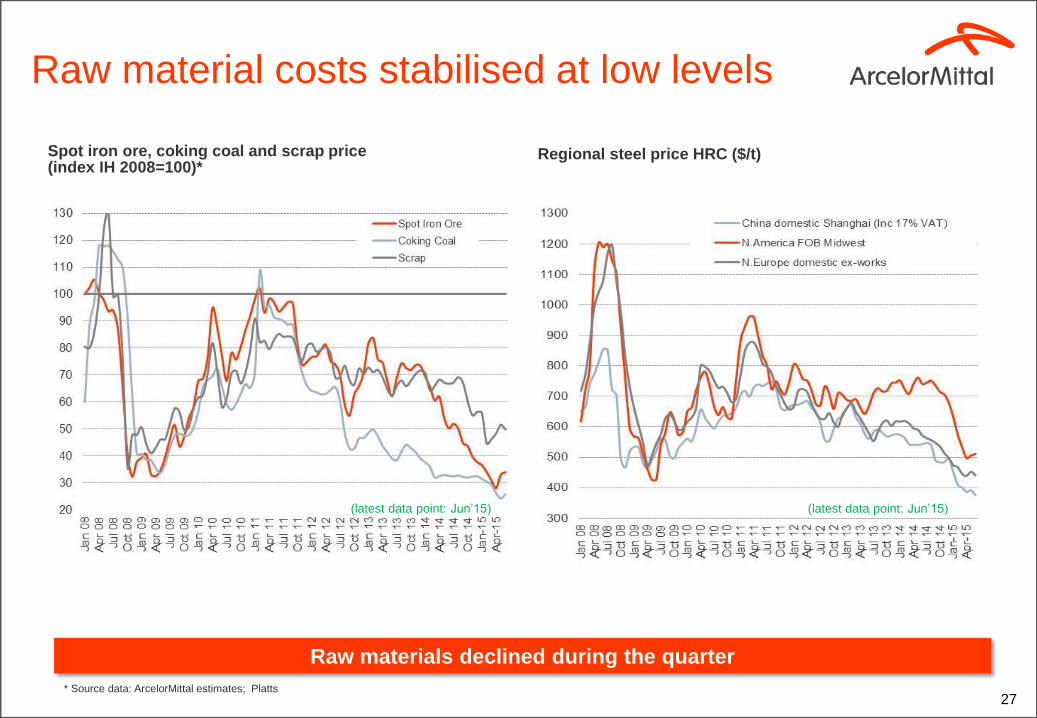
Raw material costs stabilised at low levels
Spot iron ore, coking coal and scrap price (index IH 2008=100)*
Regional steel price HRC ($/t)
27
Raw materials declined during the quarter
* Source data: ArcelorMittal estimates; Platts
(latest data point: Jun’15) (latest data point: Jun’15)

28
Net debt ($ billion) Average maturity (years)
Liquidity ($ billion) Bank debt as component of total debt (%)
Balance sheet structurally improved
16.6
32.5
3Q 2008 2Q 2015
6.3
2.6
2Q 2015 3Q 2008
10.712.0
2Q 2015 3Q 2008 2Q 2015 3Q 2008
10%
84%
Balance sheet fundamentals improved
Net debt refers to long-term debt, plus short term debt, less cash and cash equivalents, restricted cash and short-term investments (including those held as part of asset/liabilities held for sale).

Working capital
29
OWCR and rotation days* ($ billion and days)
Business will invest in working capital as conditions necessitate
* Rotation days are defined as days of accounts receivable plus days of inventory minus days of accounts payable. Days of accounts payable and inventory are a function of cost of goods sold of the quarter on an annualized basis. Days of accounts receivable are a function of sales of the quarter on an annualized basis.
55
0
4
8
12
16
20
24
28
0
30
60
90
120
3Q
14
2Q
14
4Q
13
1Q
14
3Q
13
2Q
13
1Q
12
4Q
12
3Q
12
2Q
12
1Q
11
3Q
11
2Q
11
4Q
11
4Q
10
3Q
10
2Q
10
1Q
10
4Q
09
3Q
09
2Q
09
1Q
09
4Q
08
3Q
08
2Q
08
1Q
08
4Q
07
3Q
07
2Q
07
1Q
07
2Q
15
1Q
13
1Q
15
4Q
14
Rotation days - RHS Working capital ($ billion) - LHS
30
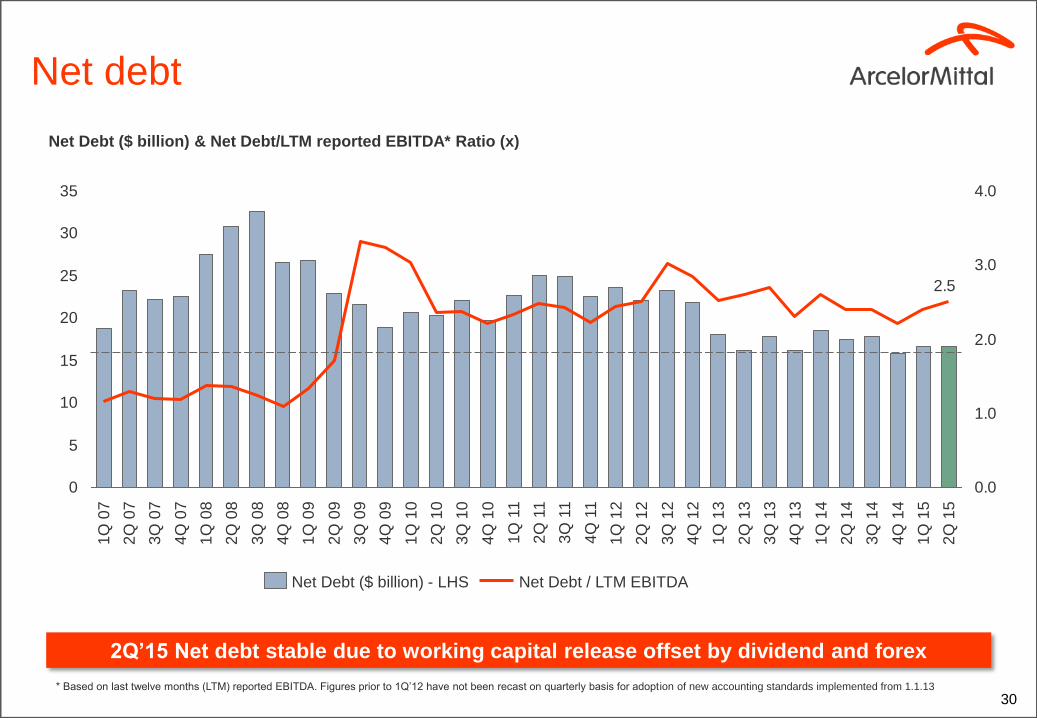
Net debt
Net Debt ($ billion) & Net Debt/LTM reported EBITDA* Ratio (x)
* Based on last twelve months (LTM) reported EBITDA. Figures prior to 1Q’12 have not been recast on quarterly basis for adoption of new accounting standards implemented from 1.1.13
2.5
0
5
10
15
20
25
30
35
0.0
1.0
2.0
3.0
4.0
3Q
12
2Q
12
1Q
12
4Q
11
3Q
11
2Q
11
1Q
11
4Q
10
3Q
10
2Q
10
1Q
10
4Q
09
3Q
09
2Q
09
1Q
09
4Q
08
2Q
15
2Q
08
1Q
08
4Q
07
3Q
07
2Q
07
1Q
07
1Q
15
4Q
14
3Q
14
2Q
14
1Q
14
4Q
13
3Q
13
2Q
13
1Q
13
4Q
12
3Q
08
Net Debt ($ billion) - LHS Net Debt / LTM EBITDA
2Q’15 Net debt stable due to working capital release offset by dividend and forex
Net debt
31
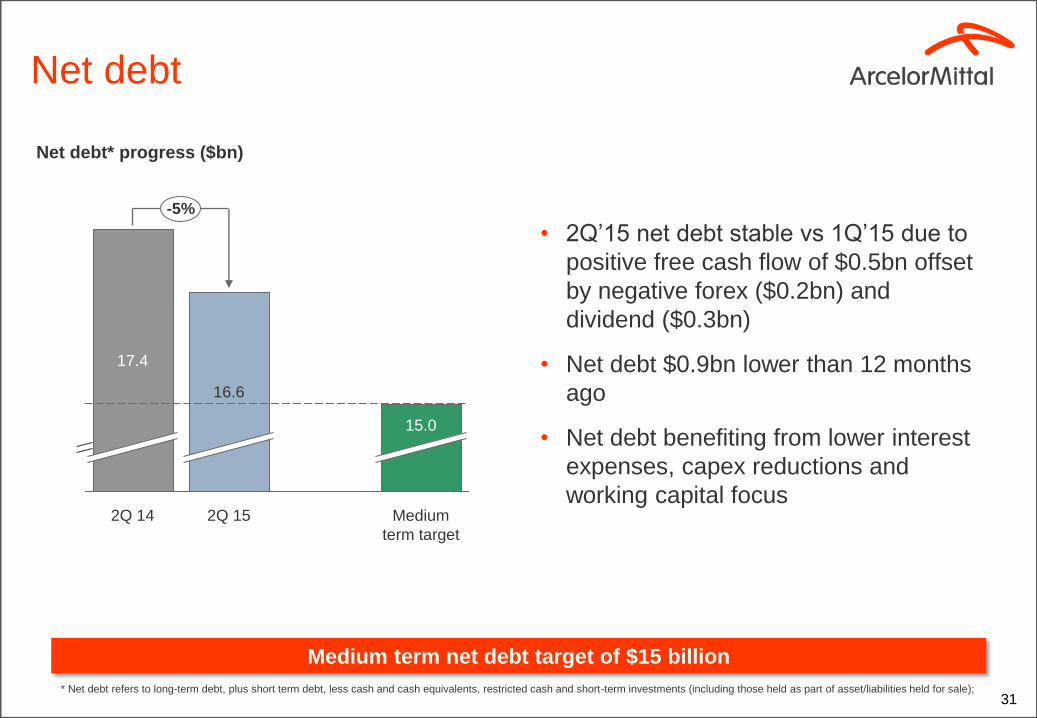
Medium term net debt target of $15 billion
• 2Q’15 net debt stable vs 1Q’15 due to
positive free cash flow of $0.5bn offset
by negative forex ($0.2bn) and
dividend ($0.3bn)
• Net debt $0.9bn lower than 12 months
ago
• Net debt benefiting from lower interest
expenses, capex reductions and
working capital focus
* Net debt refers to long-term debt, plus short term debt, less cash and cash equivalents, restricted cash and short-term investments (including those held as part of asset/liabilities held for sale);
Net debt* progress ($bn)
Medium
term target
-5%
2Q 14
16.6
2Q 15
15.0
17.4
32
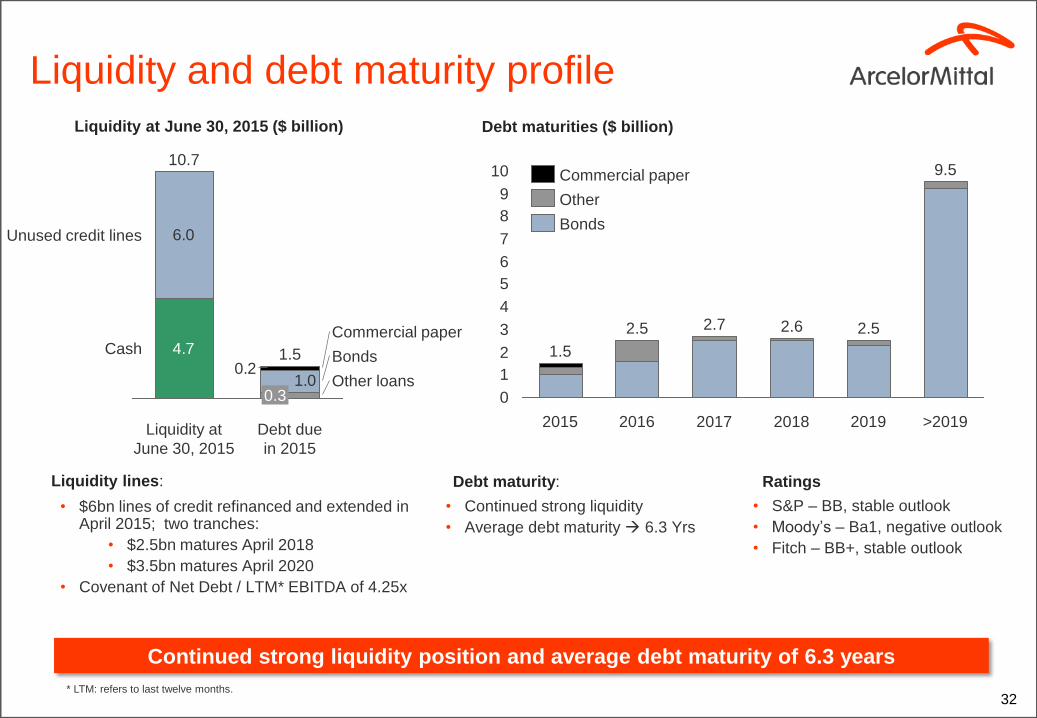
Liquidity and debt maturity profile
Debt maturities ($ billion) Liquidity at June 30, 2015 ($ billion)
Liquidity lines:
• $6bn lines of credit refinanced and extended in April 2015; two tranches:
• $2.5bn matures April 2018
• $3.5bn matures April 2020
• Covenant of Net Debt / LTM* EBITDA of 4.25x
• Continued strong liquidity
• Average debt maturity 6.3 Yrs
Debt maturity: Ratings
• S&P – BB, stable outlook
• Moody’s – Ba1, negative outlook
• Fitch – BB+, stable outlook
0
1
2
3
4
5
6
7
8
9
10
>2019
9.5
2019
2.5
2018
2.6
2017
2.7
2016
2.5
2015
1.5
Bonds
Other
Commercial paper
1.00.2
4.7
6.0
Other loans
Cash Bonds
Commercial paper
Unused credit lines
Debt due
in 2015
1.5
0.3
Liquidity at
June 30, 2015
10.7
Continued strong liquidity position and average debt maturity of 6.3 years
* LTM: refers to last twelve months.
33
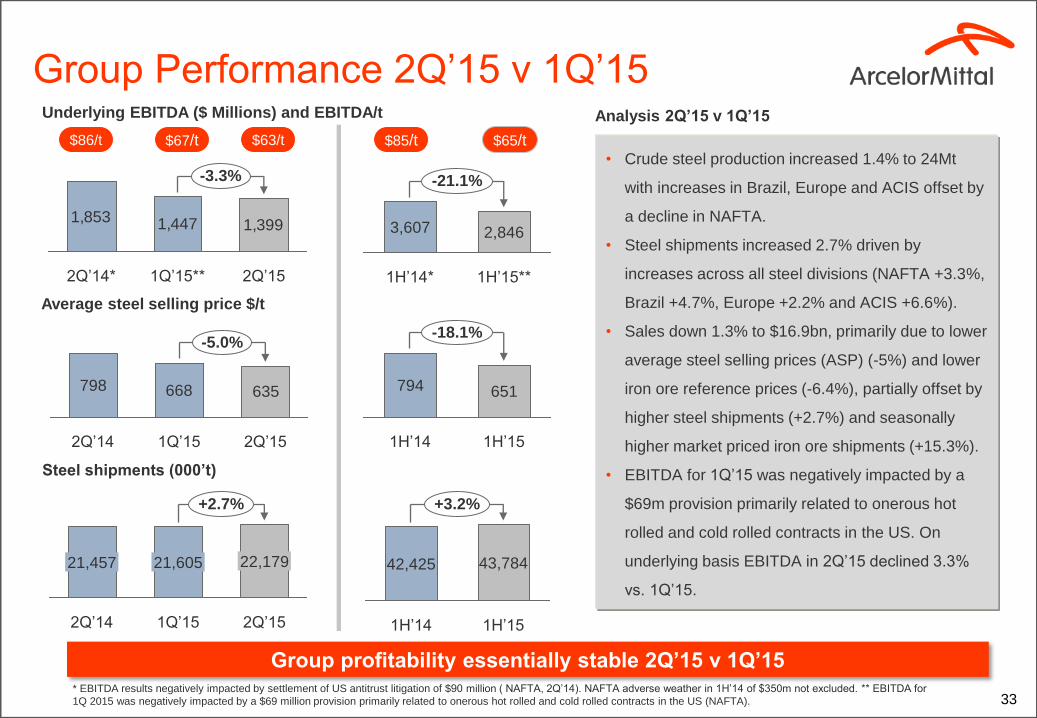
Group Performance 2Q’15 v 1Q’15
Average steel selling price $/t
* EBITDA results negatively impacted by settlement of US antitrust litigation of $90 million ( NAFTA, 2Q’14). NAFTA adverse weather in 1H’14 of $350m not excluded. ** EBITDA for
1Q 2015 was negatively impacted by a $69 million provision primarily related to onerous hot rolled and cold rolled contracts in the US (NAFTA).
• Crude steel production increased 1.4% to 24Mt
with increases in Brazil, Europe and ACIS offset by
a decline in NAFTA.
• Steel shipments increased 2.7% driven by
increases across all steel divisions (NAFTA +3.3%,
Brazil +4.7%, Europe +2.2% and ACIS +6.6%).
• Sales down 1.3% to $16.9bn, primarily due to lower
average steel selling prices (ASP) (-5%) and lower
iron ore reference prices (-6.4%), partially offset by
higher steel shipments (+2.7%) and seasonally
higher market priced iron ore shipments (+15.3%).
• EBITDA for 1Q’15 was negatively impacted by a
$69m provision primarily related to onerous hot
rolled and cold rolled contracts in the US. On
underlying basis EBITDA in 2Q’15 declined 3.3%
vs. 1Q’15.
Analysis 2Q’15 v 1Q’15
Steel shipments (000’t)
Underlying EBITDA ($ Millions) and EBITDA/t
798 668 635
-5.0%
2Q’15 1Q’15 2Q’14
+2.7%
2Q’15
22,179
1Q’15
21,605
2Q’14
21,457
1,853 1,447 1,399
-3.3%
2Q’15 1Q’15** 2Q’14*
Group profitability essentially stable 2Q’15 v 1Q’15
$86/t
+3.2%
1H’15
43,784
1H’14
42,425
-21.1%
1H’15**
2,846
1H’14*
3,607
794 651
-18.1%
1H’15 1H’14
$67/t $85/t $65/t $63/t
34
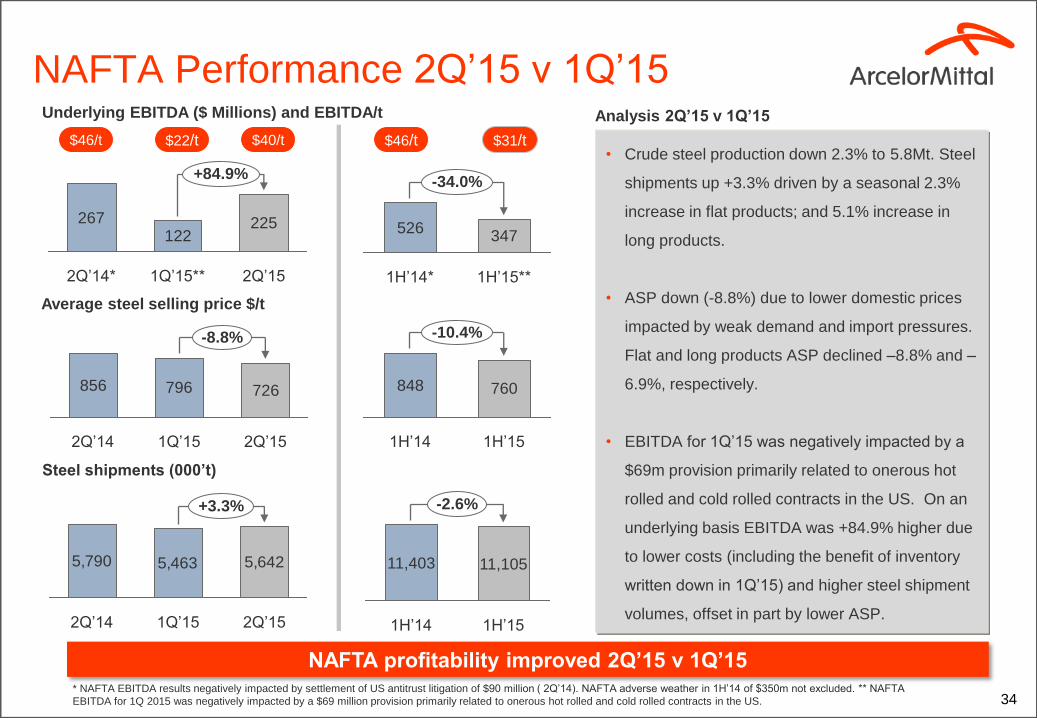
NAFTA Performance 2Q’15 v 1Q’15
Average steel selling price $/t
* NAFTA EBITDA results negatively impacted by settlement of US antitrust litigation of $90 million ( 2Q’14). NAFTA adverse weather in 1H’14 of $350m not excluded. ** NAFTA
EBITDA for 1Q 2015 was negatively impacted by a $69 million provision primarily related to onerous hot rolled and cold rolled contracts in the US.
Analysis 2Q’15 v 1Q’15
Steel shipments (000’t)
Underlying EBITDA ($ Millions) and EBITDA/t
856 796 726
-8.8%
2Q’15 1Q’15 2Q’14
5,790 5,463 5,642
+3.3%
2Q’15 1Q’15 2Q’14
267122
225
2Q’15
+84.9%
1Q’15** 2Q’14*
NAFTA profitability improved 2Q’15 v 1Q’15
$46/t
11,403
1H’14
11,105
1H’15
-2.6%
526347
1H’14* 1H’15**
-34.0%
848 760
1H’14
-10.4%
1H’15
$22/t $46/t $31/t $40/t
New
• Crude steel production down 2.3% to 5.8Mt. Steel
shipments up +3.3% driven by a seasonal 2.3%
increase in flat products; and 5.1% increase in
long products.
• ASP down (-8.8%) due to lower domestic prices
impacted by weak demand and import pressures.
Flat and long products ASP declined –8.8% and –
6.9%, respectively.
• EBITDA for 1Q’15 was negatively impacted by a
$69m provision primarily related to onerous hot
rolled and cold rolled contracts in the US. On an
underlying basis EBITDA was +84.9% higher due
to lower costs (including the benefit of inventory
written down in 1Q’15) and higher steel shipment
volumes, offset in part by lower ASP.
35
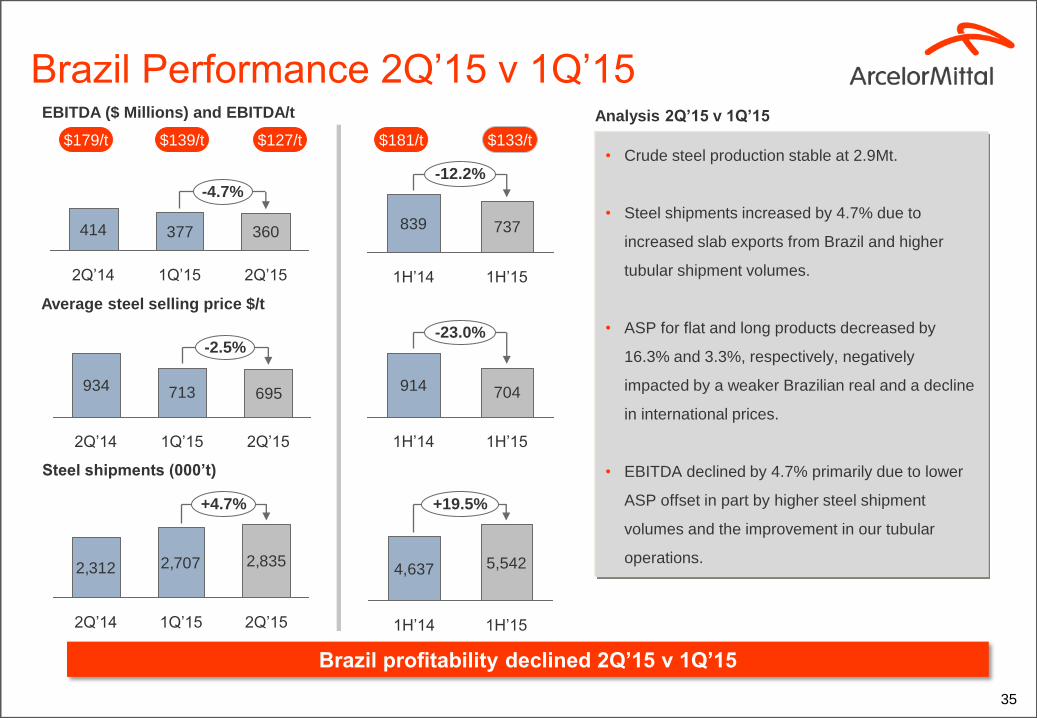
Brazil Performance 2Q’15 v 1Q’15
Average steel selling price $/t
Steel shipments (000’t)
EBITDA ($ Millions) and EBITDA/t
934 713 695
-2.5%
2Q’15 1Q’15 2Q’14
2,312 2,707 2,835
2Q’14 1Q’15 2Q’15
+4.7%
414 377 360
-4.7%
2Q’15 1Q’15 2Q’14
Brazil profitability declined 2Q’15 v 1Q’15
$179/t
5,542
1H’14 1H’15
+19.5%
4,637
839 737
-12.2%
1H’15 1H’14
914 704
1H’14
-23.0%
1H’15
$139/t $181/t $133/t $127/t
Analysis 2Q’15 v 1Q’15
• Crude steel production stable at 2.9Mt.
• Steel shipments increased by 4.7% due to
increased slab exports from Brazil and higher
tubular shipment volumes.
• ASP for flat and long products decreased by
16.3% and 3.3%, respectively, negatively
impacted by a weaker Brazilian real and a decline
in international prices.
• EBITDA declined by 4.7% primarily due to lower
ASP offset in part by higher steel shipment
volumes and the improvement in our tubular
operations.
36
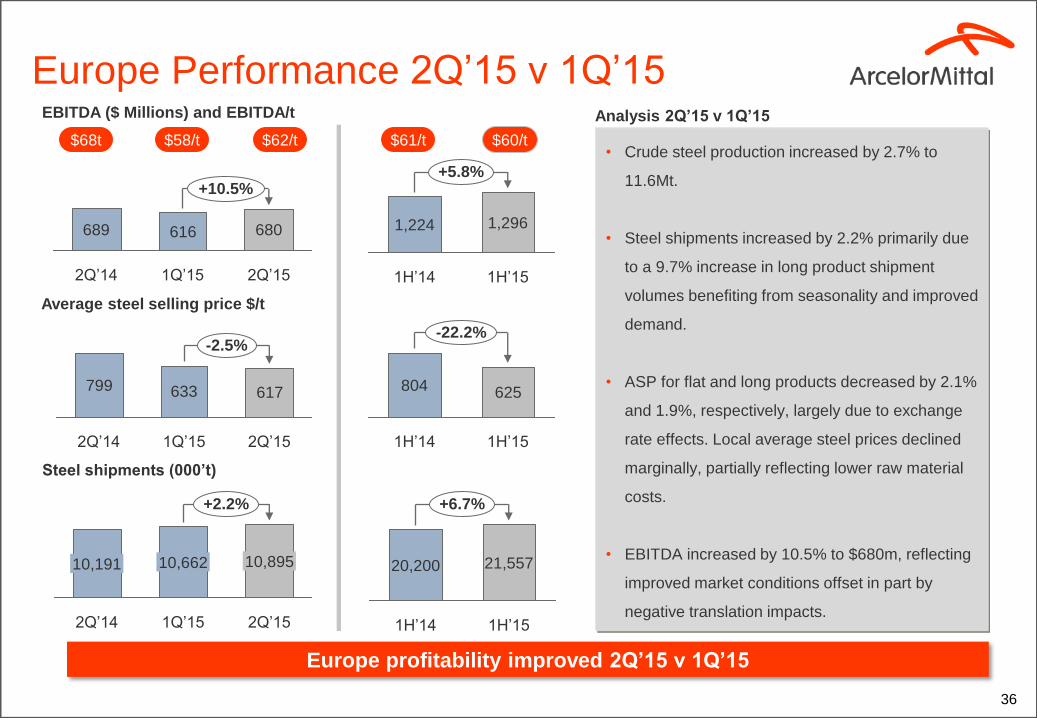
Europe Performance 2Q’15 v 1Q’15
Average steel selling price $/t
Steel shipments (000’t)
EBITDA ($ Millions) and EBITDA/t
799 633 617
2Q’14
-2.5%
2Q’15 1Q’15
+2.2%
10,895
2Q’15 1Q’15 2Q’14
10,662 10,191
689 616 680
+10.5%
2Q’15 1Q’15 2Q’14
Europe profitability improved 2Q’15 v 1Q’15
$68t
20,200
+6.7%
1H’15
21,557
1H’14
1,224
+5.8%
1H’15
1,296
1H’14
804 625
-22.2%
1H’15 1H’14
$58/t $61/t $60/t $62/t
Analysis 2Q’15 v 1Q’15
• Crude steel production increased by 2.7% to
11.6Mt.
• Steel shipments increased by 2.2% primarily due
to a 9.7% increase in long product shipment
volumes benefiting from seasonality and improved
demand.
• ASP for flat and long products decreased by 2.1%
and 1.9%, respectively, largely due to exchange
rate effects. Local average steel prices declined
marginally, partially reflecting lower raw material
costs.
• EBITDA increased by 10.5% to $680m, reflecting
improved market conditions offset in part by
negative translation impacts.

37
ACIS Performance 2Q’15 v 1Q’15
Average steel selling price $/t
• Crude steel production increased by 2.6% driven
by increased production primarily in Kazakhstan
offset in part by lower production in South Africa
on account of weak domestic market conditions.
• Steel shipments increased by 6.6% due to
seasonally higher shipments in our CIS operations
offset in part by lower volumes in South Africa
• ASP were lower in Ukraine (-5.9%) and
Kazakhstan (-8.6%) impacted by weaker CIS
prices, as well as lower prices in South Africa.
• EBITDA in 2Q’15 decreased by 33.8% due to
lower ASP partially offset by higher volumes in the
CIS operations and continued cost reduction
efforts.
Steel shipments (000’t)
EBITDA ($ Millions) and EBITDA/t
592 507 450
2Q’15
-11.3%
1Q’15 2Q’14
3,306 3,2053,006
1Q’15 2Q’15 2Q’14
+6.6%
156 133 88
-33.8%
1Q’15 2Q’15 2Q’14
ACIS profitability declined 2Q’15 v 1Q’15
$47/t
1H’14
6,493 6,211
-4.3%
1H’15
265 221
1H’14
-16.6%
1H’15
580 477
1H’14
-17.6%
1H’15
$44/t $41/t $36/t $27/t
Analysis 2Q’15 v 1Q’15
38
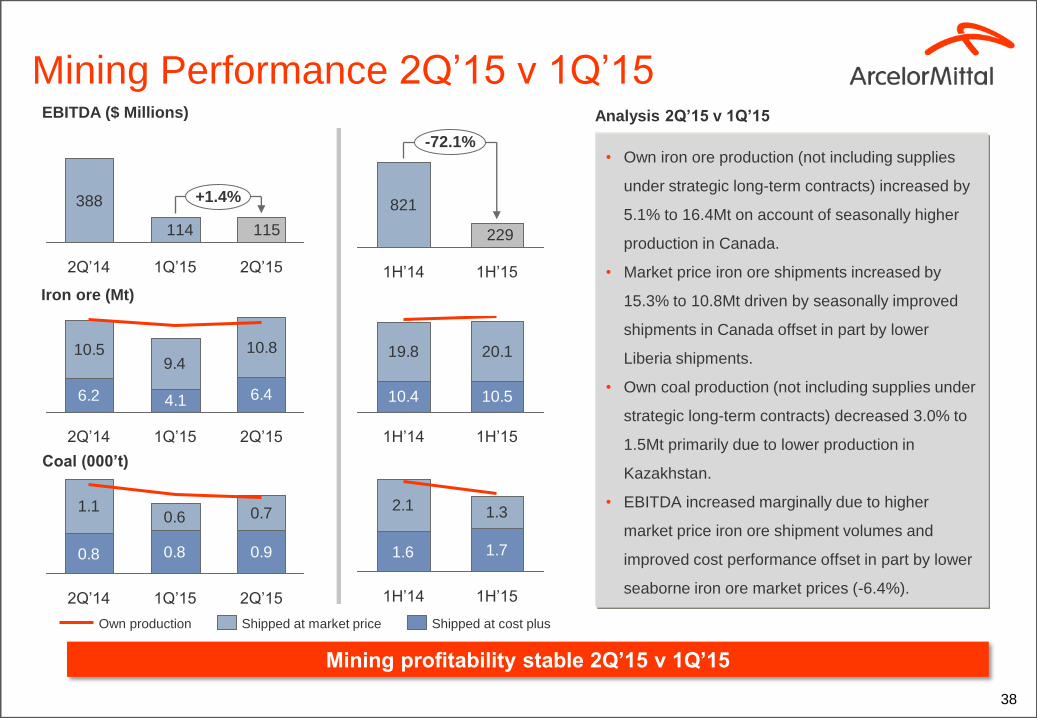
Mining Performance 2Q’15 v 1Q’15
Iron ore (Mt)
• Own iron ore production (not including supplies
under strategic long-term contracts) increased by
5.1% to 16.4Mt on account of seasonally higher
production in Canada.
• Market price iron ore shipments increased by
15.3% to 10.8Mt driven by seasonally improved
shipments in Canada offset in part by lower
Liberia shipments.
• Own coal production (not including supplies under
strategic long-term contracts) decreased 3.0% to
1.5Mt primarily due to lower production in
Kazakhstan.
• EBITDA increased marginally due to higher
market price iron ore shipment volumes and
improved cost performance offset in part by lower
seaborne iron ore market prices (-6.4%).
Coal (000’t)
EBITDA ($ Millions)
388
115114
+1.4%
2Q’15 1Q’15 2Q’14
Mining profitability stable 2Q’15 v 1Q’15
821
229
-72.1%
1H’15 1H’14
6.2 6.4
10.59.4
10.8
4.1
2Q’15 1Q’15 2Q’14
10.4 10.5
19.8 20.1
1H’15 1H’14
0.8 0.8 0.9
1.10.6 0.7
2Q’15 2Q’14 1Q’15
1.6 1.7
2.1 1.3
1H’15 1H’14
Shipped at cost plus Shipped at market price Own production
Analysis 2Q’15 v 1Q’15

Daniel Fairclough – Global Head Investor Relations
+44 207 543 1105
Hetal Patel – UK/European Investor Relations
+44 207 543 1128
Valérie Mella – European/Retail Investor Relations
+44 207 543 1156
Maureen Baker – Fixed Income/Debt Investor Relations
+33 1 71 92 10 26
Lisa Fortuna – US Investor Relations
+312 899 3985
We have released a new ArcelorMittal investor relations app available for download on IOS or android devices
New ArcelorMittal IR app and contacts