Embed Size (px)
Citation preview

October 2020Mitsui Fudosan Accommodations Fund Management Co., Ltd.
29th PeriodInvestor PresentationMarch 2020 – August 2020

1
Summary of NAF
* Percentage of portfolio in Tokyo 23 Wards is based on acquisition price for ”Rental Apartments” only. Percentage of single and compact units is based on units for “Rental Apartments” only.* Occupancy rate is the average month-end occupancy rate during the 29th Period.* DBJ Green Building certified percentage is calculated based on gross floor area.
Features1. Investments in Accommodation Assets, Primarily "Rental Apartments"
2. Leveraging the Mitsui Fudosan Group's Value Chain
Portfolio Summary
Total Acquisition Price JPY 316.2 billion
No. of Investment Properties 128Total Rentable Units 12,559Portfolio in Tokyo 23 Wards 88.4%Percentage of Single and Compact Units 82.8%
Financial Summary
Total Interest-Bearing Debt JPY 157.5 billion
LTV 51.5%Long-Term Debt Ratio 98.1%Weighted-Average Interest Rate 0.55%Duration of Long-Term Debt 4.6 years
Credit RatingAA- R&I
A+ S&PFocused Investment in Tokyo 23 Wards
Primarily Single and Compact Units
High Occupancy Rate 96.8% The Highest Credit Ratings Among Residential J-REITs
ESG Summary
GRESBGreen Star / 3 Stars DBJ Green Building
CertificationAcquired for 4 buildings
Sector Leader (Asia, Residential) 25.0% of portfolio certified
(End of the 29th Period; as of August 31, 2020)
Seek to secure stable earnings and steadily grow assets under management from a medium- to long-term perspective with the aim of maximizing unitholder value
2
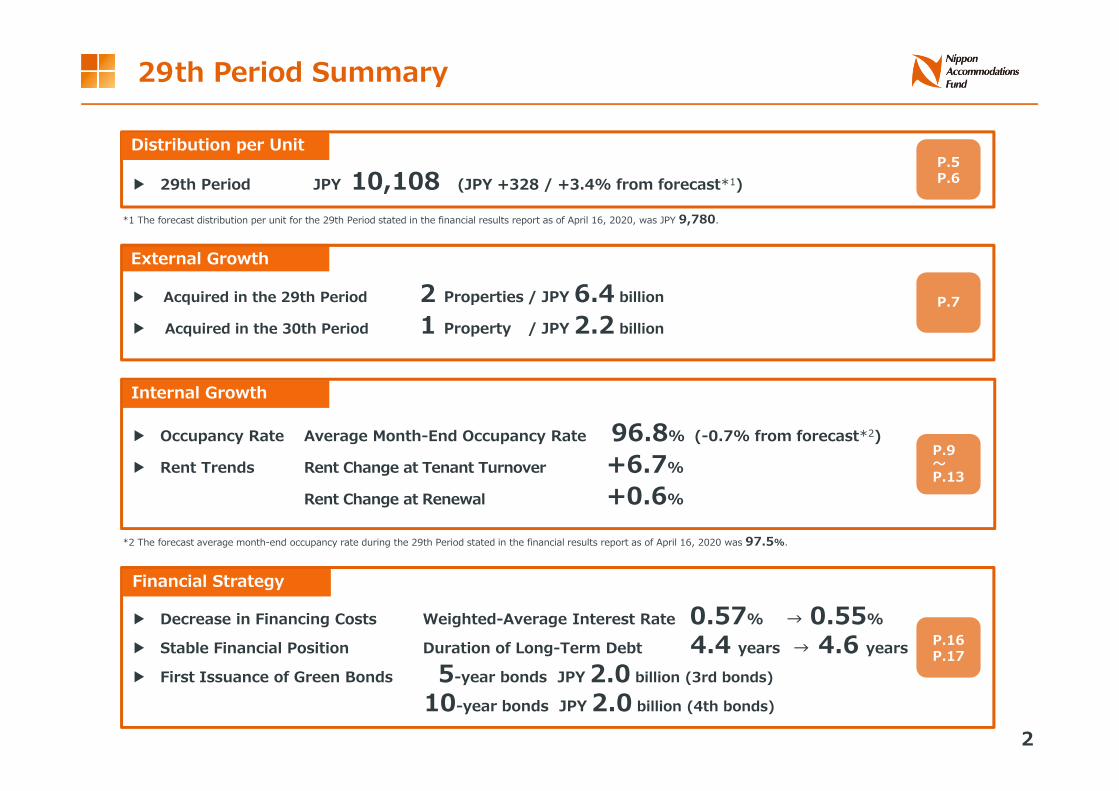
29th Period Summary
▶ Decrease in Financing Costs Weighted-Average Interest Rate 0.57% → 0.55%
▶ Stable Financial Position Duration of Long-Term Debt 4.4 years → 4.6 years
▶ First Issuance of Green Bonds 5-year bonds JPY 2.0 billion (3rd bonds)
10-year bonds JPY 2.0 billion (4th bonds)
Financial Strategy
P.16P.17
*1 The forecast distribution per unit for the 29th Period stated in the financial results report as of April 16, 2020, was JPY 9,780.
Distribution per Unit
▶ 29th Period JPY 10,108 (JPY +328 / +3.4% from forecast*1)P.5P.6
▶ Acquired in the 29th Period 2 Properties / JPY 6.4 billion
▶ Acquired in the 30th Period 1 Property / JPY 2.2 billion
External Growth
P.7
▶ Occupancy Rate Average Month-End Occupancy Rate 96.8% (-0.7% from forecast*2)
▶ Rent Trends Rent Change at Tenant Turnover +6.7%
Rent Change at Renewal +0.6%
Internal Growth
P.9〜P.13
*2 The forecast average month-end occupancy rate during the 29th Period stated in the financial results report as of April 16, 2020 was 97.5%.
3
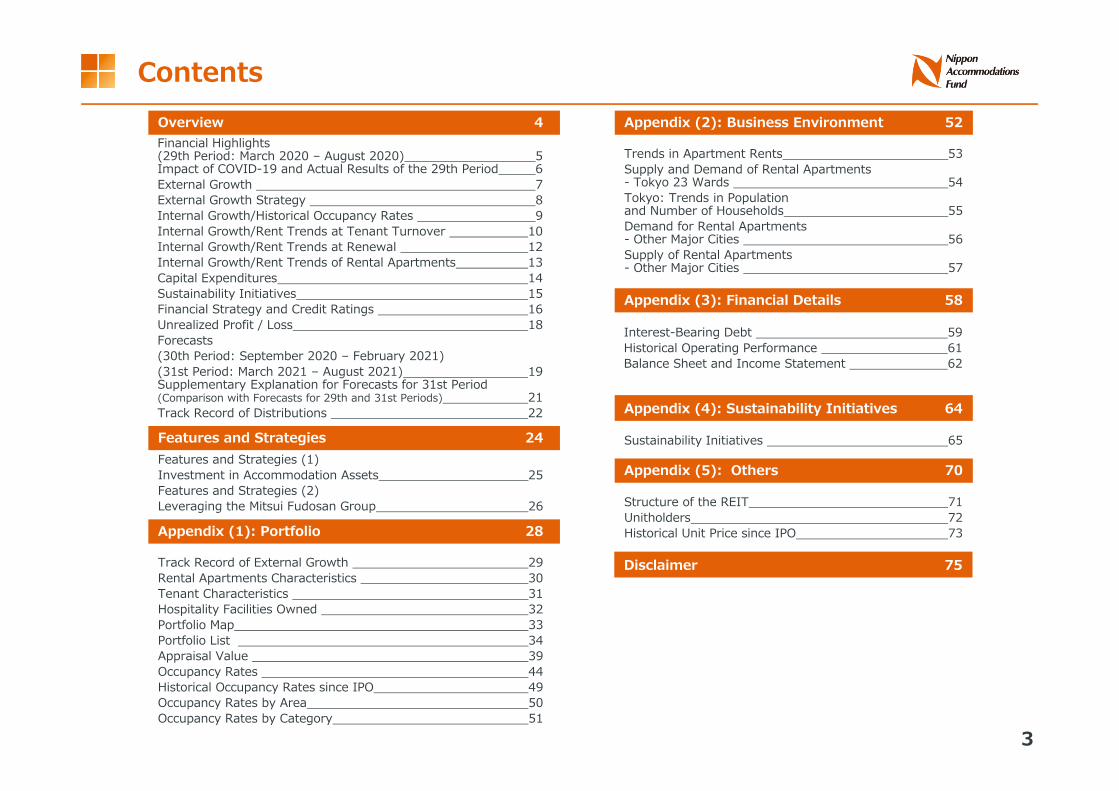
ContentsOverview 4Financial Highlights (29th Period: March 2020 – August 2020) 5Impact of COVID-19 and Actual Results of the 29th Period 6External Growth 7External Growth Strategy 8Internal Growth/Historical Occupancy Rates 9Internal Growth/Rent Trends at Tenant Turnover 10Internal Growth/Rent Trends at Renewal 12Internal Growth/Rent Trends of Rental Apartments 13Capital Expenditures 14Sustainability Initiatives 15Financial Strategy and Credit Ratings 16Unrealized Profit / Loss 18Forecasts(30th Period: September 2020 – February 2021) (31st Period: March 2021 – August 2021) 19Supplementary Explanation for Forecasts for 31st Period (Comparison with Forecasts for 29th and 31st Periods) 21Track Record of Distributions 22
Features and Strategies (1)Investment in Accommodation Assets 25Features and Strategies (2)Leveraging the Mitsui Fudosan Group 26
Features and Strategies 24
Trends in Apartment Rents 53Supply and Demand of Rental Apartments - Tokyo 23 Wards 54Tokyo: Trends in Populationand Number of Households 55Demand for Rental Apartments- Other Major Cities 56Supply of Rental Apartments- Other Major Cities 57
Appendix (2): Business Environment 52
Appendix (1): Portfolio 28
Track Record of External Growth 29Rental Apartments Characteristics 30 Tenant Characteristics 31Hospitality Facilities Owned 32Portfolio Map 33 Portfolio List 34 Appraisal Value 39Occupancy Rates 44 Historical Occupancy Rates since IPO 49Occupancy Rates by Area 50 Occupancy Rates by Category 51
Disclaimer 75
Appendix (5): Others 70
Structure of the REIT 71Unitholders 72Historical Unit Price since IPO 73
Appendix (3): Financial Details 58
Interest-Bearing Debt 59Historical Operating Performance 61Balance Sheet and Income Statement 62
Appendix (4): Sustainability Initiatives 64
Sustainability Initiatives 65

Overview

5
Financial Highlights (29th Period: March 2020 - August 2020)
(JPY million)
29th Period(Forecast)
(Ended Aug. 31, 2020)
①
29th Period(Actual results)
(Ended Aug. 31, 2020)
②
Comparison with Forecast28th Period(Actual results)
(Ended Feb. 29, 2020)
③
Comparison with the 28th Period
Change②-① Notes Change
②-③ Notes
Total Revenues 11,567 11,520 -47
(JPY million)
Revenues -47Existing properties -802 properties acquired in the 29th Period +33
Operating expenses -177Rental expenses -158Real estate taxes +1Depreciation and amortization +3Asset management fees +5Other expenses -30
Non-operating income +12
Non-operating expense -15Interest expense -18Other +2
11,401 +118(JPY million)
Revenues +118Existing properties +322 properties acquired in the 29th Period +85
Operating expenses +94Rental expenses +62Real estate taxes +14Depreciation and amortization +1Asset management fees +7Other expenses +7
Non-operating income -8
Non-operating expenses -16Interest expense -19Other +2
Operating Income 5,201 5,332 +130 5,307 +24
Net Income 4,739 4,897 +158 4,865 +32
Total Distributions 4,738 4,897 +158 4,865 +31
Distribution per Unit
9,780yen
10,108yen
+328yen
10,042yen
+66yen
Units Outstanding
484,522units
484,522units - 484,522
units -
AUM
Total Acquisition Price*
312,143 316,208 +4,064million yen 309,723 +6,484
No. of Investment Properties
127properties
128properties
+1property
126properties
+2properties
Average Month-End Occupancy Rate
97.5%
96.8%
-0.7 points
97.7%
-0.9Points
LTV (At the end of the Period)
51.1%
51.5%
+0.4points
50.8%
+0.7points
* Acquisition-related expenses, property tax and consumption tax are not included.

6
While the occupancy rate dropped, tenant replacement expenses decreased due todecrease in the number of contracts concluded, pushing profit upward, contrary toordinary fiscal periods ending in August.On top of such, there continues to be effects of increase in rent, which resulted inrevenues from existing properties exceeding the forecast.
Impact of COVID-19 and Actual Results of the 29th Period
Factors in Change of Distribution per Unit (29th Period Actual vs. Initial Forecast)
Impact of COVID-19
▶ Number of contracts concluded: Decreased significantly in April and May due to the voluntary restraint on going out and the declaration of a state of emergency
▶ Number of contracts cancelled: Decreased compared with the same period of the previous year
▶ Occupancy rate: 96.8% (decreased by 0.7 percentage points from the initial forecast)
▶ Percentage change in rent at tenant turnover: Remained high at +6.7%▶ Rent reduction and exemption and deferment of payment:
2 cases of deferment of payment at retail and hospitality facilities (none for rental apartments)
267214
183241
207 184
-255 -274
-207 -211 -206-179
247
135104
217191
142
-240
-301
-177 -186 -167 -181
-400
-300
-200
-100
0
100
200
300
400
Mar. Apr. May Jun. Jul. Aug.
Change in Number of Contracts Concluded / CancelledNumber of contracts concluded (2019)
Number of contracts cancelled (2019)
Number of contracts concluded (2020)
Number of contracts cancelled (2020)
9,78010,108
+165
+54+38+83-12
Forecast Actual
97.5% 96.8%
Occupancy Rate*
29th Period Forecast
(Ended Aug. 2020)
29th Period Actual results
(Ended Aug. 2020)
Existing properties
OthersInterest expense
Contribution of 2 properties acquired in
the 29th Period
Asset management fees
▶ Insurance income (JPY +26)▶ Other expenses (JPY +57)
▶ Park Axis AkatsukaUpward revision (JPY +7)
▶ Park Cube Oimachi ResidenceNew acquisition (JPY +47)
* Occupancy rate is the average month-end occupancy rate during the period.
(cases)
▶ Decrease in rental revenue, etc. (JPY -166)Decreasing factors① Change in occupancy rate: JPY -146② Percentage change in rent: JPY ±0③ Ancillary revenue linked
to ① such as parking fees: JPY -20▶ Decrease in operating expenses (JPY +331)

7
External Growth
Properties Acquired in the 29th Period Name of Property Location Acquisition
DateCompletion
DateRentable Area
(including retail spaces)Number of
Rentable Units Acquisition Price NOI Yield*2 Seller Co-owner After Acquisition
Park Axis Akatsuka(55% co-ownership interest)
Itabashi-ku, Tokyo
March 30, 2020
September 12, 2018 2,403.67 m²
Residential: 86Retail: 2 JPY 2,420
million 4.4% Mitsui Fudosan Residential Co., Ltd.
United Urban Investment Corporation
4,370.31 m² Residential: 156Retail: 3
Park Cube Oimachi Residence
(70% co-ownership interest)Shinagawa-ku,
TokyoJuly 1, 2020
January 10,2018 2,989.82 m²
Residential: 119Retail: 1 JPY 4,064
million 4.2% ITOCHU Property Development, Ltd.
Mitsui Fudosan Residential Co., Ltd.
4,271.17 m² Residential: 170Retail: 1
Total 5,393.49 m² Residential: 205Retail: 3
JPY 6,484 million 4.3%
NAFʼs ownership
NAFʼs ownership
NAFʼs ownership
NAFʼs ownership
Name of Property Location Acquisition Date
Completion Date
Rentable Area(including retail spaces)
Number of Rentable Units Acquisition Price NOI Yield*2 Seller Co-owner After Acquisition
Park Axis Toyocho Shinsui Koen
(35% co-ownership interest)Koto-ku, Tokyo
October 1, 2020
August 29, 2014 2,539.10 m²
Residential: 67Retail: 1 JPY 2,233
million 4.3% Mitsui Fudosan Residential Co., Ltd.
Mitsui Fudosan Residential Co., Ltd.
7,254.57 m² Residential: 190Retail: 2
NAFʼs ownership NAFʼs ownership
Park Axis Akatsuka Park Cube Oimachi Residence
Park Cube Oimachi Residence
Park Axis Toyocho Shinsui Koen Park Axis Toyocho Shinsui Koen
*1 “Rentable area” is calculated by multiplyingthe total area of the building that can berented within the entire property acquired byNAFʼs ownership ratio.“Rentable units” is calculated by multiplyingthe number of units that can be rentedwithin the entire property acquired by NAFʼsownership ratio.
*2 Appraisal operating revenue of the entireportfolio x NAFʼs ownership ratio /Acquisition price x 100
LTV 51.5%(Actual results as of the end of the 29th Period)
Approx. 51.9%(Estimate for the end of the 30th Period)
Acquisition Capacity*
Approx. JPY 21.0 billion(Estimate for the end of the 30th Period)
* Borrowing capacity up to 55% LTV
Properties Acquired in the 30th Period
LTV and Acquisition Capacity

8
2,153
3,842
5,852
7,0537,994 7,994 8,410
9,39310,245
11,90712,361
13,037 13,23314,257
14,760
350 1,7722,909 2,909
4,951 5,816 5,887 6,279 6,508 6,595 6,858 6,958 7,043 7,0797,256
0
2,000
4,000
6,000
8,000
10,000
12,000
14,000
16,000
FY2005 FY2006 FY2007 FY2008 FY2009 FY2010 FY2011 FY2012 FY2013 FY2014 FY2015 FY2016 FY2017 FY2018 FY2019
External Growth Strategy
■ Park Axis Series Development Status (Pipeline)
Developed and leasing3,645 units at 40 properties
Tokyo 23 ward
35 properties 3,121 units
Other Major Cities
3 properties 266 units
Greater Tokyo
2 properties 258 units
Total
40 properties 3,645 units
Source: RESIDENT FIRST CO., LTD. Website (Japanese only), Mitsui Rental Housing Park Axis Series(as of October 19, 2020)
* The above presents the status of Park Axis series development by Mitsui Fudosan Residential Co., Ltd., a developer, but does not represent NAF acquisition commitments as of the date of this document.
Okawabata Apartment Communities10.3%
Shibaura Island Air Tower2.6%
Park Axis Series58.7%
Park Cube Series
28.4% Developed by the Mitsui Fudosan Group
Developed by third parties
Investment mainly focused on rental apartments developed by the Mitsui Fudosan Group
Source︓Mitsui Fudosan Residential Co., Ltd.
Cumulative supply of Park Axis unitsUnits acquired by NAF(including properties sold)
(Units)
Asset Classification of Rental Apartments (As of the end of the 29th Period, acquisition price basis)
Acquisition Record of Park Axis by NAF

9
98.2
96.9
96.2
96.6 96.5
96.3 96.4
94.5
95.0
95.5
96.0
96.5
97.0
97.5
98.0
98.5
Mar. Apr. May Jun. Jul. Aug. Sep. Oct. Nov. Dec. Jan. Feb.
Internal Growth / Historical Occupancy Rates
Occupancy rate remained at a high level although below that of past two years Change in Occupancy Rate of Overall Portfolio at Month-End
(%)
* Average Month-End Occupancy rate is for the overall portfolio, including Hospitality Facilities.
(Reference)Average Month-End Occupancy Rate of each period
29th96.8%
27th 28th97.7% 97.7%
25th 26th97.3% 97.7%
23rd 24th96.7% 97.6%
21st 22nd96.4% 96.8%
29thMar. 2020̶Aug. 2020
27th ̶ 28thMar. 2019̶Feb. 2020
25th ̶ 26thMar. 2018̶Feb. 2019
23rd ̶ 24thMar. 2017̶Feb. 2018
21st ̶ 22ndMar. 2016̶Feb. 2017

10
Percentage change in rent at tenant turnover remained at a high level of 6.7% Change in Rent of Rental Apartments at Tenant Turnover
Internal Growth / Rent Trends at Tenant Turnover (1)
Percentage Change in Rent at Tenant Turnover
Tenant Turnover
Total Rentable Units
No. of Units
Rent Increase
Rent Unchanged
Rent Decrease
Monthly Rent Net Change
Rent Increase
Rent Decrease
Percentage Change
26th Period(Feb. 2019)
27th Period(Aug. 2019)
28th Period(Feb. 2020)
29th Period(Aug. 2020)
10,690 units 10,685 units 10,685 units 10,890 units
1,087 units 1,296 units 1,057 units 1,036 units
885 units 1,132 units 922 units 866 units
65 units 68 units 51 units 62 units
137 units 96 units 84 units 107 units
9,218 12,008 11,249 10,061
9,871 12,476 11,73210,590
Average rate of increase:8.2%
-652 -468 -482-529
Average rate of decrease:-4.2%
5.8 % 6.5 % 7.0 % 6.7 %
(JPY thousand) Percentage of Rent Changed Units at Tenant Turnover
12.6% 7.4% 8.0% 10.4%
6.0%5.2% 4.8% 6.0%
81.4% 87.3% 87.2% 83.6%
0%
10%
20%
30%
40%
50%
60%
70%
80%
90%
100%
第26期(2019年2⽉期)
第27期(2019年8⽉期)
第28期(2020年2⽉期)
第29期(2020年8⽉期)
26th Period(Feb. 2019)
27th Period(Aug. 2019)
28th Period(Feb. 2020)
29th Period(Aug. 2020)
Rent increase Rent unchanged Rent decrease
2.0%
2.3% 2.8%
2.1%
0.9%0.5% 0.3% 0.5%
1.0% 1.2% 1.3% 1.4% 1.7%1.8% 1.7% 1.8%
2.4% 2.6% 2.6%
2.6% 3.2% 3.4%4.2%
5.1% 6.2%6.8% 7.3% 7.1%
-1.1% -1.1% -0.5% -1.4% -3.3%
-9.8%-8.7% -6.8%
-5.2% -5.0% -4.8% -4.2%-3.5%
-3.0% -2.5% -2.6%-2.3% -1.9% -1.6% -1.3% -1.2%
-0.8% -0.7% -0.7% -0.4% -0.3% -0.3% -0.4%
0.9%1.2%2.3%
0.7%
-2.4%
-9.3% -8.5%
-6.2%-4.3%-3.8%-3.5%-2.8%-1.8%
-1.3%-0.9%-0.8%0.1%0.7% 1.0%1.3%1.9% 2.6%3.5%
4.4%5.8%6.5% 7.0%6.7%
-10.0%
-8.0%
-6.0%
-4.0%
-2.0%
0.0%
2.0%
4.0%
6.0%
8.0%
2nd Period 3rd Period 4th Period 5th Period 6th Period 7th Period 8th Period 9th Period 10th Period 11th Period 12th Period 13th Period 14th Period 15th Period 16th Period 17th Period 18th Period 19th Period 20th Period 21st Period 22nd Period23rd Period 24th Period 25th Period 26th Period 27th Period 28th Period 29th PeriodFeb. 2007 Aug. 2007 Feb. 2008 Aug. 2008 Feb. 2009 Aug. 2009 Feb. 2010 Aug. 2010 Feb. 2011 Aug. 2011 Feb. 2012 Aug. 2012 Feb. 2013 Aug. 2013 Feb. 2014 Aug. 2014 Feb. 2015 Aug. 2015 Feb. 2016 Aug. 2016 Feb. 2017 Aug. 2017 Feb. 2018 Aug. 2018 Feb. 2019 Aug. 2019 Feb. 2020 Aug. 2020
Percentage Change in Rent at Tenant Turnover
Portion contributing to rent increase
Portion contributing to rent decrease
* Continual renewal contracts under the periodic tenancy agreement are excluded from tenant turnover and counted as renewals.* Calculations above do not include figures for retail units and Hospitality Facilities.*"Total Rentable Units" and "No. of Units" of properties (co-ownership interest owned) are calculated by multiplying NAFʼs interest
rate, rounded to the nearest specified unit.

11
Higher rents in Tokyo 23 Wards are driving growth, and rents in Greater Tokyo increased as well
Ratio of Rental Apartments by Area
Internal Growth / Rent Trends at Tenant Turnover (2)
Change in Rent of Rental Apartments at Tenant Turnover by Area
* Tokyo CBD (Central Business District) includes Minato, Chuo, and Chiyoda wards.
(As of the end of the 29th Period, acquisition price basis)
Greater Tokyo 4.1%
Other Major Cities7.5%
Tokyo 23 Wardsexcluding Tokyo CBD
55.3%
Tokyo CBD33.1%
5.9% 7.5%
8.8% 8.3% 8.2% 8.2%
3.4%4.5%
5.5%7.3%
7.6% 7.7%
0.9% 1.5% 2.1%3.1% 3.3%
4.3%
-1.8% -1.7%-0.2% 0.2% 0.0% 0.3%
-4.0%
-2.0%
0.0%
2.0%
4.0%
6.0%
8.0%
10.0%
第24期2018年2⽉期
第25期2018年8⽉期
第26期2019年2⽉期
第27期2019年8⽉期
第28期2020年2⽉期
第29期2020年8⽉期
Tokyo CBDGreater Tokyo
Excluding Tokyo CBDOther Major Cities
24th PeriodFeb. 2018
25th PeriodAug. 2018
26th PeriodFeb. 2019
27th PeriodAug. 2019
28th PeriodFeb. 2020
29th PeriodAug. 2020
Compact/family products are showing strong performance Ratio of Rental Apartments by Category
Family 12.8%
Compact41.5%
Single41.3%
Large4.4%
Change in Rent of Rental Apartments at Tenant Turnover by Category
1.4% 1.7%3.1%
4.3%5.4%
4.3%3.8%5.1%
5.7% 6.6%
7.6% 7.6%6.1%
8.0%
14.3%11.9%
8.1%
7.6%5.3%
6.4%
8.1% 8.5%
7.3%
8.3%
-2.0%
0.0%
2.0%
4.0%
6.0%
8.0%
10.0%
12.0%
14.0%
16.0%
第24期2018年2⽉期
第25期2018年8⽉期
第26期2019年2⽉期
第27期2019年8⽉期
第28期2020年2⽉期
第29期2020年8⽉期
24th PeriodFeb. 2018
25th PeriodAug. 2018
26th PeriodFeb. 2019
27th PeriodAug. 2019
28th PeriodFeb. 2020
29th PeriodAug. 2020
(As of the end of the 29th Period, unit basis )
* Calculations above do not include figures for retail units and Hospitality Facilities.* Please refer to page 30 for definition of respective category.
SingleFamily
CompactLarge

12
-0.2%-0.4%
-0.8%
-1.0%-0.9%
-0.5%-0.6%
-0.4%
-0.6%-0.5%
-0.4%-0.2% 0.0% 0.0%0.2%
0.1% 0.1% 0.1%
0.2%
0.1%
0.2%
0.1%
0.2% 0.3%
0.6% 0.6%0.1%0.1%
-0.0%
0.0%
-0.2%-0.4%
-0.8%-1.0%-0.9%
-0.5%-0.6%
-0.4%
-0.6%-0.5%
-0.4%-0.1%
-0.0%
0.0% 0.0%0.1%0.2% 0.1% 0.2% 0.1% 0.2%0.3%
0.6% 0.6%
-1.200%
-1.000%
-0.800%
-0.600%
-0.400%
-0.200%
0.000%
0.200%
0.400%
0.600%
0.800%
0.1% 0.7% 0.1% 0.0%
90.3% 90.1%79.8% 81.8%
9.6% 9.2%20.1% 18.2%
0%
10%
20%
30%
40%
50%
60%
70%
80%
90%
100%
第26期(2019年2⽉期)
第27期(2019年8⽉期)
第28期(2020年2⽉期)
第29期(2020年8⽉期)
Percentage change in rent for renewals continued on an upward trend from the previous period
Change in Rent of Rental Apartments at Renewal
Internal Growth / Rent Trends at Renewal
Percentage Change in Rent at Renewal
Renewal
Total Rentable Units
No. of Units
Rent Increase
Rent Unchanged
Rent Decrease
Monthly Rent Net Change
Rent Increase
Rent Decrease
Percentage Change
26th Period(Feb. 2019)
27th Period(Aug. 2019)
28th Period(Feb. 2020)
29th Period(Aug. 2020)
10,690 units 10,685 units 10,685 units 10,890 units
1,642 units 2,124 units 1,628 units 2,184 units
158 units 196 units 327 units 398 units
1,482 units 1,914 units 1,300 units 1,785 units
2 units 14 units 1 unit 0 units
581 834 1,504 1,797
593 856 1,5121,797
Average rate of increase:2.7%
-12 -22 -80
Average rate of decrease:-%
0.2 % 0.3 % 0.6 % 0.6 %
(JPY thousand) Percentage of Rent Changed Units at Renewal
Rent increase Rent unchanged Rent decrease
2nd Period 3rd Period 4th Period 5th Period 6th Period 7th Period 8th Period 9th Period 10th Period 11th Period 12th Period 13th Period 14th Period 15th Period 16th Period 17th Period 18th Period 19th Period 20th Period 21st Period 22nd Period23rd Period 24th Period 25th Period 26th Period 27th Period 28th Period 29th PeriodFeb. 2007 Aug. 2007 Feb. 2008 Aug. 2008 Feb. 2009 Aug. 2009 Feb. 2010 Aug. 2010 Feb. 2011 Aug. 2011 Feb. 2012 Aug. 2012 Feb. 2013 Aug. 2013 Feb. 2014 Aug. 2014 Feb. 2015 Aug. 2015 Feb. 2016 Aug. 2016 Feb. 2017 Aug. 2017 Feb. 2018 Aug. 2018 Feb. 2019 Aug. 2019 Feb. 2020 Aug. 2020
Percentage Change in Rent at Tenant Turnover
Portion contributing to rent increase
Portion contributing to rent decrease
26th Period(Feb. 2019)
27th Period(Aug. 2019)
28th Period(Feb. 2020)
29th Period(Aug. 2020)
0.8%
0.6%
0.4%
0.2%
0.0%
-0.2%
-0.4%
-0.6%
-0.8%
-1.0%
-1.2%
* Continual renewal contracts under the periodic tenancy agreement are excluded from tenant turnover and counted as renewals.* Calculations above do not include figures for retail units and Hospitality Facilities.*"Total Rentable Units" and "No. of Units" of properties (co-ownership interest owned) are calculated by multiplying NAFʼs interest
rate, rounded to the nearest specified unit.
13
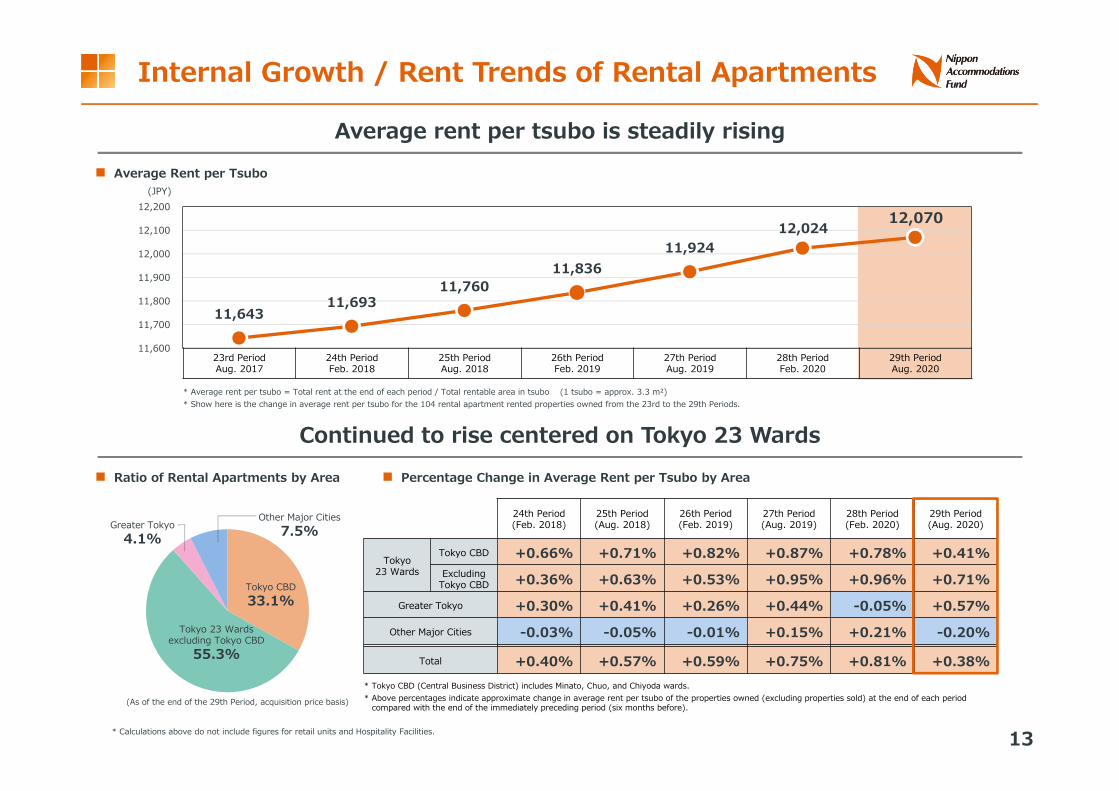
Average rent per tsubo is steadily rising Average Rent per Tsubo
Internal Growth / Rent Trends of Rental Apartments
Continued to rise centered on Tokyo 23 Wards Ratio of Rental Apartments by Area Percentage Change in Average Rent per Tsubo by Area
11,643 11,693
11,760 11,836
11,924 12,024
12,070
11,600
11,700
11,800
11,900
12,000
12,100
12,200
23rd PeriodAug. 2017
24th PeriodFeb. 2018
25th PeriodAug. 2018
26th PeriodFeb. 2019
27th PeriodAug. 2019
28th PeriodFeb. 2020
29th PeriodAug. 2020
* Average rent per tsubo = Total rent at the end of each period / Total rentable area in tsubo (1 tsubo = approx. 3.3 m²)* Show here is the change in average rent per tsubo for the 104 rental apartment rented properties owned from the 23rd to the 29th Periods.
(JPY)
Greater Tokyo 4.1%
Other Major Cities7.5%
Tokyo 23 Wardsexcluding Tokyo CBD
55.3%
Tokyo CBD33.1%
(As of the end of the 29th Period, acquisition price basis)
* Calculations above do not include figures for retail units and Hospitality Facilities.
24th Period(Feb. 2018)
25th Period(Aug. 2018)
26th Period(Feb. 2019)
27th Period(Aug. 2019)
28th Period(Feb. 2020)
29th Period(Aug. 2020)
Tokyo 23 Wards
Tokyo CBD +0.66% +0.71% +0.82% +0.87% +0.78% +0.41%Excluding
Tokyo CBD +0.36% +0.63% +0.53% +0.95% +0.96% +0.71%Greater Tokyo +0.30% +0.41% +0.26% +0.44% -0.05% +0.57%
Other Major Cities -0.03% -0.05% -0.01% +0.15% +0.21% -0.20%
Total +0.40% +0.57% +0.59% +0.75% +0.81% +0.38%* Tokyo CBD (Central Business District) includes Minato, Chuo, and Chiyoda wards.* Above percentages indicate approximate change in average rent per tsubo of the properties owned (excluding properties sold) at the end of each period
compared with the end of the immediately preceding period (six months before).

14
269 245 465
346 600
296 384
274
13.2% 12.1%23.2%
17.1%30.1%
14.9% 19.5%14.0%
-100.0%-95.0%-90.0%-85.0%-80.0%-75.0%-70.0%-65.0%-60.0%-55.0%-50.0%-45.0%-40.0%-35.0%-30.0%-25.0%-20.0%-15.0%-10.0%-5.0%0.0%5.0%10.0%15.0%20.0%25.0%30.0%35.0%40.0%45.0%50.0%55.0%60.0%
0
200
400
600
800
1,000
20.2% 19.4%22.3% 24.3%
27.5%
23.2%
2.9% 4.1%7.4% 8.7%
5.4%6.4%
6.2%8.6%
12.8%9.5%
7.1% 9.4%
-10.0%
0.0%
10.0%
20.0%
30.0%
Capital Expenditures
Ratio of Rental Apartments by Property Age(As of the end of the 29th Period, acquisition price basis)
Actual and Planned Capital Expenditures
15-20 years 9.7%
Less than 5 years3.6%
10-15 years66.0%
5-10 years10.4%
20 yearsor more
10.3%
Averageproperty age 14.3 years * Figures for the 30th Period and 31st Period are estimates as of October 19, 2020, and therefore are subject to change.
They include accounting expenses.
Plan
(JPY million)Capital Expenditure Percentage of Capital Expenditure to Depreciation
24th PeriodFeb. 2018
25th PeriodAug. 2018
26th PeriodFeb. 2019
27th PeriodAug. 2019
28th PeriodFeb. 2020
29th PeriodAug. 2020
30th PeriodFeb. 2021
31st PeriodAug. 2021
Effect of Renovation in Private Area at Okawabata Apartment Communities▶ Change in Rent at Tenant Turnover▶ Percentage Change in Rent at Tenant Turnover
24th PeriodFeb. 2018
25th PeriodAug. 2018
26th PeriodFeb. 2019
27th PeriodAug. 2019
28th PeriodFeb. 2020
29th PeriodAug. 2020
Percentage change in rent at tenant turnover (Okawabata Apartment Communities overall)Units recently renovated Other units
24th PeriodFeb. 2018
25th PeriodAug. 2018
26th PeriodFeb. 2019
27th PeriodAug. 2019
28th PeriodFeb. 2020
29th PeriodAug. 2020
36 units 40 units 33 units 33 units 33 units 32 units
8 units 13 units 13 units 2 units 3 units 7 units
30 units 38 units 33 units 32 units 29 units 28 units
2 units 2 units - - 2 units 3 units
4 units - - 1 unit 2 units 1 unit
601 887 1,127 880 641 945
632 887 1,127 888 737 948
-30 - - -8 -96 -2.6
6.2 % 8.6 % 12.8 % 9.5 % 7.1 % 9.4 %
(JPY thousand)
No. of Units
(Renovated rooms)
Rent Increase
Rent Unchanged
Rent Decrease
Monthly Rent Net Change
Rent Increase
Rent Decrease
Percentage Change

15
Sustainability Initiatives
Initiatives on Material Issues (materiality) Issued Green Bonds for the First Time for NAF
E Promote Energy Efficiency and CO2 Emissions Reduction
Control energy consumption and CO2 emissions in common areasPromote systematic installment of energy-saving equipment (LEDlighting, etc.)
Acquire External Certification and Assessment on Sustainability
Acquisition and renewal of DBJ Green Building Certification, etc.Continuous participation in GRESB Real Estate AssessmentReview sustainability initiatives and plan actions for improvement usingGRESB assessment
S
Enhance Tenant Satisfaction, Safety and Comfort
Management and operation of high-quality rental apartmentsSystematic and continuous promotion of renovation works incommon areas and private areas
Build Partnerships with Property Companies and Operators
Assess and monitor sustainability initiatives conducted by property management companies and operatorsCooperative initiatives concerning information-sharing and improvement of energy consumption in common areas and other issues
Contribute to Community Development
Contribute to local community mainly at large-scale propertiesincluding Okawabata Apartment Communities
G Ensure Fairness and Transparency of Corporate Governance
Establish a code of conduct and an action plan related to compliance and actbased on thesePrevent acts of conflict of interest by establishing standards on related-partytransactionsImplement internal audits on a regular basis
Develop Human Capital and Raise Sustainability Awareness Among Our Officers and Employees
Support career development of employeesFinancial and non-financial support for the acquisition of certifications/qualifications and the participation in external training programsConsider health of officers and employeesImprove workplace environment
Summary
▶ Total amount to be issued:5-year bonds JPY 2.0 billion
10-year bonds JPY 2.0 billion▶ Interest rate:
5-year bonds 0.260% per annum10-year bonds 0.520% per annum
▶ Issue date: July 16, 2020
Eligible green asset
Name of property Park Cube Meguro Tower
Location 2-2, Shimo-Meguro 2-chome, Meguro-ku, Tokyo
Site area 3,316.50 m²
Completion February 2008
Number of stories 22 stories with 2 underground stories
Gross floor area 18,601.89 m²
Purpose and background of issuance
▶ Expanding the group of investors interested in ESG investment and financing
▶ Strengthening the funding base
Rating by external review organization
Assigned “Green 1 (F),” the highest evaluation grade in the JCR Green Finance Framework Evaluation by Japan Credit Rating Agency, Ltd. (JCR).
Of the investors that have declared investment in the Green Bonds to date, the names ofthose investors that have consented to disclosure of their names are listed (in order of theJapanese syllabary).
• THE AWAJI SHINKIN BANK • YOKOHAMA MINATOMIRAI21 CORPORATION • THE ECHIZEN SHINKIN BANK• Credit Guarantee Corporation of Osaka• North Pacific Bank, LTD.• The Kita Osaka Shinkin Bank
• KIRYU SHINKIN BANK• Daitokyo Shinyokumiai Credit Cooperative• HANDA SHINKIN BANK• FUJINOMIYA SHINKIN BANK• Sumitomo Mitsui Trust Asset Management Co., Ltd.• Mitsubishi UFJ Trust and Banking Corporation

16
Financial Strategy and Credit Ratings (1)
Debt Overview
(JPY billion)28th Period
(Ended February 29, 2020)29th Period
(Ended August 31, 2020) Change
Short-Term Loans 3.0 3.0 -Long-Term Loans (Variable-Rate) 4.0 4.0 -Long-Term Loans (Fixed-Rate) 146.5 146.5 -Investment Corporation Bonds - 4.0 +4.0
Total 153.5 157.5 +4.0
LTV 50.8% 51.5% +0.7 points
Appraisal LTV 38.4% 38.6% +0.2 points
Long-Term Debt Ratio 98.0% 98.1% +0.1 points
Long-Term, Fixed-Rate Debt Ratio 95.4% 95.6% +0.2 points
Weighted-Average Interest Rate 0.57% 0.55% -0.02 points
Duration of Long-Term Debt 4.4 years 4.6 years +0.2 years
Lender 25 financial institutions 25 financial
institutions -
Long-Term Loans (Variable-Rate)
2.5%Short-Term Loans
2.0%
Long-Term Loans (Fixed-Rate)93.0%
Long-TermDebt Ratio98.1%
Long-Term,Fixed-Rate Debt Ratio
95.6%
Investment Corporation Bonds
2.5%
Commitment Line
Sumitomo Mitsui Banking Corporation
Maximum amount of borrowing
JPY 5.0 billion
Agreement effective date
August 1, 2016
Agreement termination date
July 31, 2023
Sumitomo Mitsui TrustBank, Limited
Maximum amount of borrowing
JPY 5.0 billion
Agreement effective date
August 1, 2016
Agreement termination date
July 31, 2023
MizuhoBanking Corporation
Maximum amount of borrowing
JPY 5.0 billion
Agreement effective date
October 9, 2018
Agreement termination date
July 31, 2023
Rating and Investment Information, Inc. (R&I)
Issuer rating
AA-Outlook
Stable
S&P Global Ratings Japan Inc. (S&P)
Long-term Corporate
A+Outlook
Stable
Rating Status*Borrowings are classified according to lender contract.

17
8.010.0 10.0
12.0 11.0 11.5
7.08.5
6.0 5.5 5.06.5
5.03.0 4.0 4.5 4.0
9.5
4.0
1.0
1.03.0
1.0
5.01.5
2.0 2.0
0
20
40
60
80
100
120
140
4.1 4.33.8
3.32.7 2.8 2.7 3.1 3.4 3.3 3.4 3.4
4.1 4.24.7
4.9 4.8
4.3 4.3 4.2 4.3 4.3 4.2 4.2 4.4 4.44.6
1.48%1.55%1.45%1.46%1.50%1.46%1.44%1.38%
1.28%1.25%1.24%1.11%1.09%1.02%0.95%
0.87%0.85%0.84%0.78%0.76%0.72%0.67%0.63%0.61%0.59% 0.57%0.55%
0
1
2
3
4
5
6
0.0%
0.5%
1.0%
1.5%
2.0%
Financial Strategy and Credit Ratings (2)
Change in Period-End Weighted Average Interest Rate and Duration of Long-Term Debt
3rd Period
4th Period
5th Period
6th Period
7th Period
8th Period
9th Period
10th Period
11th Period
12th Period
13th Period
14th Period
15th Period
16th Period
17th Period
18th Period
19th Period
20th Period
21st Period
22nd Period
23rd Period
24th Period
25th Period
26th Period
27th Period
28th Period
29th Period
Aug. 2007
Feb. 2008
Aug. 2008
Feb. 2009
Aug. 2009
Feb. 2010
Aug. 2010
Feb. 2011
Aug. 2011
Feb. 2012
Aug. 2012
Feb. 2013
Aug. 2013
Feb. 2014
Aug. 2014
Feb. 2015
Aug. 2015
Feb. 2016
Aug. 2016
Feb. 2017
Aug. 2017
Feb. 2018
Aug. 2018
Feb. 2019
Aug. 2019
Feb. 2020
Aug. 2020
(Years)
Weighted average interest rate (left axis) Duration of long-term debt (right axis)
* Average interest rate is a weighted average of the interest rates on long-term interest-bearing loans.* Average maturity is a weighted average of the maturities of long-term interest-bearing loans.
29th Period Maturities (Long-Term) 29th Period Funding (Long-Term)
Repayment total JPY 9.5 billion Funding total JPY 15.5 billion
Average interest rate 0.59 % Average interest rate 0.43 %
Average maturity 6.5 years Average maturity 8.7 years
Long-Term Interest-Bearing Debt Maturity Ladder(JPY billion)
14
12
10
8
6
4
2
0
Funded in the 29th PeriodLong-term loans Investment Corporation Bonds
30th Period
31st Period
32nd Period
33rd Period
34th Period
35th Period
36th Period
37th Period
38th Period
39th Period
40th Period
41st Period
42nd Period
43rd Period
44th Period
45th Period
46th Period
47th Period
48th Period
49th Period
50th Period
51st Period
52nd Period
53rd Period
Feb. 2021
Aug. 2011
Feb. 2022
Aug. 2022
Feb. 2023
Aug. 2023
Feb. 2024
Aug. 2024
Feb. 2025
Aug. 2025
Feb. 2026
Aug. 2026
Feb. 2027
Aug. 2027
Feb. 2028
Aug. 2028
Feb. 2029
Aug. 2029
Feb. 2030
Aug. 2030
Feb. 2031
Aug. 2031
Feb. 2032
Aug. 2032
Averageinterest rate 0.57% 0.63% 0.61% 0.63% 0.72% 0.65% 0.59% 1.12% 0.33% 0.70% 0.27% 0.29% 0.39% 0.32% 0.23% 0.38% 0.39% 0.49% 0.45% 0.48% 0.65% - 0.65% 0.68%
1.0 2.0

18
5.2 5.3 5.0 0.3 8.015.4
25.3
34.3 39.3 41.846.1
55.4 60.3 65.575.2
84.597.8 102.0
-1.7-10.6 -11.0 -10.5 -10.9 -10.6 -8.8 -7.2 -4.3
4.8% 4.3% 3.5%-1.2%
-7.6%-6.1%-5.6%-5.9%-4.8%-3.8%-3.1%-1.8% 0.1%3.0% 5.5%
9.0% 12.0%13.9% 14.6% 16.3%19.4%21.3%23.1%
26.4%29.4%
34.2%35.0%
-20%
-10%
0%
10%
20%
30%
40%
50%
60%
-200
0
200
400
600
800
1,000
1,200
Unrealized Profit / Loss
Unrealized Profit / Loss and Unrealized Profit / Loss Ratio
NAV per Unit
Unrealized Profit / Loss Ratio (right axis)Unrealized Profit (left axis)Unrealized Loss (left axis)
(JPY billion)
120
100
80
-20
60
40
20
0
3rd Period
4th Period
5th Period
6th Period
7th Period
8th Period
9th Period
10th Period
11th Period
12th Period
13th Period
14th Period
15th Period
16th Period
17th Period
18th Period
19th Period
20th Period
21st Period
22nd Period
23rd Period
24th Period
25th Period
26th Period
27th Period
28th Period
29th Period
Aug. 2007
Feb. 2008
Aug. 2008
Feb. 2009
Aug. 2009
Feb. 2010
Aug. 2010
Feb. 2011
Aug. 2011
Feb. 2012
Aug. 2012
Feb. 2013
Aug. 2013
Feb. 2014
Aug. 2014
Feb. 2015
Aug. 2015
Feb. 2016
Aug. 2016
Feb. 2017
Aug. 2017
Feb. 2018
Aug. 2018
Feb. 2019
Aug. 2019
Feb. 2020
Aug. 2020
* NAV(net asset value) per unit = (Net assets – Total distribution + Unrealized profit or loss) / Units outstanding
(JPY thousand)
292 292 290 261 221 224 225 224 237 242 246 254 273 289 305 327 350 361 366 375 394 404 415 435 455 483 491
0100200300400500
3rd Period
4th Period
5th Period
6th Period
7th Period
8th Period
9th Period
10th Period
11th Period
12th Period
13th Period
14th Period
15th Period
16th Period
17th Period
18th Period
19th Period
20th Period
21st Period
22nd Period
23rd Period
24th Period
25th Period
26th Period
27th Period
28th Period
29th Period
Aug. 2007
Feb. 2008
Aug. 2008
Feb. 2009
Aug. 2009
Feb. 2010
Aug. 2010
Feb. 2011
Aug. 2011
Feb. 2012
Aug. 2012
Feb. 2013
Aug. 2013
Feb. 2014
Aug. 2014
Feb. 2015
Aug. 2015
Feb. 2016
Aug. 2016
Feb. 2017
Aug. 2017
Feb. 2018
Aug. 2018
Feb. 2019
Aug. 2019
Feb. 2020
Aug. 2020
Direct Capitalization Rate on Appraisal Value of Properties Owned at Period-End
4.7% 4.7% 4.7% 5.0% 5.2% 5.4% 5.4% 5.4% 5.4% 5.3% 5.3% 5.2% 5.1% 4.9% 4.8% 4.7% 4.5% 4.5% 4.5% 4.4% 4.3% 4.3% 4.3% 4.2% 4.1% 4.0% 4.0%
3%
4%
5%
6%
3rd Period
4th Period
5th Period
6th Period
7th Period
8th Period
9th Period
10th Period
11th Period
12th Period
13th Period
14th Period
15th Period
16th Period
17th Period
18th Period
19th Period
20th Period
21st Period
22nd Period
23rd Period
24th Period
25th Period
26th Period
27th Period
28th Period
29th Period
Aug. 2007
Feb. 2008
Aug. 2008
Feb. 2009
Aug. 2009
Feb. 2010
Aug. 2010
Feb. 2011
Aug. 2011
Feb. 2012
Aug. 2012
Feb. 2013
Aug. 2013
Feb. 2014
Aug. 2014
Feb. 2015
Aug. 2015
Feb. 2016
Aug. 2016
Feb. 2017
Aug. 2017
Feb. 2018
Aug. 2018
Feb. 2019
Aug. 2019
Feb. 2020
Aug. 2020

19
Forecasts (1) (30th Period: September 2020 - February 2021)(31st Period: March 2021 - August 2021)
(JPY million)
29th Period (Actual results)
(Ended Aug. 31, 2020)①
30th Period(Forecast)
(Ending Feb. 28, 2021)②
Comparison with the 29th Period31st Period
(Forecast)(Ending Aug. 31, 2021)
③
Comparison with the 30th Period
Change②-① Notes Change
③-② Notes
Total Revenues 11,520 11,577 +57
(JPY million)
Revenues +57Existing properties -73Full-period contributionof 2 properties acquired in the 29th Period +811 property acquired in the 30th Period +49
Operating expenses +53Rental expenses +38Real estate taxes -0Depreciation and amortization -17Asset management fees +2Other expenses +30
Non-operating income -12
Non-operating expenses +4Interest expense +4
11,711 +134(JPY million)
Revenues +134Existing properties +125Full-period contribution of 1 property acquired in the 30th Period +8
Operating expenses +197Rental expenses +165Real estate taxes +11Depreciation and amortization +3Asset management fees +2Other expenses +13
Non-operating expenses +19Interest expense +19
Operating Income 5,332 5,335 +3 5,272 -63
Net Income 4,897 4,884 -13 4,801 -82
Total Distributions 4,897 4,883 -13 4,801 -82
Distribution per Unit
10,108yen
10,080yen
-28yen
9,910yen
-170yen
Units Outstanding
484,522units
484,522units - 484,522
units -
AUM
Total Acquisition Price*
316,208 318,441 2,233 318,441 -
No. of Investment properties
128properties
129properties
+1property
129properties -
Average Month-End Occupancy Rate
96.8%
96.5%
-0.3points
96.3%
-0.2Points
LTV (At the end of the Period)
51.5%
51.9%
+0.4points
51.9% -
* Acquisition-related expenses, property tax, and consumption tax are not included.

20
Forecasts (2) (30th Period: September 2020 - February 2021)(31st Period: March 2021 - August 2021)
10,080 9,910
10,08010,108
-110 +119-5
-97
10,108-97 +0 -6
-68
<30th Period>…Tenant turnover is low in fiscal periods ending in February and rental revenues for existing properties tend to result in decrease in income and increase in profit.▶ Although the occupancy rate will recover gradually in the second half of the fiscal period due to lease contracts exceeding cancellation, which is not large with the
impact of COVID-19, it is assumed that it will recovery more moderately than normal in the 30th period. While full-year expected occupancy rate will decline by 0.3points period on period and profit at existing properties will decrease also caused by absence of profit due to temporary decrease in expenses in the 29th period,distribution per unit is expected to be the same level as that of the 28th Period with properties acquired in 29th and 30th periods contributing to revenue.
<31st Period>…Tenant turnover is high in fiscal periods ending in August and rental revenues for existing properties tend to result in increase in income and decrease in profit.▶ Full-year occupancy rate is expected to decline by 0.2 points period on period due to decrease in occupancy in April and May due to tenant replacement, as usual.
Profit for existing properties will decrease slightly period on period.
10,042
(Reference) Comparison with same period of previous year
Factors in increase Factors in decrease (Unit: JPY)
Existing properties
Asset management fees
Full-period contribution of 2 properties acquired
in the 29th Period
Others
29th Period (Actual results)
(Ended Aug. 2020)
30th Period(Forecast)
(Ending Feb. 2021)
28th Period(Actual results)
(Ended Feb. 2020)
Factors in Change of Distribution per Unit (30th Period Forecast vs. 29th Period Actual)
Factors in Change of Distribution per Unit(31st Period Forecast vs. 30th Period Forecast)
Existing properties Others
30th Period(Forecast)
(Ending Feb. 2021)
31st Period(Forecast)
(Ending Aug. 2021)
29th Period(Actual results)
(Ended Aug. 2020)
+651 new property
acquired in the 30th Period
Full-period contribution of 1 property
acquired in the 30th Period
Asset management fees
Expected Occupancy Rate*
96.3%
Expected Occupancy Rate*
96.5%
* Occupancy rate is the average month-end occupancy rate during the period.

21
Supplementary Explanation for Forecasts for the 31st Period (Comparison with Forecasts for the 29th and 31st Periods)
■ Factors in Change of Distribution per Unit (31st Period Forecast vs. 29th Period Forecast) (Unit: JPY)Factors in increase Factors in decrease
9,7809,910
-11 +11
29th Period (Forecast)
(Ended Aug. 2020)
Existing properties
Full-period contribution of
Park Axis Akatsuka
Others
-23
31st Period (Forecast)
(Ending Aug. 2021)
+131Asset
management feesAcquisition of
Park Cube Oimachi
Residence
Acquisition ofPark Axis Toyocho
Shinsui Koen
+66 -45
▶ Decrease in occupancy rate -JPY 120 million (occupancy rate change: -1.2%)▶ Increase in rent +JPY 90 million
-JPY 30 million (-JPY 61 per unit)▶ Decrease in expenses +JPY 24 million (+JPY 50 per unit)
Expected Occupancy Rate*
97.5%
Expected Occupancy Rate*
96.3%* Occupancy rate is the average month-
end occupancy rate during the period.
<A comparison of the forecast for the 31st Period and the forecast for the same period of the previous year is being made to exclude temporary effects of the declaration of the state of emergency and seasonal factors (not assuming the effects of COVID-19).>
▶ Due to the impact of COVID-19, expecting decrease in occupancy rate over the period from the 29th Period to the 31st Period. Recovery is assumed to become moderate, yet not fall far below 96%.
▶ On the other hand, the assumption is that increase in rent can continue to be expected to a certain degree for the overall portfolio.▶ Furthermore, when decrease in tenant turnover expenses and other factors are taken into account, existing propertiesʼ downward pressure on
DPU is expected to be limited (-JPY 11).▶ Over the period from the 29th Period to the 30th Period, JPY 8.7 billion of properties have been acquired, having the effect of boosting DPU by
approximately JPY 200.
=> Steady DPU growth remains

22
2015 Public Offering2013 Public Offering
7,274 7,153
7,445
6,858
7,444 7,672
7,984
7,688
8,036 8,130
8,428 8,497
9,179 9,161
9,706
10,449
10,042 10,108
10,0809,910
53.1 54.7 54.7
50.8 51.2 53.5 53.2
50.6 50.2 50.4 50.1 50.2 50.0 50.1 50.4 51.0 50.8 51.5
0
10
20
30
40
50
60
6,000
7,000
8,000
9,000
10,000
11,000
12,000
Achieved stable DPU while controlling LTV
Track Record of Distributions
Distribution per Unit (JPY)
12th Period 13th Period 14th Period 15th Period 16th Period 17th Period 18th Period 19th Period 20th Period 21st Period 22nd Period 23rd Period 24th Period 25th Period 26th Period 27th Period 28th Period 29th Period 30th Period 31st PeriodFeb. 2012 Aug. 2012 Feb. 2013 Aug. 2013 Feb. 2014 Aug. 2014 Feb. 2015 Aug. 2015 Feb. 2016 Aug. 2016 Feb. 2017 Aug. 2017 Feb. 2018 Aug. 2018 Feb. 2019 Aug. 2019 Feb. 2020 Aug. 2020 Feb. 2021 Aug. 2021
LTV(%)
(Forecast)(Forecast)
Average Annual Growth DPU
3 years 6.3%
5 years 6.3%
10 years 4.7%
* NAF implemented a two-for-one split of investment units with an effective date of March 1, 2014. Distribution per unit for the 16th Period and earlier are adjusted for this split (actual distribution divided in half, rounded down to the nearest yen).
Actual distribution per unit (left axis)Forecast distribution per unit (left axis) LTV (right axis)

MEMO

Features and Strategies

25
Features and Strategies (1) Investment in Accommodation AssetsCore Investment Strategy:
Continuing Acquisition of Rental Apartments and Stable Operations■ Proportion of Investment in Assets
■ Investment Areas
■ Investment in Accommodation Assets
賃貸住宅
Rental Apartments Over 90%
Tokyo 23 WardsOver 80%
Rental Apartments
Hospitality Facilities
Accommodation Assets(Real estate primarily used as residences and hotels)
▶ Dormitories, Corporate Housing ▶ Serviced Apartments
▶ Senior Residences ▶ Hotels
Rental Apartments
Tokyo23 Wards
Portfolio share
Portfolio share
Rental Apartments: Greater Tokyo*1, mainly the 23 wards of Tokyo, and Other Major Cities*2
Hospitality Facilities: Major cities throughout Japan and their suburbs *1 Tokyo, Kanagawa Prefecture, Chiba Prefecture, and Saitama Prefecture*2 Each of the urban areas of the cities of Sapporo, Sendai, Nagoya, Osaka, Kyoto, Kobe,
Hiroshima, and Fukuoka
(As of August 31, 2020: 95.0 %)
(As of August 31, 2020: 85.2 %)

26
Features and Strategies (2) Leveraging the Mitsui Fudosan Group
Fully Leverage the Expertise and Support of the Companies That Comprisethe Value Chain of Mitsui Fudosan Groupʼs Residential Leasing Business
Leasing
Market Research/Analysis Site Acquisition
Planning and Design
Construction Management/ Supervision
Management/ Operation
Feedback to Planning/
Development Comprehensive operating system
conducted by the Mitsui Fudosan Group
Tenant Brokerage
Parent Company of REIT Management Company
Operation & Planning/Development of Residential Leasing Business Provision of Property Information
Provide various housing and lifestyle services for continued strong customer relationships
Mitsui Housing Loop- Membership services-
Residential Building Maintenance
Provision of Property Information
Property Management
REIT Management

MEMO

Appendix(1)
Portfolio
29
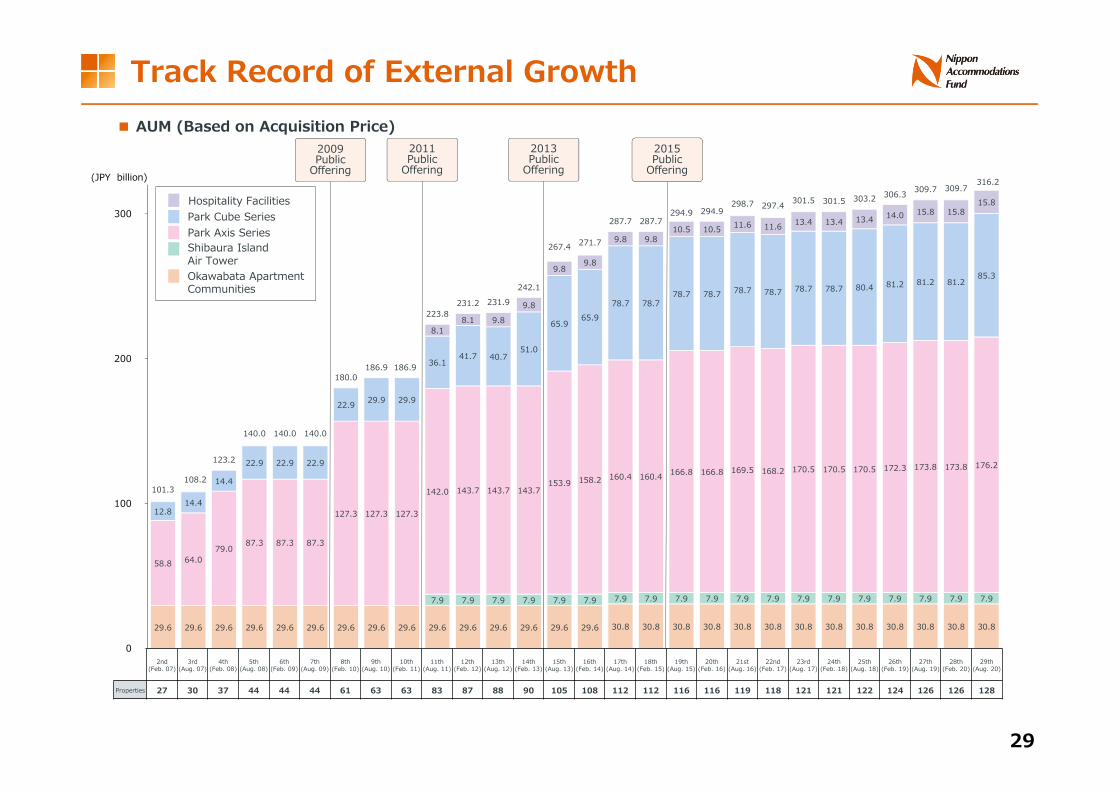
Track Record of External Growth■ AUM (Based on Acquisition Price)
29.6 29.6 29.6 29.6 29.6 29.6 29.6 29.6 29.6 29.6 29.6 29.6 29.6 29.6 29.6 30.8 30.8 30.8 30.8 30.8 30.8 30.8 30.8 30.8 30.8 30.8 30.8 30.8
7.9 7.9 7.9 7.9 7.9 7.9 7.9 7.9 7.9 7.9 7.9 7.9 7.9 7.9 7.9 7.9 7.9 7.9 7.9
58.8 64.079.0 87.3 87.3 87.3
127.3 127.3 127.3
142.0 143.7 143.7 143.7153.9 158.2 160.4 160.4 166.8 166.8 169.5 168.2 170.5 170.5 170.5 172.3 173.8 173.8 176.2
12.814.4
14.4
22.9 22.9 22.9
22.9 29.9 29.9
36.141.7 40.7
51.0
65.965.9
78.7 78.778.7 78.7 78.7 78.7 78.7 78.7 80.4 81.2 81.2 81.2
85.3
8.18.1 9.8
9.8
9.89.8
9.8 9.810.5 10.5 11.6 11.6 13.4 13.4 13.4 14.0 15.8 15.8
15.8
101.3108.2
123.2
140.0 140.0 140.0
180.0186.9 186.9
223.8231.2 231.9
242.1
267.4 271.7
287.7 287.7294.9 294.9
298.7 297.4 301.5 301.5 303.2 306.3 309.7 309.7316.2
0
1,000
2,000
3,000
2009Public
Offering
2011Public
Offering
2013Public
Offering
2015Public
Offering(JPY billion)
Okawabata Apartment Communities
Shibaura Island Air Tower
Park Axis SeriesPark Cube SeriesHospitality Facilities
300
200
100
02nd
(Feb. 07)3rd
(Aug. 07)4th
(Feb. 08)5th
(Aug. 08)6th
(Feb. 09)7th
(Aug. 09)8th
(Feb. 10)9th
(Aug. 10)10th
(Feb. 11)11th
(Aug. 11)12th
(Feb. 12)13th
(Aug. 12)14th
(Feb. 13)15th
(Aug. 13)16th
(Feb. 14)17th
(Aug. 14)18th
(Feb. 15)19th
(Aug. 15)20th
(Feb. 16)21st
(Aug. 16)22nd
(Feb. 17)23rd
(Aug. 17)24th
(Feb. 18)25th
(Aug. 18)26th
(Feb. 19)27th
(Aug. 19)28th
(Feb. 20)29th
(Aug. 20)
Properties 27 30 37 44 44 44 61 63 63 83 87 88 90 105 108 112 112 116 116 119 118 121 121 122 124 126 126 128

30
Single41.3%
Compact41.5%
Family12.8%
Large4.4%
Tokyo CBD
33.1%
Tokyo 23 Wardsexcluding Tokyo CBD
55.3%
GreaterTokyo4.1%
Other Major Cities7.5%
Rental Apartments Characteristics
Average: 42.5 m2
per UnitAverage: 42.5 m2
per Unit
Unit Area 4
* Calculation based on total monthly rent (rent andcommon area fees) per unit as of August 31, 2020.
Average: JPY 156 thousandper Unit
Average: JPY 156 thousandper Unit
Monthly Rent per Unit5
* The data above are calculations for rental apartments owned as of August 31, 2020, and do not include Hospitality Facilities.* The calculations for graphs 1 and 3 are based on acquisition price.* The calculations for graphs 2, 4, and 5 are based on units, excluding retail units.
Tokyo 23 wards:
88.4%Tokyo 23 wards:
88.4%
Location1
* Tokyo CBD (Central Business District) includes Minato, Chuo and Chiyoda wards.
Average:14.3 years(12.4 years excluding Okawabata)
Average:14.3 years(12.4 years excluding Okawabata)
Property Age3
* The calculations are based on individual property ageas of August 31, 2020.
Studio: 1K, studio1 Bed: 1DK, 1LDK, 1LDK + utility room2 Bed: 2DK, 2LDK, 2LDK + utility room3 Bed: 3DK, 3LDK, 3LDK + utility room4 Bed: 4DK, 4LDK, 4LDK + utility room
Single and Compact Units:
82.8%Single and Compact Units:
82.8%
Category2
*Calculation based on unit categories as of August 31, 2020.
Less than 5years3.6%
5-10 years10.4%
10-15 years
66.0%
15-20 years9.7%
20 yearsor more10.3%
Less than JPY 100,00023.3%
JPY 100,000-150,00030.1%
JPY 150,000-200,00024.4%
JPY 200,000-300,00018.4%
JPY 300,000-500,0003.2%
JPY 500,000 or more
0.6%<30m2 ≧30 m2
<40 m2≧40 m2
<50 m2≧50 m2
<60 m2≧60 m2
<70 m2≧70 m2
<80 m2≧80 m2
<90 m2≧90 m2
<100 m2 ≧100 m2
STUDIO S S C C L L L L L1BED S C C C L L L L L2BED C C C F F L L L3BED F F F F L L4BED F F F F L
Less than 30 m2
34.1%
30-40 m2
19.0%40-50 m2
16.2%
50-60 m2
13.5%
60-80 m2
12.3%
80 m2 or more4.9%

31
Tenant Characteristics
* All data above are based on information provided by tenants at the point of contract.* The data above are calculations for rental apartments owned as of August 31, 2020, excluding retail units and hospitality facilities.
Individual55.5%
Corporate44.5%
Under 3019.4%
30-3930.3%40-49
24.3%
50-5918.1%
60 or older7.9%
Male62.8%
Female37.2%
1 person66.3%
2 people24.3%
3 people6.1%
4 people2.8%
5 people or more
0.5%
Lessee Type1
Age2
Number of Occupants 3
Gender of Single Occupants4

32
Less than 5 years13.3%
5-10 years26.1%
10-15 years51.2%
15-20 years4.9%
20 years or more4.5%
Hospitality Facilities Owned
Hospitality Facilities Maximum of 10%
Rental ApartmentsOver 90%
Hospitality FacilitiesHospitality FacilitiesMaximum of 10%
▶ Dormitories, Corporate Housing
▶ Senior Residences
▶ Serviced Apartments
▶ Hotels
Hospitality Facilities with Stable Cash Flow
Number of
Properties 16
■ Hospitality Facilities Owned (As of the end of the 29th Period)
■ Investment Target ■ Portfolio Share
1. Calculated based on acquisition price.2. Calculated based on years remaining on lease
contracts at each property as of August 31, 2020.
Average remaining years
9.3 years
▶ Long-Term Lease Contracts ▶ Fixed Rents
Acquisition price
JPY 15.8 billion
Portfolio share
5.0%
▶ Highly Competent and Trustworthy Operators
Kyoritsu Maintenance
Dormitories, Corporate Housing
operators J.S.B.
Benesse Style Care
SHR Hotels
Senior Residence operator
Hotel operator
Fixed rent ratio: 100%

33
Portfolio Map
※ NAFʼs portfolio consisted of 128 properties as of August 31, 2020.※ Circled numbers correspond to the property numbers on pages 34 to 38.
●Rental Apartments■Hospitality Facilities
Tokyo 23 Wards: 93 Properties Greater Tokyo: 12 Properties
Other Major Cities: 23 Properties
34
Single Compact Family LargeRetail,
etc.
River Point Tower 1.8 Park Side Wings 2.7 Pier West House 2.7 Okawabata Parking 1.7
2 Setagaya-ku, Tokyo 2004.10 2005.11 1,760 0.6 2,437.66 64 37 21 6 - - 5.0 4 Shibuya-ku, Tokyo 2005.08 2005.11 3,230 1.0 2,766.62 75 51 24 - - - 4.1 5 Minato-ku, Tokyo 2005.08 2005.11 1,730 0.5 1,537.24 40 12 28 - - - 4.5 6 Shinjuku-ku, Tokyo 2004.08 2006.03 1,400 0.4 1,891.05 59 44 15 - - - 3.0 7 Minato-ku, Tokyo 2005.09 2006.04 5,140 1.6 4,704.44 99 29 39 26 5 - 4.2 8 Bunkyo-ku, Tokyo 2005.09 2006.04 4,440 1.4 6,078.93 154 80 70 4 - - 3.6 9 Chuo-ku, Tokyo 2005.11 2006.04 930 0.3 1,383.99 30 - 30 - - - 3.2
10 Toshima-ku, Tokyo 2006.01 2006.04 1,655 0.5 2,606.37 52 - 39 13 - - 2.4 11 Minato-ku, Tokyo 2003.02 2006.08 3,939 1.2 3,938.14 64 - 38 16 10 - 3.0 13 Chuo-ku, Tokyo 2004.08 2006.08 7,557 2.4 10,025.40 185 66 34 64 20 1 4.5 14 Minato-ku, Tokyo 2004.12 2006.08 2,025 0.6 2,426.45 80 67 12 - 1 - 3.3 15 Bunkyo-ku, Tokyo 2005.11 2006.08 2,910 0.9 3,317.94 87 40 46 - - 1 4.0 16 Minato-ku, Tokyo 2005.12 2006.08 2,860 0.9 2,710.69 70 30 40 - - - 3.5 17 Minato-ku, Tokyo 2006.01 2006.08 2,170 0.7 2,054.46 46 3 37 6 - - 5.8 18 Bunkyo-ku, Tokyo 2006.02 2006.08 9,710 3.1 12,025.25 324 178 136 9 1 - 3.9 19 Taito-ku, Tokyo 2006.02 2006.08 1,070 0.3 1,621.73 42 11 31 - - - 4.0 20 Bunkyo-ku, Tokyo 2005.08 2006.08 1,760 0.6 2,160.12 60 - 60 - - - 3.9 21 Chiyoda-ku, Tokyo 2005.10 2006.08 2,454 0.8 3,194.59 95 64 25 4 2 - 2.4 22 Shinjuku-ku, Tokyo 2005.10 2006.08 1,949 0.6 2,288.46 53 - 51 - 2 - 2.9 23 Taito-ku, Tokyo 2006.01 2006.08 2,508 0.8 4,012.68 76 6 46 24 - - 2.8 24 Taito-ku, Tokyo 2006.03 2006.08 2,233 0.7 3,041.61 91 25 66 - - - 2.8 29 Meguro-ku, Tokyo 2006.07 2007.04 1,810 0.6 1,884.77 60 15 45 - - - 5.8
East 3.4 West 3.3
31 Chiyoda-ku, Tokyo 2006.09 2007.09 1,200 0.4 1,346.07 41 18 23 - - - 3.3 32 Koto-ku, Tokyo 2007.03 2007.09 3,950 1.2 5,412.40 140 - 140 - - - 5.8 33 Kita-ku, Tokyo 2007.03 2007.09 1,820 0.6 2,924.75 49 - 43 5 - 1 4.0 34 Taito-ku, Tokyo 2007.07 2007.09 2,717 0.9 3,400.78 79 26 52 - - 1 3.2
- 4,395.99 152 122 30 - - Park Axis Shin Itabashi Itabashi-ku, Tokyo 2007.02 2007.04 3,430 1.1
544 - 52 297 195 - Chuo-ku, Tokyo 1989.03 2005.11 30,816 9.7 43,812.41
Park Axis Asakusabashi
Park Axis AkihabaraPark Axis ToyochoPark Axis Takinogawa
Park Axis Meguro Honcho
30
Park Cube IchigayaPark Cube Asakusa TawaramachiPark Cube Ueno
Park Axis OkachimachiPark Cube HongoPark Cube Kanda
Park Axis Tameike SannoPark Axis Roppongi Hinokicho KoenPark Axis Ochanomizu Stage
Park Axis Nihonbashi StagePark Axis HamamatsuchoPark Axis Hongo no Mori
Park Axis TsukishimaPark Axis OtsukaPark Axis Minami Azabu
Park Axis Kagurazaka StagePark Axis ShirokanedaiPark Axis Bunkyo Stage
Park Axis Gakugei DaigakuPark Axis Shibuya JinnanPark Axis Aoyama Kotto Dori
Okawabata Apartment Communities
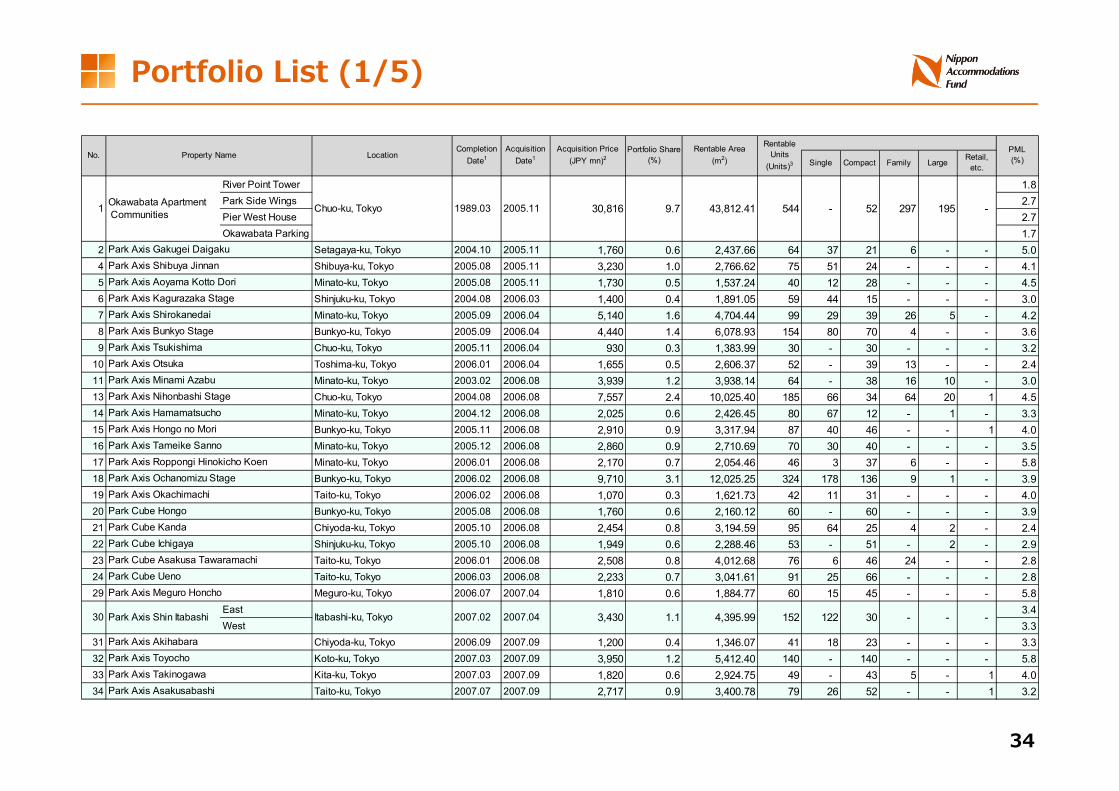
Portfolio Share(%)
Rentable Area(m2)
RentableUnits
(Units)3PML(%)
1
No. Property Name LocationCompletion
Date1Acquisition
Date1Acquisition Price
(JPY mn)2
Portfolio List (1/5)
35
Single Compact Family LargeRetail,
etc.
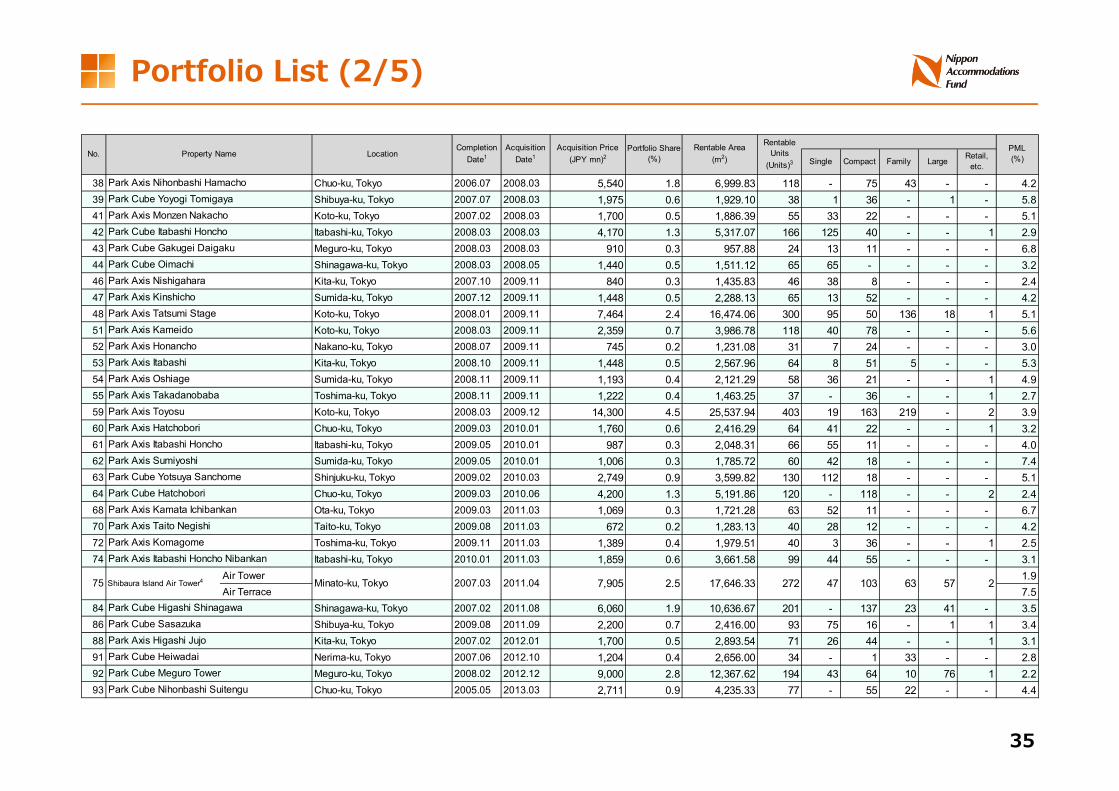
38 Chuo-ku, Tokyo 2006.07 2008.03 5,540 1.8 6,999.83 118 - 75 43 - - 4.2 39 Shibuya-ku, Tokyo 2007.07 2008.03 1,975 0.6 1,929.10 38 1 36 - 1 - 5.8 41 Koto-ku, Tokyo 2007.02 2008.03 1,700 0.5 1,886.39 55 33 22 - - - 5.1 42 Itabashi-ku, Tokyo 2008.03 2008.03 4,170 1.3 5,317.07 166 125 40 - - 1 2.9 43 Meguro-ku, Tokyo 2008.03 2008.03 910 0.3 957.88 24 13 11 - - - 6.8 44 Shinagawa-ku, Tokyo 2008.03 2008.05 1,440 0.5 1,511.12 65 65 - - - - 3.2 46 Kita-ku, Tokyo 2007.10 2009.11 840 0.3 1,435.83 46 38 8 - - - 2.4 47 Sumida-ku, Tokyo 2007.12 2009.11 1,448 0.5 2,288.13 65 13 52 - - - 4.2 48 Koto-ku, Tokyo 2008.01 2009.11 7,464 2.4 16,474.06 300 95 50 136 18 1 5.1 51 Koto-ku, Tokyo 2008.03 2009.11 2,359 0.7 3,986.78 118 40 78 - - - 5.6 52 Nakano-ku, Tokyo 2008.07 2009.11 745 0.2 1,231.08 31 7 24 - - - 3.0 53 Kita-ku, Tokyo 2008.10 2009.11 1,448 0.5 2,567.96 64 8 51 5 - - 5.3 54 Sumida-ku, Tokyo 2008.11 2009.11 1,193 0.4 2,121.29 58 36 21 - - 1 4.9 55 Toshima-ku, Tokyo 2008.11 2009.11 1,222 0.4 1,463.25 37 - 36 - - 1 2.7 59 Koto-ku, Tokyo 2008.03 2009.12 14,300 4.5 25,537.94 403 19 163 219 - 2 3.9 60 Chuo-ku, Tokyo 2009.03 2010.01 1,760 0.6 2,416.29 64 41 22 - - 1 3.2 61 Itabashi-ku, Tokyo 2009.05 2010.01 987 0.3 2,048.31 66 55 11 - - - 4.0 62 Sumida-ku, Tokyo 2009.05 2010.01 1,006 0.3 1,785.72 60 42 18 - - - 7.4 63 Shinjuku-ku, Tokyo 2009.02 2010.03 2,749 0.9 3,599.82 130 112 18 - - - 5.1 64 Chuo-ku, Tokyo 2009.03 2010.06 4,200 1.3 5,191.86 120 - 118 - - 2 2.4 68 Ota-ku, Tokyo 2009.03 2011.03 1,069 0.3 1,721.28 63 52 11 - - - 6.7 70 Taito-ku, Tokyo 2009.08 2011.03 672 0.2 1,283.13 40 28 12 - - - 4.2 72 Toshima-ku, Tokyo 2009.11 2011.03 1,389 0.4 1,979.51 40 3 36 - - 1 2.5 74 Itabashi-ku, Tokyo 2010.01 2011.03 1,859 0.6 3,661.58 99 44 55 - - - 3.1
Air Tower 1.9 Air Terrace 7.5
84 Shinagawa-ku, Tokyo 2007.02 2011.08 6,060 1.9 10,636.67 201 - 137 23 41 - 3.5 86 Shibuya-ku, Tokyo 2009.08 2011.09 2,200 0.7 2,416.00 93 75 16 - 1 1 3.4 88 Kita-ku, Tokyo 2007.02 2012.01 1,700 0.5 2,893.54 71 26 44 - - 1 3.1 91 Nerima-ku, Tokyo 2007.06 2012.10 1,204 0.4 2,656.00 34 - 1 33 - - 2.8 92 Meguro-ku, Tokyo 2008.02 2012.12 9,000 2.8 12,367.62 194 43 64 10 76 1 2.2 93 Chuo-ku, Tokyo 2005.05 2013.03 2,711 0.9 4,235.33 77 - 55 22 - - 4.4
2 17,646.33 272 47 103 63 57 Shibaura Island Air Tower4 Minato-ku, Tokyo 2007.03 2011.04 7,905 2.5
Park Cube HeiwadaiPark Cube Meguro TowerPark Cube Nihonbashi Suitengu
Park Cube Higashi ShinagawaPark Cube SasazukaPark Axis Higashi Jujo
Park Axis Itabashi Honcho Nibankan
75
Park Axis Kamata IchibankanPark Axis Taito NegishiPark Axis Komagome
Park Axis SumiyoshiPark Cube Yotsuya SanchomePark Cube Hatchobori
Park Axis ToyosuPark Axis HatchoboriPark Axis Itabashi Honcho
Park Axis ItabashiPark Axis OshiagePark Axis Takadanobaba
Park Axis Tatsumi StagePark Axis KameidoPark Axis Honancho
Park Cube OimachiPark Axis NishigaharaPark Axis Kinshicho
Park Axis Monzen NakachoPark Cube Itabashi HonchoPark Cube Gakugei Daigaku
Park Axis Nihonbashi HamachoPark Cube Yoyogi Tomigaya
Portfolio Share(%)
Rentable Area(m2)
RentableUnits
(Units)3PML(%)No. Property Name Location
CompletionDate1
AcquisitionDate1
Acquisition Price(JPY mn)2
Portfolio List (2/5)

36
Single Compact Family LargeRetail,
etc.
94 Chuo-ku, Tokyo 2005.06 2013.03 2,269 0.7 3,358.63 77 - 77 - - - 3.0 95 Chuo-ku, Tokyo 2006.03 2013.03 1,105 0.3 1,695.06 28 - 18 9 - 1 3.2 96 Sumida-ku, Tokyo 2006.03 2013.03 1,252 0.4 2,241.63 45 9 36 - - - 4.6 97 Koto-ku, Tokyo 2008.03 2013.03 696 0.2 1,159.84 36 18 18 - - - 3.7 98 Taito-ku, Tokyo 2011.12 2013.03 1,079 0.3 1,569.00 48 24 24 - - - 3.4 99 Kita-ku, Tokyo 2012.01 2013.03 1,439 0.5 2,326.32 56 14 42 - - - 3.9
100 Taito-ku, Tokyo 2012.01 2013.03 1,389 0.4 1,992.29 59 31 28 - - - 3.3 101 Taito-ku, Tokyo 2012.05 2013.03 1,369 0.4 1,890.20 58 38 20 - - - 3.8 103 Chuo-ku, Tokyo 2012.06 2013.03 1,809 0.6 2,355.07 72 37 35 - - - 3.0 104 Sumida-ku, Tokyo 2012.06 2013.04 1,369 0.4 2,085.62 60 32 28 - - - 7.5 105 Bunkyo-ku, Tokyo 2005.10 2013.06 2,670 0.8 3,581.09 68 13 29 26 - - 2.7 106 Koto-ku, Tokyo 2007.08 2013.07 3,020 1.0 4,442.09 122 88 33 - - 1 5.5 108 Taito-ku, Tokyo 2012.09 2013.09 1,299 0.4 1,847.01 49 23 26 - - - 3.0 110 Chuo-ku, Tokyo 2013.02 2013.09 1,469 0.5 1,808.12 49 13 36 - - - 2.5 111 Kita-ku, Tokyo 2009.11 2014.03 4,110 1.3 19,693.35 358 - 229 111 17 1 2.5 112 Minato-ku, Tokyo 2007.01 2014.03 8,650 2.7 8,389.91 165 74 21 44 26 - 2.4 113 Minato-ku, Tokyo 2012.10 2014.04 1,045 0.3 1,273.60 42 30 12 - - - 5.2 114 Taito-ku, Tokyo 2013.05 2014.04 1,095 0.3 1,456.35 45 30 15 - - - 3.0 115 Ota-ku, Tokyo 2012.09 2015.04 4,144 1.3 4,582.72 158 123 34 - - 1 3.2 116 Sumida-ku, Tokyo 2013.09 2015.04 1,251 0.4 1,793.33 56 34 22 - - - 4.0 117 Sumida-ku, Tokyo 2014.01 2015.04 1,055 0.3 1,610.49 49 34 15 - - - 5.2 120 Ota-ku, Tokyo 2014.08 2016.04 1,450 0.5 1,621.94 55 40 15 - - - 9.6 121 Taito-ku, Tokyo 2015.01 2016.04 1,250 0.4 1,460.10 45 30 15 - - - 4.0 122 Suginami-ku, Tokyo 2015.02 2017.04 2,300 0.7 2,679.96 85 55 30 - - - 5.1 125 Itabashi-ku, Tokyo 2016.11 2018.03 1,700 0.5 1,930.12 71 70 - - - 1 2.9 126 Shinjuku-ku, Tokyo 2014.12 2018.09 2,400 0.8 1,809.56 58 48 9 - - 1 3.4 129 Sumida-ku, Tokyo 2016.12 2019.03 2,610 0.8 2,498.08 80 48 32 - - - 6.6 130 Ota-ku, Tokyo 2015.03 2019.04 1,260 0.4 1,391.34 45 24 21 - - - 6.7 132 Itabashi-ku, Tokyo 2018.09 2020.03 2,420 0.8 2,403.67 88 73 13 - - 2 3.2 133 Shinagawa-ku, Tokyo 2018.01 2020.07 4,064 1.3 2,989.82 120 92 27 - - 1 4.0
265,438 83.9 381,584.00 8,470 3,130 3,621 1,218 473 28
26 Hachioji-shi, Tokyo 2005.08 2006.08 1,130 0.4 3,082.32 48 - 14 33 - 1 4.0
Tokyo 23 Wards Total
Park Cube Keio Hachioji II
Park Axis Ikegami
Park Axis Akatsuka5
Park Cube Oimachi Residence6
Park Cube Shin ItabashiPark Cube Nishi ShinjukuPark Axis Oshiage Terrace
Park Axis Magome ResidencePark Axis Higashi UenoPark Axis Higashi Koenji
Park Axis Kamata Station GatePark Axis Kinshicho ResidencePark Axis Oshiage Sumida Koen
Park Cube Atagoyama TowerPark Axis ShibauraPark Axis Asakusa Kuramae
Park Axis Shin Okachimachi EastPark Axis Nihonbashi HonchoPark Cube Nishigahara Stage
Park Axis Kinshicho Shinsui KoenPark Cube Kasuga AndozakaPark Cube Kameido
Park Axis UenoPark Axis Akihabara EastPark Axis Kayabacho
Park Axis Kiyosumi ShirakawaPark Axis Asakusabashi NichomePark Axis Nishi Sugamo
Park Cube Ginza EastPark Cube KayabachoPark Cube Honjo Azumabashi
Portfolio Share(%)
Rentable Area(m2)
RentableUnits
(Units)3PML(%)No. Property Name Location
CompletionDate1
AcquisitionDate1
Acquisition Price(JPY mn)2
Portfolio List (3/5)

37
Single Compact Family LargeRetail,
etc.
40 Funabashi-shi, Chiba 2007.09 2008.03 1,020 0.3 2,074.35 55 25 30 - - - 3.2 66 Minami-ku, Yokohama-shi, Kanagawa 2008.03 2011.03 1,419 0.4 2,706.59 100 96 3 - - 1 6.3 67 Chuo-ku, Chiba-shi, Chiba 2008.05 2011.03 1,679 0.5 3,318.15 84 66 11 - - 7 1.9 69 Chuo-ku, Chiba-shi, Chiba 2009.03 2011.03 970 0.3 2,270.32 91 91 - - - - 2.3 85 Matsudo-shi, Chiba 2009.02 2011.09 1,200 0.4 2,358.66 109 108 - - - 1 1.6 87 Nakahara-ku, Kawasaki-shi, Kanagawa 2009.09 2011.09 2,250 0.7 3,057.36 136 136 - - - - 3.3
102 Kanagaw a-ku, Yokohama-shi, Kanagaw a 2012.06 2013.03 1,119 0.4 1,682.46 63 45 18 - - - 4.1 109 Naka-ku, Yokohama-shi, Kanagawa 2012.10 2013.09 1,539 0.5 2,325.92 71 47 23 - - 1 8.2
12,326 3.9 22,876.13 757 614 99 33 - 11
27 Nakamura-ku, Nagoya-shi, Aichi 2006.02 2006.08 2,440 0.8 5,565.13 169 114 46 9 - - 3.7 35 Naka-ku, Nagoya-shi, Aichi 2006.11 2007.09 1,920 0.6 3,821.75 99 56 42 - - 1 2.9 36 Chuo-ku, Fukuoka-shi, Fukuoka 2007.03 2007.09 1,515 0.5 3,473.67 112 55 56 - - 1 2.5 37 Hakata-ku, Fukuoka-shi, Fukuoka 2007.03 2007.09 1,890 0.6 4,668.29 177 176 - - - 1 3.0 45 Hakata-ku, Fukuoka-shi, Fukuoka 2007.08 2009.11 742 0.2 2,707.88 112 112 - - - - 2.9 49 Higashi-ku, Nagoya-shi, Aichi 2008.02 2009.11 1,547 0.5 4,735.89 86 6 45 35 - - 3.0 50 Wakabayashi-ku, Sendai-shi, Miyagi 2008.03 2009.11 2,320 0.7 8,843.17 204 - 175 28 1 - 2.8 56 Hakata-ku, Fukuoka-shi, Fukuoka 2008.12 2009.11 960 0.3 3,461.85 112 34 78 - - - 2.7 57 Minami-ku, Fukuoka-shi, Fukuoka 2009.03 2009.11 605 0.2 2,289.21 70 16 54 - - - 5.1 58 Chuo-ku, Sapporo-shi, Hokkaido 2008.02 2009.12 1,650 0.5 7,845.01 146 - 133 13 - - 1.1 65 Atsubetsu-ku, Sapporo-shi, Hokkaido 2008.03 2011.03 827 0.3 3,729.05 85 - 84 - - 1 2.4 73 Nishi-ku, Osaka-shi, Osaka 2010.01 2011.03 2,399 0.8 4,952.45 133 92 41 - - - 8.6
107 Chuo-ku, Osaka-shi, Osaka 2007.01 2013.07 1,970 0.6 4,683.33 138 97 41 - - - 5.7 127 Naka-ku, Nagoya-shi, Aichi 2006.02 2018.09 1,770 0.6 4,795.13 63 - - 63 - - 4.4
22,555 7.1 65,571.81 1,706 758 795 148 1 4 300,319 95.0 470,031.94 10,933 4,502 4,515 1,399 474 43
76 Ashiya-shi, Hyogo 2002.09 2011.03 928 0.3 3,729.45 140 - - - - - 6.6 77 Nakagyo-ku, Kyoto-shi, Kyoto 2004.03 2011.03 991 0.3 3,492.88 134 - - - - - 12.9 78 Kamigyo-ku, Kyoto-shi, Kyoto 2005.02 2011.03 916 0.3 2,793.71 113 - - - - - 8.8 79 Kita-ku, Kyoto-shi, Kyoto 2006.02 2011.03 374 0.1 1,489.86 70 - - - - - 8.8 80 Shiki-shi, Saitama 2010.01 2011.03 1,478 0.5 3,061.89 127 - - - - - 3.0 81 Itabashi-ku, Tokyo 2010.02 2011.03 1,041 0.3 2,439.17 106 - - - - - 5.5 82 Itabashi-ku, Tokyo 2010.02 2011.03 1,249 0.4 2,969.25 121 - - - - - 5.3 Philosophia Nishidai
Dormy RakuhokuRikkyo University International Dormitory (RUID) Shiki
Dormy Naka Itabashi
Dormy AshiyaDormy Kyoto NijyoSundai Horikawa Ryo
Park Axis Kanayama WESTOther Major Cities Total
Rental Apartments Total
Park Axis Shin SapporoPark Axis Utsubo KoenPark Cube Kitahama
Park Axis Hakata MinoshimaPark Axis Takamiya HigashiPark Axis Sapporo Shokubutsuen Mae
Park Axis Naka GofukumachiPark Axis ShirakabePark Axis Sendai
Park Axis MarunouchiPark Axis RopponmatsuPark Axis Hakataeki Minami
Park Axis Yokohama YamashitachoGreater Tokyo Total
Park Axis Meieki Minami
Park Cube Kita MatsudoPark Cube Musashi KosugiPark Axis Yokohama Tanmachi Koen
Park Axis Yokohama IdogayaPark Axis Chiba ShinmachiPark Axis Chiba
Park Axis Nishi Funabashi
Portfolio Share(%)
Rentable Area(m2)
RentableUnits
(Units)3PML(%)No. Property Name Location
CompletionDate1
AcquisitionDate1
Acquisition Price(JPY mn)2
Portfolio List (4/5)

38
Single Compact Family LargeRetail,
etc.
83 Nakahara-ku, Kawasaki-shi, Kanagawa 2010.03 2011.03 1,152 0.4 3,017.34 112 - - - - - 7.3 89 Aoba-ku, Sendai-shi, Miyagi 2008.12 2012.03 540 0.2 2,234.24 60 - - - - - 3.0 90 Aoba-ku, Sendai-shi, Miyagi 2010.03 2012.03 1,160 0.4 4,864.04 142 - - - - - 2.7
118 Setagaya-ku, Tokyo - 2015.03 735 0.2 - - - - - - - - 119 Suginami-ku, Tokyo 1992.03 2016.03 1,100 0.3 1,616.52 71 - - - - - 8.8 123 Kanazaw a-ku, Yokohama-shi, Kanagaw a 2012.06 2017.06 774 0.2 1,826.29 58 - - - - - 9.6 124 Aoba-ku, Sendai-shi, Miyagi 1997.03 2017.06 1,050 0.3 3,151.56 124 - - - - - 4.6 128 Miyagino-ku, Sendai-shi, Miyagi 1998.02 2019.01 521 0.2 2,452.14 78 - - - - - 0.2 131 Naka-ku, Hiroshima-shi, Hiroshima 1986.11 2019.05 1,880 0.6 4,275.59 170 - - - - - 6.4
15,889 5.0 43,413.93 1,626 - - - - -
316,208 100.0 513,445.87 12,559 4,502 4,515 1,399 474 43 2.5 (Portfolio PML)
7
Chisun Hotel HiroshimaHospitality Facilities Total
Grand Total
Granda Kanazawa HakkeiDormy KamisugiDormy Odawara
Artis Sendai Kimachi DoriMedical Home Granda Sangen Jaya (Land w ith leasehold interest)
Dormy Nishi Ogikubo
Dormy Musashi KosugiArtis Sendai Kakyoin
Portfolio Share(%)
Rentable Area(m2)
RentableUnits
(Units)3PML(%)No. Property Name Location
CompletionDate1
AcquisitionDate1
Acquisition Price(JPY mn)2
Portfolio List (5/5)
* As of August 31, 20201. Completion date and acquisition date in the case of multiple properties are the earliest dates of completion and acquisition, respectively, among relevant properties.2. Acquisition price does not include acquisition-related expenses, property tax or consumption tax.3. Calculation of rentable units in each category is based on categories as of August 31, 2020. The breakdown of classified units of each property may change in future due to change of floor plans, etc.4. Rentable units and rentable area for Shibaura Island Air Tower are calculated by multiplying NAFʼs ownership (31%) by the propertyʼs total rentable units and total rentable area and rounding to the nearest unit and
one-hundredth of a square meter, respectively.5. Rentable units and rentable area for Park Axis Akatsuka are calculated by multiplying NAFʼs ownership (55%) by the propertyʼs total rentable units and total rentable area and rounding to the nearest unit and
one-hundredth of a square meter, respectively.6. Rentable units and rentable area for Park Cube Oimachi Residence are calculated by multiplying NAFʼs ownership (70%) by the propertyʼs total rentable units and total rentable area and rounding to the nearest unit and
one-hundredth of a square meter, respectively.7. Portfolio PML is the PML for all NAFʼs portfolio, 127 properties excluding Medical Home Granda Sangen Jaya (Land with leasehold interest).
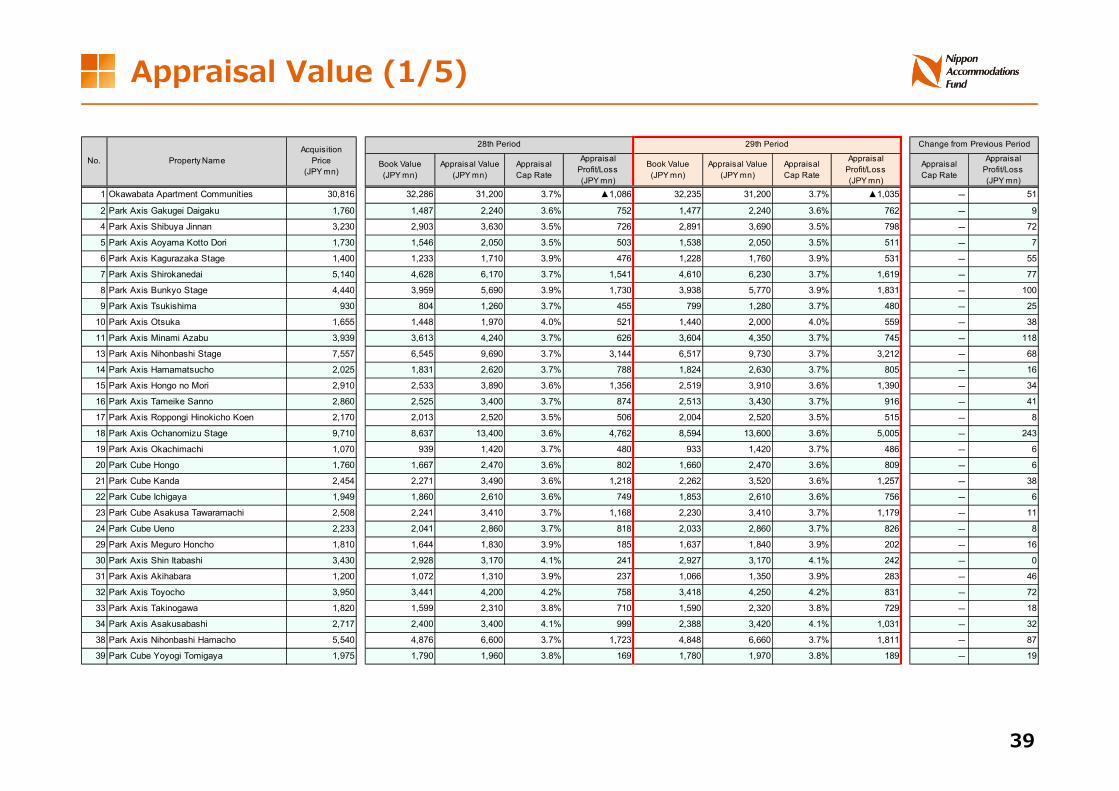
39
Book Value(JPY mn)
Appraisal Value(JPY mn)
AppraisalCap Rate
AppraisalProfit/Loss(JPY mn)
Book Value(JPY mn)
Appraisal Value(JPY mn)
AppraisalCap Rate
AppraisalProfit/Loss(JPY mn)
AppraisalCap Rate
AppraisalProfit/Loss(JPY mn)
1 Okawabata Apartment Communities 30,816 32,286 31,200 3.7% ▲1,086 32,235 31,200 3.7% ▲1,035 - 51
2 Park Axis Gakugei Daigaku 1,760 1,487 2,240 3.6% 752 1,477 2,240 3.6% 762 - 9
4 Park Axis Shibuya Jinnan 3,230 2,903 3,630 3.5% 726 2,891 3,690 3.5% 798 - 72
5 Park Axis Aoyama Kotto Dori 1,730 1,546 2,050 3.5% 503 1,538 2,050 3.5% 511 - 7
6 Park Axis Kagurazaka Stage 1,400 1,233 1,710 3.9% 476 1,228 1,760 3.9% 531 - 55
7 Park Axis Shirokanedai 5,140 4,628 6,170 3.7% 1,541 4,610 6,230 3.7% 1,619 - 77
8 Park Axis Bunkyo Stage 4,440 3,959 5,690 3.9% 1,730 3,938 5,770 3.9% 1,831 - 100
9 Park Axis Tsukishima 930 804 1,260 3.7% 455 799 1,280 3.7% 480 - 25
10 Park Axis Otsuka 1,655 1,448 1,970 4.0% 521 1,440 2,000 4.0% 559 - 38
11 Park Axis Minami Azabu 3,939 3,613 4,240 3.7% 626 3,604 4,350 3.7% 745 - 118
13 Park Axis Nihonbashi Stage 7,557 6,545 9,690 3.7% 3,144 6,517 9,730 3.7% 3,212 - 68
14 Park Axis Hamamatsucho 2,025 1,831 2,620 3.7% 788 1,824 2,630 3.7% 805 - 16
15 Park Axis Hongo no Mori 2,910 2,533 3,890 3.6% 1,356 2,519 3,910 3.6% 1,390 - 34
16 Park Axis Tameike Sanno 2,860 2,525 3,400 3.7% 874 2,513 3,430 3.7% 916 - 41
17 Park Axis Roppongi Hinokicho Koen 2,170 2,013 2,520 3.5% 506 2,004 2,520 3.5% 515 - 8
18 Park Axis Ochanomizu Stage 9,710 8,637 13,400 3.6% 4,762 8,594 13,600 3.6% 5,005 - 243
19 Park Axis Okachimachi 1,070 939 1,420 3.7% 480 933 1,420 3.7% 486 - 6
20 Park Cube Hongo 1,760 1,667 2,470 3.6% 802 1,660 2,470 3.6% 809 - 6
21 Park Cube Kanda 2,454 2,271 3,490 3.6% 1,218 2,262 3,520 3.6% 1,257 - 38
22 Park Cube Ichigaya 1,949 1,860 2,610 3.6% 749 1,853 2,610 3.6% 756 - 6
23 Park Cube Asakusa Tawaramachi 2,508 2,241 3,410 3.7% 1,168 2,230 3,410 3.7% 1,179 - 11
24 Park Cube Ueno 2,233 2,041 2,860 3.7% 818 2,033 2,860 3.7% 826 - 8
29 Park Axis Meguro Honcho 1,810 1,644 1,830 3.9% 185 1,637 1,840 3.9% 202 - 16
30 Park Axis Shin Itabashi 3,430 2,928 3,170 4.1% 241 2,927 3,170 4.1% 242 - 0
31 Park Axis Akihabara 1,200 1,072 1,310 3.9% 237 1,066 1,350 3.9% 283 - 46
32 Park Axis Toyocho 3,950 3,441 4,200 4.2% 758 3,418 4,250 4.2% 831 - 72
33 Park Axis Takinogawa 1,820 1,599 2,310 3.8% 710 1,590 2,320 3.8% 729 - 18
34 Park Axis Asakusabashi 2,717 2,400 3,400 4.1% 999 2,388 3,420 4.1% 1,031 - 32
38 Park Axis Nihonbashi Hamacho 5,540 4,876 6,600 3.7% 1,723 4,848 6,660 3.7% 1,811 - 87
39 Park Cube Yoyogi Tomigaya 1,975 1,790 1,960 3.8% 169 1,780 1,970 3.8% 189 - 19
No. Property NameAcquisition
Price(JPY mn)
28th Period 29th Period Change from Previous Period
Appraisal Value (1/5)

40
Book Value(JPY mn)
Appraisal Value(JPY mn)
AppraisalCap Rate
AppraisalProfit/Loss(JPY mn)
Book Value(JPY mn)
Appraisal Value(JPY mn)
AppraisalCap Rate
AppraisalProfit/Loss(JPY mn)
AppraisalCap Rate
AppraisalProfit/Loss(JPY mn)
41 Park Axis Monzen Nakacho 1,700 1,501 1,870 4.0% 368 1,492 1,920 4.0% 427 - 58
42 Park Cube Itabashi Honcho 4,170 3,740 4,450 3.7% 709 3,720 4,450 3.7% 729 - 20
43 Park Cube Gakugei Daigaku 910 836 908 3.6% 71 833 908 3.6% 74 - 3
44 Park Cube Oimachi 1,440 1,294 1,670 4.0% 375 1,289 1,680 4.0% 390 - 15
46 Park Axis Nishigahara 840 777 1,090 4.3% 312 772 1,090 4.3% 317 - 4
47 Park Axis Kinshicho 1,448 1,314 2,180 3.8% 865 1,308 2,180 3.8% 871 - 6
48 Park Axis Tatsumi Stage 7,464 6,659 10,700 4.3% 4,040 6,616 10,900 4.3% 4,283 - 243
51 Park Axis Kameido 2,359 2,090 2,970 4.3% 879 2,076 3,010 4.3% 933 - 53
52 Park Axis Honancho 745 654 963 4.1% 308 649 984 4.1% 334 - 26
53 Park Axis Itabashi 1,448 1,274 2,170 3.8% 895 1,265 2,170 3.8% 904 - 9
54 Park Axis Oshiage 1,193 1,050 1,610 4.3% 559 1,042 1,610 4.3% 567 - 8
55 Park Axis Takadanobaba 1,222 1,131 1,600 3.7% 468 1,126 1,620 3.7% 493 - 25
59 Park Axis Toyosu 14,300 12,225 20,000 4.1% 7,774 12,123 20,400 4.1% 8,276 - 502
60 Park Axis Hatchobori 1,760 1,596 2,580 4.0% 983 1,586 2,580 4.0% 993 - 10
61 Park Axis Itabashi Honcho 987 837 1,290 4.2% 452 828 1,290 4.2% 461 - 8
62 Park Axis Sumiyoshi 1,006 868 1,310 4.4% 441 860 1,280 4.4% 419 - ▲21
63 Park Cube Yotsuya Sanchome 2,749 2,509 3,820 3.8% 1,310 2,489 3,850 3.8% 1,360 - 50
64 Park Cube Hatchobori 4,200 3,969 5,930 3.9% 1,960 3,948 5,950 3.9% 2,001 - 40
68 Park Axis Kamata Ichibankan 1,069 987 1,400 4.1% 412 981 1,400 4.1% 418 - 6
70 Park Axis Taito Negishi 672 595 908 4.3% 312 589 973 4.3% 383 - 70
72 Park Axis Komagome 1,389 1,261 1,970 4.0% 708 1,253 1,970 4.0% 716 - 7
74 Park Axis Itabashi Honcho Nibankan 1,859 1,590 2,400 4.2% 809 1,573 2,400 4.2% 826 - 17
75 Shibaura Island Air Tower1 7,905 6,684 10,200 - 3,515 6,602 10,200 - 3,597 - 82
84 Park Cube Higashi Shinagawa 6,060 5,558 7,520 4.2% 1,961 5,519 7,670 4.2% 2,150 - 189
86 Park Cube Sasazuka 2,200 2,087 2,800 3.7% 712 2,076 2,850 3.7% 773 - 60
88 Park Axis Higashi Jujo 1,700 1,589 2,370 3.8% 780 1,579 2,370 3.8% 790 - 10
91 Park Cube Heiwadai 1,204 1,127 1,480 4.3% 352 1,119 1,490 4.3% 370 - 17
92 Park Cube Meguro Tower 9,000 8,768 13,600 3.8% 4,831 8,729 13,600 3.8% 4,870 - 38
93 Park Cube Nihonbashi Suitengu 2,711 2,576 3,870 3.7% 1,293 2,562 3,870 3.7% 1,307 - 13
94 Park Cube Ginza East 2,269 2,156 3,100 3.7% 943 2,143 3,130 3.7% 986 - 43
No. Property NameAcquisition
Price(JPY mn)
28th Period 29th Period Change from Previous Period
Appraisal Value (2/5)

41
Book Value(JPY mn)
Appraisal Value(JPY mn)
AppraisalCap Rate
AppraisalProfit/Loss(JPY mn)
Book Value(JPY mn)
Appraisal Value(JPY mn)
AppraisalCap Rate
AppraisalProfit/Loss(JPY mn)
AppraisalCap Rate
AppraisalProfit/Loss(JPY mn)
95 Park Cube Kayabacho 1,105 1,084 1,630 3.7% 545 1,080 1,630 3.7% 549 - 3
96 Park Cube Honjo Azumabashi 1,252 1,210 1,790 3.8% 579 1,203 1,810 3.8% 606 - 26
97 Park Axis Kiyosumi Shirakawa 696 673 955 3.8% 281 669 955 3.8% 285 - 3
98 Park Axis Asakusabashi Nichome 1,079 997 1,390 4.0% 392 988 1,420 4.0% 431 - 38
99 Park Axis Nishi Sugamo 1,439 1,360 1,900 4.0% 539 1,351 1,900 4.0% 548 - 9
100 Park Axis Ueno 1,389 1,292 1,790 4.0% 497 1,282 1,820 4.0% 537 - 40
101 Park Axis Akihabara East 1,369 1,276 1,800 4.0% 523 1,266 1,800 4.0% 533 - 9
103 Park Axis Kayabacho 1,809 1,674 2,380 3.9% 705 1,660 2,410 3.9% 749 - 44
104 Park Axis Kinshicho Shinsui Koen 1,369 1,280 1,730 4.1% 449 1,270 1,740 4.1% 469 - 20
105 Park Cube Kasuga Andozaka 2,670 2,554 3,590 3.7% 1,035 2,544 3,640 3.7% 1,095 - 59
106 Park Cube Kameido 3,020 2,882 3,850 3.8% 967 2,867 3,850 3.8% 982 - 15
108 Park Axis Shin Okachimachi East 1,299 1,247 1,620 4.0% 372 1,240 1,650 4.0% 409 - 36
110 Park Axis Nihonbashi Honcho 1,469 1,412 2,090 3.7% 677 1,404 2,110 3.7% 705 - 27
111 Park Cube Nishigahara Stage4 4,110 3,842 4,920 - 1,077 3,789 4,930 - 1,140 - 63
112 Park Cube Atagoyama Tower 8,650 8,545 10,100 3.6% 1,554 8,516 10,100 3.6% 1,583 - 28
113 Park Axis Shibaura 1,045 1,031 1,430 3.7% 398 1,025 1,430 3.7% 404 - 5
114 Park Axis Asakusa Kuramae 1,095 1,073 1,450 3.7% 376 1,067 1,460 3.7% 392 - 16
115 Park Axis Kamata Station Gate 4,144 4,102 5,310 3.7% 1,207 4,085 5,350 3.7% 1,264 - 57
116 Park Axis Kinshicho Residence 1,251 1,234 1,610 3.7% 375 1,226 1,610 3.7% 383 - 7
117 Park Axis Oshiage Sumida Koen 1,055 1,038 1,410 3.9% 371 1,031 1,410 3.9% 378 - 7
120 Park Axis Magome Residence 1,450 1,455 1,640 3.9% 184 1,448 1,640 3.9% 191 - 6
121 Park Axis Higashi Ueno 1,250 1,252 1,490 3.8% 237 1,246 1,490 3.8% 243 - 6
122 Park Axis Higashi Koenji 2,300 2,324 2,540 4.0% 215 2,310 2,550 4.0% 239 - 24
125 Park Cube Shin Itabashi 1,700 1,745 1,920 3.9% 174 1,735 1,940 3.9% 204 - 29
126 Park Cube Nishi Shinjuku 2,400 2,450 2,650 3.8% 199 2,442 2,650 3.8% 207 - 7
129 Park Axis Oshiage Terrace 2,610 2,687 2,890 3.7% 202 2,675 2,890 3.7% 214 - 12
130 Park Axis Ikegami 1,260 1,298 1,360 4.0% 61 1,292 1,360 4.0% 67 - 6
26 Park Cube Keio Hachioji II 1,130 978 1,450 4.4% 471 970 1,460 4.4% 489 - 17
40 Park Axis Nishi Funabashi 1,020 835 1,030 4.6% 194 827 1,050 4.6% 222 - 28
66 Park Axis Yokohama Idogaya 1,419 1,233 1,800 4.5% 566 1,220 1,800 4.5% 579 - 13
67 Park Axis Chiba Shinmachi 1,679 1,428 2,070 4.7% 641 1,412 2,070 4.7% 657 - 16
69 Park Axis Chiba 970 809 1,120 4.8% 310 798 1,120 4.8% 321 - 11
No. Property NameAcquisition
Price(JPY mn)
28th Period 29th Period Change from Previous Period
Appraisal Value (3/5)

42
Book Value(JPY mn)
Appraisal Value(JPY mn)
AppraisalCap Rate
AppraisalProfit/Loss(JPY mn)
Book Value(JPY mn)
Appraisal Value(JPY mn)
AppraisalCap Rate
AppraisalProfit/Loss(JPY mn)
AppraisalCap Rate
AppraisalProfit/Loss(JPY mn)
85 Park Cube Kita Matsudo 1,200 1,053 1,460 4.7% 406 1,044 1,460 4.7% 415 - 8
87 Park Cube Musashi Kosugi 2,250 2,010 3,060 4.1% 1,049 1,992 3,060 4.1% 1,067 - 17
102 Park Axis Yokohama Tanmachi Koen 1,119 1,035 1,400 4.3% 364 1,026 1,410 4.3% 383 - 18
109 Park Axis Yokohama Yamashitacho 1,539 1,452 1,930 4.2% 477 1,441 1,940 4.2% 498 - 21
27 Park Axis Meieki Minami 2,440 1,966 2,520 4.7% 553 1,949 2,520 4.7% 570 - 17
35 Park Axis Marunouchi 1,920 1,577 1,760 4.6% 182 1,566 1,760 4.6% 193 - 11
36 Park Axis Ropponmatsu 1,515 1,261 1,490 4.2% 228 1,258 1,490 4.2% 231 - 3
37 Park Axis Hakataeki Minami 1,890 1,550 1,870 4.3% 319 1,536 1,870 4.3% 333 - 14
45 Park Axis Naka Gofukumachi 742 604 1,050 4.3% 445 597 1,050 4.3% 452 - 7
49 Park Axis Shirakabe 1,547 1,327 2,000 4.7% 672 1,314 2,000 4.7% 685 - 12
50 Park Axis Sendai 2,320 1,946 3,280 5.1% 1,333 1,928 3,290 5.1% 1,361 - 27
56 Park Axis Hakata Minoshima 960 767 1,150 4.9% 382 756 1,130 4.9% 373 - ▲8
57 Park Axis Takamiya Higashi 605 451 729 4.9% 277 442 705 4.9% 262 - ▲15
58 Park Axis Sapporo Shokubutsuen Mae 1,650 1,296 2,030 5.0% 733 1,278 2,040 5.0% 761 - 27
65 Park Axis Shin Sapporo 827 659 975 5.2% 315 647 981 5.2% 333 - 17
73 Park Axis Utsubo Koen 2,399 2,077 2,860 4.6% 782 2,056 2,860 4.6% 803 - 20
107 Park Cube Kitahama 1,970 1,835 2,180 4.6% 344 1,819 2,180 4.6% 360 - 16
127 Park Axis Kanayama WEST 1,770 1,849 1,960 4.4% 110 1,839 1,960 4.4% 120 - 9
76 Dormy Ashiya 928 801 1,370 5.0% 568 794 1,370 5.0% 575 - 7
77 Dormy Kyoto Nijyo 991 840 1,400 4.8% 559 832 1,400 4.8% 567 - 8
78 Sundai Horikawa Ryo 916 838 1,330 4.8% 491 830 1,330 4.8% 499 - 8
79 Dormy Rakuhoku 374 313 515 5.2% 201 307 516 5.2% 208 - 6
80 Rikkyo University International Dormitory (RUID) Shiki 1,478 1,380 2,000 5.1% 619 1,369 2,000 5.1% 630 - 10
81 Dormy Naka Itabashi 1,041 967 1,470 4.5% 502 960 1,470 4.5% 509 - 7
82 Philosophia Nishidai 1,249 1,143 1,720 4.6% 576 1,133 1,720 4.6% 586 - 10
83 Dormy Musashi Kosugi 1,152 1,062 1,650 4.7% 587 1,054 1,610 4.8% 555 0.1% ▲32
89 Artis Sendai Kakyoin 540 493 692 5.4% 198 487 692 5.4% 204 - 5
90 Artis Sendai Kimachi Dori 1,160 1,058 1,540 5.3% 481 1,045 1,510 5.4% 464 0.1% ▲16
118 Medical Home Granda Sangen Jaya (Land with leasehold interest) 735 770 821 4.0% 50 770 821 4.0% 50 - -
No. Property NameAcquisition
Price(JPY mn)
28th Period 29th Period Change from Previous Period
Appraisal Value (4/5)

43
Book Value(JPY mn)
Appraisal Value(JPY mn)
AppraisalCap Rate
AppraisalProfit/Loss(JPY mn)
Book Value(JPY mn)
Appraisal Value(JPY mn)
AppraisalCap Rate
AppraisalProfit/Loss(JPY mn)
AppraisalCap Rate
AppraisalProfit/Loss(JPY mn)
119 Dormy Nishi Ogikubo 1,100 1,154 1,210 4.4% 55 1,151 1,210 4.4% 58 - 3
123 Granda Kanazawa Hakkei 774 783 941 4.3% 157 778 941 4.3% 162 - 5
124 Dormy Kamisugi 1,050 1,113 1,250 5.2% 136 1,109 1,250 5.2% 140 - 3
128 Dormy Odawara 521 588 633 6.3% 44 583 633 6.3% 49 - 4
131 Chisun Hotel Hiroshima 1,880 1,999 1,880 4.9% ▲119 1,994 1,840 5.0% ▲154 0.1% ▲34
309,723 286,443 384,280 - 97,836 284,784 386,519 - 101,734 - 3,897
Properties acquired in the 29th Period132 Park Axis Akatsuka2 2,420 - - - - 2,496 2,580 4.0% 83 - 83
133 Park Cube Oimachi Residence3 4,064 - - - - 4,213 4,450 3.7% 236 - 236
6,484 - - - - 6,710 7,030 - 319 - 319
Property sold in the 29th Period- - - - - - - - - - -
316,208 286,443 384,280 - 97,836 291,495 393,549 - 102,053 - 4,217
No. Property NameAcquisition
Price(JPY mn)
28th Period 29th Period Change from Previous Period
Total
Subtotal
Subtotal
Subtotal
Reference: Appraisal Value Changes in the Properties Owned at the end of the previous period
Increase No Change Decrease Total55 properties 65 properties 6 properties 126 properties
PoP Change in Appraisal Value
Appraisal Value (5/5)
* Appraisal value and book value are as of the end of each period (28th Period: February 29, 2020; 29th Period: August 31, 2020).1. Appraisal value of Shibaura Island Air Tower: Equivalent of 31% ownership.
Appraisal cap rate of Shibaura Island Air Tower: Not available because the asset is a building with term leasehold interest.2. Appraisal value of Park Axis Akatsuka: Equivalent of 55% ownership.3. Appraisal value of Park Cube Oimachi Residence: Equivalent of 70% ownership.4. Appraisal cap rate of Park Cube Nishigahara Stage was 4.4% for the 28th period and 4.4% for the 29th period.
(Discount rate based on the Inwood method of capitalization over a definite term)

44
2020 2020 2020 2020 2020 2020 2020 2020 2019 2019 2019 2019Aug 31 Jul 31 Jun 30 May 31 Apr 30 Mar 31 Feb 29 Jan 31 Dec 31 Nov 30 Oct 31 Sep 30
1 Okaw abata Apartment Communities 544 43,812.41 95.2% 94.9% 96.0% 95.6% 95.0% 95.1% 95.7% 96.1% 96.5% 96.4% 95.8% 96.2%
2 Park Axis Gakugei Daigaku 64 2,437.66 98.8% 100.0% 98.2% 96.3% 96.3% 95.2% 96.7% 98.8% 98.2% 98.2% 98.2% 98.8%
4 Park Axis Shibuya Jinnan 75 2,766.62 97.5% 93.9% 95.5% 94.9% 98.7% 96.1% 97.9% 98.8% 98.6% 98.6% 97.4% 98.8%
5 Park Axis Aoyama Kotto Dori 40 1,537.24 94.1% 95.9% 98.3% 98.3% 98.3% 100.0% 100.0% 97.4% 100.0% 100.0% 100.0% 100.0%
6 Park Axis Kagurazaka Stage 59 1,891.05 86.8% 93.0% 94.7% 96.4% 96.4% 96.4% 94.9% 100.0% 98.6% 97.1% 97.3% 98.7%
7 Park Axis Shirokanedai 99 4,704.44 94.1% 95.1% 95.1% 98.0% 98.9% 100.0% 99.0% 100.0% 97.8% 97.8% 97.5% 98.9%
8 Park Axis Bunkyo Stage 154 6,078.93 97.8% 97.5% 95.3% 95.1% 95.4% 97.2% 98.9% 99.5% 98.6% 98.9% 97.5% 96.7%
9 Park Axis Tsukishima 30 1,383.99 92.8% 92.8% 96.4% 100.0% 97.1% 93.5% 100.0% 100.0% 100.0% 100.0% 100.0% 100.0%
10 Park Axis Otsuka 52 2,606.37 96.3% 94.2% 98.6% 94.5% 98.1% 100.0% 98.6% 100.0% 98.1% 100.0% 100.0% 100.0%
11 Park Axis Minami Azabu 64 3,938.14 100.0% 97.5% 94.2% 98.8% 98.8% 97.9% 100.0% 96.2% 95.4% 98.5% 100.0% 100.0%
13 Park Axis Nihonbashi Stage 185 10,025.40 96.6% 98.3% 99.3% 97.3% 99.1% 99.7% 99.6% 99.7% 98.3% 98.7% 98.4% 98.5%
14 Park Axis Hamamatsucho 80 2,426.45 94.4% 93.9% 92.8% 95.0% 97.2% 94.3% 96.1% 97.1% 97.2% 100.0% 95.8% 93.4%
15 Park Axis Hongo no Mori 87 3,317.94 98.3% 95.8% 95.6% 95.0% 100.0% 98.8% 97.6% 99.0% 96.2% 99.1% 97.8% 100.0%
16 Park Axis Tameike Sanno 70 2,710.69 91.6% 93.5% 96.4% 96.5% 95.6% 97.5% 99.0% 99.0% 98.9% 98.4% 100.0% 100.0%
17 Park Axis Roppongi Hinokicho Koen 46 2,054.46 87.2% 89.4% 86.5% 97.2% 97.2% 100.0% 100.0% 95.6% 96.1% 98.1% 97.7% 100.0%
18 Park Axis Ochanomizu Stage 324 12,025.25 94.7% 94.3% 93.5% 94.2% 96.2% 98.3% 99.1% 98.9% 98.2% 98.0% 98.5% 98.3%
19 Park Axis Okachimachi 42 1,621.73 93.5% 93.5% 90.5% 87.0% 90.0% 94.5% 94.5% 91.1% 100.0% 97.6% 100.0% 96.9%
20 Park Cube Hongo 60 2,160.12 93.4% 93.6% 93.6% 91.8% 95.2% 98.4% 96.8% 96.8% 100.0% 96.7% 100.0% 98.2%
21 Park Cube Kanda 95 3,194.59 94.6% 95.6% 98.2% 98.5% 99.0% 99.0% 100.0% 98.9% 97.2% 99.0% 100.0% 99.0%
22 Park Cube Ichigaya 53 2,288.46 97.3% 97.3% 93.7% 94.1% 94.1% 97.7% 95.4% 100.0% 98.6% 98.6% 100.0% 100.0%
23 Park Cube Asakusa Taw aramachi 76 4,012.68 98.6% 98.6% 98.9% 91.9% 93.3% 100.0% 100.0% 100.0% 100.0% 100.0% 100.0% 100.0%
24 Park Cube Ueno 91 3,041.61 98.8% 98.8% 97.7% 95.3% 97.7% 100.0% 100.0% 100.0% 97.0% 98.0% 98.0% 100.0%
29 Park Axis Meguro Honcho 60 1,884.77 94.8% 93.3% 93.3% 98.6% 100.0% 100.0% 98.3% 98.3% 96.5% 94.8% 96.8% 96.8%
30 Park Axis Shin Itabashi 152 4,395.99 96.1% 97.2% 96.2% 97.3% 99.0% 97.4% 100.0% 98.5% 97.2% 98.4% 99.5% 97.3%
31 Park Axis Akihabara 41 1,346.07 98.2% 100.0% 97.1% 97.1% 95.2% 100.0% 100.0% 100.0% 100.0% 100.0% 97.1% 100.0%
32 Park Axis Toyocho 140 5,412.40 96.4% 96.4% 98.6% 95.7% 95.7% 100.0% 99.3% 97.1% 95.7% 95.7% 94.3% 95.0%
33 Park Axis Takinogaw a 49 2,924.75 98.3% 98.3% 96.4% 92.6% 91.6% 98.1% 98.3% 100.0% 98.2% 100.0% 95.4% 95.4%
34 Park Axis Asakusabashi 79 3,400.78 95.6% 93.0% 93.4% 92.0% 97.3% 98.6% 100.0% 100.0% 98.6% 98.4% 100.0% 100.0%
38 Park Axis Nihonbashi Hamacho 118 6,999.83 96.7% 96.5% 98.3% 96.8% 97.6% 100.0% 98.5% 99.3% 99.3% 97.1% 95.8% 96.5%
39 Park Cube Yoyogi Tomigaya 38 1,929.10 94.6% 100.0% 100.0% 97.8% 97.8% 100.0% 100.0% 97.5% 100.0% 100.0% 100.0% 97.1%
28th Period
Occupancy Rate
No. Property Name Rentable Units(Units)
RentableArea (㎡)
29th Period
Occupancy Rates (1/5)
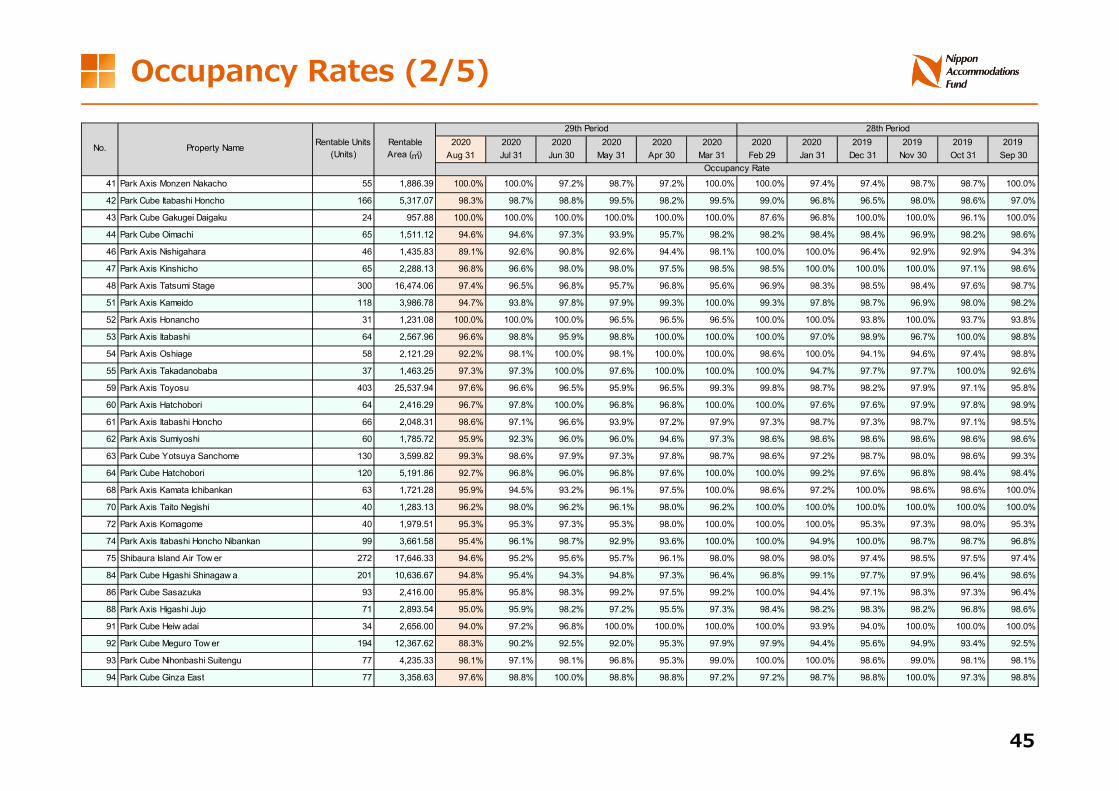
45
2020 2020 2020 2020 2020 2020 2020 2020 2019 2019 2019 2019Aug 31 Jul 31 Jun 30 May 31 Apr 30 Mar 31 Feb 29 Jan 31 Dec 31 Nov 30 Oct 31 Sep 30
41 Park Axis Monzen Nakacho 55 1,886.39 100.0% 100.0% 97.2% 98.7% 97.2% 100.0% 100.0% 97.4% 97.4% 98.7% 98.7% 100.0%
42 Park Cube Itabashi Honcho 166 5,317.07 98.3% 98.7% 98.8% 99.5% 98.2% 99.5% 99.0% 96.8% 96.5% 98.0% 98.6% 97.0%
43 Park Cube Gakugei Daigaku 24 957.88 100.0% 100.0% 100.0% 100.0% 100.0% 100.0% 87.6% 96.8% 100.0% 100.0% 96.1% 100.0%
44 Park Cube Oimachi 65 1,511.12 94.6% 94.6% 97.3% 93.9% 95.7% 98.2% 98.2% 98.4% 98.4% 96.9% 98.2% 98.6%
46 Park Axis Nishigahara 46 1,435.83 89.1% 92.6% 90.8% 92.6% 94.4% 98.1% 100.0% 100.0% 96.4% 92.9% 92.9% 94.3%
47 Park Axis Kinshicho 65 2,288.13 96.8% 96.6% 98.0% 98.0% 97.5% 98.5% 98.5% 100.0% 100.0% 100.0% 97.1% 98.6%
48 Park Axis Tatsumi Stage 300 16,474.06 97.4% 96.5% 96.8% 95.7% 96.8% 95.6% 96.9% 98.3% 98.5% 98.4% 97.6% 98.7%
51 Park Axis Kameido 118 3,986.78 94.7% 93.8% 97.8% 97.9% 99.3% 100.0% 99.3% 97.8% 98.7% 96.9% 98.0% 98.2%
52 Park Axis Honancho 31 1,231.08 100.0% 100.0% 100.0% 96.5% 96.5% 96.5% 100.0% 100.0% 93.8% 100.0% 93.7% 93.8%
53 Park Axis Itabashi 64 2,567.96 96.6% 98.8% 95.9% 98.8% 100.0% 100.0% 100.0% 97.0% 98.9% 96.7% 100.0% 98.8%
54 Park Axis Oshiage 58 2,121.29 92.2% 98.1% 100.0% 98.1% 100.0% 100.0% 98.6% 100.0% 94.1% 94.6% 97.4% 98.8%
55 Park Axis Takadanobaba 37 1,463.25 97.3% 97.3% 100.0% 97.6% 100.0% 100.0% 100.0% 94.7% 97.7% 97.7% 100.0% 92.6%
59 Park Axis Toyosu 403 25,537.94 97.6% 96.6% 96.5% 95.9% 96.5% 99.3% 99.8% 98.7% 98.2% 97.9% 97.1% 95.8%
60 Park Axis Hatchobori 64 2,416.29 96.7% 97.8% 100.0% 96.8% 96.8% 100.0% 100.0% 97.6% 97.6% 97.9% 97.8% 98.9%
61 Park Axis Itabashi Honcho 66 2,048.31 98.6% 97.1% 96.6% 93.9% 97.2% 97.9% 97.3% 98.7% 97.3% 98.7% 97.1% 98.5%
62 Park Axis Sumiyoshi 60 1,785.72 95.9% 92.3% 96.0% 96.0% 94.6% 97.3% 98.6% 98.6% 98.6% 98.6% 98.6% 98.6%
63 Park Cube Yotsuya Sanchome 130 3,599.82 99.3% 98.6% 97.9% 97.3% 97.8% 98.7% 98.6% 97.2% 98.7% 98.0% 98.6% 99.3%
64 Park Cube Hatchobori 120 5,191.86 92.7% 96.8% 96.0% 96.8% 97.6% 100.0% 100.0% 99.2% 97.6% 96.8% 98.4% 98.4%
68 Park Axis Kamata Ichibankan 63 1,721.28 95.9% 94.5% 93.2% 96.1% 97.5% 100.0% 98.6% 97.2% 100.0% 98.6% 98.6% 100.0%
70 Park Axis Taito Negishi 40 1,283.13 96.2% 98.0% 96.2% 96.1% 98.0% 96.2% 100.0% 100.0% 100.0% 100.0% 100.0% 100.0%
72 Park Axis Komagome 40 1,979.51 95.3% 95.3% 97.3% 95.3% 98.0% 100.0% 100.0% 100.0% 95.3% 97.3% 98.0% 95.3%
74 Park Axis Itabashi Honcho Nibankan 99 3,661.58 95.4% 96.1% 98.7% 92.9% 93.6% 100.0% 100.0% 94.9% 100.0% 98.7% 98.7% 96.8%
75 Shibaura Island Air Tow er 272 17,646.33 94.6% 95.2% 95.6% 95.7% 96.1% 98.0% 98.0% 98.0% 97.4% 98.5% 97.5% 97.4%
84 Park Cube Higashi Shinagaw a 201 10,636.67 94.8% 95.4% 94.3% 94.8% 97.3% 96.4% 96.8% 99.1% 97.7% 97.9% 96.4% 98.6%
86 Park Cube Sasazuka 93 2,416.00 95.8% 95.8% 98.3% 99.2% 97.5% 99.2% 100.0% 94.4% 97.1% 98.3% 97.3% 96.4%
88 Park Axis Higashi Jujo 71 2,893.54 95.0% 95.9% 98.2% 97.2% 95.5% 97.3% 98.4% 98.2% 98.3% 98.2% 96.8% 98.6%
91 Park Cube Heiw adai 34 2,656.00 94.0% 97.2% 96.8% 100.0% 100.0% 100.0% 100.0% 93.9% 94.0% 100.0% 100.0% 100.0%
92 Park Cube Meguro Tow er 194 12,367.62 88.3% 90.2% 92.5% 92.0% 95.3% 97.9% 97.9% 94.4% 95.6% 94.9% 93.4% 92.5%
93 Park Cube Nihonbashi Suitengu 77 4,235.33 98.1% 97.1% 98.1% 96.8% 95.3% 99.0% 100.0% 100.0% 98.6% 99.0% 98.1% 98.1%
94 Park Cube Ginza East 77 3,358.63 97.6% 98.8% 100.0% 98.8% 98.8% 97.2% 97.2% 98.7% 98.8% 100.0% 97.3% 98.8%
28th Period
Occupancy Rate
No. Property Name Rentable Units(Units)
RentableArea (㎡)
29th Period
Occupancy Rates (2/5)

46
2020 2020 2020 2020 2020 2020 2020 2020 2019 2019 2019 2019Aug 31 Jul 31 Jun 30 May 31 Apr 30 Mar 31 Feb 29 Jan 31 Dec 31 Nov 30 Oct 31 Sep 30
95 Park Cube Kayabacho 28 1,695.06 93.3% 93.3% 93.3% 96.8% 100.0% 100.0% 100.0% 100.0% 96.0% 100.0% 100.0% 100.0%
96 Park Cube Honjo Azumabashi 45 2,241.63 100.0% 100.0% 100.0% 97.5% 97.5% 97.6% 97.6% 100.0% 97.5% 97.6% 100.0% 100.0%
97 Park Axis Kiyosumi Shirakaw a 36 1,159.84 97.3% 100.0% 95.4% 95.4% 100.0% 100.0% 100.0% 100.0% 100.0% 100.0% 100.0% 97.8%
98 Park Axis Asakusabashi Nichome 48 1,569.00 94.0% 96.0% 92.4% 98.3% 95.3% 100.0% 100.0% 100.0% 100.0% 100.0% 98.0% 98.0%
99 Park Axis Nishi Sugamo 56 2,326.32 97.8% 97.8% 98.6% 93.6% 97.4% 100.0% 100.0% 100.0% 98.9% 97.8% 92.4% 93.2%
100 Park Axis Ueno 59 1,992.29 97.5% 98.7% 98.7% 98.7% 98.7% 98.7% 97.9% 98.7% 96.7% 100.0% 100.0% 100.0%
101 Park Axis Akihabara East 58 1,890.20 93.0% 96.5% 95.1% 98.6% 97.2% 97.2% 100.0% 100.0% 97.9% 98.6% 97.9% 100.0%
103 Park Axis Kayabacho 72 2,355.07 91.4% 91.7% 96.3% 94.5% 97.1% 100.0% 100.0% 100.0% 100.0% 100.0% 100.0% 98.9%
104 Park Axis Kinshicho Shinsui Koen 60 2,085.62 93.7% 93.7% 92.5% 98.8% 98.8% 100.0% 100.0% 97.6% 98.8% 100.0% 98.8% 94.8%
105 Park Cube Kasuga Andozaka 68 3,581.09 99.3% 99.3% 99.3% 97.3% 95.7% 100.0% 96.5% 98.8% 96.3% 97.9% 97.5% 97.2%
106 Park Cube Kameido 122 4,442.09 96.6% 99.4% 97.0% 97.6% 98.2% 100.0% 99.4% 99.4% 100.0% 97.8% 97.8% 98.5%
108 Park Axis Shin Okachimachi East 49 1,847.01 98.6% 97.2% 100.0% 97.6% 94.9% 92.5% 100.0% 100.0% 98.6% 96.2% 100.0% 98.6%
110 Park Axis Nihonbashi Honcho 49 1,808.12 96.0% 98.4% 96.1% 96.0% 100.0% 98.3% 98.3% 100.0% 100.0% 97.4% 100.0% 97.4%
111 Park Cube Nishigahara Stage 358 19,693.35 95.9% 96.3% 96.1% 95.0% 96.0% 98.3% 99.0% 99.0% 97.5% 98.1% 97.2% 95.5%
112 Park Cube Atagoyama Tow er 165 8,389.91 94.4% 96.4% 97.1% 98.3% 98.5% 97.5% 96.0% 96.7% 96.2% 93.9% 94.6% 95.5%
113 Park Axis Shibaura 42 1,273.60 98.0% 100.0% 100.0% 100.0% 100.0% 100.0% 100.0% 100.0% 100.0% 100.0% 100.0% 100.0%
114 Park Axis Asakusa Kuramae 45 1,456.35 96.6% 98.3% 98.3% 98.3% 95.3% 94.1% 96.6% 98.3% 97.1% 100.0% 100.0% 100.0%
115 Park Axis Kamata Station Gate 158 4,582.72 98.4% 97.4% 97.4% 94.8% 94.3% 98.3% 98.4% 99.0% 98.7% 97.6% 97.7% 98.4%
116 Park Axis Kinshicho Residence 56 1,793.33 96.0% 97.4% 93.7% 89.6% 92.2% 100.0% 98.6% 100.0% 100.0% 100.0% 100.0% 100.0%
117 Park Axis Oshiage Sumida Koen 49 1,610.49 100.0% 100.0% 96.8% 96.8% 90.7% 98.4% 98.4% 98.4% 96.7% 98.4% 98.4% 100.0%
120 Park Axis Magome Residence 55 1,621.94 96.5% 98.4% 96.8% 95.2% 96.8% 98.4% 100.0% 100.0% 98.3% 100.0% 96.7% 98.4%
121 Park Axis Higashi Ueno 45 1,460.10 93.5% 100.0% 100.0% 91.7% 93.4% 100.0% 100.0% 98.2% 100.0% 100.0% 100.0% 97.0%
122 Park Axis Higashi Koenji 85 2,679.96 98.1% 96.3% 96.6% 93.0% 93.6% 100.0% 100.0% 93.7% 92.3% 98.5% 98.5% 94.0%
125 Park Cube Shin Itabashi 71 1,930.12 97.3% 97.3% 96.0% 97.4% 100.0% 100.0% 97.4% 96.1% 97.4% 96.1% 98.7% 100.0%
126 Park Cube Nishi Shinjuku 58 1,809.56 93.4% 91.9% 91.9% 93.5% 94.0% 95.4% 98.6% 97.8% 97.8% 97.2% 98.6% 97.2%
129 Park Axis Oshiage Terrace 80 2,498.08 95.7% 95.7% 95.6% 96.0% 94.4% 97.3% 95.8% 95.8% 96.8% 96.2% 97.3% 95.2%
130 Park Axis Ikegami 45 1,391.34 98.2% 100.0% 100.0% 100.0% 100.0% 97.7% 100.0% 100.0% 100.0% 100.0% 100.0% 100.0%
132 Park Axis Akatsuka 88 2,403.67 97.5% 97.6% 97.1% 97.7% 95.2% 98.2% - - - - - -
133 Park Cube Oimachi Residence 120 2,989.82 95.5% 91.3% - - - - - - - - - -
8,470 381,584.00 95.8% 96.1% 96.3% 95.9% 96.6% 98.0% 98.3% 98.1% 97.7% 97.8% 97.4% 97.4%
28th Period
Occupancy Rate
Tokyo 23 Wards Total
No. Property Name Rentable Units(Units)
RentableArea (㎡)
29th Period
Occupancy Rates (3/5)

47
2020 2020 2020 2020 2020 2020 2020 2020 2019 2019 2019 2019Aug 31 Jul 31 Jun 30 May 31 Apr 30 Mar 31 Feb 29 Jan 31 Dec 31 Nov 30 Oct 31 Sep 30
26 Park Cube Keio Hachioji II 48 3,082.32 94.9% 96.8% 92.6% 90.7% 94.5% 96.8% 94.8% 92.6% 96.8% 92.6% 94.6% 93.7%
40 Park Axis Nishi Funabashi 55 2,074.35 98.7% 100.0% 91.8% 88.9% 90.2% 97.8% 98.5% 96.4% 96.0% 93.8% 98.7% 100.0%
66 Park Axis Yokohama Idogaya 100 2,706.59 98.1% 99.1% 97.3% 93.6% 95.4% 98.2% 100.0% 97.3% 97.3% 98.2% 100.0% 96.2%
67 Park Axis Chiba Shinmachi 84 3,318.15 99.1% 98.5% 95.8% 96.7% 96.0% 98.3% 99.2% 98.5% 96.7% 94.8% 93.1% 93.1%
69 Park Axis Chiba 91 2,270.32 94.5% 95.6% 94.5% 96.8% 96.8% 100.0% 95.7% 95.6% 100.0% 96.6% 95.5% 97.8%
85 Park Cube Kita Matsudo 109 2,358.66 98.3% 99.2% 98.3% 97.5% 98.3% 100.0% 99.2% 100.0% 100.0% 94.1% 94.1% 97.5%
87 Park Cube Musashi Kosugi 136 3,057.36 96.3% 97.0% 97.8% 97.8% 98.5% 97.8% 94.8% 96.2% 94.0% 96.3% 96.3% 100.0%
102 Park Axis Yokohama Tanmachi Koen 63 1,682.46 97.1% 97.1% 100.0% 97.1% 97.1% 100.0% 100.0% 100.0% 97.1% 97.1% 96.6% 98.6%
109 Park Axis Yokohama Yamashitacho 71 2,325.92 100.0% 98.9% 98.9% 96.7% 93.3% 96.7% 100.0% 96.7% 96.7% 95.2% 96.7% 100.0%
757 22,876.13 97.4% 98.0% 96.2% 95.1% 95.7% 98.3% 97.8% 96.9% 97.1% 95.3% 96.0% 97.1%
27 Park Axis Meieki Minami 169 5,565.13 94.7% 95.1% 94.4% 96.1% 97.6% 97.8% 96.8% 97.2% 95.9% 96.1% 95.3% 95.7%
35 Park Axis Marunouchi 99 3,821.75 93.4% 92.8% 94.8% 97.4% 92.5% 97.4% 93.5% 92.9% 93.5% 92.9% 92.7% 95.3%
36 Park Axis Ropponmatsu 112 3,473.67 96.3% 99.0% 97.1% 97.1% 98.0% 100.0% 100.0% 100.0% 98.9% 97.0% 96.6% 98.2%
37 Park Axis Hakataeki Minami 177 4,668.29 98.1% 98.9% 96.9% 96.5% 96.4% 99.0% 100.0% 98.8% 98.8% 98.8% 98.2% 98.8%
45 Park Axis Naka Gofukumachi 112 2,707.88 98.2% 98.2% 98.2% 96.4% 97.3% 100.0% 99.1% 99.1% 96.4% 95.5% 95.5% 100.0%
49 Park Axis Shirakabe 86 4,735.89 93.3% 91.0% 89.6% 91.0% 92.4% 97.6% 95.2% 92.7% 92.7% 93.6% 90.9% 93.6%
50 Park Axis Sendai 204 8,843.17 99.6% 97.5% 98.1% 96.3% 96.9% 97.4% 100.0% 96.9% 96.3% 96.1% 95.7% 98.6%
56 Park Axis Hakata Minoshima 112 3,461.85 100.0% 100.0% 98.3% 99.1% 98.5% 99.3% 100.0% 97.1% 95.9% 97.3% 98.2% 98.2%
57 Park Axis Takamiya Higashi 70 2,289.21 95.4% 98.6% 95.4% 94.4% 95.4% 100.0% 98.4% 94.2% 92.7% 94.2% 96.9% 98.5%
58 Park Axis Sapporo Shokubutsuen Mae 146 7,845.01 98.5% 97.9% 95.9% 95.9% 97.3% 97.3% 93.5% 92.8% 94.2% 94.2% 97.2% 99.2%
65 Park Axis Shin Sapporo 85 3,729.05 97.5% 96.6% 94.2% 94.2% 95.5% 93.6% 92.0% 92.0% 95.0% 95.0% 95.0% 97.9%
73 Park Axis Utsubo Koen 133 4,952.45 95.3% 95.9% 97.5% 95.8% 99.0% 100.0% 96.2% 97.4% 98.1% 95.9% 96.6% 96.6%
107 Park Cube Kitahama 138 4,683.33 97.7% 98.4% 98.1% 97.3% 99.4% 98.8% 98.5% 97.7% 97.5% 96.1% 95.6% 97.4%
127 Park Axis Kanayama WEST 63 4,795.13 93.5% 94.0% 92.5% 95.1% 95.1% 100.0% 96.6% 96.5% 96.5% 93.1% 94.7% 93.4%
1,706 65,571.81 96.7% 96.6% 95.8% 95.9% 96.6% 98.3% 97.0% 96.0% 95.9% 95.4% 95.7% 97.2%
10,933 470,031.94 96.0% 96.2% 96.3% 95.9% 96.6% 98.1% 98.1% 97.7% 97.4% 97.4% 97.1% 97.3%
76 Dormy Ashiya 140 3,729.45 100.0% 100.0% 100.0% 100.0% 100.0% 100.0% 100.0% 100.0% 100.0% 100.0% 100.0% 100.0%
77 Dormy Kyoto Nijyo 134 3,492.88 100.0% 100.0% 100.0% 100.0% 100.0% 100.0% 100.0% 100.0% 100.0% 100.0% 100.0% 100.0%
78 Sundai Horikaw a Ryo 113 2,793.71 100.0% 100.0% 100.0% 100.0% 100.0% 100.0% 100.0% 100.0% 100.0% 100.0% 100.0% 100.0%
Other Major Cities Total
Rental Apartments Total
28th Period
Occupancy Rate
Greater Tokyo Total
No. Property Name Rentable Units(Units)
RentableArea (㎡)
29th Period
Occupancy Rates (4/5)

48
2020 2020 2020 2020 2020 2020 2020 2020 2019 2019 2019 2019Aug 31 Jul 31 Jun 30 May 31 Apr 30 Mar 31 Feb 29 Jan 31 Dec 31 Nov 30 Oct 31 Sep 30
79 Dormy Rakuhoku 70 1,489.86 100.0% 100.0% 100.0% 100.0% 100.0% 100.0% 100.0% 100.0% 100.0% 100.0% 100.0% 100.0%
80 Rikky o Univ ersity International Dormitory (RUID) Shiki 127 3,061.89 100.0% 100.0% 100.0% 100.0% 100.0% 100.0% 100.0% 100.0% 100.0% 100.0% 100.0% 100.0%
81 Dormy Naka Itabashi 106 2,439.17 100.0% 100.0% 100.0% 100.0% 100.0% 100.0% 100.0% 100.0% 100.0% 100.0% 100.0% 100.0%
82 Philosophia Nishidai 121 2,969.25 100.0% 100.0% 100.0% 100.0% 100.0% 100.0% 100.0% 100.0% 100.0% 100.0% 100.0% 100.0%
83 Dormy Musashi Kosugi 112 3,017.34 100.0% 100.0% 100.0% 100.0% 100.0% 100.0% 100.0% 100.0% 100.0% 100.0% 100.0% 100.0%
89 Artis Sendai Kakyoin 60 2,234.24 100.0% 100.0% 100.0% 100.0% 100.0% 100.0% 100.0% 100.0% 100.0% 100.0% 100.0% 100.0%
90 Artis Sendai Kimachi Dori 142 4,864.04 100.0% 100.0% 100.0% 100.0% 100.0% 100.0% 100.0% 100.0% 100.0% 100.0% 100.0% 100.0%
118 Medical Home Granda Sangen Jaya (Land with leasehold interest) - - - - - - - - - - - - - -
119 Dormy Nishi Ogikubo 71 1,616.52 100.0% 100.0% 100.0% 100.0% 100.0% 100.0% 100.0% 100.0% 100.0% 100.0% 100.0% 100.0%
123 Granda Kanazaw a Hakkei 58 1,826.29 100.0% 100.0% 100.0% 100.0% 100.0% 100.0% 100.0% 100.0% 100.0% 100.0% 100.0% 100.0%
124 Dormy Kamisugi 124 3,151.56 100.0% 100.0% 100.0% 100.0% 100.0% 100.0% 100.0% 100.0% 100.0% 100.0% 100.0% 100.0%
128 Dormy Odaw ara 78 2,452.14 100.0% 100.0% 100.0% 100.0% 100.0% 100.0% 100.0% 100.0% 100.0% 100.0% 100.0% 100.0%
131 Chisun Hotel Hiroshima 170 4,275.59 100.0% 100.0% 100.0% 100.0% 100.0% 100.0% 100.0% 100.0% 100.0% 100.0% 100.0% 100.0%
1,626 43,413.93 100.0% 100.0% 100.0% 100.0% 100.0% 100.0% 100.0% 100.0% 100.0% 100.0% 100.0% 100.0%
12,559 513,445.87 96.3% 96.5% 96.6% 96.2% 96.9% 98.2% 98.3% 97.9% 97.6% 97.6% 97.4% 97.6%Grand Total
Hospitality Facilities Total
28th Period
Occupancy Rate
No. Property Name Rentable Units(Units)
RentableArea (㎡)
29th Period
Occupancy Rates (5/5)
• Occupancy rate for rental apartments is calculated based on the floor area in the lease contract signed between the master lease company or the trust bank and tenants. Figures for Shibaura Island Air Tower are calculated by multiplying the total floor area by NAFʼs 31% ownership.Figures for Park Axis Akatsuka are calculated by multiplying the total floor area by NAFʼs 55% ownership. Figures for Park Cube Oimachi Residence are calculated by multiplying the total floor area by NAFʼs 70% ownership. Occupancy rate for hospitality facilities is calculated based on the floor area in the lease contract signed between NAF and the operator.

49
2,761 3,038 3,735
4,256 4,256 4,256
6,214 6,464 6,464
8,727 9,136 9,286 9,514
10,521 10,690 11,300 11,300 11,563 11,563 11,734 11,714 11,981 11,981 12,052 12,186 12,351 12,351 12,559
97.1%
95.4%
96.8%
94.3%
95.6%
94.5%
95.4%
95.6%
95.8%
95.7%
95.9%
95.9%
96.1%
95.7%
96.3%
95.7%
96.1%
95.9%
96.4%
96.4%
96.8%
96.7%
97.6%
97.3%
97.7%
97.7%
97.7%
96.8%
85%
86%
87%
88%
89%
90%
91%
92%
93%
94%
95%
96%
97%
98%
99%
100%
* Average month-end occupancy rate is for the overall portfolio, including hospitality facilities.1. The figure for average month-end occupancy rate during the 2nd Period in the graph and table above is for the post-IPO period from August 31, 2006, to February 28, 2007.
Average month-end occupancy rate Total Rentable Units
Historical Occupancy Rates Since IPO
2nd1 3rd 4th 5th 6th 7th 8th 9th 10th 11th 12th 13th 14th 15th 16th 17th 18th 19th 20th 21st 22nd 23rd 24th 25th 26th 27th 28th 29th(Feb. 07) (Aug. 07) (Feb. 08) (Aug. 08) (Feb. 09) (Aug. 09) (Feb. 10) (Aug. 10) (Feb. 11) (Aug. 11) (Feb. 12) (Aug. 12) (Feb. 13) (Aug. 13) (Feb. 14) (Aug. 14) (Feb. 15) (Aug. 15) (Feb. 16) (Aug. 16) (Feb. 17) (Aug. 17) (Feb. 18) (Aug. 18) (Feb. 19) (Aug. 19) (Feb. 20) (Aug. 20)

50
85%
90%
95%
100%
9⽉ 10⽉ 11⽉ 12⽉ 1⽉ 2⽉ 3⽉ 4⽉ 5⽉ 6⽉ 7⽉ 8⽉ 9⽉ 10⽉ 11⽉ 12⽉ 1⽉ 2⽉ 3⽉ 4⽉ 5⽉ 6⽉ 7⽉ 8⽉
2018年 2019年 2020年
Occupancy Rates by Area
* The figures above are calculations for rental apartments owned at the end of each month, excluding hospitality facilities.
Month-end occupancy rate
Tokyo 23 WardsGreater TokyoOther Major Cities
Tokyo 23 Wards88.4%
Greater Tokyo4.1%
Other Major Cities7.5%
Comparison by Area(As of August 31, 2020; acquisition price basis)
Sep. Oct. Nov. Dec. Jan. Feb. Mar. Apr. May Jun. Jul. Aug. Sep. Oct. Nov. Dec. Jan. Feb. Mar. Apr. May Jun. Jul. Aug.
2018 2019 2020
Tokyo 23 Wards 97.7% 97.6% 98.1% 97.9% 98.0% 98.4% 98.3% 97.4% 97.2% 97.6% 97.5% 97.6% 97.4% 97.4% 97.8% 97.7% 98.1% 98.3% 98.0% 96.6% 95.9% 96.3% 96.1% 95.8%Greater Tokyo 95.2% 95.0% 95.4% 95.2% 96.5% 96.3% 98.3% 98.0% 97.1% 97.9% 98.0% 97.0% 97.1% 96.0% 95.3% 97.1% 96.9% 97.8% 98.3% 95.7% 95.1% 96.2% 98.0% 97.4%Other Major Cities 96.4% 95.6% 95.3% 95.2% 95.6% 96.2% 97.9% 97.2% 96.7% 96.3% 96.6% 96.9% 97.2% 95.7% 95.4% 95.9% 96.0% 97.0% 98.3% 96.6% 95.9% 95.8% 96.6% 96.7%

51
85%
90%
95%
100%
9⽉ 10⽉ 11⽉ 12⽉ 1⽉ 2⽉ 3⽉ 4⽉ 5⽉ 6⽉ 7⽉ 8⽉ 9⽉ 10⽉ 11⽉ 12⽉ 1⽉ 2⽉ 3⽉ 4⽉ 5⽉ 6⽉ 7⽉ 8⽉
2018年 2019年 2020年
Occupancy Rates by CategoryMonth-end occupancy rate
* The figures above are calculations for rental apartments owned at the end of each month, excluding retail units and hospitality facilities.
CompactFamilyLarge
Single
カテゴリー別⽐率(第27期末時点・⼾数ベース)
Single41.3%
Compact41.5%
Family12.8%
Large4.4%
Sep. Oct. Nov. Dec. Jan. Feb. Mar. Apr. May Jun. Jul. Aug. Sep. Oct. Nov. Dec. Jan. Feb. Mar. Apr. May Jun. Jul. Aug.
2018 2019 2020
Single 96.8% 96.2% 96.5% 96.1% 96.8% 97.2% 98.1% 97.5% 96.8% 97.7% 97.3% 97.4% 97.7% 97.3% 97.2% 97.2% 97.7% 98.1% 98.3% 96.9% 95.8% 96.2% 96.4% 96.0%Compact 97.7% 97.3% 97.7% 97.5% 97.8% 98.3% 98.4% 97.1% 97.4% 97.4% 97.5% 97.8% 97.8% 97.5% 97.5% 97.4% 97.9% 98.5% 98.6% 96.6% 95.8% 96.2% 96.3% 95.8%Family 97.2% 97.7% 98.1% 98.0% 97.7% 98.2% 98.4% 97.5% 97.2% 97.7% 97.4% 97.0% 96.7% 96.4% 97.5% 97.6% 97.9% 98.0% 98.2% 96.8% 96.7% 96.6% 96.6% 96.8%Large 97.2% 97.6% 97.5% 98.0% 97.8% 97.5% 97.3% 97.2% 96.0% 95.7% 96.2% 96.1% 95.3% 96.5% 97.0% 97.2% 96.3% 96.4% 94.8% 94.8% 94.2% 95.5% 94.3% 94.1%
Comparison by Category(As of August 31, 2020; acquisition price basis)

Appendix(2)
Business Environment

53
Trends in Apartment Rents
Apartment Rent Index in Tokyo 23 Wards
Rent Fluctuation: Apartments / Offices
100.098.8 96.2 95.1 95.0 97.9
100.9 102.2 103.2 104.2106.6
111.1115.0
114.3
80.0
90.0
100.0
110.0
120.0
Q1 Q2 Q3 Q4 Q1 Q2 Q3 Q4 Q1 Q2 Q3 Q4 Q1 Q2 Q3 Q4 Q1 Q2 Q3 Q4 Q1 Q2 Q3 Q4 Q1 Q2 Q3 Q4 Q1 Q2 Q3 Q4 Q1 Q2 Q3 Q4 Q1 Q2 Q3 Q4 Q1 Q2 Q3 Q4 Q1 Q22009 2010 2011 2012 2013 2014 2015 2016 2017 2018 2019 2020
Apartment rent index (Tokyo 23 wards)
Index: 2009 Q1 = 100
Source: At Home Co., Ltd. and Sumitomo Mitsui Trust Research Institute Co., Ltd. *Prepared by Mitsui Fudosan Accommodations Fund Management based on the Apartment Rent Index (general: 18 m2-100 m2)
100.0 100.2 100.5 100.4
98.4
96.9 96.6 96.3 96.3 96.4
96.7 97.1 97.4 97.6 97.9
80.0
90.0
100.0
110.0
120.0
130.0
140.0
2005 2006 2007 2008 2009 2010 2011 2012 2013 2014 2015 2016 2017 2018 2019
Index: 2005=100
Office rent index (Tokyo metropolitan area) Apartment rent index (Tokyo metropolitan area)
Source: Japan Real Estate Institute*Prepared by Mitsui Fudosan Accommodations Fund Management based on the National Office and Apartment Rent Index

54
39,08443,371
26,512
31,880
21,71817,054 17,994
23,70720,863
24,53220,582
25,382 25,825
28,14228,433
0
10,000
20,000
30,000
40,000
50,000
2005 2006 2007 2008 2009 2010 2011 2012 2013 2014 2015 2016 2017 2018 2019
69,958 76,786 77,267 67,842
37,391 33,098 35,435 49,655
61,281 63,976 68,917 58,207 61,158
65,853 70,461
-90,000
-60,000
-30,000
0
30,000
60,000
90,000
-400,000
-300,000
-200,000
-100,000
0
100,000
200,000
300,000
400,000
2005 2006 2007 2008 2009 2010 2011 2012 2013 2014 2015 2016 2017 2018 2019
In-migration (Left axis) Out-migration (Left axis) Net in-migration (Right axis)
Supply and Demand of Rental Apartments - Tokyo 23 Wards
Source: Ministry of Internal Affairs and Communications
(No. of people) (No. of people)
Net in-migration of more than 890,000 people over the past 14 years
Source: Ministry of Land, Infrastructure, Transport and Tourism (SRC and RC)
(Units)
Construction-Starts for Rental Apartments in Tokyo 23 Wards
Population Change in Tokyo 23 Wards
The same level as the average of the past 14 years
2020 monthlynet in-migration
cumulative(January to August)
41,117 people
Year-on-year change
-21,660 people
Number of construction-starts continues to be lower than the peak.

55
3,165 3,290 3,367 3,406 3,412 3,374
1,1391,188 1,220 1,244 1,261 1,271
1,5681,606 1,611 1,593 1,557 1,517
506549 580 597 605 603314289
275 268 261 2556,6916,922
7,054 7,107 7,097 7,019
0
1,000
2,000
3,000
4,000
5,000
6,000
7,000
8,000
2015 2020 2025 2030 2035 2040
Tokyoʼs population and number of households are increasing
Source: Ministry of Internal Affairs and Communications, National Institute of Population and Social Security Research
127.77 128.06 127.10 125.33 122.54119.13
115.22110.92
12.58 13.16 13.52 13.73 13.85 13.88 13.85 13.76
8.49 8.95 9.27 9.49 9.63 9.72 9.77 9.76
0
500
1,000
1,500
2,000
2,500
3,000
3,500
4,000
0
2,000
4,000
6,000
8,000
10,000
12,000
14,000
16,000
2005 2010 2015 2020 2025 2030 2035 2040
Japan (Left Axis) Tokyo (Right Axis) Tokyo 23 Wards (Right Axis)
(Million people) (Million people) (Thousand households)
Source: National Institute of Population and Social Security Research
Tokyo: Trends in Population and Number of Households
■ Population Projections for Japan, Tokyo, and Tokyo 23 Wards ■ Household Projections for Tokyo by Type of Household
■ One-person households■ Couple-and-child(ren) households■ Other households
■ Couple-only households■ One-parent-and-child(ren) households
40
35
30
25
20
15
10
5
0
160
140
120
100
80
60
40
20
0

56
-1,465 -391
-107
1,170
6,633
9,284
4,772
2,280 1,230
966
1,724 2,349
1,192
-10,000-8,000-6,000-4,000-2,00002,0004,0006,0008,00010,00012,00014,000
-100,000-80,000-60,000-40,000-20,000
020,00040,00060,00080,000
100,000120,000140,000
6,178 5,140
4,069
-256
1,679
3,998 5,229
5,280
7,276 5,950
4,874 4,441
6,753
-10,000-8,000-6,000-4,000-2,00002,0004,0006,0008,00010,00012,00014,000
-100,000-80,000-60,000-40,000-20,000
020,00040,00060,00080,000
100,000120,000140,000
6,627
7,064
7,073
5,820
8,777
7,742
8,729
7,162
11,662
9,474
10,691
13,796
16,000
-10,000-8,000-6,000-4,000-2,00002,0004,0006,0008,00010,00012,00014,00016,00018,000
-100,000-80,000-60,000-40,000-20,000
020,00040,00060,00080,000
100,000120,000140,000160,000180,000
6,573
4,895 4,985
5,389
11,129
9,221
8,186 7,458
8,880
8,471
8,678
8,032
10,165
-10,000-8,000-6,000-4,000-2,00002,0004,0006,0008,00010,00012,00014,000
-100,000-80,000-60,000-40,000-20,000
020,00040,00060,00080,000
100,000120,000140,000
4,335
2,971
5,493
5,288
10,254
9,108
10,088
8,363
8,173
9,137
8,779 7,930
9,386
-10,000-8,000-6,000-4,000-2,00002,0004,0006,0008,00010,00012,00014,000
-100,000-80,000-60,000-40,000-20,000
020,00040,00060,00080,000
100,000120,000140,000
Demand for Rental Apartments - Other Major Cities
Population Change
Source︓Ministry of Internal Affairs and Communications
(No. of people) (No. of people)(No. of people) (No. of people)
(No. of people) (No. of people)
Sapporo Sendai
Nagoya Osaka Fukuoka(No. of people) (No. of people) (No. of people) (No. of people)
Out-migration (Left axis)
In-migration (Left axis)
Net in-migration (Right axis)

57
8,994 8,348
3,356 3,975
5,618 6,106
7,267
6,848 6,930
7,495 7,172
6,844 5,604
0
2,000
4,000
6,000
8,000
10,000
12,000
14,000
16,000
18,000
20,000
4,097
1,501 1,131
967 510
1,247 2,076
2,939
916 1,363
1,424 1,527
1,855
0
2,000
4,000
6,000
8,000
10,000
12,000
14,000
16,000
18,000
20,000
12,745
10,494
4,043 4,595
6,583
8,348 9,756
10,382 9,932
10,378
11,463
11,018
8,763
0
2,000
4,000
6,000
8,000
10,000
12,000
14,000
16,000
18,000
20,000
10,180
6,857 6,455
4,337 4,163
3,159
5,247 5,092
4,963
5,722 6,575
6,824 6,487
0
2,000
4,000
6,000
8,000
10,000
12,000
14,000
16,000
18,000
20,000
7,921
6,146 3,770
6,188 6,843
9,008 7,990
7,554 8,274
10,045
10,248
9,762
7,851
0
2,000
4,000
6,000
8,000
10,000
12,000
14,000
16,000
18,000
20,000
Supply of Rental Apartments - Other Major Cities Construction-Starts for Rental Apartments
Source︓Ministry of Land, Infrastructure, Transport and Tourism (SRC and RC)
Sapporo Sendai
Nagoya Osaka Fukuoka(Units) (Units) (Units)
(Units) (Units)

Appendix(3)
Financial Details

5959
Interest-Bearing DebtBalance
Lender (JPY mn)Sumitomo Mitsui Trust Bank, Limited 1,000 0.09909% 2020.08.31 2020.11.30 3 monthThe 77 Bank, Ltd. 1,000 0.08000% *3 2019.11.29 2020.11.30 12 monthMizuho Bank, Ltd. 1,000 0.09409% *4 2019.11.29 2020.11.30 12 month
Total short-term loans 3,0003,000 0.65750% 2014.05.28 2021.05.28 7.0 years2,000 0.51375% 2014.11.28 2021.11.30 7.0 years1,500 0.18500% *3 2016.07.29 2029.07.31 13.0 years2,000 0.19950% 2018.08.13 2022.08.15 4.0 years2,000 0.20700% 2018.09.28 2022.09.30 4.0 years2,000 0.16000% 2019.05.31 2023.05.31 4.0 years4,500 0.18000% 2020.02.28 2024.02.29 4.0 years1,000 0.26000% 2020.02.28 2026.02.27 6.0 years2,000 0.44625% 2014.09.30 2020.09.30 6.0 years1,500 0.10000% *3 2017.08.14 2023.08.31 6.0 years1,000 0.14000% *3 2017.08.14 2027.08.31 10.0 years2,000 0.93375% 2013.11.29 2022.11.30 9.0 years3,000 0.98750% 2014.05.30 2024.05.31 10.0 years1,000 0.51375% 2014.11.28 2021.11.30 7.0 years3,000 1.05400% 2013.04.11 2023.04.11 10.0 years2,500 1.32900% 2013.08.06 2024.02.06 10.5 years2,500 1.39800% 2013.08.06 2024.08.06 11.0 years2,500 1.17750% 2014.04.01 2025.04.01 11.0 years2,000 0.18248% 2016.06.30 2027.12.30 11.5 years4,000 0.54779% 2017.10.18 2029.04.18 11.5 years3,000 0.64293% 2019.04.19 2030.10.21 11.5 years1,000 0.63900% 2014.04.11 2021.04.09 7.0 years1,000 0.23550% 2017.09.14 2024.09.17 7.0 years1,500 0.29000% 2019.05.31 2026.05.29 7.0 years2,000 0.82500% 2013.11.29 2021.11.30 8.0 years1,000 0.11988% 2017.08.31 2021.02.26 3.5 years1,000 0.18561% 2017.11.30 2022.05.31 4.5 years1,000 0.21561% 2017.11.30 2023.05.31 5.5 years2,000 0.42456% 2018.09.28 2027.03.31 8.5 years1,000 0.48000% 2020.08.31 2030.08.30 10.0 years2,000 0.55000% 2015.07.31 2023.07.31 8.0 years2,000 0.21880% 2016.05.31 2026.05.29 10.0 years1,000 0.22000% 2019.05.31 2024.11.29 5.5 years1,000 0.24000% 2020.07.01 2026.01.05 5.5 years1,000 1.22500% 2013.07.19 2023.01.19 9.5 years1,000 0.65750% 2014.05.28 2021.05.28 7.0 years1,000 0.99250% 2014.05.28 2024.05.28 10.0 years2,000 0.38880% 2017.01.31 2027.01.29 10.0 years3,000 0.30950% 2017.07.31 2025.07.31 8.0 years2,000 0.12930% 2019.01.31 2025.01.31 6.0 years2,000 0.26930% 2019.01.31 2028.01.31 9.0 years3,000 0.38178% 2019.06.28 2028.12.29 9.5 years2,000 0.43500% 2017.02.20 2027.02.26 10.0 years2,000 0.33500% 2018.04.27 2026.04.30 8.0 years1,000 0.65000% 2020.01.08 2032.01.08 12.0 years1,000 0.45000% 2020.04.28 2029.10.31 9.5 years1,500 0.68000% 2020.04.28 2032.04.30 12.0 years
Interest rate Issue date of loans Date of maturity Loan periodRepayment
methodUse offunds Notes
Short-termloans
BulletPayment
*1Unsecured Unguaranteed
Pari Passu*2
Sumitomo Mitsui Banking Corporation
Shinsei Bank, Limited
Shinkin Central Bank
Sumitomo Mitsui Trust Bank, Limited
NIPPON LIFE INSURANCE COMPANY
Mizuho Bank, Ltd.
The Chugoku Bank, Limited
The Bank of Fukuoka, Ltd.
Long-termloans
Development Bank of Japan Inc.
The Hachijuni Bank, Ltd. BulletPayment
*1Unsecured Unguaranteed
Pari Passu*2

60
2,000 0.72750% 2013.03.15 2020.09.15 7.5 years1,000 0.96250% 2013.08.23 2021.08.23 8.0 years3,000 0.79375% 2014.03.07 2022.03.07 8.0 years3,000 0.85500% 2014.03.07 2022.09.07 8.5 years3,000 0.76500% 2014.05.30 2022.05.31 8.0 years2,000 0.53250% 2014.10.01 2021.10.01 7.0 years3,000 0.62125% 2014.10.01 2022.10.03 8.0 years3,000 0.54500% 2017.04.25 2029.04.27 12.0 years2,000 0.48000% 2020.03.16 2030.03.15 10.0 years3,000 0.69500% 2013.11.29 2020.11.30 7.0 years2,000 0.43250% 2014.12.30 2021.12.30 7.0 years1,000 0.27000% 2019.06.14 2025.12.30 6.6 years2,000 0.37000% 2019.10.31 2028.04.28 8.5 years2,000 0.32000% 2020.07.01 2027.07.01 7.0 years1,000 1.04000% 2013.06.14 2021.06.14 8.0 years1,000 1.15750% 2013.06.14 2022.06.14 9.0 years1,000 1.02438% 2013.08.23 2022.02.23 8.5 years1,000 1.08625% 2013.08.23 2022.08.23 9.0 years1,500 0.38380% 2018.03.29 2028.03.29 10.0 years1,000 0.42000% 2019.08.30 2029.02.28 9.5 years1,000 1.26000% 2013.06.14 2023.06.14 10.0 years1,000 1.28125% 2013.07.19 2023.07.19 10.0 years1,000 0.98750% 2014.05.30 2024.05.31 10.0 years1,000 0.55500% 2017.04.27 2029.04.27 12.0 years1,000 0.40062% 2014.12.30 2021.06.30 6.5 years1,000 0.09000% 2016.07.29 2021.07.30 5.0 years
TAIJU LIFE INSURANCE COMPANY LIMITED 1,000 1.04375% 2014.03.28 2024.03.28 10.0 yearsThe Ashikaga Bank, Ltd. 2,000 0.27000% 2019.06.28 2025.12.30 6.5 yearsDAIDO LIFE INSURANCE COMPANY 1,000 0.57875% 2014.06.30 2021.06.30 7.0 yearsTAIYO LIFE INSURANCE COMPANY 2,000 0.64750% 2014.12.30 2024.12.30 10.0 yearsThe Iyo Bank, Ltd. 1,000 0.09000% 2016.09.30 2022.03.31 5.5 years
1,000 0.31630% 2018.06.29 2026.06.30 8.0 years1,000 0.45000% 2019.12.16 2029.12.17 10.0 years1,000 0.65000% 2019.12.16 2031.12.16 12.0 years1,000 0.40500% 2018.06.29 2028.06.30 10.0 years1,000 0.48000% 2020.03.30 2030.03.29 10.0 years
The Chiba Bank, Ltd. 1,000 0.32250% 2018.09.03 2025.09.03 7.0 years1,000 0.66000% 2018.09.03 2030.09.03 12.0 years1,000 0.68000% 2019.04.26 2032.04.30 13.0 years1,000 0.48000% 2020.07.01 2030.07.01 10.0 years1,000 0.29000% 2019.10.31 2026.10.30 7.0 years1,000 0.32000% 2020.08.31 2027.08.31 7.0 years
Total long-term loans 150,500153,500
IssueInvestmentcorporation
bonds
3rd Unsecured Investment CorporationBonds
(green bonds)July 16,2020 0.260% July 16,2025
Investmentcorporation
bonds
4th Unsecured Investment CorporationBonds
(green bonds)July 16,2020 0.520% July 16,2030
BulletPayment
*1Unsecured Unguaranteed
Pari Passu*2
Mitsui Sumitomo Insurance Company, Limited
The Yamaguchi Bank, Ltd.
The Daishi Bank, Ltd.
The Yamanashi Chuo Bank, Ltd.
2,000
Issue date Total Amount(JPY mn)
Total Loans
Long-termloans
MUFG Bank, Ltd.
Mizuho Trust & Banking Co., Ltd.
Unsecured, unguaranteed with special pari passu conditionsamong specified investment corporation bonds2,000
Total investment corporation bonds 4,000
Total Interest-Bearing Debt 157,500
The Norinchukin Bank
The 77 Bank, Ltd.
SUMITOMO LIFE INSURANCE COMPANY
Notes
Unsecured, unguaranteed with special pari passu conditionsamong specified investment corporation bonds
Interest Rate Date ofredemption
* As of August 31, 2020* Long-term loans funded in the 29th Period are highlighted with orange. Long-term loans repaid in the 30th Period are highlighted with blue.*1. The proceeds of the above loans were applied to the purchase of property or real estate trust beneficiary interests and the refinancing of other loans and operational costs, etc.*2. The loans in the table above are ranked pari passu in accordance with specified clauses in the loan agreements between NAF and all of its lenders.*3. Interest rate applicable from August 31, 2020 to September 29, 2020. *4. Interest rate applicable from August 31, 2020 to November 29, 2020.

61
Historical Operating Performance
*1. Net operating income from property leasing does not include gain on sale of investment properties.*2. NOI Yield = Weighted average of actual NOI annualized / Acquisition price x 100*3. LTV (loan-to-value) ratio at the end of the period = Total interest-bearing debt / Total assets x 100*4. Appraisal LTV (loan-to-value) ratio at the end of the period = Total interest-bearing debt / (Total assets + Unrealized profit or loss) x 100*5. NAV (net asset value) per Unit = (Net assets – Total distribution + Unrealized profit or loss) / Units outstanding
20th Period 21st Period 22nd Period 23rd Period 24th Period 25th Period 26th Period 27th Period 28th Period 29th Period
Feb. 2016 Aug. 2016 Feb. 2017 Aug. 2017 Feb. 2018 Aug. 2018 Feb. 2019 Aug. 2019 Feb. 2020 Aug. 2020
Number of Operating Days Days 182 184 181 184 181 184 181 184 182 184
Total Revenues JPY mn 10,433 10,621 10,650 10,775 10,870 11,047 11,186 12,361 11,401 11,520Rental Revenues JPY mn 10,433 10,621 10,592 10,775 10,870 11,047 11,137 11,421 11,401 11,520Gain on Sale of Investment Properties JPY mn - - 58 - - - 48 939 - -
JPY mn 7,723 7,745 7,854 7,878 8,150 8,120 8,348 8,454 8,564 8,606NOI Yield*2 % 5.3 5.2 5.3 5.2 5.5 5.3 5.5 5.4 5.6 5.5Depreciation and Amortization JPY mn 2,073 2,066 2,056 2,060 2,042 2,018 2,007 2,020 1,998 1,999
JPY mn 5,649 5,679 5,797 5,817 6,108 6,102 6,340 6,433 6,566 6,606Operating Income JPY mn 4,531 4,567 4,717 4,675 4,955 4,935 5,185 6,084 5,307 5,332Income Before Income Taxes JPY mn 3,894 3,940 4,139 4,118 4,448 4,439 4,729 5,624 4,866 4,898Net Income JPY mn 3,893 3,939 4,138 4,117 4,447 4,438 4,728 5,623 4,865 4,897
Capital Expenditure JPY mn 240 175 231 215 269 245 465 346 600 296
Total Assets JPY mn 293,684 295,463 293,446 294,828 293,998 294,692 296,877 303,133 301,946 305,840Interest-Bearing Debt JPY mn 147,500 149,000 147,000 148,000 147,000 147,500 149,500 154,500 153,500 157,500LTV*3 % 50.2 50.4 50.1 50.2 50.0 50.1 50.4 51.0 50.8 51.5Appraisal LTV*4 % 44.3 44.2 43.3 42.3 41.5 40.9 40.2 39.8 38.4 38.6Total Net Assets JPY mn 139,567 139,612 139,812 139,845 140,176 140,167 140,457 141,378 141,181 141,213Total Distribution JPY mn 3,893 3,939 4,083 4,116 4,447 4,438 4,702 5,062 4,865 4,897
Units Outstanding Units 484,522 484,522 484,522 484,522 484,522 484,522 484,522 484,522 484,522 484,522Total Net Assets per Unit Yen 288,051 288,145 288,557 288,626 289,308 289,290 289,889 291,790 291,382 291,448Unitholders' Capital per Unit Yen 279,870 279,870 279,870 279,870 279,870 279,870 279,870 279,870 279,870 279,870
Distribution per Unit Yen 8,036 8,130 8,428 8,497 9,179 9,161 9,706 10,449 10,042 10,108NAV per Unit*5 Yen 361,312 366,419 375,353 394,502 404,599 415,422 435,488 455,926 483,264 491,968
Unit Market Price Yen 413,500 443,000 486,500 446,500 468,000 505,000 554,000 667,000 661,000 653,000
Book Value=(A) JPY mn 283,751 285,839 282,842 285,338 283,613 283,628 285,482 287,761 286,443 291,495Appraisal Value=(B) JPY mn 323,142 327,704 328,981 340,755 343,922 349,181 360,731 372,352 384,280 393,549Unrealized Profit / Loss=(B)-(A) JPY mn 39,390 41,864 46,138 55,416 60,308 65,552 75,248 84,590 97,836 102,053
Number of Investment Properties # 116 119 118 121 121 122 124 126 126 128Total Acquisition Price JPY mn 294,918 298,718 297,435 301,559 301,559 303,259 306,342 309,723 309,723 316,208Total Rentable Units Units 11,563 11,734 11,714 11,981 11,981 12,052 12,186 12,351 12,351 12,559
Rental Apartments (including retail spaces) Units 10,438 10,538 10,518 10,603 10,603 10,674 10,730 10,725 10,725 10,933Hospitality Facilities Units 1,125 1,196 1,196 1,378 1,378 1,378 1,456 1,626 1,626 1,626
Total Rentable Area m2 483,834 488,533 487,439 495,096 495,096 497,027 504,197 508,052 508,052 513,446% 96.4 96.4 96.8 96.7 97.6 97.3 97.7 97.7 97.7 96.8Average Month-End Occupancy Rate
unit
Net Operating Income from Property Leasing*1
Operating Income from Property Leasing

62
Total Assets 301,946 million yen 305,840 million yen +3,894 million yenCash and cash equivalents 12,741 million yen 11,574 million yen -1,167 million yenTotal investment properties 285,853 million yen 290,892 million yen +5,038 million yenOthers 3,351 million yen 3,374 million yen +23 million yen
Total Liabilities 160,765 million yen 164,627 million yen +3,862 million yenInterest-bearing debt 153,500 million yen 157,500 million yen +4,000 million yenTenant security deposits 3,699 million yen 3,682 million yen -16 million yenOthers 3,566 million yen 3,445 million yen -121 million yen
Total Net Assets 141,181 million yen 141,213 million yen +32 million yenUnitholdersʼ capital 135,603 million yen 135,603 million yen -Reserve for distribution 712 million yen 712 million yen -Retained earnings 4,865 million yen 4,897 million yen +32 million yen
11,401 million yen 11,520 million yen +118 million yen
Rental expenses 2,233 million yen 2,295 million yen +62 million yenReal estate taxes 603 million yen 618 million yen +14 million yenDepreciation and amortization 1,998 million yen 1,999 million yen +1 million yen
4,835 million yen 4,913 million yen +78 million yen
6,566 million yen 6,606 million yen +40 million yen
856 million yen 864 million yen +7 million yen402 million yen 410 million yen +7 million yen
5,307 million yen 5,332 million yen +24 million yen
-441 million yen -433 million yen +7 million yen
4,866 million yen 4,898 million yen +32 million yen
0 million yen 0 million yen +0 million yen
4,865 million yen 4,897 million yen +32 million yen
4,865 million yen 4,897 million yen +31 million yen
10,042 yen 10,108 yen +66 yen
Number of Units Outstanding 484,522 units 484,522 units -
Total Distribution
Distribution per Unit
Operating Income
Non-Operating Income and Expenses
Income Before Income Taxes
Current and Deferred Income Taxes
Net Income
Other Expenses
28th Period (Ended February 29, 2020) 29th Period (Ended August 31, 2020) Change
28th Period (Ended February 29, 2020) 29th Period (Ended August 31, 2020)
Asset Management Fees
Change
Total Revenues
Total Rental Expenses
Operating Income from Property Leasing
Balance Sheet and Income Statement
Balance Sheet
Income Statement

MEMO

Appendix(4)
Sustainability Initiatives

65Sector Leader (Asia, Residential)
Sustainability Initiatives (1)
Asset management operations focused on sustainability
■ Mitsui Fudosan Group's ESG Guidelines
https://www.mitsuifudosan.co.jp/corporate/esg_csr/
Mitsui Fudosan Co., Ltd., the parent company of MitsuiFudosan Accommodations Fund Management Co., Ltd.,the Asset Management Company, considers ESG amanagement priority and sets key goals for relevantinitiatives to consistently create value under the Groupstatement of “Bring affluence and comfort to urbanliving.”
■ Consistently Acquire External Certification of SustainabilityWe consistently acquire external certification including GRESB Real Estate Assessmentas opportunities to improve NAFʼs sustainability initiatives.
▶ GRESB Real Estate Assessment ▶ SMBC Environmental Assessment
Green Star
Assessment
Rating
3 Stars
AAssessment
Initiatives with good environmental consideration
Sustainability Policy■ In-House Structure for Promotion of Sustainability
Investment Committee
ChairpersonCEO
SustainabilityDecision Maker
Sustainability Promotion Office
Objectives andimplementation plans
Formulate plans
Decide
Status of progressand achievements
Report
Review
Share objectivesand plans
Implement
All officers and employees
Reduction of Environmental Load
Collaboration with Various Internal and External Stakeholders
Initiatives for Governance
Sustainability Promotion Office established to ensure effective sustainability policies
Structure for Promotion/External Certification

66
Sustainability Initiatives (2) Environment
Steadily reduce environmental load by systematically installing LED lighting
■ Installation of LED lighting in common areas
■ Environmental Performance
CO2 emissions from energy use Water consumption
(As of August 31, 2020)
■ External Certification of Investment Properties
Certification Details
4No. of properties
Total floor space
Percentage of floor space certified
181,579 ㎡
25.0 %
(As of August 31, 2020)
▶ Targets ▶ Results
Systematically installing LED lighting promotes energy-savingand reduction of CO2 emissions throughout our portfolio.
We strive to acquire DBJ Green Building certification to ensure the validityand objectivity of the results of our initiatives to reduce environmental impact.
Energy consumption, CO2 emissions from energy use
Water consumption
Average annual reduction of 1%over five years using 2015 as thebaseline (based on intensity)
No increase in amount used overfive years using 2015 as the baseline(based on intensity)
Okawabata Apartment Communities(Parking)
5,038 4,958 4,509 4,309 4,042
0.0249 0.0243 0.0220 0.0209 0.0195
0
0.02
0.04
0.06
0
2,000
4,000
6,000
2015 2016 2017 2018 2019
CO2 emissions Intensity( t ) ( t / m 2)
-21.6% reduction(annual average -5.4%)
24,273 23,836 23,811 24,056 22,816
0.1198 0.1169 0.1163 0.1169 0.1101
0
0.1
0.2
0.3
0
10,000
20,000
30,000
2015 2016 2017 2018 2019
Water consumption Intensity(m 3) (m 3/ m 2)
-8.1% reduction
(annual average -2.0%)
Installation completed
89 properties
In the 29th Period
5 properties
Property Name Certification rankOkawabata Apartment Communities
Park Axis Toyosu
Park Cube Nishigahara Stage
Park Cube Meguro Tower
CO2

67
Implementation of Periodic Medical Examinations, etc. Work-Life Balance Special Leave Program (maternity leave, caregiver leave and
time off for sick/injured childcare, etc.) Consultation Service Office for Compliance Promotion of Active Roles for Women Support for Childcare and Nursing Care
▶ Health and Safety, Respect for Human Rights
We maintain healthy workplaces that facilitate work so that all officers and employees can fully demonstrate their abilities.
Sustainability Initiatives (3) Social
Promote sustainability through collaborative initiatives with various stakeholders
■ Officers and Employees of the Asset Management Company ■ Tenants
■ Local Communities
The Asset Management Company recognizes that human resources are itsmost valuable assets and has implemented various initiatives for its employees.
Support for Acquisition of Qualifications Support for Education and Training Interviews for Setting Objectives of Individual Employees Performance Evaluations
We conduct various initiatives to improve safety, security, andcomfort in assets under management to enhance tenant satisfaction.
▶ Greater Satisfaction
As a member of local communities in which the assets we manage arelocated, we contribute to community formation and vitalization.
▶ Cooperation in Local Events
■ Supply ChainsWhen selecting/evaluating suppliers, which are important in NAF'sasset management, NAF keeps in mind the promotion ofsustainability throughout its supply chain by also confirmingsuppliersʼ initiatives in consideration of society, the environment, etc.
▶ Human Resource Development
The Company takes various measures to foster human resourceshaving a high level of expertise, deep knowledge, and ethical values.
Initiatives in collaboration with property management company (Mitsui Fudosan Residential Lease)
Toll-Free Helpline for Tenants Chatbot to Answer Inquiries
Renovation of Common Areas Tenant Satisfaction Surveys
Disaster prevention event (Demonstration of water discharge by fire department members)
Disaster prevention event(Disaster prevention drills for local residents)
At the Okawabata Apartment Communities, NAF has proactivelycooperated in activities of the management association andstrives to contribute to formation of a local community.

68
Sustainability Initiatives (4) Governance
Sustainability Promotion Office(Composed of personnel appointed by team general managers and general managers)
■ Basic Philosophy on Governance
▶ Thorough complianceThe Company has established an organizational structure that should securecompliance with laws and regulations and implement fair transactions at any time.At the same time, the Company works to ensure that its officers and employeeswill act based on high ethical values and win the trust of its stakeholders.
▶ Establishment of risk management structureThe Company has established a proper risk management structure toappropriately manage a variety of risks, to avoid or minimize risks inconducting asset management.
An organizational structure that ensures fair transactions
General Meeting of Unitholders
Board of Directors
Independent Auditor
KPMG AZSA LLC
Executive Directors: Takashi Ikeda, Tateyuki Ikura
Supervisory Directors: Tsunehisa Ota, Hiroaki Saito,
Mitsutoshi Masuda
■ Management Structure
REITManagementAgreement
Board of Directors
Auditor
Compliance Committee
CCO
Investment Committee
Investment,Research &
Strategy Team
Asset Management
Team
General Meeting of Stockholders
CIO CFO
Corporate Operation
Team
CEOSustainability
Decision Maker
Financial Team

69
Sustainability Initiatives (5) Governance
Note:When NAF acquires or sells of assets in transactions with related parties as defined by the Investment Trust and Investment Corporation Act of Japan, the Asset ManagementCompany must obtain consent from NAF based on the approval of NAFʼs Board of Directors prior to the deliberations of the Investment Committee. However, such consent is notrequired for property or other real estate acquisitions stipulated by Article 245-2-1 of the Investment Trust and Investment Corporation Act as having immaterial impact on NAFʼsassets because the acquisition cost represents less than 10 percent of the book value of NAFʼs investment properties.
Governance structure for avoiding conflicts of interest
Preliminary Plan
Approval of CCO
Proposal by CIO
Investment Committee
Report to Board of NAF
Approval of Compliance Committee
▶ Related-party transaction▶ When CCO determines that a
compliance issue has arisen
▶ Related-party transaction▶ When CCO determines that a
compliance issue has arisen
Compliance Checking System
Confirmation by Chief Compliance Officer (CCO)The following require approval of the Compliance Committee▶ Related-party transactions*
▶ When CCO determines that a compliance issue has arisen*Property acquisition price from sponsor-related parties is below
appraisal value
The Compliance CommitteeRequires approval by independent external professionalsMembers: CCO (Chairperson), CEO, 2 external professionals (Currently 1 lawyer and 1 CPA)External professionals: Appoint professionals independent from sponsor-related partiesResolution: Requires the votes of 2/3 or more members andat least 1 of the 2 independent external professionals
Functions as a Check on the Investment CommitteeCCO can suspend discussion when he sees any problem in the discussion process
(Note)
■ The Asset Management Companyʼs decision-making process flow for acquiring or selling investment assets
1
2
3
1
2
3
Appendix(5)
Others

71
Agreement on Provision of Real
Estate Information/Advisory Service
Structure of the REIT
REIT Management Agreement and General Administrative Service Agreement
Memorandum on Provision of Real Estate Brokerage
Information
Basic Agreement onProperty Management
General Administrative Service Agreement
(Accounting)
REITAsset Custodian
Sumitomo Mitsui Trust Bank, Limited
Asset CustodyAgreement
Nippon AccommodationsFund Inc.
(TSE 3226)
Real Estate InformationProvider
Mitsui Fudosan Realty Co., Ltd.
REIT Management Company
Mitsui Fudosan Accommodations Fund Management Co., Ltd.
Parent Company ofREIT Management CompanyMitsui Fudosan Co., Ltd.
Independent AuditorKPMG AZSA LLC
General Administrative Agent (Accounting)
RWA Accounting Holdings Co., Ltd.
General Administrative Agent (Tax Return Filing)
PwC Zeirishi-Hojin
PropertyManagement Company
Mitsui Fudosan Residential Lease Co., Ltd.
Real Estate Information/ Advisory Service
ProviderMitsui Fudosan
Residential Co., Ltd.
Transfer AgentSumitomo Mitsui
Trust Bank, Limited
Transfer Agency Service Agreement/
Agreement regarding Management of Special Accounts
Property Management Company
Mitsui Fudosan Residential Lease Co., Ltd.
Fiscal Administrative Service Agreement (Tax Return Filing)
Master Lease and Property Management Agreement
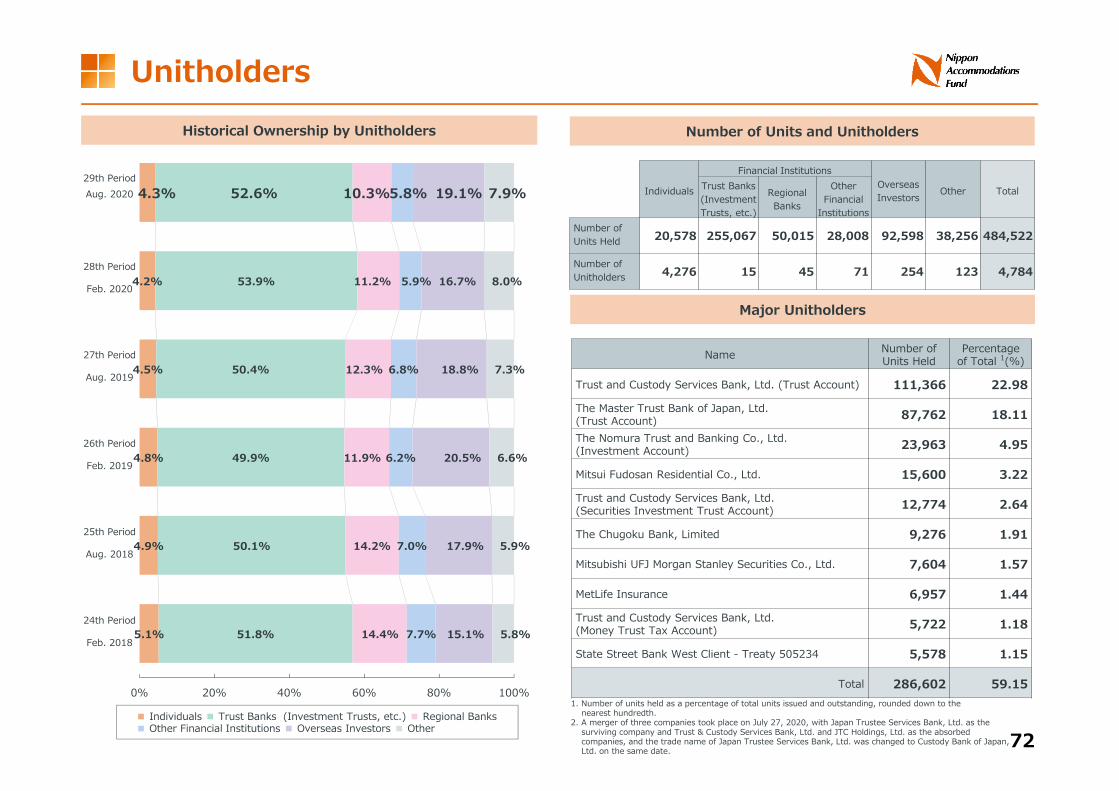
72
5.1%
4.9%
4.8%
4.5%
4.2%
4.3%
51.8%
50.1%
49.9%
50.4%
53.9%
52.6%
14.4%
14.2%
11.9%
12.3%
11.2%
10.3%
7.7%
7.0%
6.2%
6.8%
5.9%
5.8%
15.1%
17.9%
20.5%
18.8%
16.7%
19.1%
5.8%
5.9%
6.6%
7.3%
8.0%
7.9%
0% 20% 40% 60% 80% 100%
Unitholders
1. Number of units held as a percentage of total units issued and outstanding, rounded down to the nearest hundredth.
2. A merger of three companies took place on July 27, 2020, with Japan Trustee Services Bank, Ltd. as the surviving company and Trust & Custody Services Bank, Ltd. and JTC Holdings, Ltd. as the absorbedcompanies, and the trade name of Japan Trustee Services Bank, Ltd. was changed to Custody Bank of Japan, Ltd. on the same date.
■ Individuals ■ Trust Banks (Investment Trusts, etc.) ■ Regional Banks■ Other Financial Institutions ■ Overseas Investors ■ Other
Individuals
Financial InstitutionsOverseas Investors Other TotalTrust Banks
(Investment Trusts, etc.)
RegionalBanks
OtherFinancial
InstitutionsNumber ofUnits Held 20,578 255,067 50,015 28,008 92,598 38,256 484,522
Number ofUnitholders 4,276 15 45 71 254 123 4,784
Name Number ofUnits Held
Percentageof Total 1(%)
Trust and Custody Services Bank, Ltd. (Trust Account) 111,366 22.98
The Master Trust Bank of Japan, Ltd.(Trust Account) 87,762 18.11
The Nomura Trust and Banking Co., Ltd.(Investment Account) 23,963 4.95
Mitsui Fudosan Residential Co., Ltd. 15,600 3.22
Trust and Custody Services Bank, Ltd. (Securities Investment Trust Account) 12,774 2.64
The Chugoku Bank, Limited 9,276 1.91
Mitsubishi UFJ Morgan Stanley Securities Co., Ltd. 7,604 1.57
MetLife Insurance 6,957 1.44
Trust and Custody Services Bank, Ltd. (Money Trust Tax Account) 5,722 1.18
State Street Bank West Client - Treaty 505234 5,578 1.15
Total 286,602 59.15
29th PeriodAug. 2020
28th Period
Feb. 2020
27th Period
Aug. 2019
26th Period
Feb. 2019
25th Period
Aug. 2018
24th Period
Feb. 2018
Number of Units and UnitholdersHistorical Ownership by Unitholders
Major Unitholders

73
0
20
40
60
80
100
120
140
160
180
200
220
240
260
06/08 07/02 07/08 08/02 08/08 09/02 09/08 10/02 10/08 11/02 11/08 12/02 12/08 13/02 13/08 14/02 14/08 15/02 15/08 16/02 16/08 17/02 17/08 18/02 18/08 19/02 19/08 20/02 20/08
NAF Unit Price (Closing Price)
Tokyo Stock Exchange REIT Index (Closing Price)
Historical Unit Price since IPOIndex: Date of IPO (NAF: August 4, 2006) = 100
Source: Refinitiv (unit prices have been retroactively restated to reflect the two-for-one split of NAF investment units on the effective date of March 1, 2014.)* The Tokyo Stock Exchange calculates and presents the Tokyo Stock Exchange REIT Index, a market price index that adopts weighted average aggregation for all real estate investment
trusts listed on the Tokyo Stock Exchange.
Unit price on August 4, 2006
JPY 296,000
Unit price on May 24, 2007JPY 515,000
Unit price on March 13, 2009JPY 180,500
Unit price on August 31, 2020JPY 653,000
Unit price on February 21, 2020JPY 728,000
*


75
Disclaimer This document is intended for informational purposes only. The contents of this document do not
constitute an offer to sell or solicitation of an offer to buy or sell any security or other financialinstrument of Nippon Accommodations Fund Inc.
Factors including changes in the price or earning capacity of real estate under management orworsening of the financial condition of the issuing entity, may cause the trading price of real estateinvestment securities to drop, resulting in a loss for the investor. Investment decisions should bebased on your own judgment and responsibility. Please consult with a securities company regardingthe purchase of units or investment corporation bonds of Nippon Accommodations Fund Inc.
The information provided in this document does not constitute the disclosure or asset managementreports required under the Financial Instruments and Exchange Act or laws relevant to investmenttrusts or investment corporations.
Nippon Accommodations Fund Inc. has exercised due care in providing the information in thisdocument but does not guarantee its accuracy or completeness.
Information in this document contains future projections. Accordingly, actual results may differsubstantially from the performance, management results, financial details, or other mattersexpressed or implied by such future projections.
Nippon Accommodations Fund Inc. is not responsible for updating the information in this document.The information in this document may be changed without prior notice.
Duplication or use of information in this document for other purposes without the prior consent ofNippon Accommodations Fund Inc. is prohibited.
REIT Management Company: Mitsui Fudosan Accommodations Fund Management Co., Ltd.(Financial Instruments Firm, Kanto Finance Bureau (registration) No. 401 Member of the Investment Trusts Association, Japan)
Please note that this English translation of the Japanese original document is provided solely for information purposes. Contents of this documenthave been summarized or omitted from the Japanese document. In the event of any discrepancy between the Japanese original and this Englishtranslation, the Japanese original shall prevail.
The financial statements of Nippon Accommodations Fund Inc. have been prepared in accordance with generally accepted accounting principles inJapan (Japanese GAAP), which may differ materially in certain respects from generally accepted accounting principles in other jurisdictions.